DOI:10.32604/cmc.2021.014140
| Computers, Materials & Continua DOI:10.32604/cmc.2021.014140 | |
| Article |
Toward the Optimization of the Region-Based P300 Speller
1Department of Software Engineering, King Saud University, Riyadh, 11451, Saudi Arabia
2Department of Computer Science, King Saud University, Riyadh, 11451, Saudi Arabia
*Corresponding Author: A. Benabid Najjar. Email: abbenabid@ksu.edu.sa
Received: 01 September 2020; Accepted: 13 November 2020
Abstract: Technology has tremendously contributed to improving communication and facilitating daily activities. Brain-Computer Interface (BCI) study particularly emerged from the need to serve people with disabilities such as Amyotrophic Lateral Sclerosis (ALS). However, with the advancements in cost-effective electronics and computer interface equipment, the BCI study is flourishing, and the exploration of BCI applications for people without disabilities, to enhance normal functioning, is increasing. Particularly, the P300-based spellers are among the most promising applications of the BCI technology. In this context, the region-based paradigm for P300 BCI spellers was introduced in an effort to reduce the crowding effect and adjacency problem that might affect the detection of P300 peak. This study extends this line of research by investigating the effect, in terms of accuracy and usability, of the letters’ distribution among the speller’s regions. For this purpose, a clustering algorithm is proposed, and two region-based layouts were generated by redistributing the letters based on their dissimilarity or their similarity. A pilot usability evaluation was also conducted in order to assess the usability of the different layouts in terms of effectiveness, efficiency, and satisfaction. The results indicate that the distribution of the letters has an effect on the classification accuracy as well as the user experience. Particularly, when considering short-term accuracy and cognitive effort, the original region-based layout outperforms other layouts.
Keywords: Optimization; clustering; usability evaluation; BCI; region-based; P300 speller
Due to the belief that communication is among the most important aspect of human’s life, and for those that lack communication ability, brain–computer Interface (BCI) becomes an ideal solution for individuals with motor disabilities to have the capability to communicate and express themselves. The EEG method is the most widely used and can easily be adopted since its tools are relatively simple and affordable. Event-related potential (ERP) refers to any potential change that happens to the EEG signal caused by an event or a stimulus. Particularly, the P300 is the largest ERP component, which is a positive signal deflection triggered in brain waves after approximately 300 ms of an infrequent stimulus or a surprising event yet relevant to the task being handled. It is usually elicited using the oddball paradigm, where the subject is presented with some external stimulus in the form of a sequence of events, categorized into two classes such that one of them is rarely presented [1].
Many P300-based BCI systems have been proposed in the literature in various applications like Lie detector [2], smart homes [3], brain painting [4], gaming [5], and brain-controlled wheelchair [6]. The BCI speller, first introduced in 1988, is one among several BCI applications, followed with many enhancements, producing numerous types of BCI spellers. Particularly, the P300-based spellers are among the most promising applications of the BCI technology. Farwell et al. [7] introduced the P300-based BCI alphanumeric speller. The speller is a flashing paradigm where the rows and columns of the displayed matrix are intensified in a random order. The intersection of the target character will create a P300 event related potential (ERP) in electroencephalogram (EEG) brain signals, recognizing the desired letter. Then, several studies proposed to enhance the original Row-Column (RC) speller to increase its performance. A detailed review of P300 spellers is provided in [8].
Despite the research progress in this area, several challenging issues still need to be addressed, as discussed in [9,10], in order to properly detect the P300 peak. Some challenging problems are related to human perceptual phenomena, such as habituation [11], crowding effect [12], repetition blindness [13], and adjacency errors [14], which can be potential sources of error in P300 detection. In an effort to reduce the crowding effect and adjacency problem, the Region-Based (RB) paradigm was introduced by [15]. It defines a two-level speller, where the letters are distributed among seven regions; each region contains seven characters. In the first level, the regions flash and the user concentrates on the desired character. Subsequently, the region is selected, and then the characters associated to the chosen region flash alternatively until the desired character is identified. In [10,16], the studies demonstrated that the RB paradigm has better performance than other paradigms and can significantly reduce the near-target effect. Later, other studies also confirmed that the RB paradigm outperformed the RC paradigm in terms of accuracy [17], and when tested involving individuals with Amyotrophic Lateral Sclerosis (ALS) [18].
The distribution of letters in the RB paradigm, similar to other P300 spellers, is usually based on the alphabetical order of characters. Further to the conventional alphabetical order, Fazel-Rezai et al. [16] proposed to redistribute the letters in the RB paradigm based on the frequency of letters usage. This suggests that the letters distribution in the RB paradigm could be a promising research question to investigate. In this study, the hypothesis states that the distribution of letters among different regions and within a region can be reconsidered in a way that may reduce habituation, crowding effect, and repetition blindness, and then, would reduce the spelling error and increase the accuracy of the speller.
Furthermore, in real-life application of BCI systems, it is valuable to assess the stimulus paradigm based on user’s viewpoint. A high usability would lead to a sustainable assistive device that users might find helpful in real-life. This is even crucial for BCI applications since their performance does not rely only on the physical attributes of the system, but also on the user’s reaction to it. The usability of BCI systems is usually evaluated using questionnaires to collect user’s feedback and it is considered among the most important aspects of P300 BCI studies. Several studies, such as [19,20], have been conducted to evaluate the usability of different paradigms of BCI spellers. Particularly, the results in [10,16,21] favored the RB speller. Therefore, we extend this line of research by further investigating the effect of different letter distributions within the RB paradigm, and evaluating their usability in terms of effectiveness, efficiency, and satisfaction.
This study aims to redesign the P300 RB speller by redistributing the letters based on their similarities/dissimilarities, and then evaluating the usability of the different layouts. Next, Section 2 presents the related studies relevant to P300-based spellers; its paradigms in Section 2.1 and the evaluation methods in Section 2.2. Section 3 presents the approach and methodology followed in this study. Section 4 introduces the proposed clustering algorithm used to generate the distribution of letters among the different regions within the RB paradigm. Section 5 presents the usability evaluation framework and discusses the results of testing the generated layouts compared with the original RB layout. Finally, the conclusion and future study are presented in Section 6.
The BCI technology can ease the spelling task for individuals with severe motor disabilities by detecting their brain signals. Particularly, the P300-based BCI speller is mostly common, thanks to its high speed and accuracy, compared to other BCI techniques. This section covers the literature review of the well-known paradigms of P300-based BCI spellers in Section 2.1, and then some of the evaluation methods of P300 spellers in Section 2.2.
2.1 Paradigms of P300 Spellers
Two main paradigms can be considered; the matrix-based paradigm illustrated by Fig. 1a, the region-based paradigm shown in Fig. 1b, and their variants are presented in the following. Then, some challenging problems, due to human phenomena that might affect P300 detection, are discussed.

Figure 1: Different P300 based speller paradigms [9]. (a) A matrix-based speller; the RC speller proposed by [7]. (b) A region-based speller; the RB speller proposed by [9] showing both levels for spelling character “B”
In 1988, the Rows-Columns (RC) paradigm for P300 speller was introduced by Farewell et al. [7], and it has been widely used. It is based on the visual oddball paradigm [1]. In an oddball paradigm, a chain of events is presented such that these events can be classified into two classes; one of them is rarely presented evoking a positive peak, after 300 ms, caused by the infrequent event.
The character selection is achieved by repeatedly flashing rows and columns, as shown in Fig. 1a, while the user is focusing on the target character and silently counting the number of times that the desired character gets flashed until the P300 is elicited. After flashing each of the 6 rows and 6 columns, the desired character is identified as the intersection of the row and column that evoked the P300. Recently, Velasco-Álvarez et al. [22] proposed a P300 speller application based on the RC paradigm and the Rapid Serial Visual Presentation Paradigm. It was designed to be easily installed, configured, and used by patients due to its versatility and ease of use.
Then, the Single Character (SC) paradigm was introduced in [23]. In this paradigm, each character of the 36 characters is individually flashed in a random order. The results in [23] showed that the SC paradigm outperforms the RC paradigm in terms of the classification accuracy, and that most subjects who tested both spellers preferred the SC since it caused less fatigue.
Another matrix-based alternative, the Check Board (CB) paradigm [24] was designed as an  matrix, such that adjacent letters could not be simultaneously flashed, by separating them in different flash groups. In fact, the characters are flashed in sequential order: first, all rows of the white matrix followed by all rows of the black matrix, then the same process will be performed to the columns belonging to both matrices.
The Region-Based (RB) paradigm is a two-level speller where the letters are distributed into regions and the selection of a character is done in two steps: first among the regions, then within the selected region. An example of a speller, grounded on RB paradigm but using the Motor Imagery (MI), is the “Hex-O-Spell” [25] which was introduced as a mental gaze-independent spelling application. The speller is presented with six hexagonal fields, where the user mentally controls the application with two mental states: imagined right-hand movement and imagined right foot movement. “Hex-O-Spell” was first developed in 2006 by [25], presented in [26], and then inspired many variations (such as, [27–29]) that transformed the “Hex-O-Spell” into an ERP system initially to test whether ERP spellers could also be gaze-independent.
Then, the Gaze-Independent Block Speller (GIBS) [30] was proposed as an RB speller based on P300 BCI. The stimulus displays 30 characters grouped into four regions that are located at the corners of the screen. The regions are flashed until a block is selected, and then expanded in the center of the screen. Then, the characters in the central region are flashed. The results showed that this speller is as efficient as the standard RC speller in terms of information transfer rates.
Fazel-Rezai et al. [15] introduced a P300 RB speller presenting seven regions, where each region contains seven characters, as shown in Fig. 1b. In the first level, the regions are flashed. Once a region is selected, then the characters within this region are alternatively flashed until the desired character is identified. Fig. 1b displays the process of choosing a specific character in this paradigm.
Based on the character’s arrangement within the regions, Fazel-Rezai et al. [16] considered two RB layouts named RB1 and RB2. In the RB1 layout, the characters are distributed with respect to the alphabetical order, while in the RB2 layout, the characters are distributed based on the frequency of character usage, such that the characters that have close probability of usage are placed in one region. They have demonstrated that the RB paradigm outperforms the RC paradigm in terms of accuracy and user acceptability. Also, within the RB paradigm, the RB2 has the highest average accuracy while RB1 has been rated as the easiest to use.
Furthermore, [18] noticed that some patients with ALS were unable to use the conventional RC speller. For this reason, they conducted some experiments involving patients with ALS and age-matched healthy participants who were asked to input Hiragana characters using RB and RC paradigms. It turned out that the RB speller provided significantly increased accuracy for patients with ALS compared to the conventional RC speller. Recently, Oralhan [17] also proposed a 2-level region-based P300 speller with a different number of regions and stimulus positions. This study also showed that the RB speller outperforms the RC-based speller in terms of accuracy.
2.1.3 Human Factors in P300 Detection
Several challenging problems, that might affect the detection of P300 peak, were listed in [9,10]. Among them, some human perceptual phenomena could be potential sources of errors, such that;
• Adjacency errors occur when a non-target item near to the target flashes attracts user’s attention and producing P300, as it was observed that incorrect selections frequently occur in locations close to the target item [14].
• Crowding effect occurs when the target object is surrounded by similar objects so that the identification of the target becomes difficult [12]. In fact, as illustrated in [31], three main factors determine crowding; the inter-stimulus distance, the target eccentricity, and similarity, such that the more similar the flankers are to the target, the more they affect its identification.
• Repetition blindness occurs in rapid serial visual presentation so that the user will not recognize or may miss the second occurrence [13]. This phenomenon might occur in visual paradigms with crowding effect [10].
• Habituation occurs after a while of repeatedly presenting the same matrix so that the user’s attention will decrease and eventually lose focus [11]. This phenomenon happens when the user automatically achieves the task by using less attentional resources [32]. Consequently, the error rate will increase since the signal’s amplitude becomes weak [33].
In the RC paradigm, Fazel-Rezai et al. [14,24] noticed that incorrect selections frequently occur in the same row or column as the desired target, and then concluded that this paradigm is prone to adjacency errors. The CB paradigm [24], however, overcomes this problem by separating adjacent letters in different flash groups so that they do not simultaneously flash. However, designed as a matrix-based paradigm, it is prone to the crowding effect. Further, the Zigzag Paradigm (ZP) [34] was proposed to address the adjacency and crowding problems through horizontally shifting each second row of the matrix. This shifting removes vertical adjacent characters and slightly increases the distance between the adjacent characters. However, designed in the form of a  matrix, the ZB paradigm still has higher crowding compared to the RB paradigm [10] which was especially designed to significantly reduce the crowding effect and adjacency errors.
As for the habituation phenomenon, Yu et al. [35] recently investigated the short-term habituation in the use of P300-based spellers and concluded that neither intra-run nor inter-run P300 habituation was found.
2.2 Usability Evaluation of P300 Spellers
Usability can be defined as the quality attribute that assesses how easy to use an interface. Therefore, most BCI related studies highly focus on the usability part of the application, since it has a huge impact on the success or failure of the proposed application. The usability can be evaluated using numerous types of measures. Depending on the study objectives, the usability evaluation can be direct through the observations of the participants’ behavior while using the application. Else, the study may involve a comprehensive usability evaluation that requires the collection of both qualitative and quantitative data.
The performance of P300 based BCI systems varies according to the stimulus paradigm [19] and the properties of the stimulus interface [11,36]. In fact, several studies suggested changing one or more parameters of visual stimulation, such as stimulus colors [37], stimulus contrast, or flashing methods, by using the character motion and character size and sharpness [38], lighting patterns [24], character contrast and environmental background noise [39], or the presentation times and brightness intensity [40]. Other studies also investigated the effect of the number of stimuli [11], the grid layout [41], the stimuli, whether letters, faces, or geometrical figures [28], the size of the stimuli and the distance between them [42], and recently the speller size [43].
For example, studies in [44,45] evaluated the speller based on the matrix layout, where the characters had the same size. The matrix sizes varied from  ,
,  , and
, and  in [44], to
  ,
,  ,
,  in [45]. Moreover, Garcia et al. [46] evaluated the speller with three different sizes (Large, Middle, Small) for a
  matrix that varied in terms of matrix size, symbol size, and distance between the symbols.
2.2.2 Characteristics of the Participants
In [47], the study examined the trends in the inclusion of participants with disabilities by analyzing the meeting abstracts across six international BCI meetings from 1999 to 2016. It was noticed that, among the large number of studies focusing on BCI for individuals with disabilities, only 22% actually included them as research participants. In fact, it is a common practice [48] to initially start testing the system with healthy participants, as a proof of concept, before involving individuals with disabilities. Also, this might be due to the challenges in recruiting and involving people with disabilities.
In [48], the study investigated the usability of the BCI spellers for disabled people with ALS. The results of the usability evaluation in terms of effectiveness, efficiency, and satisfaction were promising and showed that the BCI may be competitive with alternative communication systems, such as eye trackers. In [49], researchers conducted a comparative study concluding that BCI accuracy and communication rate did not significantly differ between users with ALS and healthy, age-matched volunteers. Recently, Yu et al. [35] conducted a comparative study involving people with ALS and healthy age-matched volunteers to study the habituation in the use of P300-based spellers. Results showed that the ALS group performed as well as the healthy volunteers, concluding that P300 speller can be a reliable communication device for individuals with ALS. These results (from [34,49]) suggest that the development of BCI systems can begin with studies with healthy participants, and then involve people with ALS to confirm the hypotheses. Hence, most of the recruited participants in the BCI studies were healthy, whereas few studies, such as [18,50] involved both motor disabled and healthy participants.
All the previous studies on BCI spellers agreed on the evaluation method to be task-based, where the participants are asked to input a given set of characters. Tab. 1 summarizes the parameters of the evaluation methods as reported in the previous studies; particularly, the P300 region based spellers.
Table 1: Summary of the evaluation methods used to assess P300 RB spellers
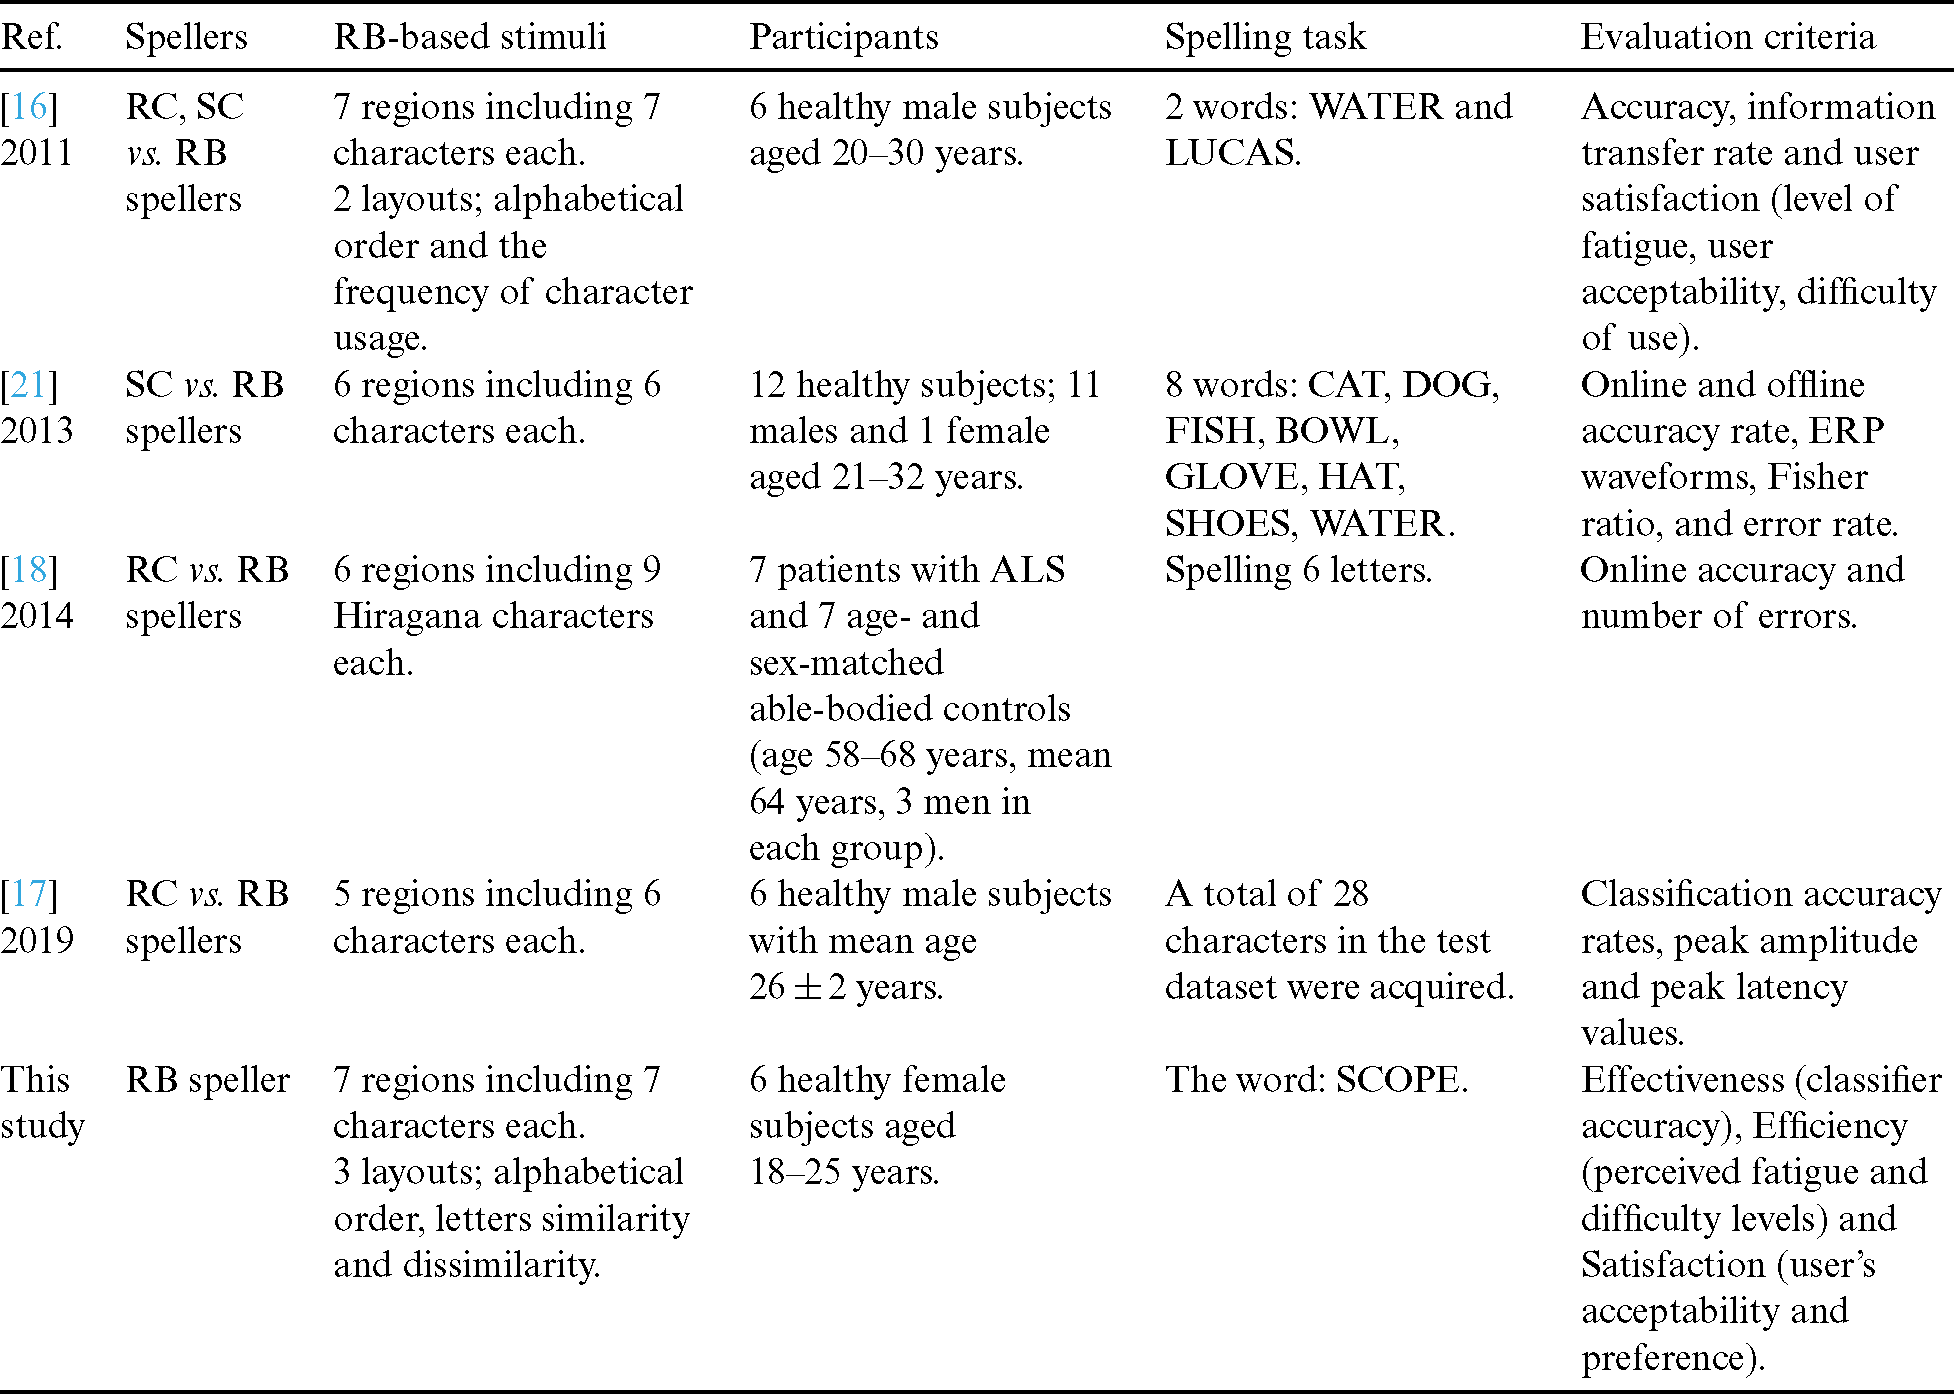
It can be observed that different criteria were used to evaluate the P300 spellers, but the accuracy is the main criterion used in all studies. While the previous studies compared the RB speller to other paradigms like SC and RC, showing its supremacy among them, our study focuses on comparing different layouts within the RB paradigm.
Much effort has been put into the improvement of the P300 speller’ visual stimuli as it is an important factor that can influence the performance of the system. Therefore, a promising study area suggests investigating the effect of modifying the type of visual stimulus, and showing that different types of visual stimuli could elicit stronger P300. As discussed in the previous section, numerous approaches were proposed to optimize the spelling parameters, the stimulation frequency, and stimulation intensity. However, this study focuses on the impact of the speller’s layout on the performance and usability of the system. Particularly, two RB-speller layouts were proposed in [16] as mentioned in the previous section, where the only difference between them was the letters’ distribution among the regions, where (RB1) was based on the alphabetical order, while (RB2) was based on the frequency of letters usage. Yet, there was a difference in the experimental results among the two layouts showing that (RB2) had the highest average accuracy, whereas (RB1) was rated by the participants as the easiest to use. This suggests that the letters’ distribution in RB paradigm could indeed make a difference and may affect the efficiency of the speller.
To reduce human errors due to habituation and crowding effect, our study investigates whether the distribution of letters based on letter’s similarity/dissimilarity might have an effect on the spelling error rate, and then the speller’s accuracy. In fact, the reason behind the proposed approach is to tackle (1) the crowding effect problem by reducing the similarity among adjacent letters surrounding the target letter, and (2) the habituation problem by stimulating the user’s attention for a longer period by creating events that are not expected by the user, triggering P300, and thus reducing habituation.
In order to achieve this, a clustering algorithm is proposed to group the letters based on their similarity or dissimilarity. Clustering algorithms have been implemented and used as a basic step in many applications [51,52]. Clustering can be achieved by various algorithms that significantly differ in how the clusters are defined and how to efficiently find them [53]. Therefore, number of algorithms of different categories have been developed [54]. Particularly, the group-average approach measures the average similarity across all pairs within the cluster and aims to maximize the intra-cluster similarity while minimizing the inter-cluster similarity.
In this approach, calculating the distance between objects in the same cluster and the distance between clusters is an important step. In our study, the distance reflects the level of similarity/dissimilarity between the letters. In [55], the study produced a full similarity matrix for both upper and lower case letters based on visual similarity of the letters. Since the BCI spellers only consider the uppercase letters, our experiments were based on the uppercase letter’s visual similarity matrix proposed in [56]. This matrix contains letter’s visual similarity determined based on user’s ratings and it can be noticed that this matrix is not symmetric. For the redistribution, proposed clustering algorithm is presented in Section 4.
Finally, as discussed in the previous sections, the usability evaluation of BCI application is often task-based. Particularly, for BCI spellers, the participants are usually requested to perform the task of typing specific words or numbers. This paper presents a task-based usability evaluation that aims to assess the effect of redistributing the letters based on the letters similarity. The optimized layouts have been then evaluated in terms of effectiveness, efficiency and satisfaction with respect to (ISO 9241-11: 2018) standard as discussed in Section 5.
The RB speller paradigm consists of seven regions, as illustrated in Fig. 2. Each of which consists of seven characters, which can be uppercase English letters, special characters, or punctuation marks. Region 5–7 contain special characters, punctuation marks, and a set of numbers. The distribution of regions 5–7 will remain the same, since the character similarity is not applicable, and beyond the scope of this study. By excluding the previously mentioned regions, four regions will remain for the distribution process. Three of which will contain seven letters and one will include five letters and two integers “1” and “2”. The proposed clustering approach is based on group-average distance [54] and was conducted in 4 steps as detailed in the following subsections.

Figure 2: The layouts generated by the clustering algorithm. (a) P300 RB speller based on letter dissimilarity (b) P300 RB speller based on letter similarity
As a preprocessing step, the clustering seeds are selected on the basis of the clustering type. Two types of clustering are considered in our approach. For most dissimilar clustering, a group of most similar letters is selected as seeds to lower the probability of having them in the same cluster, and vice versa for the most similar clustering.
To identify the seed letters of the most dissimilar clustering, the four most similar uppercase letters were chosen based on the letter’s similarity matrix [56], where the distances are computed between the letters based on the visual similarity ratings so that the smaller the distance the higher the similarity and vice versa. The group that has the highest similarity among its letters is (O, C, D, Q). This result is consistent with the result of the experiments performed in [55] where the curved letters (B, D, C, c, o, O, Q, G) were clustered in one group. Subsequently, each of these letters is placed in a different cluster due to the high similarity among them, to keep them as far as possible. Each of these letters will act as a cluster seed in its respective cluster.
As for the most similar clustering, the selection of the seeds was built on the clustering results of the most dissimilar clustering mentioned earlier. The cluster with the highest dissimilarity among the three other clusters was (O, Z, I, A, Y, G, R). Afterward, the average of the group-average distances was computed for each letter that belongs to this cluster and all the other letters. Finally, the top four letters that have the highest group-average distance to all the cluster’s members are then chosen as seeds. Following the above mentioned steps, the resulting seeds were (Y, G, I, Z).
The order of letters within the set was then determined by evaluating the clusters resulting from all possible permutations of the seeds (4! = 24 combinations). Based on the quality of clusters, two different orders of the same seeds turned out to be the best with the same score for dissimilar clustering; which are (O, Q, D, C) and (Q, O, D, C). For the most similar clustering, the best order of seeds was (G, Z, Y, I).
Our algorithm is the same for both clustering types (most dissimilar clustering and most similar clustering), using the similarity matrix adopted from [56]. The most dissimilar clustering aims to group the letters with the highest similarity values. After the selection of the seed letters, clustering is performed between the main clusters that contain the seed letters and other clusters, each of which initially contains only one letter yet to be assigned to a cluster. Following the group-average approach for clustering [54], at each iteration, four unassigned letters are assigned to the four clusters (one letter to each cluster). The distance between each unassigned letter and all the formed clusters is calculated by taking the average distance between the letter to be assigned and all members of the cluster. The unassigned letter that has the largest average distance to a cluster will be assigned to that cluster.
If a letter to be assigned has the same group-average distance to two or more clusters, i.e., more than one cluster “compete” for the same letter, the cluster having the farthest letter from the unassigned letter will be selected as the “winning cluster” to accommodate the new letter (i.e., a complete-link approach is adopted here to resolve conflicts). In case of ties between competing clusters with respect to the complete-link again, the next farthest letter from the letter under consideration within the competing clusters is chosen. This is repeated until a decision can be made about the “winning cluster”, or the selection will be in favor of the first cluster among the conflicting clusters, while the “losing” clusters will have to find other letters to be assigned to them among the unassigned letters.
In the last iteration, there will be two full-clusters containing seven letters each, and two clusters containing only six letters each. Hence, the latest added letter to the last cluster is removed, and reassigned to the cluster before, to obtain three full-clusters of seven letters and only one cluster of five letters. The integers “1” and “2” will be added to the cluster of five letters to form the fourth full-cluster.
Subsequently, the obtained clusters are placed in the RB paradigm regions, such that the cluster containing the numbers “1” and “2” is placed in region 4, like in the original paradigm. Afterward, the three remaining clusters will be distributed at random in regions 1–3, since the location of these regions have similar accuracy based on the study conducted in [16].
4.4 Evaluation of the Resulting Clusters
Evaluation of the quality of clustering can be measured using different measures [54]. The intra-cluster measure is the similarity or so-called the distance within-cluster (wc) that indicates how close the cluster’s members are to one another; if the goal is to cluster most similar members, then the closer the better, otherwise the farther the better. Given a cluster Ck, wc is measured using

where k is the number of cluster  , and n is the number of letters within a cluster.
However, the inter-cluster measure indicates the distance between clusters (bc) [54]. The distance between two clusters Ck and Cl, is defined as

The resulting cluster’s quality can be measured by comparing the intra-cluster distances with the inter-cluster distance. This can be done by dividing the total of the inter-cluster cluster distances (BC) by the total of the intra-cluster distances (WC). The lower the value the better the clusters.
The layouts generated by the clustering algorithm are depicted in Fig. 2, where Fig. 2a shows the most dissimilar RB speller, while Fig. 2b shows the layout of the most similar RB speller.
5 Usability Evaluation of the RB Layouts
This section focuses on the usability evaluation of our developed RB spellers, and particularly investigates the impact of the different letter distribution among the regions. An overview of the implementation of the interfaces of different RB layouts is presented, followed by usability testing in terms of effectiveness, efficiency, and satisfaction. The classification accuracy was used as an objective indicator of the speller performance, while the subjective counterpart based on user’s feedback was assessed using a usability questionnaire.
5.1 Configuration of the BCI Spellers
The configuration of the speller is performed in 4 steps: Signal monitoring, signal acquisition, training the xDAWN spatial filter [57], and finally training the LDA (Linear Discriminant Analysis) classifier offline. First, the signal monitoring step monitors the signal quality and ensures that the acquisition device, the 14-channels wireless EEG headset EMOTIV Epoc+, is properly connected to the acquisition server. Second, in the signal acquisition step, the participant is asked to focus on the region/letter highlighted in blue, while the headset is recording the signals. Third, the training of the xDAWN spatial filter increases the Signal-to-Noise Ratio (SNR) of the P300 potential. By performing this step, the SNR is enhanced and the other artifacts are removed. The xDAWN algorithm is chosen because it was originally developed for filtering the P300 potentials for the P300 speller [57]. Finally, the LDA classifier is chosen, similar to previous studies [16,58], and then trained to discriminate the classes of the acquired signals, whether it is P300 or not, until reaching an accuracy of 80% at least. The accuracy of the classifier is determined by k-fold cross validation test, where k is equal to 5. The intensification-flash-time for our experiments was set to 100 ms and the blank time was 60 ms similar to [16] as discussed in Section 5.4.1. However, the number of flashes for each region at both levels 1 and 2 was set to 12 flashes as shown in Tab. 2.
Table 2: Comparison between the parameters and results of this study and those of [16]

5.2 Usability Evaluation Model
The (ISO 9241-11: 2018) standard known as the “Ergonomics of Human System Interaction” covers a wealth of information on every aspect of usability, including hardware, software, and usability processes. It defines the usability as “the extent to which a system, product, or service can be used by specified users to achieve specified goals with effectiveness, efficiency, and satisfaction in a specified context of use.” This definition identifies efficiency, effectiveness, and satisfaction as major attributes of usability:
• The effectiveness measures the accuracy and completeness to achieve a specified goal in a particular environment. Most BCI studies focused on enhancing the accuracy of the classifier as it measures how accurate the brain signals are being distinguished and identified [59].
• The efficiency is defined as the resources used in relation to the accuracy and completeness with which the users achieve a task. Since the workload evaluation in BCI applications considers cognitive, emotional, and physical state of the task, participant workload serves as a subjective efficiency measure.
• The satisfaction is influenced by the ease of use, comfort, and acceptability that a user perceived while using the product. User satisfaction entails several subjective measures and is usually evaluated using a questionnaire post the completion of the task or the entire experiment.
In this study, the effectiveness of the different layouts was assessed based on the accuracy of the classifier. Moreover, a survey was conducted after testing each speller to determine the level of fatigue, user acceptability, and the speller’s difficulty. The perceived levels of fatigue and difficulty reflect the workload and serve here as subjective efficiency measures. Whereas, satisfaction was assessed in terms of the user’s acceptability and preference. Ratings were numerical values from 1 to 10, where 1 and 10 corresponds to the lowest and highest scores, respectively, obtained from the participant to determine the fatigue, user acceptance, and the speller’s difficulty after testing each layout. Finally, after experimenting all the three spellers, the participants were asked to indicate their preference and rank the presented layouts based on their difficulty from the most difficult to the easiest.
The participants were six healthy subjects, aged 18 to 25, who had no previous experience with BCI. Before each session, the objectives of this study were explained to the participant. Subsequently, BCI and P300 spellers along with the experimental procedure were introduced. Next, each participant used the three speller types to be able to make within-subject’s comparisons. The order of presenting the three RB spellers was permuted among the different sessions and the experimental sequence was randomized to minimize the effect of the presentation order if there is any.
The participants were asked to spell the word “SCOPE” using the 3-tested spellers (the original RB speller, the most similar, and most dissimilar RB spellers). This word was chosen because to spell it the participant would have to visit all the regions that contain letters in the most similar and most dissimilar RB spellers. However, in the original RB speller only two regions instead of four will be visited several times to spell the exact same word.
In each session, the speller was displayed to the participant, and then he/she was asked to rate the speller based on the level of fatigue, the user’s acceptability and the level of difficulty. The evaluation was done on a scale from 1 to 10. Between the different sessions, the participant was asked to rest for approximately five minutes preparing for the next speller. This procedure was repeated until all the three spellers were evaluated by the participant. Finally, the participant was asked to rank the 3 spellers based on the overall difficulty without knowing the layouts’ names or the difference between them.
5.4 Usability Evaluation Results
5.4.1 Effectiveness Based on the Classifier Accuracy
Fig. 3 demonstrates the accuracies of the offline evaluation obtained from the six participants while spelling the word “SCOPE”. The three spellers show satisfactory performances as they could achieve values higher than 80%, which indicates that the three tested layouts are good candidates for a P300 speller system. The highest accuracy among all six participants was achieved by the original RB (90%) followed by the most dissimilar RB (87.26%), while the most similar RB attained the lowest accuracy (79.52%). The average accuracy for each speller for all the six participants follow the same order as the maximum accuracies; the original RB speller, then the most dissimilar speller and then the most similar speller, with average accuracies equal to 84.90%, 84.46% and 82.99%, respectively.

Figure 3: RB P300 spellers’ accuracies
However, for each participant, the standard deviation among the accuracies of the three spellers does not exceed 2%. Therefore, the 3 layouts are very competitive in terms of classifier accuracy. Furthermore, the order of presenting the spellers did not have any significant effect on the classifier accuracy.
In order to be able to compare these results to the previous studies, the parameters of this study were set to be very similar to the parameters in [16] as shown in Tab. 2.
The results of the classifier accuracy are also very close, confirming the supremacy, in terms of accuracy, of the original RB speller which is based on the alphabetical order. It should be noticed that acquiring the brain signals using Epoc+ headset was a little bit challenging when involving female participants with long hair. Moreover, further training of the classifier would lead to better classifier accuracy. So the slight difference between the results of [16] and ours can be explained by the quality of signal acquisition, the difference in the training phase as well as the number of spelled characters.
5.4.2 Efficiency Based on the Perceived Fatigue and Difficulty Levels
Fig. 4 shows the ratings for the fatigue levels as recorded for each participant across the three RB spellers. On average, the original RB speller has the lowest fatigue level by a difference of 0.67 and 0.34 compared to the most dissimilar RB speller and the most similar RB speller, respectively.

Figure 4: Fatigue levels of the RB spellers as rated by the participants
However, there is some fluctuation in the perception of the fatigue level among the most dissimilar and the most similar RB spellers. Hence, we considered the possible presence of a sequence effect because participants 3 and 6 rated the most dissimilar RB speller as the one with the highest fatigue level, while participants 4 and 5 evaluated it as the speller that has the lowest fatigue level. This difference in the evaluation may be due to the effect of the order of the speller presentation since we noticed that for participants 3 and 6, the most dissimilar speller was first presented and for the rest of the participants, it was shown either second or last. Moreover, the same can be noticed also for the most similar RB speller that was rated as the one with the highest fatigue level by participant 5 while this speller was first presented to this participant. Overall, the order of presenting the three spellers shows a direct effect on the fatigue level perceived by the participants, where the averages of the fatigue level are 6.50, 4.66, and 4.33 with respect to the experimental sequence.
Furthermore, the participants were asked to rate the level of difficulty of each speller, and it turned out that the three spellers have all performed well and have very comparable results. Particularly, the participants have rated the original RB speller and the most dissimilar RB speller almost the same and both got an average of 2, where the lower rate means lower difficulty and else wise if the rating was higher. Following these two spellers by a slight difference of 0.17, comes the most similar speller.
5.4.3 User Satisfaction Based on User’s Acceptability and Preference
For user acceptability, as shown in Fig. 5, the participants expressed a similar and quite high degree of satisfaction with a slight preference for the original RB speller.

Figure 5: User acceptability levels of the RB spellers as rated by the participants
In fact, the average acceptability rate of each speller across the 6 participants were 8.67 for the original RB speller, 7.5 for the most dissimilar RB speller and 8.17 for the most similar RB speller. Overall, as shown in Fig. 5, all three spellers have been perceived well by the participants. However, while the average ratings of the original RB speller and the most similar RB speller are above 8, the most dissimilar are slightly less, making it the least accepted speller compared to the other two.
Finally, after experimenting all the three layouts, the participants were asked to indicate their preferences and rank the presented layouts based on their difficulty from the most difficult to the easiest. Tab. 3 shows the superiority of the original RB speller to be the easiest speller as ranked by 4 participants out of 6, followed by the most similar RB speller. Whereas, the most dissimilar RB speller was selected by 4 participants to be the most difficult in comparison to the other two.
Table 3: Number of participants who have ranked each speller to be difficult, neutral, or the easiest
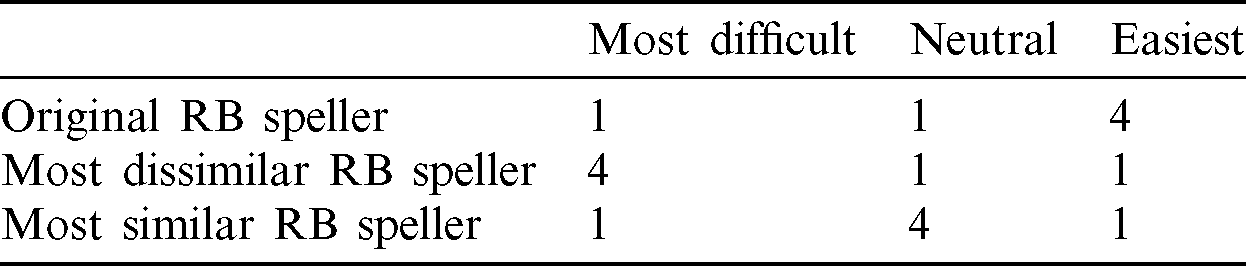
However, two factors could be behind this ranking. First, the alphabetical order is the conventional way to order the letters, and then the participants may suffer from change aversion. Second, the selected word “SCOPE” might have affected this ranking. Because, to spell this word in the most similar or most dissimilar spellers, the participants have to visit four regions, while for the original RB speller two regions will be visited several times to spell the exact same word.
5.5 Observations and Discussion
Overall, the original RB speller has exceeded the other two spellers in terms of classifier accuracy, fatigue level, and user acceptability level. As for the difficulty level, the original RB speller had the exact average rating results as the most dissimilar RB speller. The similarity in results between the original RB speller and the most dissimilar RB speller has also emerged in the classifier accuracy where it was 84.90% for the former and 84.46% for the latter. In contrast, the fatigue and the user acceptability results for the most dissimilar RB speller were the worst compared to the original and the most similar RB spellers. However, the most similar RB speller registered the lowest classifier accuracy, while it had the highest user acceptability results as rated by the participants.
Based on the experimental results, summarized in Tab. 4, it can be concluded that redistributing the characters in the RB speller has a slight effect on the speller accuracy, but an important effect on user acceptance. In fact, the results show that different layouts could be effective for RB spelling BCI applications.
Table 4: Experimental results for all three spellers
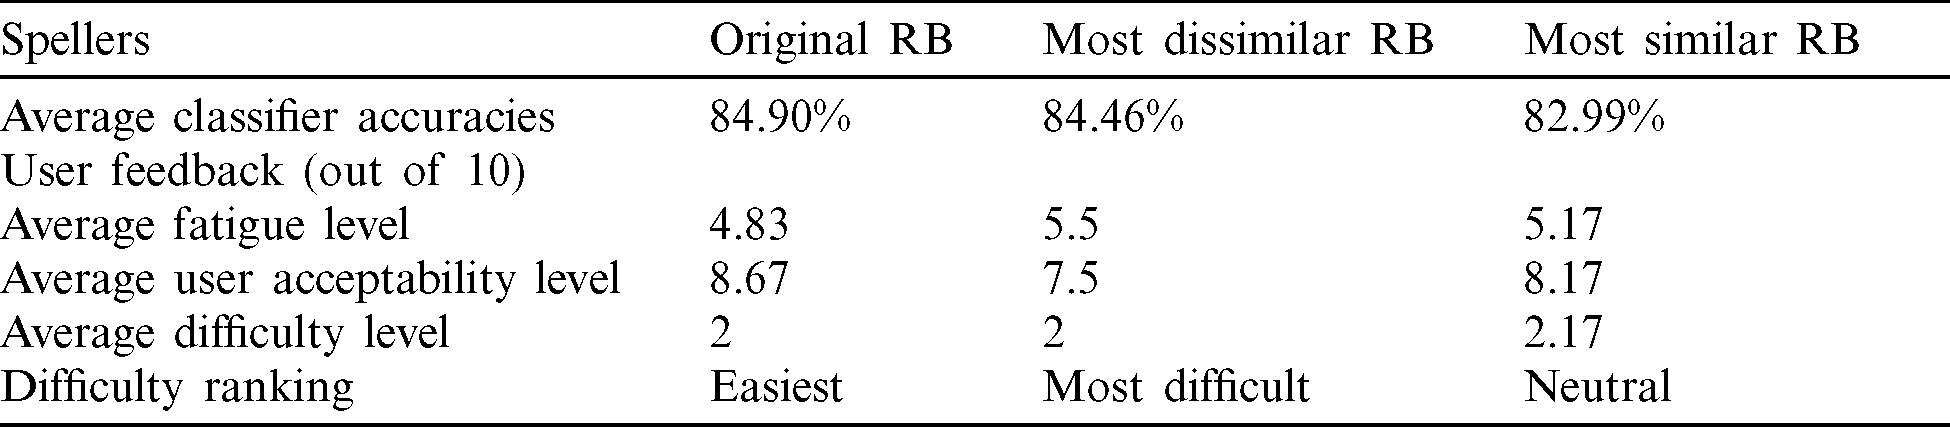
However, despite the good effectiveness (based on the classifier accuracy) of the most dissimilar layout, participants find it the most difficult to use. Furthermore, an inverse relationship was noticed between the averages of the user acceptance level and the classifier accuracy for the most dissimilar and most similar RB spellers. Also, this relationship can be noticed between RB1 and RB2 in the results of [16], where RB2 has a higher average accuracy while RB1 has higher user acceptability. This finding indicates that the discomfort of the user might in fact lead to a better classifier performance. Therefore, this hypothesis should be further investigated by conducting more experiments.
Generally, the original RB speller seems to have the highest potential in terms of performance and usability, followed by the most dissimilar RB and finally the most similar RB spellers. However, the frequency of using the regions while spelling and its relation to the speller’s difficulty require further investigation to conclude. Involving a larger number of participants and using different words could be a promising research track.
In summary, no layout is consistently better or worse than the others for all participants, and each may have one layout that is most suitable and effective. Although the reasons could be further investigated, this indicates that for practical application, generating a user-specific layout would be better than using a universal one. The automatic generation of different layouts has made possible thanks to the proposed clustering algorithm.
Some limitations of this study can be due to the small number of participants or due to the given spelling task that consisted of typing one word. Hence, more experiments, involving a larger number of participants, including people with disabilities, and using different spelling tasks, should be conducted to have a comprehensive usability evaluation study. Furthermore, the optimization of the layouts considered only the distribution among the different regions, and only involved the alphabet letters. Then, further optimization research could be conducted to investigate the effect of letters distribution within a region, and to include other characters and symbols. Finally, this study considered short-term accuracy and cognitive effort. Therefore, future user research might study long-term use of RB spellers to investigate possible effects of habituation or change aversion.
Many P300 spellers were proposed in the literature. The RB P300 speller paradigm outperforms the classical ones in terms of accuracy and user acceptability [16,17,21]. Therefore, this paper extends this line of research and investigate the possibility to enhance the performance of RB speller by redistributing the letters among the layout’s regions. The major idea of the proposed RB layouts is redistributing the letters within the speller’s regions based on the letters’ dissimilarity or similarity. To the best of our knowledge, generally, this approach has not been applied for the RB speller or other spellers. Hence, a clustering algorithm was proposed and two optimized layouts were generated based on the letter’s distribution: the most dissimilar character distribution and the most similar character distribution. Furthermore, a usability evaluation was conducted to assess the usability, in terms of effectiveness, efficiency, and satisfaction of the generated layouts compared to the original RB layout that is based on the alphabetical order.
The results indicate that when considering short-term accuracy and cognitive effort, the original RB layout outperforms other layouts. However, despite the good accuracy of the most dissimilar layout, participants consider it as the most difficult, and vice versa for the most similar layout. This suggests that the discomfort of the user might lead to better classifier accuracy. Therefore, future user research might study long-term use of RB spellers to investigate possible effects of habituation or change aversion.
Furthermore, this study can be beneficial by reusing the clustering algorithm to cluster characters from other languages and for different objectives, such as letter frequencies of use together or probabilities of use in a text. Another line of research could be to consider designing an adaptive interface through dynamically changing the layout and clustering the letters based on the previously entered text or based on user preferences.
Acknowledgement: Authors would like to thank the participants for their involvement in the usability evaluation and their valuable feedback.
Funding Statement: This article contains results and findings from a research project that was supported by King Abdulaziz City for Science and Technology, http://www.kacst.edu.sa/, Grant No. 827-37  .
.
Conflicts of Interest: The authors declare that they have no conflicts of interest to report regarding the present study.
References
1. E. Donchin and M. G. H. Coles. (1988). “Is the P300 component a manifestation of context updating?,” Behavioral and Brain Sciences, vol. 11, no. 3, pp. 357–374.
2. L. A. Farwell, “Method and apparatus for truth detection,” Patent US5406956 A.
3. F. Miralles, E. Vargiu, X. Rafael–Palou, M. Solà, S. Dauwalder et al. (2015). , “Brain computer interface on track to home,” Sciences World Journal, vol. 2015, pp. 623896.
4. J. I. Münßinger, S. Halder, S. C. Kleih, A. Furdea, V. Raco et al. (2010). , “Brain painting: First evaluation of a new brain–computer interface application with ALS-patients and healthy volunteers,” Frontiers in Neuroscience, vol. 4, no. 182, pp. 182.
5. D. O. Bos and B. Reuderink. (2008). “BrainBasher: A BCI game,” in Proceedings of the Extended Abstracts of the Int. Conf. on Fun and Games, Eindhoven, Netherlands, vol. 4, pp. 36–39.
6. B. Rebsamen, C. Guan, H. Zhang, C. Wang, C. Teo et al. (2010). , “A brain controlled wheelchair to navigate in familiar environments,” IEEE Transactions on Neural Systems and Rehabilitation Engineering, vol. 18, no. 6, pp. 590–598.
7. L. A. Farwell and E. Donchin. (1988). “Talking off the top of your head: Toward a mental prosthesis utilizing event-related brain potentials,” Electroencephalography and Clinical Neurophysiology, vol. 70, no. 6, pp. 510–523.
8. A. Rezeika, M. Benda, P. Stawicki, F. Gembler, A. Saboor et al. (2018). , “Brain–computer interface spellers: A review,” Brain Sciences, vol. 8, no. 4, pp. 57.
9. R. Fazel–Rezai, B. Z. Allison, C. Guger, E. W. Sellers, S. C. Kleih et al. (2012). , “P300 brain computer interface: Current challenges and emerging trends,” Frontiers in Neuroengineering, vol. 5, pp. 1–30.
10. R. Fazel–Rezai and W. Ahmad. (2011). “P300-based brain–computer interface paradigm design,” in R. Fazel, Recent Advances in Brain–Computer Interface Systems, InTech. [Google Scholar]
11. E. W. Sellers, D. J. Krusienski, D. J. McFarland, T. M. Vaughan and J. R. Wolpaw. (2006). “A P300 event-related potential brain–computer interface (BCIThe effects of matrix size and inter stimulus interval on performance,” Biological Psychology, vol. 73, no. 3, pp. 242–252. [Google Scholar]
12. H. Bouma. (1970). “Interaction effects in parafoveal letter recognition,” Nature, vol. 226, no. 5241, pp. 177–178. [Google Scholar]
13. N. G. Kanwisher. (1987). “Repetition blindness: Type recognition without token individuation,” Cognition, vol. 27, no. 2, pp. 117–143. [Google Scholar]
14. R. Fazel-Rezai. (2007). “Human error in P300 speller paradigm for brain–computer interface,” in Annual Int. Conf. of the IEEE Engineering in Medicine and Biology-Proc., Lyon, France, pp. 2516–2519. [Google Scholar]
15. R. Fazel-Rezai and K. Abhari. (2009). “A region-based P300 speller for brain–computer interface,” Canadian Journal of Electrical and Computer Engineering, vol. 34, no. 3, pp. 81–85. [Google Scholar]
16. R. Fazel-Rezai, S. Gavett, W. Ahmad, A. Rabbi and E. Schneider. (2011). “A comparison among several P300 brain–computer interface speller paradigms,” Clinical EEG and Neuroscience, vol. 42, no. 4, pp. 209–213. [Google Scholar]
17. Z. Oralhan. (2019). “2 Stages-region-based P300 speller in brain–computer interface,” IETE Journal Research, vol. 65, no. 6, pp. 740–748. [Google Scholar]
18. S. Ikegami, K. Takano, K. Kondo, N. Saeki and K. Kansaku. (2014). “A region-based two-step P300-based brain–computer interface for patients with amyotrophic lateral sclerosis,” Clinical Neurophysiology, vol. 125, no. 11, pp. 2305–2312. [Google Scholar]
19. C. Guger, S. Daban, E. Sellers, C. Holzner, G. Krausz et al. (2009). , “How many people are able to control a P300-based brain–computer interface (BCI)?,” Neurosciences Letters, vol. 462, no. 1, pp. 94–98. [Google Scholar]
20. J. Pan, Y. Li and T. Yu. (2011). “A comparison of P300-speller stimuli presentation paradigms for brain–computer interface,” in 3rd Annual Summit and Conf. of Asia Pacific Signal and Information Processing Association, Xi’an, China. [Google Scholar]
21. J. Pan, Y. Li, Z. Gu and Z. Yu. (2013). “A comparison study of two P300 speller paradigms for brain–computer interface,” Cognitive Neurodynamics, vol. 7, no. 6, pp. 523–529. [Google Scholar]
22. F. Velasco-Álvarez, S. Sancha-Ros, E. García-Garaluz, A. Fenández-Rodríguez, M. T. Medina-Juliá et al. (2019). , “UMA-BCI speller: An easily configurable P300 speller tool for end users,” Computer Methods and Programs in Biomedicine, vol. 172, pp. 127–138. [Google Scholar]
23. C. Guan, M. Thulasidas and J. Wu. (2004). “High performance P300 speller for brain–computer interface,” in IEEE Int. Workshop on Biomedical Circuits and Systems, Singapore. [Google Scholar]
24. G. Townsend, B. K. LaPallo, C. B. Boulay, D. J. Krusienski, G. E. Frye et al. (2010). , “A novel P300-based brain–computer interface stimulus presentation paradigm: Moving beyond rows and columns,” Clinical Neurophysiology, vol. 121, no. 7, pp. 1109–1120. [Google Scholar]
25. B. Blankertz, G. Dornhege, M. Krauledat, M. Tangermann, J. Williamson et al. (2006). , “The Berlin brain–computer interface presents the novel mental typewriter Hex-O-Spell,” Clinical Neurophysiology, vol. 113. [Google Scholar]
26. B. Blankertz, G. Dornhege, M. Krauledat, M. Tangermann, J. Williamson et al. (2006). “The Berlin braincomputer interface presents the novel mental typewriter Hex-O-Spell,” in Proc. of the 3rd Inter. Brain–Computer Interface Workshop and Training Course, Graz, Austria, pp. 108–109. [Google Scholar]
27. M. S. Treder and B. Blankertz. (2010). “(C)overt attention and visual speller design in an ERP-based brain–computer interface,” Behavioral and Brain Functions, vol. 6, no. 1, pp. 28. [Google Scholar]
28. M. S. Treder, N. M. Schmidt and B. Blankertz. (2011). “Gaze-independent brain–computer interfaces based on covert attention and feature attention,” Journal of Neural Engineering, vol. 8, no. 6, 66003. [Google Scholar]
29. N. M. Schmidt, B. Blankertz and M. S. Treder. (2012). “Online detection of error-related potentials boosts the performance of mental typewriters,” BMC Neurosciences, vol. 13, no. 1, pp. 19. [Google Scholar]
30. G. Pires, U. Nunes and M. Castelo–Branco. (2011). “GIBS block speller: Toward a gaze-independent P300-based BCI,” in Annual Int. Conf. of the IEEE Engineering in Medicine and Biology Society, Boston, MA, pp. 6360–6364. [Google Scholar]
31. S. Zahabi and M. Arguin. (2014). “A crowdful of letters: Disentangling the role of similarity, eccentricity and spatial frequencies in letter crowding,” Vision Research, vol. 97, pp. 45–51. [Google Scholar]
32. J. Polich and H. K. McIsaac. (1994). “Comparison of auditory P300 habituation from active and passive conditions,” International Journal of Psychophysiology, vol. 17, no. 1, pp. 25–34. [Google Scholar]
33. D. Ravden and J. Polich. (1999). “On P300 measurement stability: Habituation, intra-trial block variation, and ultradian rhythms,” Biological Psychology, vol. 51, no. 1, pp. 59–76. [Google Scholar]
34. Q. Obeidat, T. Campbell and J. Kong. (2013). “The zigzag paradigm: A new P300-based brain computer interface,” in Proc. of the 15th ACM on Int. Conf. on Multimodal Interaction, Sydney, Australia. [Google Scholar]
35. X. Yu, L. da Silva-Sauer and E. Donchin. (2020). “Habituation of P300 in the use of P300-based brain–computer interface spellers: Individuals with amyotrophic lateral sclerosis versus age-matched controls,” Clinical EEG and Neuroscience. [Google Scholar]
36. S. Ikegami, K. Takano, N. Saeki and K. Kansaku. (2011). “Operation of a P300-based brain–computer interface by individuals with cervical spinal cord injury,” Clinical Neurophysiology, vol. 122, no. 5, pp. 991–996. [Google Scholar]
37. K. Takano, T. Komatsu, N. Hata, Y. Nakajima and K. Kansaku. (2009). “Visual stimuli for the P300 brain–computer interface: A comparison of white/gray and green/blue flicker matrices,” Clinical Neurophysiology, vol. 120, no. 8, pp. 1562–1566. [Google Scholar]
38. Y. Liu, Z. Zhou and D. Hu. (2010). “Comparison of stimulus types in visual P300 speller of brain–computer interfaces,” in Proc. of the 9th IEEE Int. Conf. on Cognitive Informatics, Beijing, China, pp. 273–279. [Google Scholar]
39. C. S. Nam, Y. Li and S. Johnson. (2010). “Evaluation of P300-based brain–computer interface in real-world contexts,” International Journal of Human Computer Interaction, vol. 26, no. 6, pp. 621–637. [Google Scholar]
40. Y. Li, S. Bahn, C. S. Nam and J. Lee. (2014). “Effects of luminosity contrast and stimulus duration on user performance and preference in a P300-based brain–computer interface,” International Journal of Human Computer Interaction, vol. 30, no. 2, pp. 151–163. [Google Scholar]
41. M. Salvaris and F. Sepulveda. (2009). “Visual modifications on the P300 speller BCI paradigm,” Journal of Neural Engineering, vol. 6, no. 4, pp. 46011. [Google Scholar]
42. Y. Li, C. S. Nam, B. B. Shadden and S. L. Johnson. (2010). “A P300-based brain–computer interface: Effects of interface type and screen size,” International Journal of Human Computer Interaction, vol. 27, no. 1, pp. 52–68. [Google Scholar]
43. R. Ron–Angevin, L. Garcia, Á. Fernández–Rodríguez, J. Saracco, J. M. André et al. (2019). , “Impact of speller size on a visual P300 brain–computer interface system under two conditions of constraint for eye movement,” Computational Intelligence and Neuroscience, vol. 2019, no. 1, pp. 1–16. [Google Scholar]
44. A. Brendan. (2003). “P3 or not P3: Toward a better P300 BCI,” Ph.D. dissertation. University of California, San Diego. [Google Scholar]
45. C. S. Nam, Y. Jeon, Y. Li, Y. Kim and H. Yoon. (2009). “Usability of the P300 Speller: Towards a more sustainable brain–computer interface,” eMinds, vol. 1, no. 5. [Google Scholar]
46. L. Garcia, V. Lespinet-Najib, S. Saioud, V. Meistermann, S. Renaud et al. (2015). , “Brain–computer interface: Usability evaluation of different P300 speller configurations: A preliminary study, ” in Advances in Computational Intelligence (IWANN 2015Lecture Notes in Computer Science, vol. 9094. Cham: Springer. [Google Scholar]
47. B. S. Eddy, S. C. Garrett, S. Rajen, B. Peters, J. Wiedrick et al. (2019). , “Trends in research participant categories and descriptions in abstracts from the international BCI meeting series, 1999 to 2016,” Brain–Computer Interfaces, vol. 6, no. 1–2, pp. 13–24. [Google Scholar]
48. V. Guy, M. H. Soriani, M. Bruno, T. Papadopoulo, C. Desnuelle et al. (2018). , “Brain computer interface with the P300 speller: Usability for disabled people with amyotrophic lateral sclerosis,” Annals of Physical and Rehabilitation Medicine, vol. 61, no. 1, pp. 5–11. [Google Scholar]
49. L. M. McCane, S. M. Heckman, D. J. McFarland, G. Townsend, J. N. Mark et al. (2015). , “P300-based brain–computer interface (BCI) event-related potentials (ERPsPeople with amyotrophic lateral sclerosis (ALS) vs. age-matched controls,” Clinical Neurophysiology, vol. 126, no. 11, pp. 2124–2131. [Google Scholar]
50. R. Fazel–Rezai and K. Abhari. (2008). “A comparison between a matrix-based and a region-based P300 speller paradigms for brain–computer interface,” in Proc. of the 30th Annual Int. Conf. of the IEEE Engineering in Medicine and Biology Society, EMBS’08-Personalized Healthcare through Technology, Vancouver, Canada, pp. 1147–1150. [Google Scholar]
51. P. Berkhin. (2006). “A survey of clustering data mining techniques, ” in Grouping Multidimensional Data: Recent Advances in Clustering. Springer-Verlag, Berlin Heidelberg. [Google Scholar]
52. A. K. Jain, M. N. Murty and P. J. Flynn. (1999). “Data clustering: A review,” ACM Computing Surveys, vol. 31, no. 3, pp. 264–323. [Google Scholar]
53. G. Singhal, S. Panwar, K. Jain and D. Banga. (2013). “A comparative study of data clustering algorithms,” International Journal of Computer Applications, vol. 83, no. 15, pp. 41–46. [Google Scholar]
54. H. Du. (2010). Data mining techniques and applications: An introduction. In: Cengage Learning EMEA, Cengage Learning EMEA, Hampshire, GB. [Google Scholar]
55. D. B. Boles and J. E. Clifford. (1989). “An upper- and lowercase alphabetic similarity matrix, with derived generation similarity values,” Behavior Research Methods, Instruments, & Computers, vol. 21, pp. 579–586. [Google Scholar]
56. P. Podgorny and W. R. Garner. (1979). “Reaction time as a measure of inter- and intra object visual similarity: Letters of the alphabet,” Perception & Psychophysics, vol. 26, pp. 37–52. [Google Scholar]
57. B. Rivet, A. Souloumiac, V. Attina and G. Gibert. (2009). “xDAWN algorithm to enhance evoked potentials: Application to brain–computer interface,” IEEE Transactions on Biomedical Engineering, vol. 56, no. 8, pp. 2035–2043. [Google Scholar]
58. U. Güçlü, Y. Güçlütürk and A. Samraj. (2010). “A novel approach to improve the performance of the P300 speller paradigm,” in IEEE Int. Conf. on Systems, Man and Cybernetics, Istanbul, pp. 3786–3790. [Google Scholar]
59. E. Loup-Escande and A. Lécuyer. (2014). Towards a user-centred methodological framework for the design and evaluation of applications combining brain–computer interfaces and virtual environments: Contributions of ergonomics, Research Report, Rennes, France. [Google Scholar]
 | This work is licensed under a Creative Commons Attribution 4.0 International License, which permits unrestricted use, distribution, and reproduction in any medium, provided the original work is properly cited. |