DOI:10.32604/cmc.2021.014201
| Computers, Materials & Continua DOI:10.32604/cmc.2021.014201 | |
| Article |
On Computing the Suitability of Non-Human Resources for Business Process Analysis
1Department of Computer Science, COMSATS University Islamabad, Lahore, Pakistan
2Punjab University College of Information Technology, University of the Punjab, Lahore, Pakistan
3Universiti Teknologi PETRONAS, Bandar Seri Iskandar, Tronoh Perak, Malaysia
4School of Computer Science, Guangzhou University, Guangzhou, 510006, China
5Department of Computer Science and Information Technology, Superior University, Lahore, Pakistan
*Corresponding Author: Abid Sohail. Email: abidbhutta@cuilahore.edu.pk
Received: 05 September 2020; Accepted: 27 October 2020
Abstract: Business process improvement is a systematic approach used by several organizations to continuously improve their quality of service. Integral to that is analyzing the current performance of each task of the process and assigning the most appropriate resources to each task. In continuation of our previous work, we categorize resources into human and non-human resources. For instance, in the healthcare domain, human resources include doctors, nurses, and other associated staff responsible for the execution of healthcare activities; whereas the non-human resources include surgical and other equipment needed for execution. In this study, we contend that the two types of resources (human and non-human) have a different impact on the process performance, so their suitability should be measured differently. However, no work has been done to evaluate the suitability of non-human resources for the tasks of a process. Consequently, it becomes difficult to identify and subsequently overcome the inefficiencies caused by the non-human resources to the task. To address this problem, we present a three-step method to compute a suitability score of non-human resources for the task. As an evaluation of the proposed method, a healthcare case study is used to illustrate the applicability of the proposed method. Furthermore, we performed a controlled experiment to evaluate the usability of the proposed method. The encouraging response shows the usefulness of the proposed method.
Keywords: Business process management; business process improvement; process warehouse; data warehouse; resource suitability component; resource suitability; health care; artificial intelligence
Organizations continually strive to improve the execution of processes for delivering quality services to its customers. In this context, Business Process Management (BPM) has established itself as a vital instrument [1] because it offers a structured, coherent, and consistent way of modeling, executing, and analyzing business operations [2]. However, it is widely acknowledged that there are two reasons for inefficiencies in the execution of business processes [3,4]: (i) Structural weakness in the process models, and (ii) Inappropriate resource assignment. Corresponding to these two reasons, there are two ways to continuously improve the performance of processes, process redesign and resource management. Where, process redesign deals with altering the structure of a process, and resource management deals with rearranging the resources associated with activities of a process.
In the BPM lifecycle, historic analysis of resources (formally, posterior analysis) refers to the post-process enactment analysis, as it requires an execution log that is generated during the enactment of a process. The execution log is widely acknowledged as a very useful data source for various purposes, such as compliance checking [5]. However, the provision of effective information to support the analysis is a challenging task due to the following reasons: (a) Log files are maintained for a very short span of time, and (b) It is not optimized to support performance analysis. An alternative to that is the use of a process-oriented data warehouse, called Process Warehouse (PW). PW is a specialized warehouse that is similar to the classical data warehouse as it captures data in a multi-dimensional structure [6], whereas, it is materialized by the integrating three data sources, workflow objects, business objects, and process execution log [7]. Several studies have identified that a key challenge associated with the use of PW is that it contains large volume of information which may not be necessarily relevant for every analysis [8,9]. Consequently, the presence of excessive information complicates the task of the process analysis for inexperienced decision-makers [10]. Therefore, a method is desired that can provide access to relevant data and also facilitate the way resource analysis is performed.
Our existing effort to business process analysis [11–16] has categorized resources into two types, human and non-human resources. The studies have established that the two types of resources (human and non-human resources) have different behaviors and thus they have a different impact on process performance. This is aligned with other established studies [4], which has argued that human and non-human resources collectively optimize the process performance. However, it is observed that the behavior of the two types of resources is not similar. Furthermore, Ouyang et al. [14] has also argued that living beings and non-living beings, such as surgical equipment, do not have similar behaviors. It is because, ‘non-living beings’ are static and do not affect process performance due to any subjective interest or skill [17]. Therefore, the performance of both classes should be evaluated differently using different parameters.
To that end, in a previous study, we developed an Integrated Resource Classification Framework (IRCF) [11]. According to the framework, true optimization of process performance requires an in-depth analysis of human and non-human resources. Subsequently, other studies were conducted that to developing methods for the performance analysis of human resources [18–20]. However, no study has been conducted to develop methods for the performance analysis of the non-human resources. The specific aim of this study is to propose a method for evaluating the suitability of non-human resources using PW. In particular, we first propose a theoretical suitability model to identify the various factors which should be considered for evaluating the suitability of non-human resources for a given task. Subsequently, the theoretical model is used as a basis for developing a novel method for the suitability of non-human resources. A key benefit of the method is that it can be used by domain experts having limited knowledge of PW.
The rest of the paper is organized as follows: Section 2 provides an overview of the Integrated Resource Classification Framework, Section 3 presents the suitability model for non-human resources which serves as a basis for the proposed method presented in Section 4. Illustration of the method for a healthcare case study and the details of the controlled experiments are presented in Sections 5 and 6 respectively. The paper concludes in Section 7.
2 Integrated Resource Classification Framework (IRCF)
Organizations are continuously striving to improve their processes through the appropriate assignment of resources. Resources include human agents (human resources) and devices (non-human resources) which are coupled to execute activities of a process. While, several studies, such as [4], have acknowledged that resources play a pivotal role in the optimal execution of processes, some studies argue that “the two types of resources have a different impact on the performance of a process. Therefore, their performance should be evaluated differently, i.e., the same criteria should not be used for the evaluation of both types of resources” [11,12]. Therefore, to evaluate the performance of the two types of resources, we previously introduced a framework, called Integrated Resource Classification Framework (IRCF) [11]. The framework is composed of three different types of relationships that should be considered for resource management. Fig. 1 shows the three types of relationships between a task and the two types of resources, human and non-human resources. A brief overview of the three types of relationships are as follows:
• The relationship between human resources and a given task should be determined in terms of the ability of the human resource to perform the task, which is termed as competency. It determines how well a human resource can perform the task.
• The relationship between a non-human resource and a task is determined in terms of its appropriateness for the task, which is termed as suitability. It determines how well-fitting a non-human resource is for a task.
• The relationship between human and non-human resources is determined in terms of the inclination of human agents to use certain non-human resources for a specific task, which is termed as preference. Where, the preference defines how comfortable human resources are to use a given non-human resource for a given task.
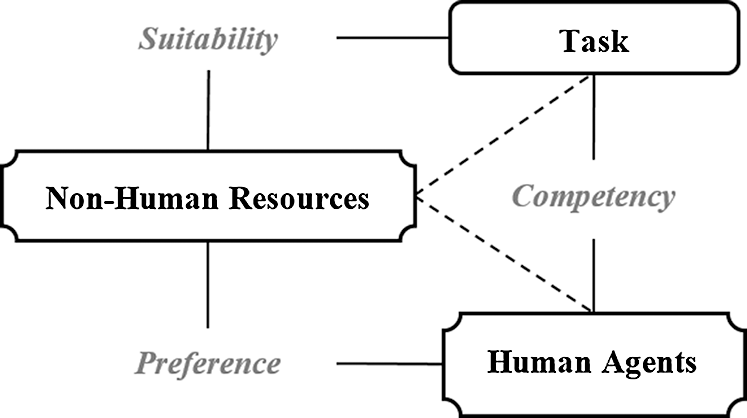
Figure 1: Integrated resources classification framework [11]
In our previous work [18–20], we focused on developing a method for the performance analysis of analyses human resources. However, no study has been conducted to develop a method for the performance analysis of non-human resources. To that end, firstly, we have proposed a theoretical model to evaluate the suitability of non-human resources, and subsequently use it to propose a method for evaluating the suitability of non-human resources.
A model is used to describe ‘something from the real world’ and metamodel is ‘a surrogate model that describes what can be modeled’ [21]. In this section, we present a metamodel to evaluate the suitability of non-human resources for a given task. The metamodel represents the concepts that should be used to evaluate the suitability of non-human resources for a given task. We contend that the evaluation of non-human resources with respect to the task is represented by the degree of appropriateness of non-human resources for the task.
Why suitability. Zur Muehlen [4] argued that a role provides the privilege boundaries and capabilities for human resources during the execution of activities. For instance, a nurse may gain the skill to operate on a patient but she is not allowed to lead an operation because this task is solely bound to the doctor’s role. Due to the access privilege boundary, the support for this feature is available in business process management systems, such as Bizagi BPM Suite [22]. However, the support for assigning suitable non-human resources to tasks is not available in BPMS. In this study, we contend that non-human resources also have a non-trivial impact on process performance. Thus, without the appropriate combination of optimal non-human and human resources, process execution cannot be improved. This is in-line with Heravizadeh et al. [23] who has argued that the optimal execution of a task requires a suitable set of non-human resources matched with the competent human resources. It is also widely acknowledged that assigning a task to the domain expert (most competent) human resources optimizes process execution. However, it has also been observed that even a domain expert cannot improve process performance without the availability of an appropriate set of non-human resources. For example, if an unsuitable syringe is provided to a skilled nurse, she may not execute the task appropriately. Hence, the identification of suitable non-human resources is essential in the evaluation of the resource’s performance.
Essentials of Suitability: According to Heravizadeh et al. [23] and Loucopoulos et al. [24], suitability is categorized as a basic quality function for the measurement of process performance through non-human resources. In our context, it is the appropriateness of non-human resources for a task. We contend that reliability, accuracy, and completeness are three essential ingredients for measuring the appropriateness of non-human resources. Where, reliability refers to the ability of the non-human resources to perform the task. It is also defined as “the ability to maintain a specified level of performance when used under specified conditions” [23] and can be measured as a function of failure and success frequencies [24,25].
Completeness is defined as the ability to fulfill the requirements of the given task i.e., the minimum and maximum criteria sets for successfully executing a task. Completeness stems from Heravizadeh’s et al. [23] quality dimension of a robust totality and is defined as “the degree to which a function can function correctly even in the presence of invalid, incomplete or conflicting inputs.”
Accuracy measures the degree of success of the task completion with the device that is used for it. It is also defined as “the right or agreed results or effects with the needed degree of precision” [23].
The metamodel of the evaluation of suitability is presented below in Fig. 2. The figure shows the relationship between the three concepts (reliability, accuracy, and completeness) and an ordinal scale of 1 to 5 on which these values can be measured. Where, the value 1 represents that the non-human resource is completely unsuitable for the task, and value 5 represents that non-human resource is most suitable for the task.
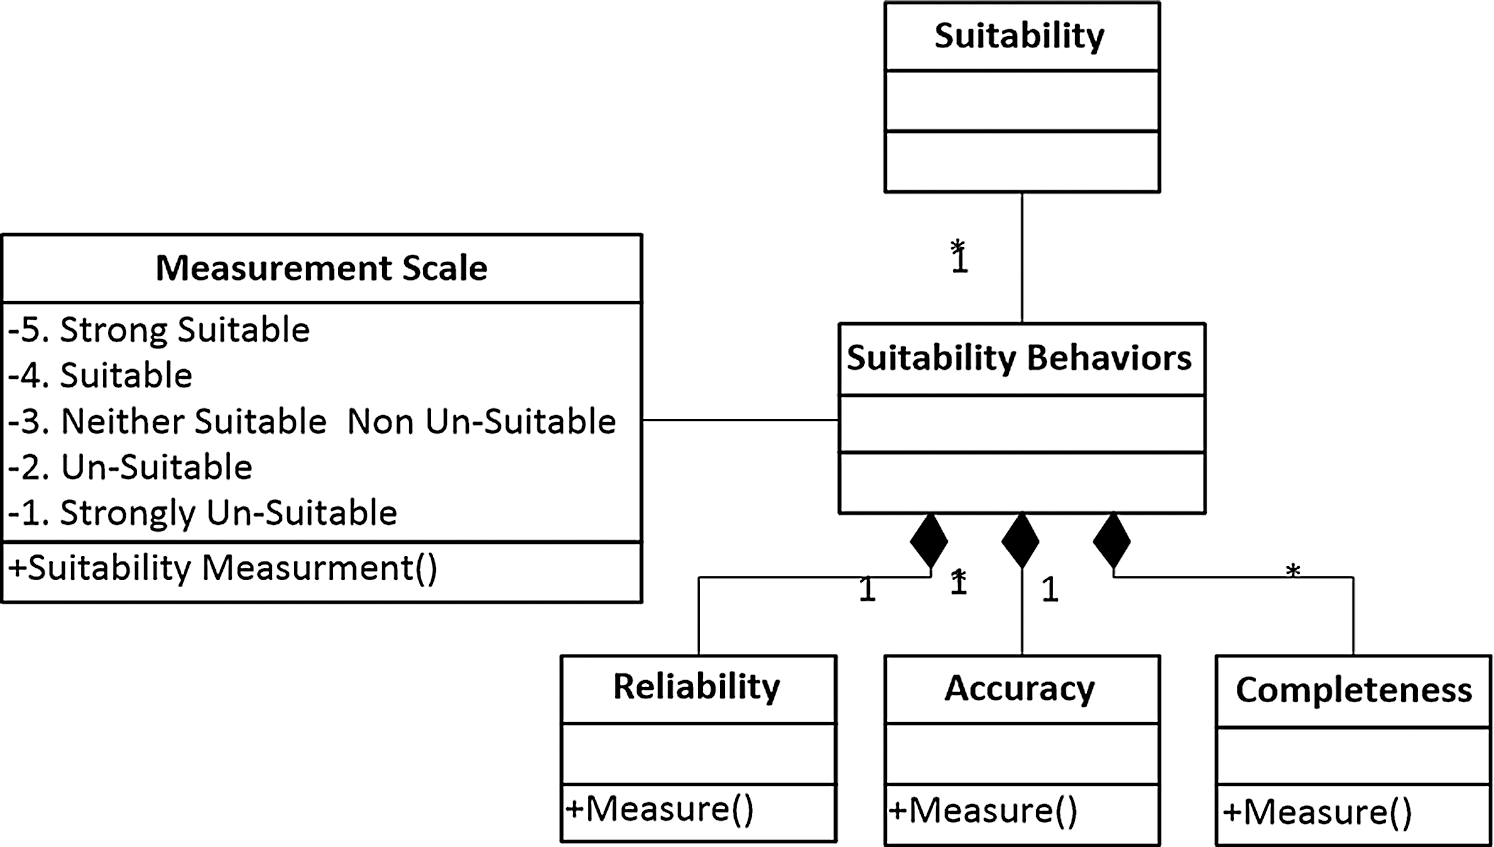
Figure 2: Resource suitability metamodel
4 Suitability Evaluation Method
In this section, we present a method that can guide the suitability analysis of non-human resources for a given task. That is, the method calculates the suitability score of non-human resources for a task based on the resource suitability metamodel introduced in the preceding section. Specifically, the method consists of three steps, where the input to the first step is the role whose corresponding resource-task suitability needs to be evaluated, and the output of the third step is the suitability score of a non-human resource for the task. The steps and their relationships are shown below in Fig. 3, followed by an discussion of each step of the method.
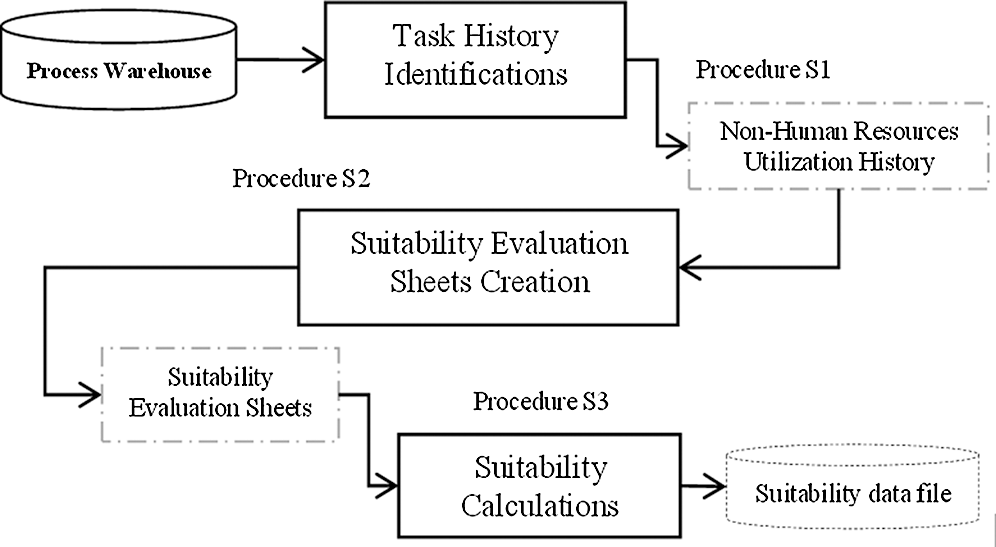
Figure 3: The suitability evaluation method
4.1 Task History Identifications
The first step aims at identifying the history of tasks performed by a role and the used resources. The input to this step is a role whose tasks are under consideration for computing suitability. To generate the input tasks for this step, we rely on an SQL query. The algebraic query to extract the tasks list for a specific role is as follows:

Consider that we are interested in evaluating the suitability of the tasks performed by ‘Nurse’. The query can be formulate as follows:
| SELECT TaskID, TaskName, Role |
| FROM dim_task, dim_WFO, dim_time |
| WHERE dim.taskid=dim_WFO.taskid |
| AND dim_WFO.taskid=dim_time |
| AND Time > = ‘1-1-2015’ |
| AND Time = < ‘1-1-2015’ |
| AND Role=‘nurse’ |
| GROUP BY Role;__ |
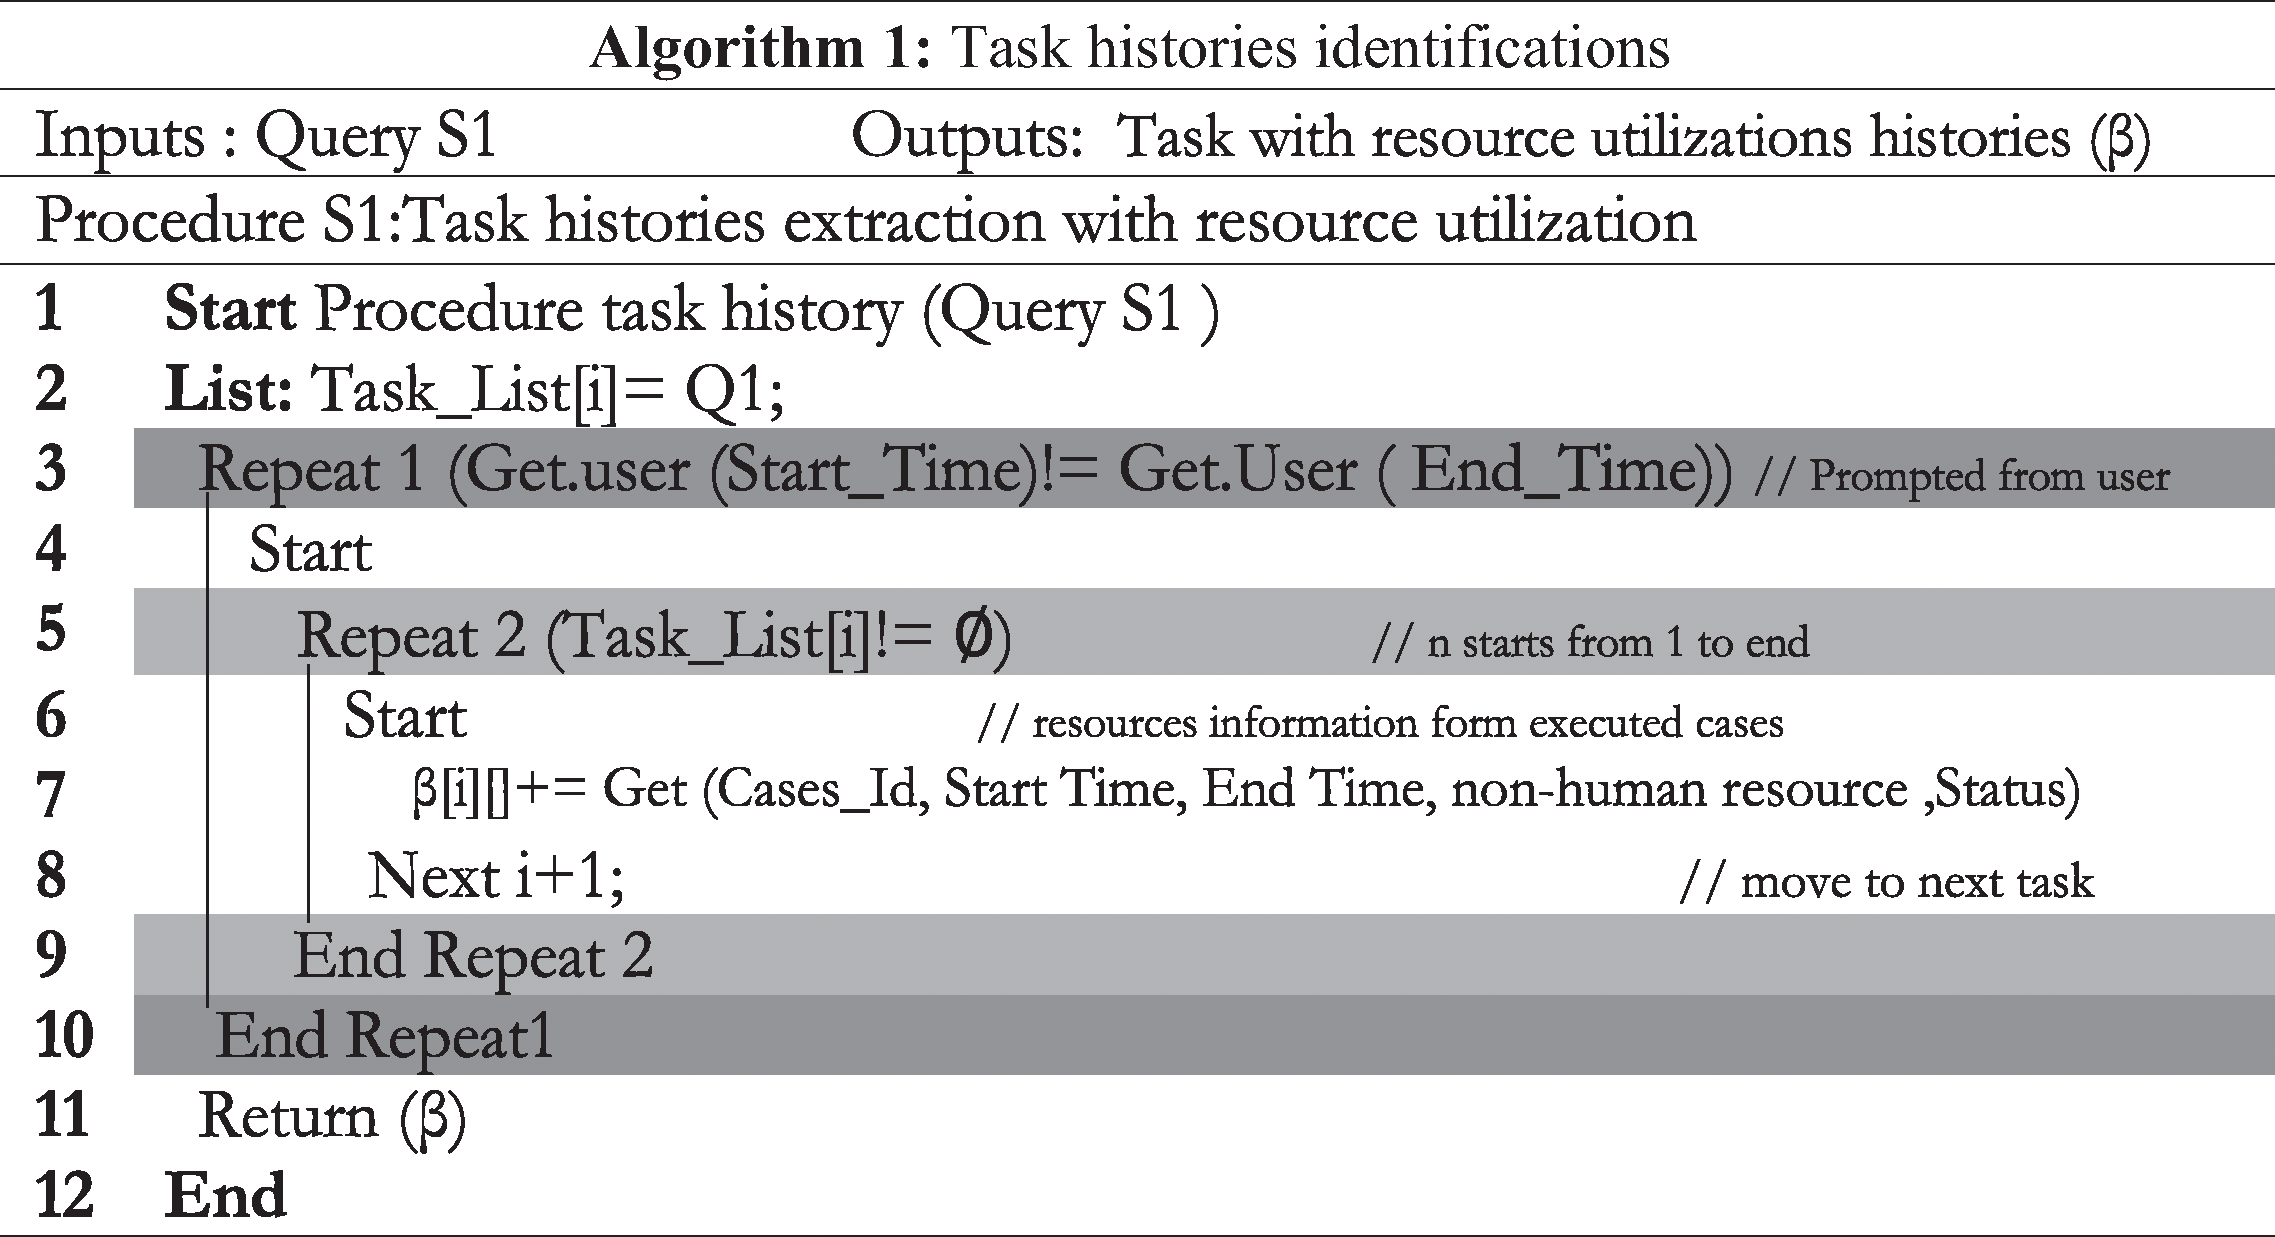
The output of this query is the list of tasks of the given role. Using the task list as input, the first algorithm of our method extracts the instances of process execution in which the task was used. Also, the methods extracts start time, end time, the non-human resources used, and the status of the task, i.e., whether the task is in progress, completed, or paused. The output of this algorithm is a two-dimensional structure for each task which contains the output in a two-dimensional structure.
The two-dimensional structure  for a task t1 contains the identities of execution cases, the status of the task, whether it is successful, pending, or unsuccessful, and the status of each resource for the task, whether the resource was used or not used. In relational algebra, it can be represented as follows:

such that,  represents the list of tasks for the role, and

where, R1, R represents the list of resources used in the task.
4.2 Suitability Evaluation Sheet Creation
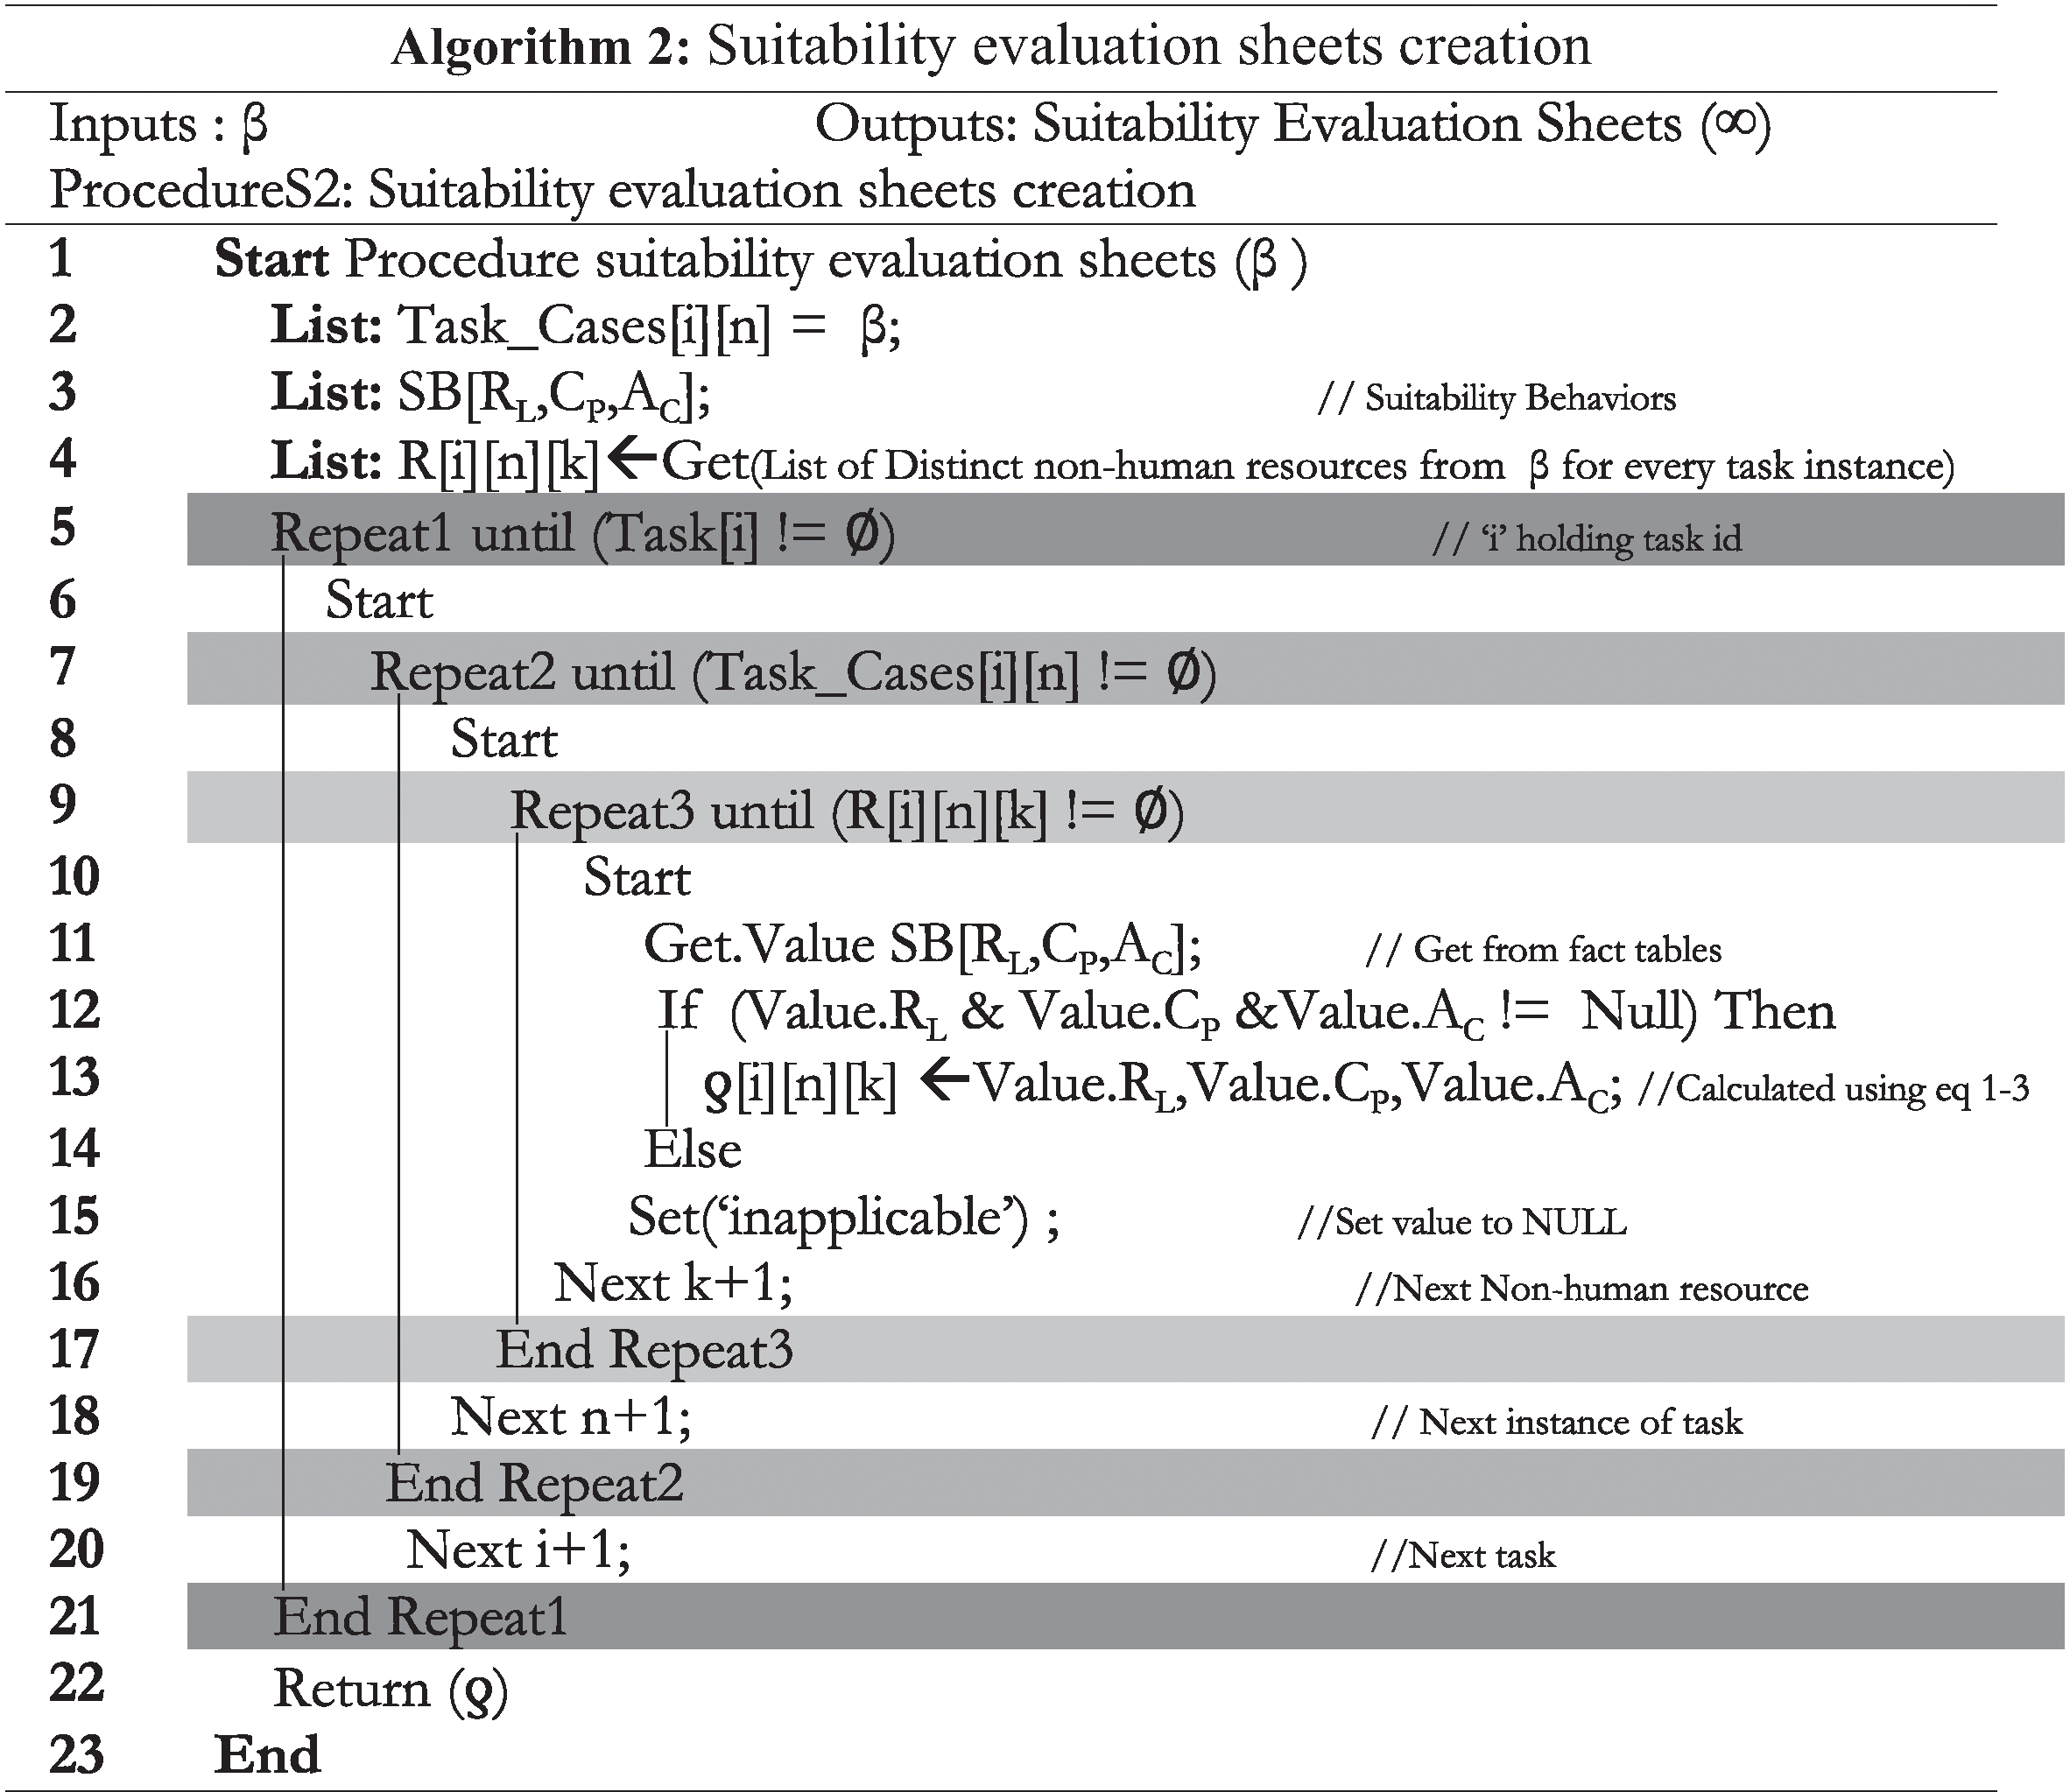
The input to this step is the two-dimensional structures generated in the preceding step, and this step aims to create a suitability evaluation sheet for each task in the task list. This particular step uses the suitability evaluation metamodel presented in Fig. 2. Recall, in Section 4 we established that the suitability score of a non-human resource is an aggregation of reliability, completeness, and the accuracy scores.
In the second step of the method, the reliability scores of a resource is computed by extracting data from the fact table of PW and using the extracted values in the equations for reliability, completeness, and accuracy. The reliability is defined as follows:

In the equation, RL represents the reliability of non-human resources for a task, TC represents the total number of cases (in all task executions) in which the resource r was utilized, and UC represents the total number of cases in which the specific resource was utilized in different instances;

In the above equation, CP represents the completeness of non-human resources for a task, and TS represents the total number of times the task was successfully completed.

In the above equation, AC represents the percentage accuracy of a non-human resource for a task, and ATC represents the total number of accurately executed instances.
The three equations (a, b, and c) are used in Algorithm 2 to create a suitability evaluation sheet. The outcome of this algorithm is a two-dimensional structure  for task t1 that contains the resources used in the task, reliability score, completeness score, and the accuracy score for each resource in the contest of the task.
The two-dimensional structure  for a task t1 contains the identities of execution cases, the resources used for the task (R1, R
 ), reliability score, completeness score, and accuracy score for the resource. In relational algebra, it becomes:

where,  represents the list of tasks for the role, and

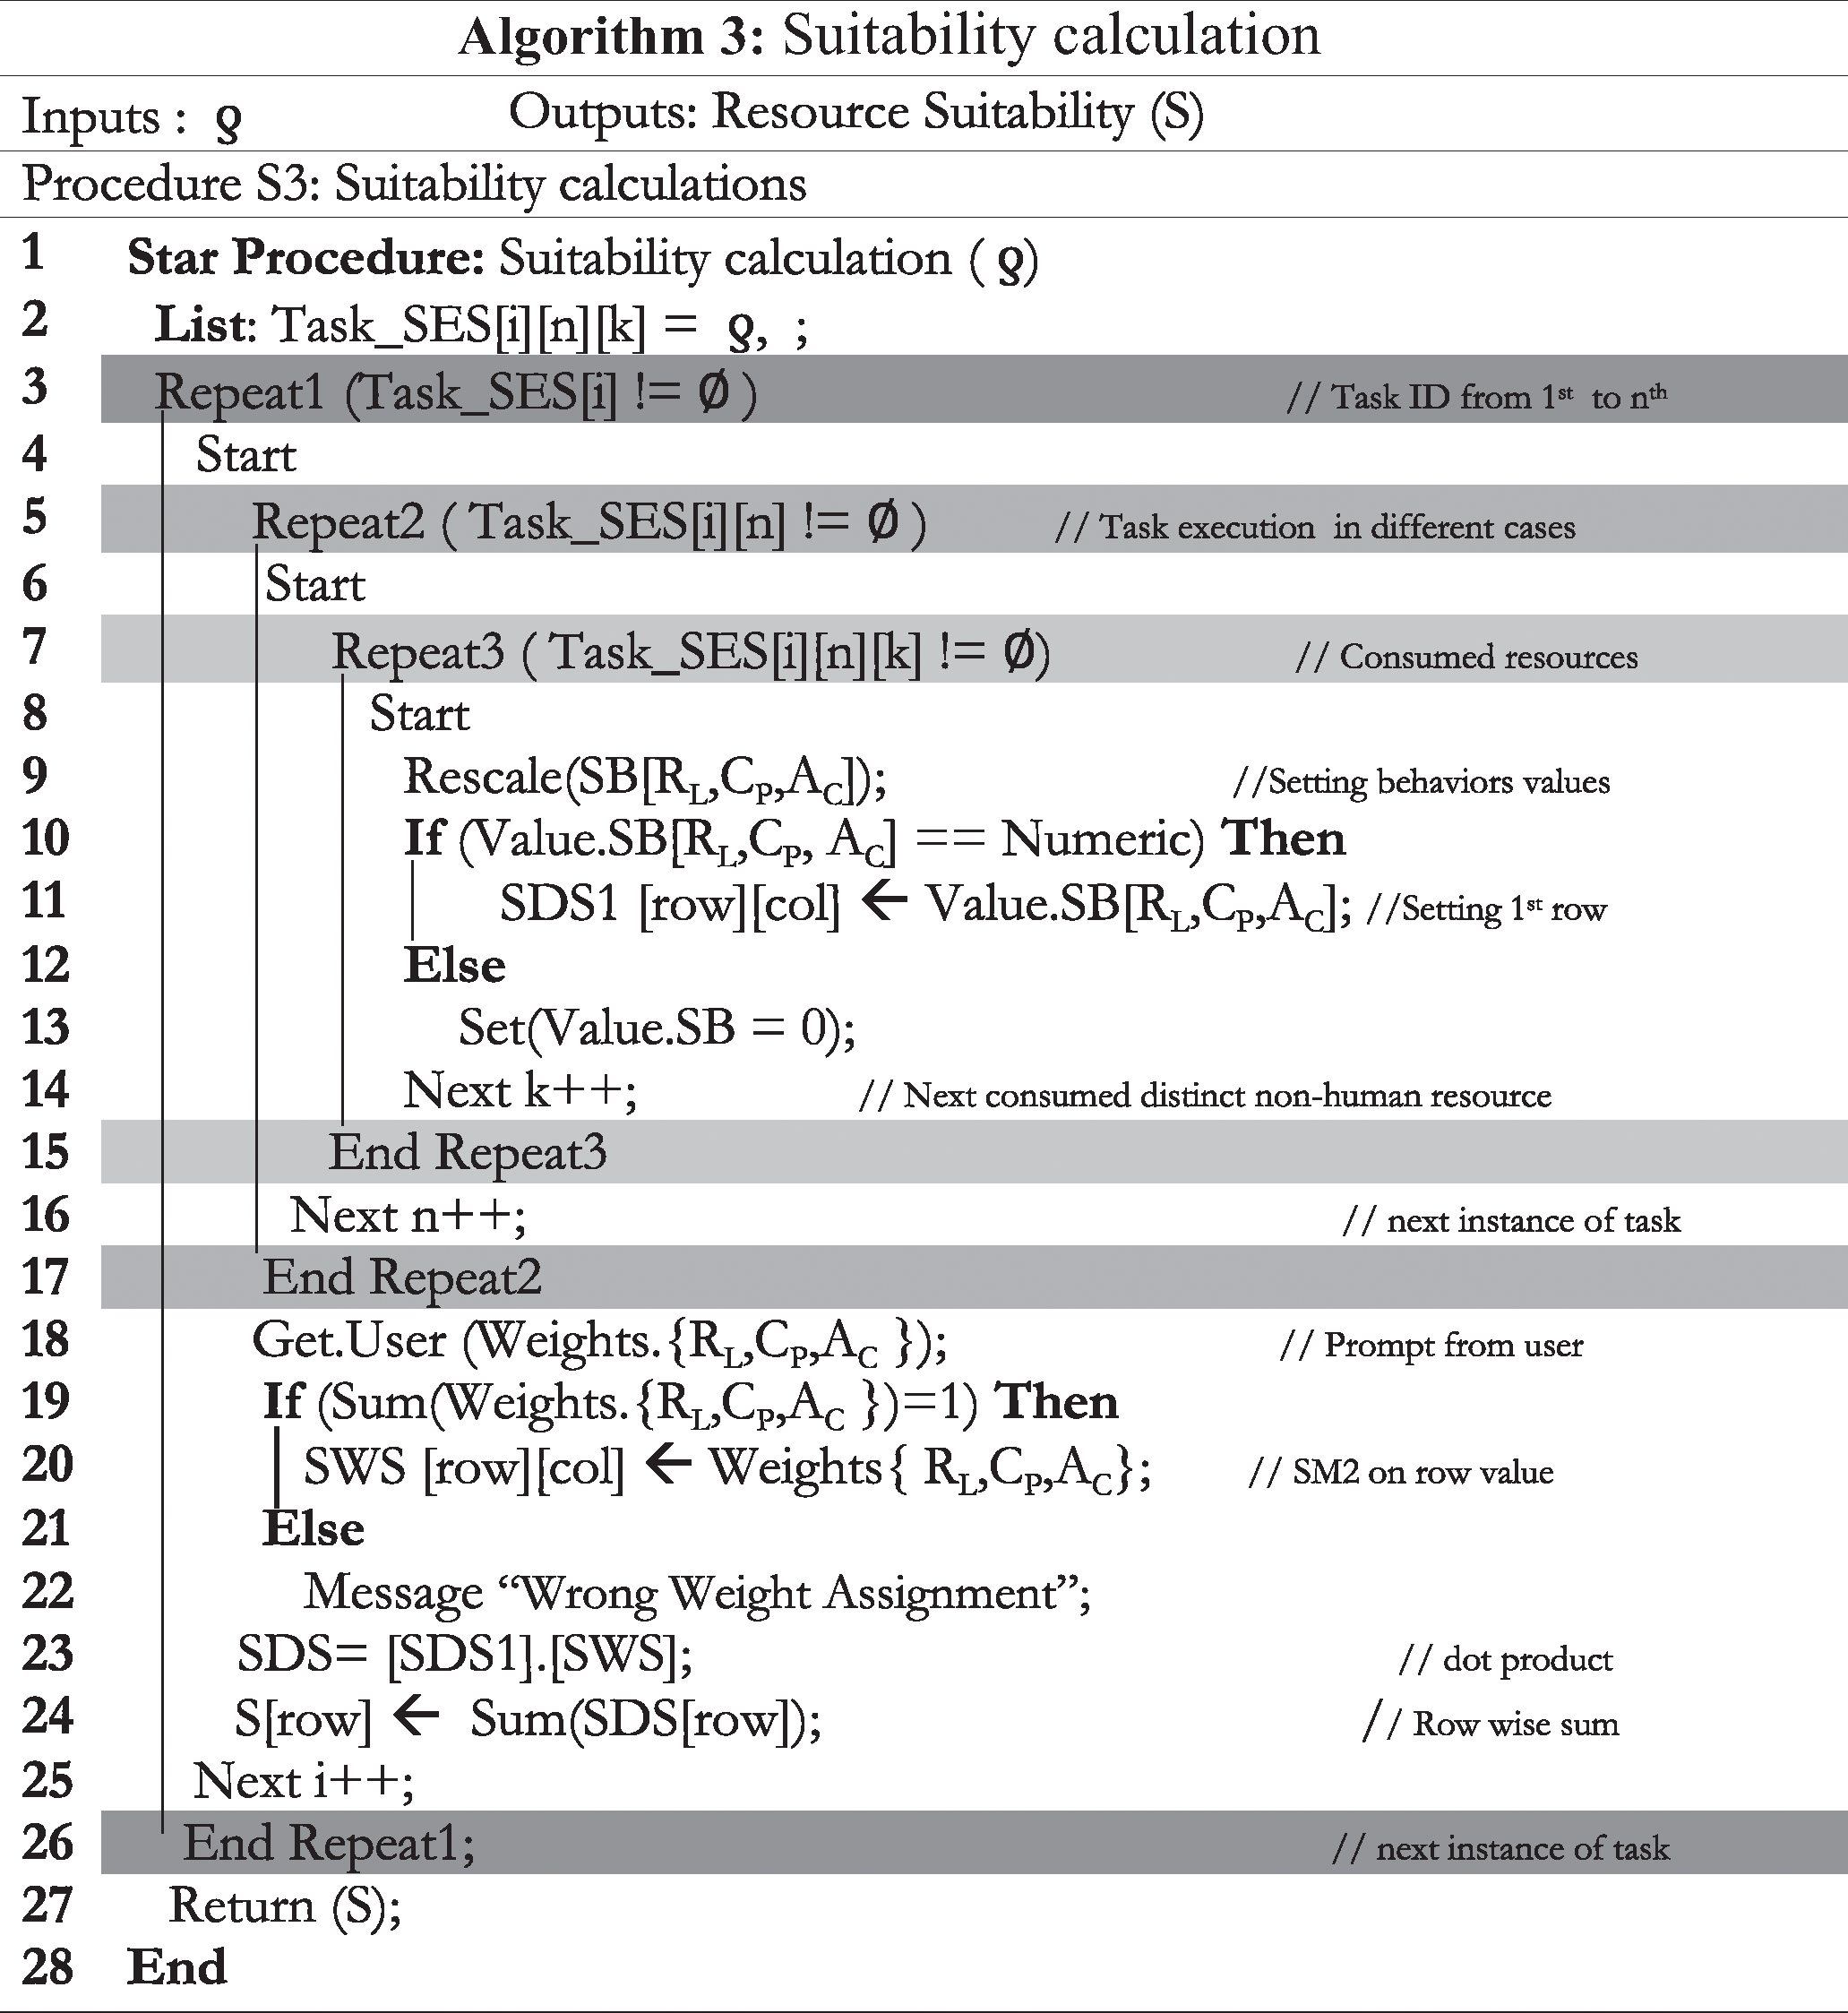
This step aims to generate the suitability score of each resource-task pair by taking input the set of two-dimensional structures ( ) generated from the preceding step. The algorithm in this step takes the suitability evaluation sheet as input, normalizes the score to a range of 1–5, and represent it as a matrix. The x-axis in the matrix represents the list of resources used in a task and the y-axis represents the suitability scores of the resource, i.e., normalized completeness, accuracy, and reliability scores. Subsequently, a weighting scheme is used to generate a suitability score of each resource in terms of completeness, accuracy, and reliability. The aim of the weighting scheme is to provide flexibility to the user to adjust the effect of each behavior. The rules for weight assignments are as follows:
• Weights of suitability behaviors (reliability, completeness, and accuracy) shall vary between 0 and 1 in such a way that the total score of the three behaviors remain between 0 and 1.
• The default weight is 0 to nullify the effective of a behavior on the overall suitability score.
The algorithm then takes a dot product of the two matrix, and row-wise summation will produce suitability for the resource-task pair which represents the suitability of each resource for a task.
In this section, we illustrate the use of our proposed method for a healthcare process. However, it requires a materialized PW which is typically not publicly available due to confidentiality reasons. As an alternative to that we designed a PW and used synthetic data to populate it. More specifically, firstly, we designed a process model of ‘maternity regular visit’ using BPMN, which is the standard process modeling language, and designed the PW. Subsequently, we implemented a PLG V1.0 to generate synthetic data. The reason for implementing a new log generated is that the existing models, such as Burattin’s PLG [26], merely generates event logs of the process models in Petri nets, whereas we used BPMN for designing our process model. A key feature of the PLG V1.0 is that it can be used to populate a log of five different patterns. The patterns are presented in Tab. 1 and a screenshot of the implementation is shown presented in Fig. 4.
Table 1: All possible case instance scenarios ‘maternity regular visit’

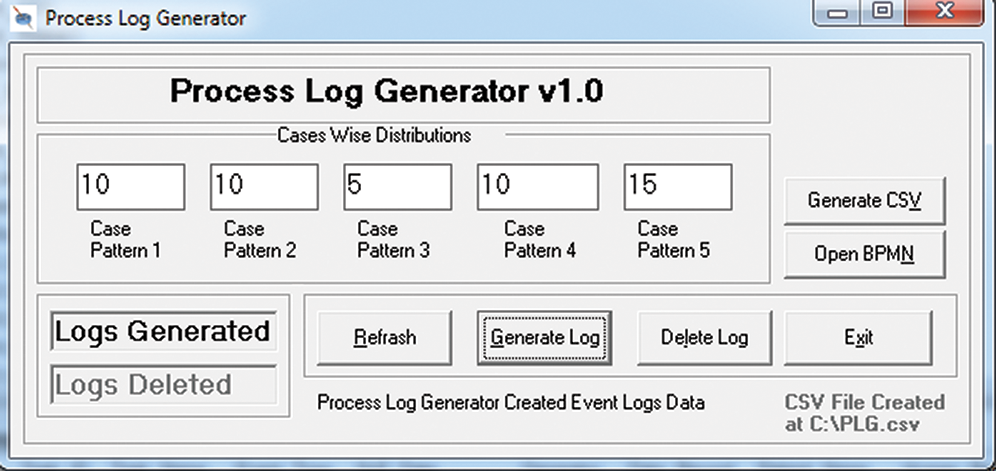
Figure 4: A screenshot of the process log generator (PLGV1.0) [10]
6 Healthcare Business Process Model
For the illustration, we have selected a business process for maternity regular visits from a Malaysian hospital. In this section, we introduce the business process, whereas, in the next section, we use it for illustration. To make the illustration closer to the real world, we visited a maternity clinic and observed all activities and sequence of activities over a period of time. It was observed that whenever a patient wants to visit a doctor, she has to request an appointment. If the appointment is granted, the patient is allowed to visit the doctor otherwise she is asked to wait for the appointment confirmation. If a patient is granted an appointment, the nurse will perform an initial check. For the first time visitor, the nurse takes blood and urine samples and sends them to the laboratory for examination.
For subsequent visits, the nurse performs three activities, measuring weight, blood pressure, and diabetic sugar level, and record them in the patient history card. During the visit, the doctor can see the test reports along with the patient history and can also perform ultrasound. However, if the doctor assesses that patient is unstable and ready to deliver the child, the patient is admitted to the hospital. Alternately, she is prescribed medicines and the patient is passed to a second nurse, who is responsible for post checkup activities, such as injecting medicine and forwarding to the pharmacy. Finally, the patient goes to the payment counter and pays the bill. The BPMN diagram of the maternity process is shown in Fig. 5.
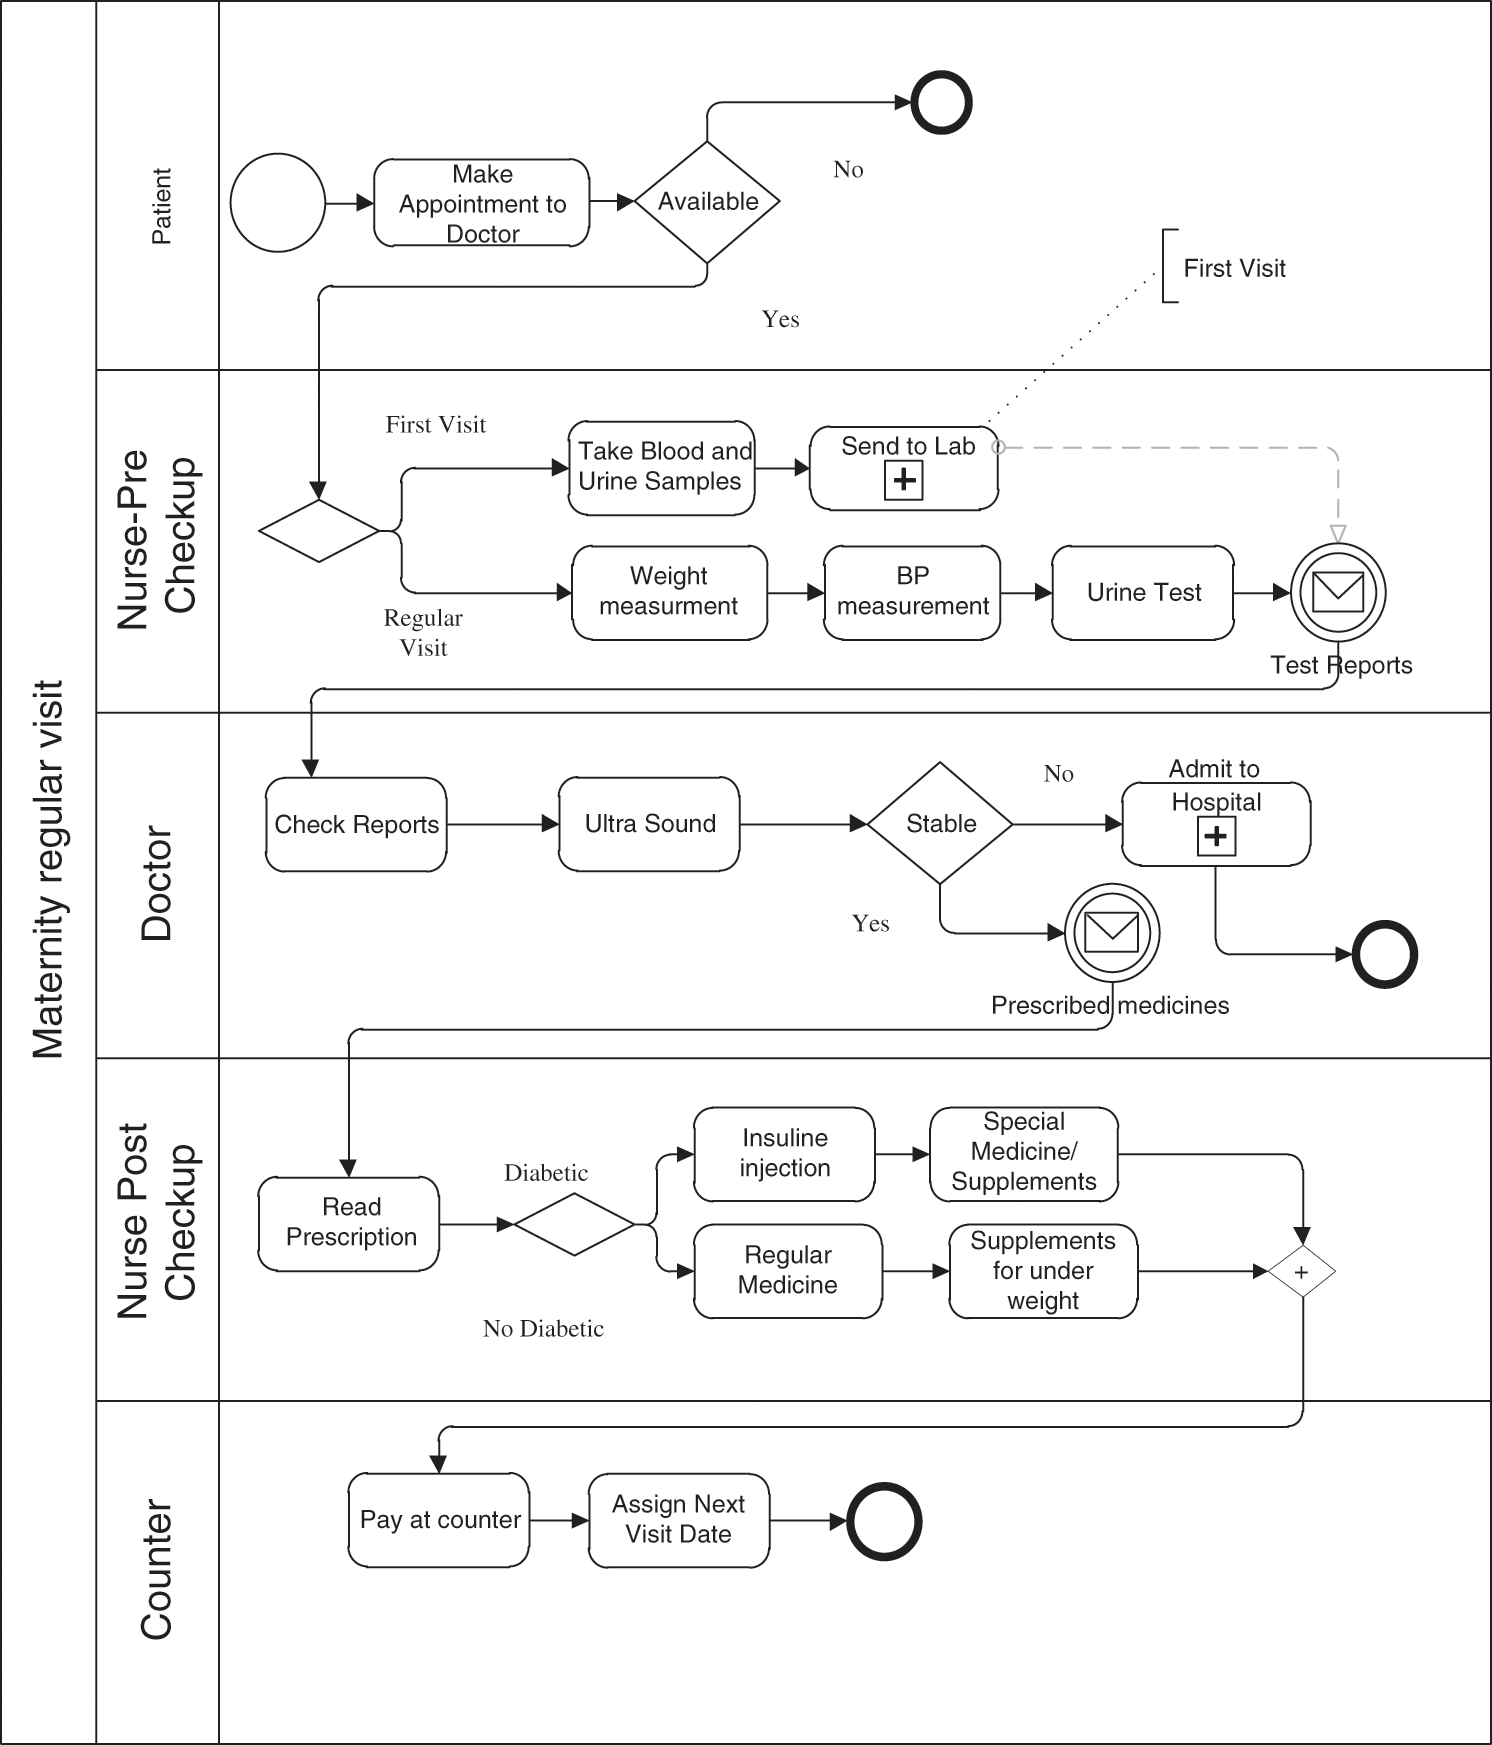
Figure 5: BPMN of ‘maternity regular visit’ business process [10]
The execution of the business process involves three nurses (n1, n2, n3) in role (r1) working at different positions (Senior Nurse, Junior Nurse), Doctor (n4) in role (r2) working as (lady doctor, surgeon), and a counter clerk in (r3) working at position (junior clerk). Besides that, the following non-human resources are involved, weight machine, blood pressure checker, urine test strips, ultrasound machine, injections, and medicines. One trace of an event log from PLG v1.0 for Case pattern 1 is shown in Tab. 2. The generated traces cover two types of events, start event and end event, where TaskID TA represents ‘Appointment with a doctor.’ Each entry in the process log is uniquely identified by Data_Record filed value. The values for CaseID and TasksID will remain the same for start and end, event types. For the experiment, the PLG v1.0 generated 780 traces to populate the execution log.
Table 2: One instance of PLG 1.0 generated log for pattern1 (event Log)

As discussed earlier, due the unavailability of real process log data, we generated synthetic data using PLG V1.0. That is, we used the following settings,  ,
,  ,
,  ,
,  , and
, and  . As a result, 3386 records were generated with two different start and end event types. We used the MSQL Server 2008 to store and retrieve the process log. Below, we illustrate each step of the method.
7.1 Task History Identifications
The task history identification step explores the list of tasks and non-human resources used in those tasks against a set of roles. The query and an excerpt of the output are shown in Tab. 3. The query extracted 1693 records, however, due to space limitation, we have selected the ‘injection insulin’ task to explore the expected results from the method. This task was instantiated 76 times. For these instances, the output of the first step is shown in Tab. 4.
Table 3: Identifications of the task list for the role of ‘Nsurse’

Table 4: Task history of ‘injection insulin’

7.2 Suitability Evaluation Sheet Creation
The second step aims to produce values for suitability behavior, in terms of reliability, completeness, and accuracy. An excerpt from the suitability evaluation sheet for the ‘Injection insulin’ task is shown in Tab. 5.
Table 5: Task suitability evaluation sheet for one instance

The output from the preceding step, the suitability evaluation sheet, is taken as the input of this step. The values are then normalized to a range of 1–5 and represented as a matrix in Fig. 6. The matrix for one task is represented as SDS1, whereas, the weighting scheme given as input by the user is shown as the SWD matrix. The dot product of the two products leads to generating SDS. Finally, row-wise summation produces suitability for the resource-task pair. In the figure, the total suitability score for each resource (R1, R2,  R4) is represented by S.
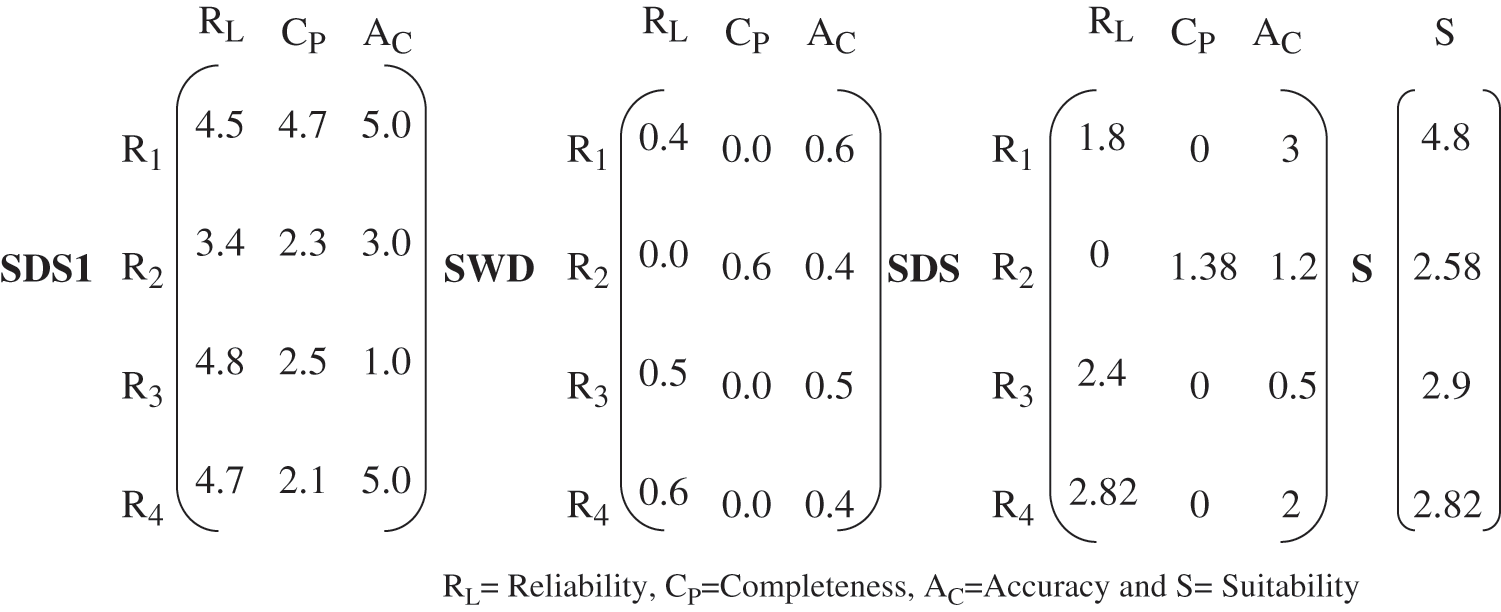
Figure 6: Suitability’s calculations of task ‘Injection insulin’ (procedure S3, an example output)
For each reading, the final output of the suitability evaluation method is shown in Tab. 6, which is annotated with linguistic terms that vary from strongly suitable to strongly unsuitable.
Table 6: Resource suitability evaluation final output

For the evaluation of the proposed method, we have used Hong’s Technology Acceptance Model [27] due to two reasons: (a) The model is based on the famous Technology Acceptance Model [28] and the IS Success Model [29], and (b) The model is customized to adjust the factors affecting data warehouse success [30]. For the experimentation, eleven respondents with computing and data warehousing knowledge were randomly selected from the University of Technology Petronas, Malaysia. The participants include faculty members, graduate students, and undergraduate students. For the study, the participants were asked to analyze the suitability of non-human resources for the maternity process, without any additional help. Subsequently, we presented our method and demonstrated the use of our method using small examples. Thereafter, participants were asked to use our proposed method for repeating the same task.
The results of the post task survey are presented in Fig. 7. It can be observed from the figure that our method successfully presents relevant information to the user but the granularity is minimum which makes the information level strictly relevant with less flexibility. Although it reduces the freedom to use PW, however, we argue that the user always has the option to make use of the classical approach to use PW. Thus, we further advocate that the two approaches supplement each other and hence increases the usability of PW.
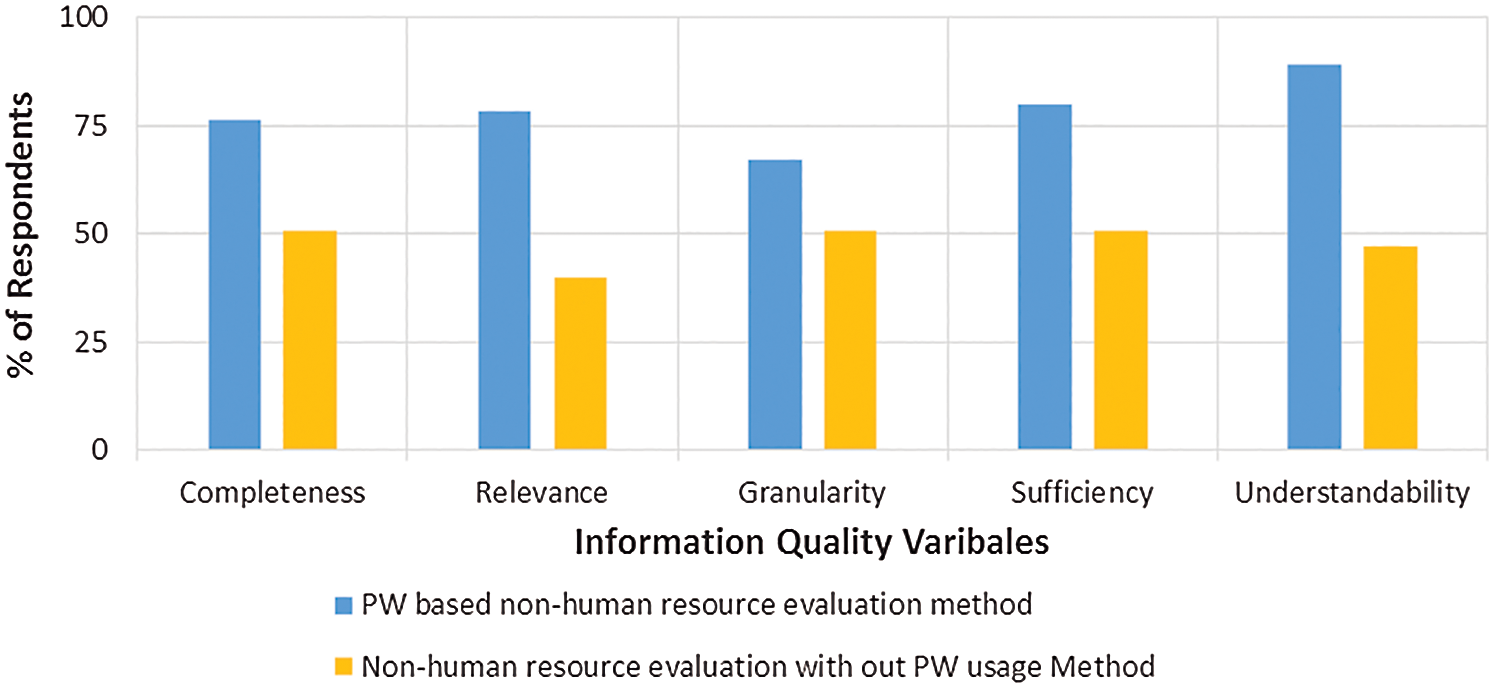
Figure 7: Information quality comparison, with and without our method
For analysis of the responses, faculty members, as well as the PhD students, were considered experts. Whereas, graduate students enrolled in a course on business process management were considered intermediate respondents, whereas, the undergraduate students were considered novice respondents. Accordingly, our study participants include three expert, four intermediate, and four novice respondents. Fig. 8 shows a comparison of the survey results using our proposed method and without using our proposed method. From the graph, it can be observed that no significant differences were observed between all three response groups indicating that each group had equally perceived all variables while using our method.
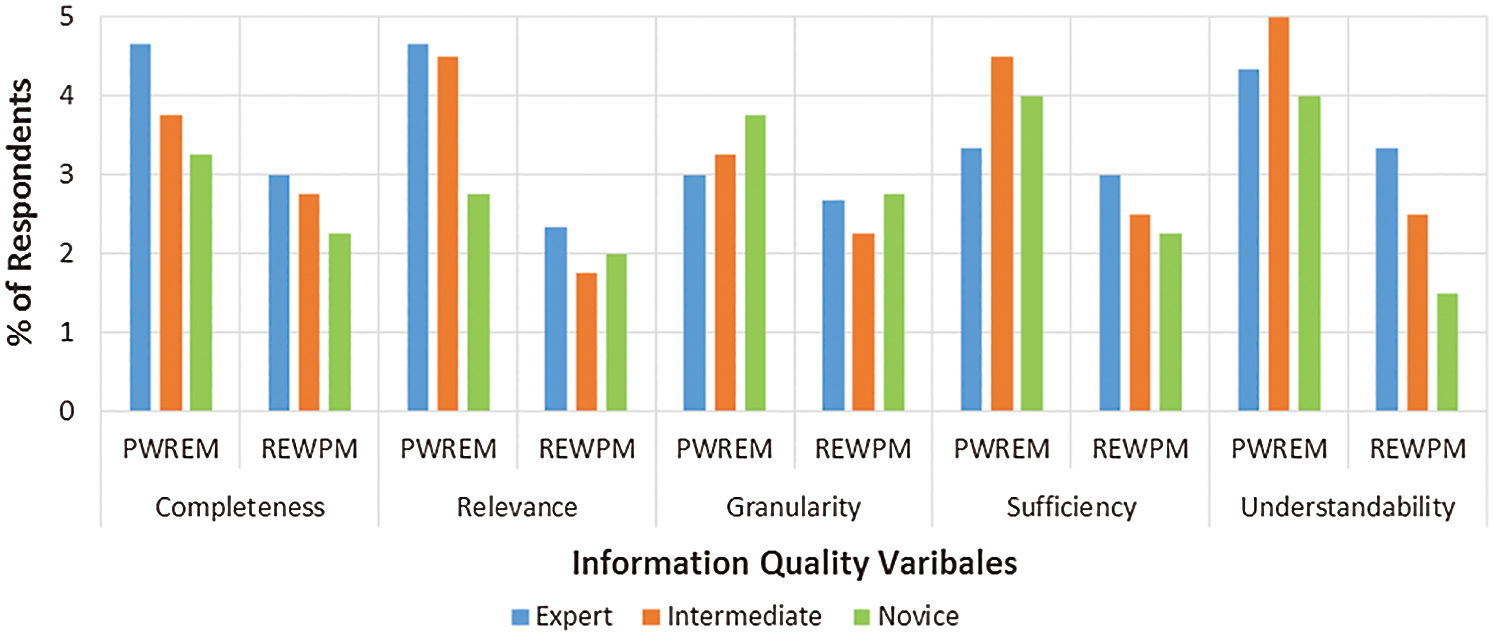
Figure 8: Comparison of respondent groups
Analysis of process execution is very much desired because it serves as a base for taking improvement decisions. There are two major types of business process analyses, structural and resource level. The structural analysis deals with analyzing the arrangement of activities and corresponding improvement deals with rearranging healthcare activities. On the other hand, resource analysis deals with analyzing the resources associated with each activity of the process, and the corresponding improvement deals with reassigning resources to activities.
In this study, we contend that there are two types of resources, human and non-human resources and they differ in terms of their behavior and impact on process performance. Thus they should be analyzed differently. However, no work has been done on evaluating the suitability of non-human resources in processes. Consequently, it becomes difficult to identify and subsequently overcome the inefficiencies caused by the non-human resources in delivering services to the customer. To address this problem, we have presented a three-step method that can be used to evaluate the suitability of the resource-task pair. The method is rooted in a suitability model that includes the different concepts which should be considered for the suitability analysis of task-resource pair.
Particularly, the method can guide the use of process warehouse for identifying non-human resource deficiencies in business processes. Applicability of the proposed method is demonstrated with a healthcare case study and an empirical study to evaluate the usability of the proposed method. The encouraging results of the study reflect the usefulness of the proposed method.
Funding Statement: The author(s) received no specific funding for this study
Conflicts of Interest: The authors declare that they have no conflicts of interest to report regarding the present study.
References
1. W. M. P. Van der Aalst. (2013). “Business process management: A comprehensive survey,” ISRN Software Engineering, vol. 2013, no. 1, pp. 1–37.
2. M. Weske. (2012). Business process management architectures. In: Business Process Management SE-7. 2 ed., Berlin Heidelberg: Springer, pp. 333–371.
3. L. C. L. Chen, T. X. T. Xue and A. Y. A. Yang. (2009). “Business process continuous improvement system based on workflow mining technology,” in Proc. World Congress on Computer Science and Information Engineering, Los Angeles, CA, USA, pp. 414–418.
4. M. Zur Muehlen. (2004). “Organizational management in workflow applications–-issues and perspectives,” Information Technology and Management, vol. 5, no. 3, pp. 271–291.
5. A. Sohail and D. D. Dominic. (2014). “A unified framework for business process intelligence,” in Proc. of the First Int. Conf. on Advanced Data and Information Engineering (DaEng-2013Batu Pahat, Johor, Malaysia, pp. 437–444.
6. D. Grigori, F. Casati, M. Castellanos, U. Dayal, M. Sayal et al. (2004). “Business process intelligence,” Computers in Industry, vol. 53, no. 3, pp. 321–343.
7. M. Zur Muehlen. (2001). “Process-driven management information systems combining data warehouses and workflow technology,” in Proc. of the Int. Conf. on Electronic Commerce Research (ICECR-4Dallas, USA, pp. 550–566.
8. A. Sohail, P. D. D. Dominic and K. Shahzad. (2014). “A Process warehouse based resource suitability evaluation method for business process improvement,” in Proc. Int. Conf. on Computer, Communications, and Control Technology (I4CTKedah, Malaysia, pp. 75–79.
9. M. K. Shahzad. (2012). “Improving business processes using process-oriented data warehouse,” Ph.D. dissertation, KTH Royal Institute of Technology, KTH Sweden.
10. A. Sohail. (2015). “Process warehouse based resource evaluation approach for business process analysis,” Ph.D. dissertation, Universiti Teknology PETRONAS, UTP, Malaysia. [Google Scholar]
11. A. Sohail, P. D. D. Dominic and K. Shahzad. (2016). “Business process analysis: A process warehouse based resource preference evaluation method,” International Journal of Business Information Systems, vol. 21, no. 2, pp. 137–161. [Google Scholar]
12. A. Sohail, P. D. D. Dominic and K. Shahzad. (2014). “A process warehouse based resource performance evaluation method for business processes improvement,” in Proc. of the Int. Conf. on Computer and Information Sciences (ICCOINSKuala Lumpur, Malaysia, pp. 1–6. [Google Scholar]
13. Z. Huang, X. Lu and H. Duan. (2012). “A task operation model for resource allocation optimization in business process management,” Systems, Man and Cybernetics, Part A: Systems and Humans, IEEE Transactions on, vol. 42, no. 5, pp. 1256–1270. [Google Scholar]
14. C. Ouyang, M. T. Wynn, C. Fidge, A. H. M. Ter Hofstede and J. C. Kuhr. (2010). “Modelling complex resource requirements in business process management systems,” in Proc. of the ACIS 2010, Brisbane, Australia, pp. 1–12. [Google Scholar]
15. A. Sohail, P. D. D. Dominic and K. Shahzad. (2014). “A process warehouse based resource suitability evaluation method for business process improvement,” in IEEE Int. Conf. on Computer, Communications, and Control Technology, Langkawi, Malaysia, pp. 75–79. [Google Scholar]
16. J. Erasmus, I. Vanderfeesten, K. Traganos, X. Jie-A-Looi, A. Kleingeld et al. (2018). “A method to enable ability-based human resource allocation in business process management systems,” in IFIP Working Conf. on The Practice of Enterprise Modeling, Vienna, Austria, Springer, Cham, pp. 37–52. [Google Scholar]
17. I. Ajzen. (1991). “The theory of planned behavior,” Organizational Behavior and Human Decision Processes, vol. 50, no. 2, pp. 179–211. [Google Scholar]
18. J. Xu, C. Liu, X. Zhao and Z. Ding. (2013). “Incorporating structural improvement into resource allocation for business process execution planning,” Concurrency and Computation: Practice and Experience, vol. 25, no. 3, pp. 427–442. [Google Scholar]
19. A. Macris, E. Papadimitriou and G. Vassilacopoulos. (2008). “An ontology-based competency model for workflow activity assignment policies,” Journal of Knowledge Management, vol. 12, no. 6, pp. 72–88. [Google Scholar]
20. A. Kumar, R. Dijkman and M. Song. (2013). “Optimal resource assignment in workflows for maximizing cooperation, ” in Business Process Management, Beijing, China, Springer, Berlin, Heidelberg, pp. 235–250. [Google Scholar]
21. O. M. G. OMG. (2003). “Common warehouse metamodel (CWM) specification,” . [Online]. https://www.omg.org/spec/CWM/1.1/PD. [Google Scholar]
22. Bizagi, “Business process management (BPM) solutions. [Online]. Available: http://www.bizagi.com/. [Google Scholar]
23. M. Heravizadeh, J. Mendling and M. Rosemann. (2009). “Dimensions of business processes quality (QoBP),” in Int. Conf. on Business Process Management, Ulm, Germany, Springer, Berlin, Heidelberg, pp. 80–91. [Google Scholar]
24. P. Loucopoulos and F. Heidari. (2012). “Evaluating quality of business processes,” in Modelling and Quality in Requirements Engineering, Essays Dedicated to Martin Glinz on the Occasion of His 60th Birthday, MV-Wissenschaft Munster,Germany, pp. 61–73. [Google Scholar]
25. J. Li, L. Feng, L. Zhang, H. Dai, L. Yang et al. (2020). “Identifying game processes based on private working sets,” Computers, Materials & Continua, vol. 65, no. 1, pp. 639–651. [Google Scholar]
26. A. Burattin and A. Sperduti. (2010). “PLG: A framework for the generation of business process models and their execution logs,” in Int. Conf. on Business Process Management Workshops, Berlin, Heidelberg: Springer, pp. 214–219. [Google Scholar]
27. S. Hong, P. Katerattanakul, S. K. Hong and Q. Cao. (2006). “Usage and perceived impact of data warehouses: A study in Korean financial companies,” International Journal of Information Technology & Decision Making, vol. 5, no. 2, pp. 297–315. [Google Scholar]
28. F. D. Davis. (1985). “A technology acceptance model for empirically testing new end-user information systems: Theory and results,” Ph.D. dissertation, Massachusetts Institute of Technology, USA. [Google Scholar]
29. W. H. DeLone and E. R. McLean. (1992). “Information systems success: The quest for the dependent variable,” Information Systems Research, vol. 3, no. 1, pp. 60–95. [Google Scholar]
30. B. H. Wixom and H. J. Watson. (2001). “An empirical investigation of the factors affecting data warehousing success,” MIS Quarterly, vol. 25, no. 1, pp. 17–41. [Google Scholar]
 | This work is licensed under a Creative Commons Attribution 4.0 International License, which permits unrestricted use, distribution, and reproduction in any medium, provided the original work is properly cited. |