DOI:10.32604/cmc.2021.014537
| Computers, Materials & Continua DOI:10.32604/cmc.2021.014537 | |
| Article |
Acceptance Sampling Plans with Truncated Life Tests for the Length-Biased Weighted Lomax Distribution
1Department of Mathematics, Faculty of Science, Al al-Bayt University, Mafraq, Jordan
2Department of Mathematics, College of Science, King Khalid University, Abha, 62529, Saudi Arabia
3Statistical Research and Studies Support Unit, King Khalid University, Abha, 62529, Saudi Arabia
4School of Agriculture, University of Adelaide, Adelaide, SA 5000, Australia
*Corresponding Author: Amer Ibrahim Al-Omari. Email: alomari_amer@yahoo.com
Received: 27 September 2020; Accepted: 28 October 2020
Abstract: In this paper, we considered the Length-biased weighted Lomax distribution and constructed new acceptance sampling plans (ASPs) where the life test is assumed to be truncated at a pre-assigned time. For the new suggested ASPs, the tables of the minimum samples sizes needed to assert a specific mean life of the test units are obtained. In addition, the values of the corresponding operating characteristic function and the associated producer’s risks are calculated. Analyses of two real data sets are presented to investigate the applicability of the proposed acceptance sampling plans; one data set contains the first failure of 20 small electric carts, and the other data set contains the failure times of the air conditioning system of an airplane. Comparisons are made between the proposed acceptance sampling plans and some existing acceptance sampling plans considered in this study based on the minimum sample sizes. It is observed that the samples sizes based on the proposed acceptance sampling plans are less than their competitors considered in this study. The suggested acceptance sampling plans are recommended for practitioners in the field.
Keywords: Acceptance sampling plan; producer’s risk; truncated life tests; operating characteristic function; length-biased weighted lomax distribution; consumer’s risk
The ASP is a useful tool that can be used to conclude whether to accept a product or reject it by utilizing a sample chosen randomly from the product. The ASP procedure firstly starts by defining the smallest size of the sample needed to assert a specific mean life when the life test time is truncated at a determined time. These types of tests are known as truncated lifetime tests.
The ASP, in terms of truncated life tests, is discussed by numerous researchers. For example, Al-Nasser et al. [1] developed an ASP based on life test truncation for the exponentiated Fréchet distribution; Al-Nasser et al. [2] developed single ASPs based on a truncated lifetime test for the Ishita distribution, Al-Nasser et al. [3] considered double ASPs based on Quasi Lindley distribution, Recently, Al-Nasser et al. [4] introduced ASPs for the Tsallis q-exponential distribution, Al-Omari [5] considered ASPs for Sushila distribution, Al-Omari [6] developed ASPs based on time truncated tests for the transmuted inverse Rayleigh distribution, Al-Omari [7] developed ASPs based on time truncated test for the generalized inverted exponential distribution, and latter, Al-Omari [8] applied similar ASPs but for the generalized inverse Weibull distribution, Al-Omari [9,10] studied the Garima and transmuted generalized inverse Weibull distributions in ASPs, Al-Omari et al. [11] introduced ASPs based on truncated life tests for the extended Exponential distribution, and, in Al-Omari et al. [12] they used the ASPs for the Rama distribution. Also, for more examples of ASP see Al-Omari et al. [13] for Akash distribution with an application to electric carts data, Aslam et al. [14] for considering the generalized exponential distribution, Baklizi et al. [15] for the Birnbaum Saunders model, Braimah et al. [16] for Weibull product life distributions, Gui et al. [17] considered ASPs for the weighted Exponential distribution, Gupta et al. [18] for the Gamma distribution, Kantam et al. [19] used log-logistic distribution and considered the truncated life tests for this distribution, Malathi et al. [20] considered Fréchet distribution, Sobel et al. [21] studied the Exponential distribution and investigated the life test dependent on it. A similar life test is used by Tsai et al. [22] but for the generalized Rayleigh distribution. Rao et al. [23] for applying truncated tests on the inverse Rayleigh distribution; a similar idea is considered by Sriramachandran et al. [24] but for the exponentiated inverse Rayleigh distribution. Sudamani et al. [25] for time truncated chain sampling plan for Weibull distribution. ASPs using percentiles for the exponentiated Fréchet distribution was developed by Rao et al. [26]. Al-Omari et al. [27] proposed double acceptance sampling plan for time truncated life tests based on the transmuted generalized inverse Weibull distribution. Based on our knowledge, the ASPs have not been considered for the Length-biased weighted Lomax distribution. This paper will focus mainly on this distribution and proposed new ASPs based on it.
The structure of this paper is prepared as follows. Section 2 affords the Length-biased weighted Lomax distribution (LBWLD) and introduces some of its statistical properties. Section 3 is devoted to clarify the proposed sampling plans for the LBWLD distribution with its properties, including the minimum sample size, the operating characteristic function values and the corresponding producer’s risk. The necessary tables of the new plan with illustrated examples are presented in Section 4. The usefulness of the LBWLD acceptance sampling plans is investigated to real data sets in Section 5. Findings and summarized results are presented in Section 6.
2 The Length-Biased Weighted Lomax Distribution
Ahmad et al. [28] suggested the LBWLD with the probability density function (pdf) and the cumulative distribution function (cdf), respectively, given by


The rth non central moment of the LBWLD is

The mean, variance, and coefficient of variation (CV), respectively, are

The functions of hazard rate and reliability for the LBWLD, respectively, are:


The reverse hazard function for the Length-biased weighted Lomax distribution is

Details of the LBWLD distribution are available in Ahmad et al. [28] and the reliability for the LBWLD, in case the outliers exist, is investigated by Karimi et al. [29].
3 The Proposed Acceptance Sampling Plans
The suggested ASPs are illustrated, here, as in the following steps:
1. The number of units, m, on a test.
2. An acceptance number, say c, where if c or fewer failures occur within the test time t, the lot is accepted.
3. A ratio  , where
  is the identified average lifetime.
The probability of accepting a bad lot, the one for which the real mean life ( ), is less than the specified mean life (
 ). The latter is usually known as the consumer’s risk and it is determined to be at most 1 − P*, i.e., that the real mean life
  is less than
  , not exceeds 1 − P*.
In this proposed ASP, the size of the lot is supposed to be large enough. In this case, we can apply the theory of binomial distribution. Therefore, for 0 < P* < 1, t, c, and  , we aim to determine the minimum size of the sample, m, that is necessary to satisfy

Here,  denotes the likelihood of observing a failure within the time t which is depend on
  and
and  . The researcher is usually interested in determining the ratio
  . If the number of observed failures, within the time t, is at most c, then based on Eq. (6) with the probability of P, we can confirm that
  , which involves
  .
.
The minimum sizes of the sample that satisfying Eq. (6), with values of P* = 0.75, 0.90, 0.95, 0.99, are calculated for the values  , 0.942, 1.257, 1.571, 2.356, 3.141, 3.927, 4.712. These choices of the ratio
  and P* are harmonic with that of values presented in Gupta et al. [18], Al-Omari et al. [11], Baklizi et al. [15], Al-Nasser et al. [1] and Kantam et al. [19]. The results displayed in Tab. 1 are for the LBWLD parameter
  , where the results for
  , are presented in Tab. 4.
Table 1: Minimum sizes of sample with P* probability and acceptance number c for  in the LBLWD
3.2 Operating Characteristic Function
The function of operating characteristic, denoted by  , of the sampling plan
  is known as the probability of accepting a lot. For the ASP given in Subsection 3.1, the
  is determined as

Here,  is a function of
  (and usually used to judge the quality of this parameter) and
  refers to the function of an incomplete beta. It is of interest to note that the latter function is an increasing function of the probability p, while the operating characteristic function is a decreasing function of p. For fixed c and
  , from Eq. (7), the values of the operating characteristic function, based on the LBWLD, for the ASP
  are presented in Tab. 2 for
  while they are given in Tab. 5 for
  .
.
Table 2: Values for operating characteristic function based on the ASP  with probability P* for
  in the LBLWD
The producer’s risk denoted by  is defined as the probability of rejecting a lot when
  with the formula defined as

For an assumed value of the producer risk,  , a researcher may want to know the minimum amount of
  that will asserts that the
  is less than or equal to
  in case of adopted this sampling plan. This value of
  , is the minimum positive number for which
  fulfills the inequality

For a specified ASP  considering the LBWL distribution at an identified level of confidence, P*, Tabs. 3 and 6 summarize the minimum values of the ratio
  that satisfying Eq (9) for
  and
and  , respectively.
Table 3: Minimum ratio of  for the acceptability of a lot with producer’s risk of 0.05 for
  in the LBLWD
4 Descriptions of Tables and Examples
The proposed ASPs performance based on values of minimum sample size values, operating characteristic function and the values of minimum ratio are now analyzed. Various values for the parameters of the LBWLD are investigated to see their effect on the proposed ASPs.
The lifetime distribution is assumed to follow a Length-biased weighted Lomax distribution with  . Also, the mean life
  is assumed to be at least 1000 h having a probability value of P* = 0.95. Assume that the researcher wants to terminate the lifetime test at t0 = 1257 h, that is
  , and set the number of acceptance to be c = 2 . Therefore, the requested sample size m is the entry presented in Tab. 1, that corresponds to
  c = 2, P* = 0.95 , is m = 6. That is, 6 units have to be out on test. If two or fewer failures are detected during t0, then the mean life
  of the items can be emphasized to be at least 1000 h with a level of confidence equal to 0.95. The minimum samples sizes obtained here are less than their counterparts in Al-Omari [5] for Sushila distribution.
Includes the values of the OC for the suggested ASPs based on LBWLD distribution obtained from Tab. 1 for different values of  and P* with acceptance number c = 2 . For the previous example and based on the results in Tab. 2, the values for the operating characteristic function considering the sampling plan
  are:
are:
This above table displays that if the real mean life is double the specified mean life, the producer’s risk is about 0.79947, when 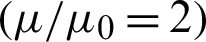 , and then goes to zero when
  .
.
The values presented in Tab. 3 are for the minimum ratio of  when the producer’s risk less than or equal to
  . Therefore, for our example with P* = 0.95 ,
  and c = 2 the ratio value is 7.655. That is, the mean life of the product should be 7.655 times the identified mean life of 1000 h; hence, for the above ASP and with a probability of 0.95, the product can be accepted.
Based on the results in Tab. 1 and Tab. 4, it can be seen that the obtained sizes of the minimum sample in Tab. 1 for  are less than their counterparts for
  in Tab. 4. Also, the results presented in both tables are less than that given in Kantam et al. [19], Aslam et al. [14], and Al-Omari [9,10]. When
  and P* = 0.99 , for the ASP
  , the operating characteristic value equals 0.995775. Hence, the producer risk is equal to 0.004225, and equal to zero for lagre values when
  ; therefore, Tab. 6 shows that the value of
  is 5.760.
Table 4: Minimum sizes of the sample to be tested for time t with probability P* and acceptance number c where  for
for  in the LBLWD
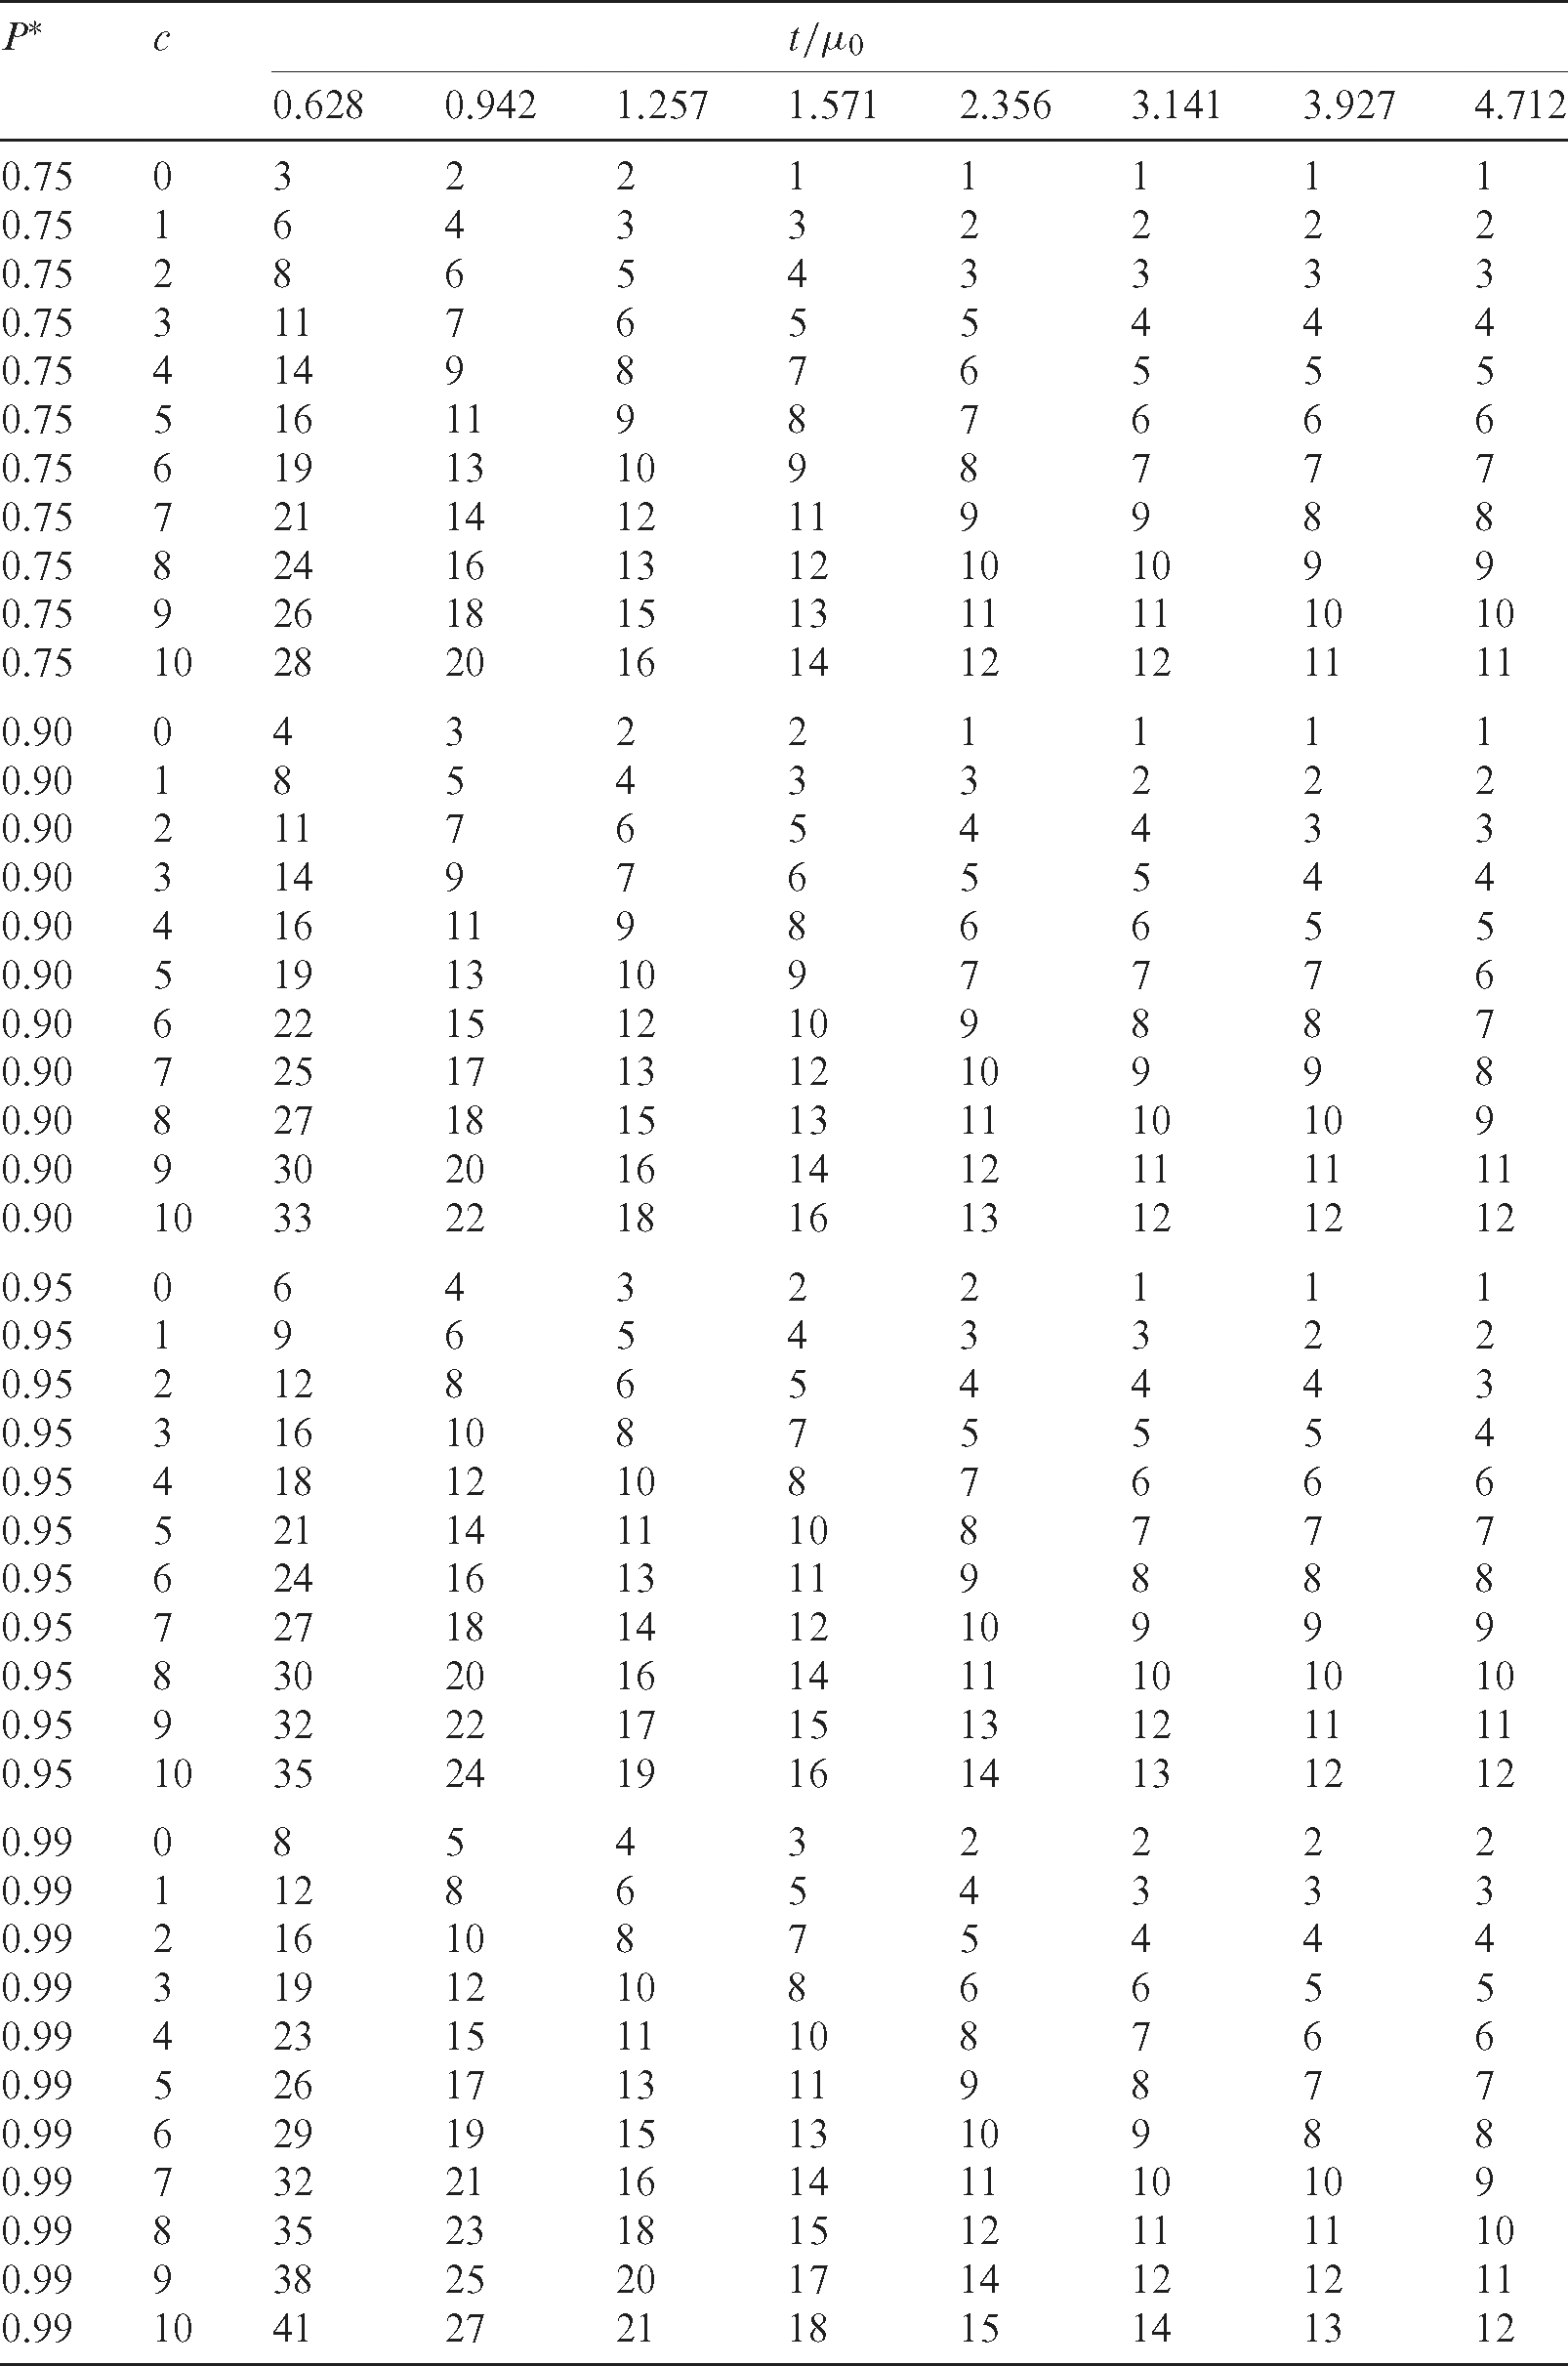
Table 5: Values of the OC for the ASP  with a specified probability P* for
  in the LBLWD
Table 6: Minimum ratio of  for the acceptability of a lot with producer’s risk of 0.05 for
  in the LBLWD
5 Applications of Real Data Sets
Two sets of real data, in this section, are used to investigate the efficiency of the suggested ASPs based on the LBWL distribution. The product lifetime is assumed to follow the LBWLD. First, we have to check whether the LBWL distribution can be used or not. The LBWLD distribution is fitted to both data sets and the following criteria are used to check the goodness of fitting:
• Akaike Information Criterion (AIC), Akaike [30]:  .
.
• Consistent Akaike Information Criterion (CAIC), Bozdogan [31]:  .
.
• Bayesian Information Criterion (BIC), Schwarz [32]:  .
.
• Hannan–Quinn Information Criterion (HQIC), Hannan et al. [33]: 
 , where
  indicates the number of penalized parameters and n refers to the size of the sample.
• Cramér–von Mises test, (CM), Cramer [34]:  .
.
• Anderson–Darling test (AD), Stephens [35]:
• The Kolmogorov–Smirnov (K–S) test:  , where
  , is the function of the empirical distribution and F(x) is the cdf.
We used the maximum likelihood method (MLE) for estimating the parameters of the LBWL distribution, and the negative maximized log-likelihood values (MLL) are also obtained.
The first data
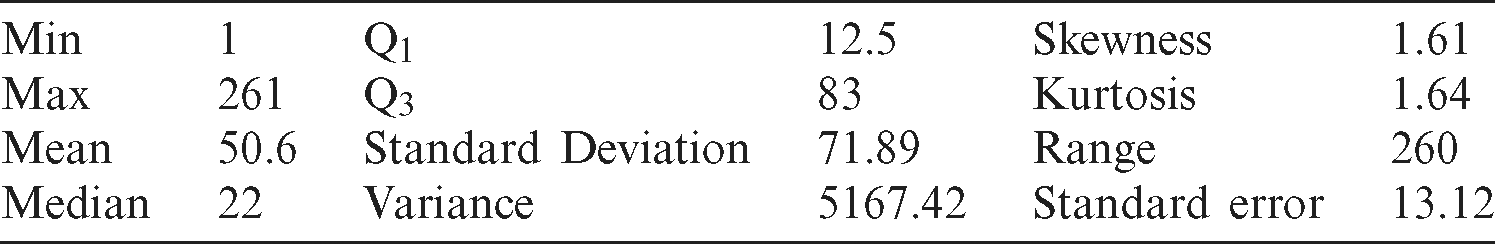
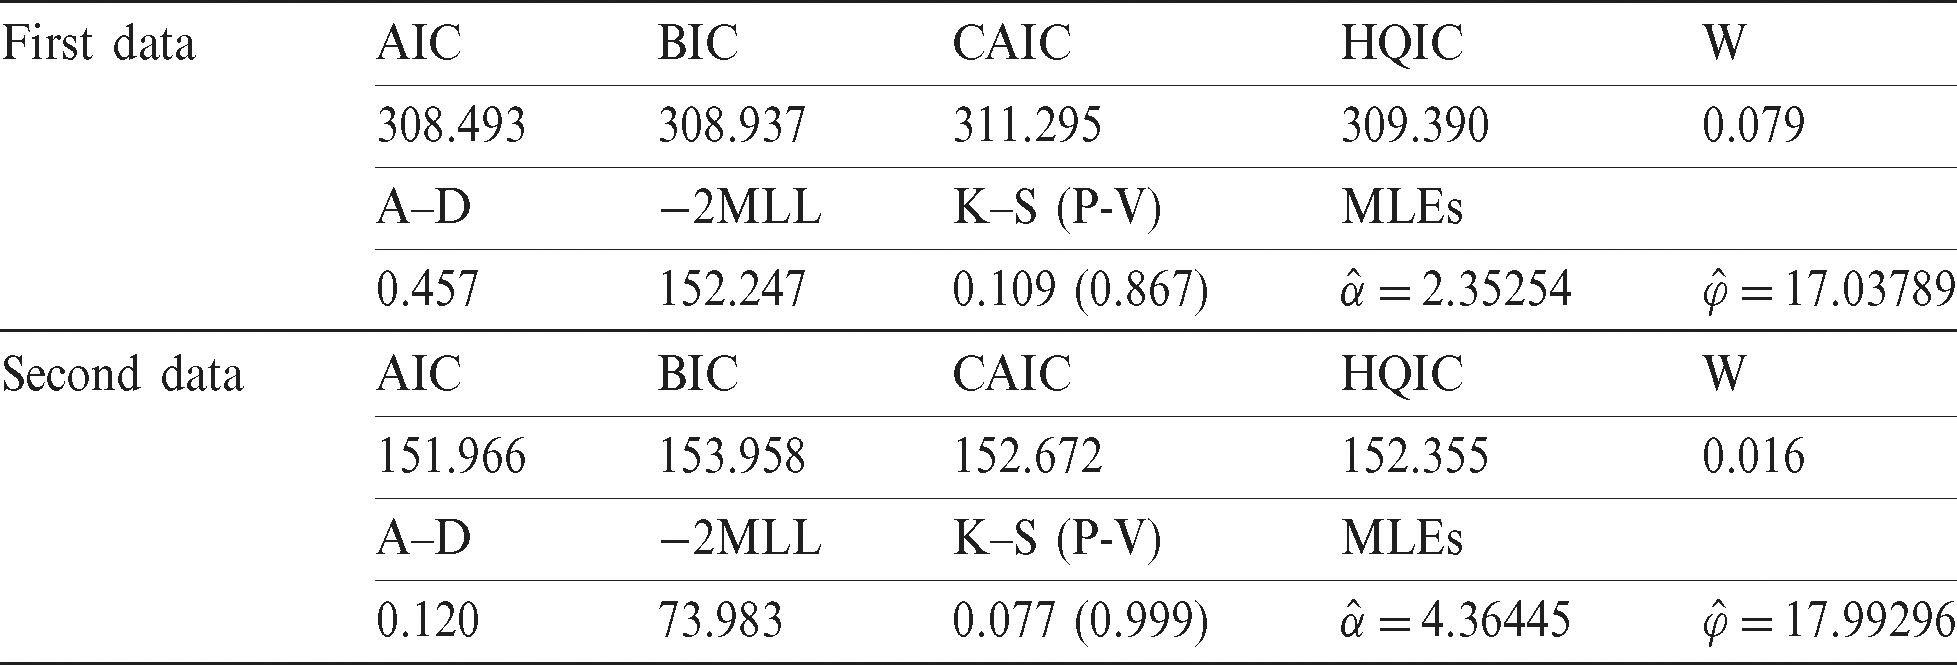
The first data set is: 23, 261, 87, 7, 120, 14, 62, 47, 225, 71, 246, 21, 42, 20, 5, 12, 120, 11, 3, 14, 71, 11, 14, 11, 16, 90, 1, 16, 52, 95. These values are the failure times of the air conditioning system of an airplane in hours. Certainly, this data is already studied by Linhart et al. [36] and Shanker et al. [37]. The descriptive statistics for this data are given in Tab. 7. Fig. 1 illustrates the estimated pdf of the air conditioning system data. The results presented in Tab. 9 show that LBWL distribution strongly fits well the air conditioning system data.
Table 7: The descriptive statistics for the airplane data
The MLEs for  and
and  , respectively, are
  and
and  , and; hence,
 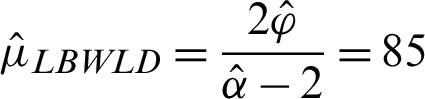 . Let the needed mean life is demanded to be
  h and the testing time is t0 = 53 h. Therefore, for P* = 0.95 , we have to make a decision about the acceptance of the lot. For the ratio
  and P* = 0.95 in Tab. 4, we obtain m = 30 when c = 8 . So, if the number of observed failures before t0 = 53 h is less than or equal to 8, the lot can be accepted with the assured mean lifetime 85 h with probability of 0.95. We found that the number of failures before t0 = 53 h is more than 8. Hence, we reject the lot.
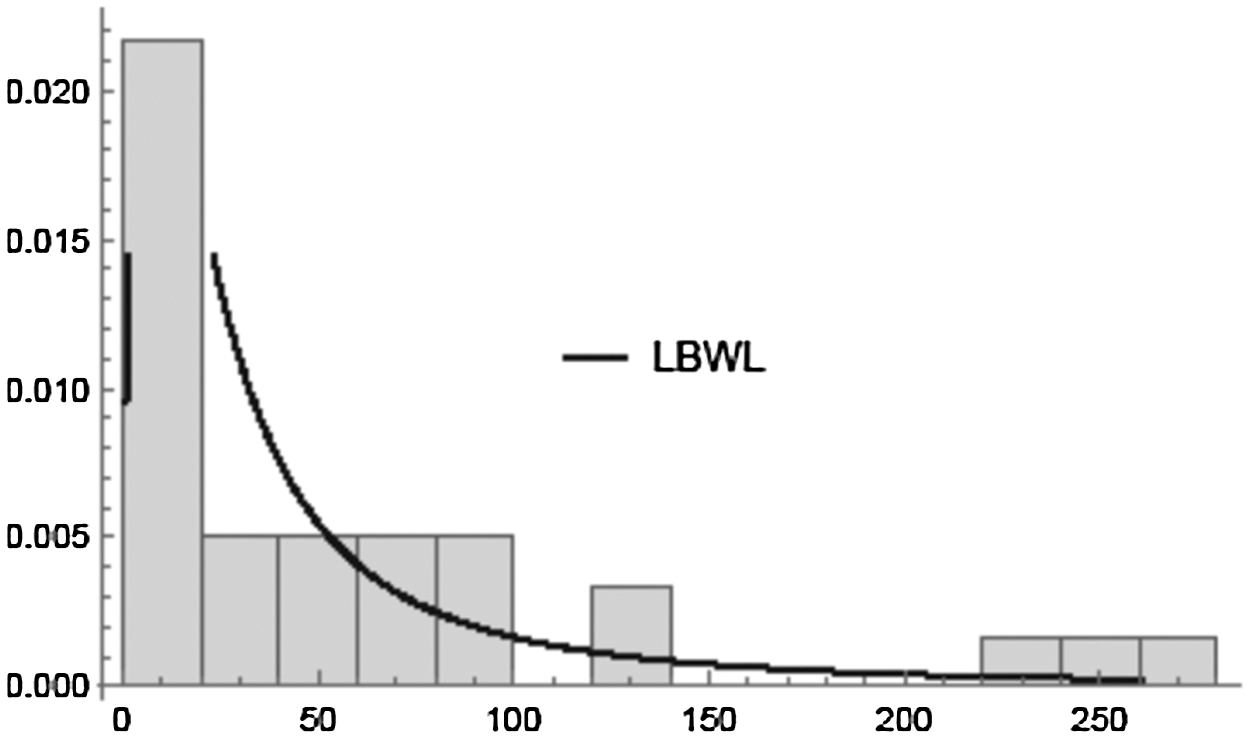
Figure 1: Estimated pdf of the air conditioning system data
The second data
The data set is 0.9, 1.5, 2.3, 3.2, 3.9, 5.0, 6.2, 7.5, 8.3, 10.4, 11.1, 12.6, 15.0, 16.3, 19.3, 22.6, 24.8, 31.5, 38.1, 53.0. The data represents the monthly lifetime to the first failure of 20 little electric carts utilized for delivery and transportation inside a manufacturer with a large facility. This data is also considered by Zimmer et al. [38] and Lio et al. [39] and its asymmetrical distribution is discussed by Al-Omari et al. [13]. The descriptive statistics of the data are given in Tab. 8. Also, Fig. 2 shows the estimated pdf of the electric carts data. However, Tab. 9 revealed that the LBWL distribution strongly fits well this data; the Kolmogorov–Smirnov distance between the observed and fitted distribution functions is 0.077 with the probability of 0.999.
Table 8: The descriptive statistics for the first failure of 20 small electric carts
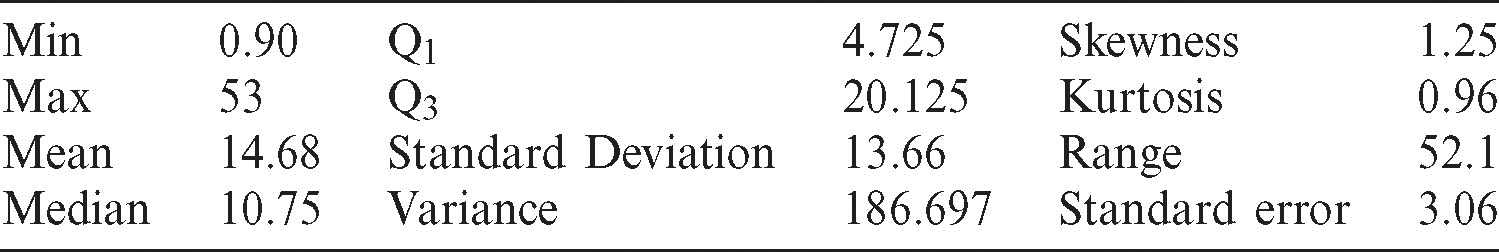
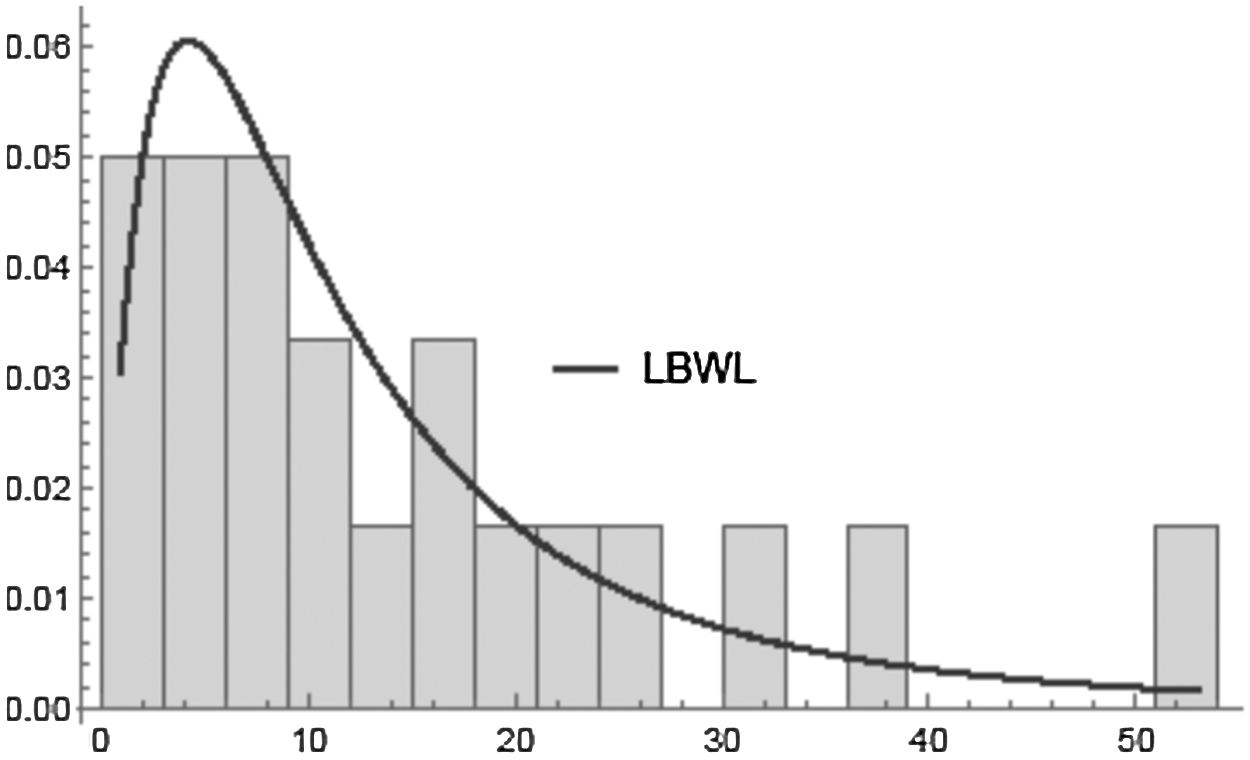
Figure 2: Estimated pdf of the electric carts data
Table 9: The AIC, CAIC, BIC, HQIC, W, A, K–S (P-Value), −2MLL, and the MLEs for the electric carts and air conditioning data
For this second data, we aim to determine the minimum sample sizes, the OC and the minimum ratios based on the estimated parameters from the data.
The MLEs for  and
and  , respectively, are
  and
and  ; hence,
  15.2196 . Let the specified mean lifetime and the testing time are
  and t0 = 9.558 months, respectively. Therefore, for P* = 0.90 and
  the acceptance number and the corresponding minimum sample sizes are given in Tab. 10, which are found to be c = 6 and m = 20, respectively. Hence, if the number of failures before t0 = 9.558 months, is less than or equal to 6, we can accept the lot with the assured mean lifetime 15.2196 months with probability 0.90. Since the number of failures before t0 = 9.558 months is 9, then the lot is rejected.
Table 10: The minimum sample sizes for  , P* = 0.90 ,
  and
and  for the electric carts data

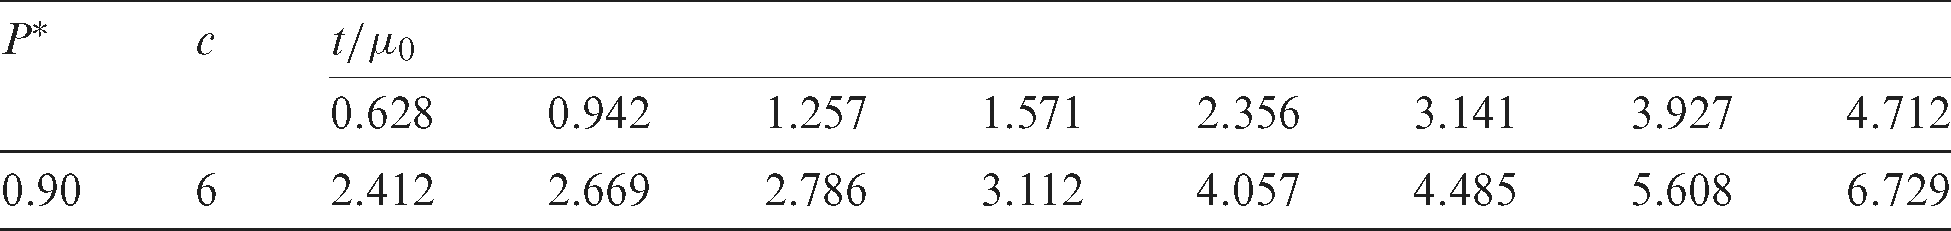
The values of OC for the ASP  and the corresponding producer’s risk are presented in Tab. 11, while the minimum ratios for this example are given in Tab. 12.
Table 11: Values for the function of the operating characteristic and the corresponding producer’s risk for the ASP  with P* = 0.90 ,
  and
and  for the electric carts data
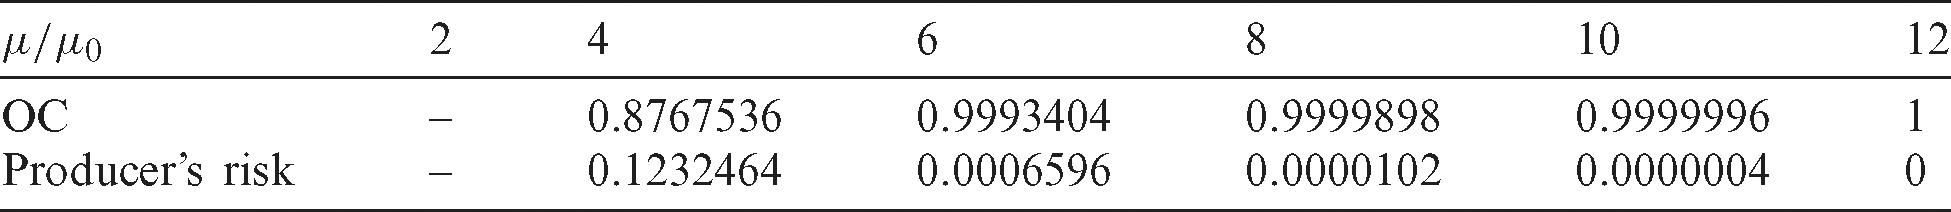
Table 12: Minimum ratio of  for the acceptability of a lot with producer’s risk of 0.05 with P* = 0.90 , c = 6 ,
  and
and  for the electric carts data
In this article, new ASPs are established based on the Length-biased weighted Lomax distribution for life test truncated at a pre-determined time. The necessary tables of the minimum sample sizes required to guarantee a particular mean life of the test units are obtained. The operating characteristic function values, as well as the related producer’s risks are also calculated. The usefulness of the proposed ASPs are investigated based on two real data sets. The applications of the real data sets used in this study showed the usefulness of the proposed acceptance sampling plans. Therefore, the new ASPs are recommended to the researchers. For future study, other ASPs such as group sampling plans and double sampling plans can be considered for the Length-biased weighted Lomax distribution. Also, the suggested ASPs can be considered based other sampling methods as ranked set sampling and its modifications, for more details see Jemain et al. [40], Zamanzade et al. [41], and Haq et al. [42,43].
Acknowledgement: The authors are sincerely grateful to the anonymous referees and the Editor for their time and effort in providing very constructive, helpful, and valuable comments and suggestions that have led to a substantial improvement in the quality of the paper.
Funding Statement: The authors extend their appreciation to Deanship of Scientific Research at King Khalid University for funding this work through the Research Groups Program under Grant Number R.G.P. 2/68/41. I. A. who received the grant and the URL to sponsor website is www.kku.edu.sa.
Conflicts of Interest: The authors declare that they have no conflicts of interest to report regarding the present study.
References
1. A. D. Al-Nasser and A. I. Al-Omari. (2013). “Acceptance sampling plan based on truncated life tests for exponentiated Fréchet distribution,” Journal of Statistics and Management Systems, vol. 16, no. 1, pp. 13–24.
2. A. D. Al-Nasser, A. I. Al-Omari, A. Bani-Mustafa and K. Jaber. 2018a. , “Developing single-acceptance sampling plans based on a truncated lifetime test for an Ishita distribution,” Statistics in Transition, 19, 393–406.
3. A. D. Al-Nasser, A. I. Al-Omari and F. S. Gogah. 2018b. , “A double acceptance sampling plan for Quasi Lindley distribution,” Journal of the North for Basic and Applied Sciences, vol. 3, no. 2, pp. 120–130.
4. A. D. Al-Nasser and M. Obeidat. (2020). “Acceptance sampling plans from truncated life test based on Tsallis q-exponential distribution,” Journal of Applied Statistics, vol. 47, no. 4, pp. 685–697.
5. A. I. Al-Omari. (2014). “Acceptance sampling plans based on truncated life tests for Sushila distribution,” Journal of Mathematical and Fundamental Sciences, vol. 50, no. 1, pp. 72–83.
6. A. I. Al-Omari. (2014). “Acceptance sampling plans based on truncated lifetime tests for transmuted inverse Rayleigh distribution,” Economic Quality Control, vol. 31, no. 2, pp. 85–92.
7. A. I. Al-Omari. (2015). “Time truncated acceptance sampling plans for generalized inverted exponential distribution,” Electronic Journal of Applied Statistical Analysis, vol. 8, no. 1, pp. 1–12.
8. A. I. Al-Omari. (2016). “Time truncated acceptance sampling plans for Generalized Inverse Weibull distribution,” Journal of Statistics and Management Systems, vol. 19, no. 1, pp. 1–19.
9. A. I. Al-Omari. (2018). “Improved acceptance sampling plans based on truncated life tests for Garima distribution,” International Journal of System Assurance Engineering and Management, vol. 9, no. 6, pp. 1287–1293.
10. A. I. Al-Omari. (2018). “The transmuted generalized inverse Weibull distribution in acceptance sampling plans based on life tests,” Transactions of the Institute of Measurement and Control, vol. 40, no. 16, pp. 4432–4443. [Google Scholar]
11. A. I. Al-Omari and S. A. Al-Hadhrami. (2018). “Acceptance sampling plans based on truncated life tests for extended exponential distribution,” Kuwait Journal of Science, vol. 45, no. 2, pp. 89–99. [Google Scholar]
12. A. I. Al-Omari, A. D. Al-Nasser and E. Ciavolino. (2019). “Acceptance sampling plans based on truncated life tests for Rama distribution,” International Journal of Quality and Reliability Management, vol. 36, no. 7, pp. 1181–1191. [Google Scholar]
13. A. I. Al-Omari, N. Koyuncu and A. Al-anzi, “New acceptance sampling plans based on truncated life tests for Akash distribution with an application to electric carts data,” in (Early AccessAccepted in IEEE Access. [Google Scholar]
14. M. Aslam, D. Kundu and M. Ahmad. (2010). “Time truncated acceptance sampling plans for generalized exponential distribution,” Journal of Applied Statistics, vol. 37, no. 4, pp. 555–556. [Google Scholar]
15. A. Baklizi and A. El Masri. (2004). “Acceptance sampling based on truncated life tests in the Birnbaum Saunders model,” Risk Analysis, vol. 24, no. 6, pp. 1453–1457. [Google Scholar]
16. O. J. Braimah, P. A. Osanaiye and I. W. Edokpa. (2016). “Improved single truncated acceptance sampling plans for Weibull product life distributions,” Journal of the National Association of Mathematical Physics, vol. 38, pp. 451–460. [Google Scholar]
17. W. Gui and M. Aslam. (2017). “Acceptance sampling plans based on truncated life tests for weighted exponential distribution,” Communications in Statistics-Simulation and Computation, vol. 46, no. 3, pp. 2138–2151. [Google Scholar]
18. S. S. Gupta and P. A. Groll. (1961). “Gamma distribution in acceptance sampling based on life tests,” Journal of American Statistical Association, vol. 56, pp. 942–970. [Google Scholar]
19. R. R. L. Kantam, K. Rosaiah and G. S. Rao. (2001). “Acceptance sampling based on life tests: Log-logistic model,” Journal of Applied Statistics, vol. 28, pp. 121–128. [Google Scholar]
20. D. Malathi and S. Muthulakshmi. (2017). “Economic design of acceptance sampling plans for truncated life test using Frechet distribution,” Journal of Applied Statistics, vol. 44, no. 2, pp. 376–384. [Google Scholar]
21. M. Sobel and J. A. Tischendrof. (1659). “Acceptance sampling with new life test objectives,” in Proc. of Fifth National Sym. Reliability and Quality Control, Philadelphia, Pennsylvania, pp. 108–118. [Google Scholar]
22. T. Tsai and S. Wu. (2006). “Acceptance sampling based on truncated life tests for generalized Rayleigh distribution,” Journal of Applied Statistics, vol. 33, no. 6, pp. 595–600. [Google Scholar]
23. G. S. Rao, R. R. L. Kantam, K. Rosaiah and J. Reddy. (2012). “Acceptance sampling plans for percentiles based on the inverse Rayleigh distribution,” Electronic Journal of Applied Statistical Analysis, vol. 5, no. 2, pp. 164–177. [Google Scholar]
24. G. V. Sriramachandran and M. Palanivel. (2014). “Acceptance sampling plan from truncated life tests based on exponentiated inverse Rayleigh distribution,” Journal of Mathematics and Statistics, vol. 8, no. 1, pp. 8–13. [Google Scholar]
25. R. R. Sudamani and S. Jayasri. (2016). “Time truncated chain sampling plan for Weibull distributions,” International Journal of Engineering Research and General Science, vol. 3, no. 2, pp. 59–67. [Google Scholar]
26. G. S. Rao, K. Rosaiah, M. S. Babu and D. C. Silvakumar. (2016). “New acceptance sampling plans based on percentiles for exponentiated Fréchet distribution,” Economic Quality Control, vol. 31, no. 1, pp. 35–44. [Google Scholar]
27. A. I. Al-Omari and E. Zamanzade. (2017). “Double acceptance sampling plan for time truncated life tests based on transmuted generalized inverse,” Weibull distribution Journal of Statistics Applications and Probability, vol. 6, no. 1, pp. 1–6. [Google Scholar]
28. A. Ahmad, S. P. Ahmad and A. Ahmad. (2016). “Length-biased weighted Lomax distribution: Statistical properties and application,” Pakistan Journal of Statistical and Operation Research, vol. XII, no. 2, pp. 245–255. [Google Scholar]
29. H. Karimi and P. Nasiri. (2018). “Estimation parameter of R = p (Y¡X) for length-biased weighted Lomax distributions in the presence of outliers,” Mathematical and Computational Applications, vol. 23, no. 1, pp. 1–9. [Google Scholar]
30. H. Akaike. (1974). “A new look at the statistical model identification,” IEEE Transaction on Automatic Control, vol. 19, pp. 716–723. [Google Scholar]
31. H. Bozdogan. (1987). “Model selection and Akaike’s information criterion (AICThe general theory and its analytical extensions,” Psychometrika, vol. 52, pp. 345–370. [Google Scholar]
32. G. Schwarz. (1978). “Estimating the dimension of a model,” Annals of Statistics, vol. 6, pp. 461–464. [Google Scholar]
33. E. J. Hannan and B. G. Quinn. (1979). “The Determination of the order of an autoregression,” Journal of the Royal Statistical Society, Series B, vol. 41, pp. 190–195. [Google Scholar]
34. H. Cramer. (1928). “On the composition of elementary errors,” Scandinavian Actuarial Journal, vol. 1, no. 1, pp. 13–74. [Google Scholar]
35. M. A. Stephens. (1974). “EDF statistics for goodness of fit and some comparisons,” Journal of the American Statistical Association, vol. 69, no. 347, pp. 730–737. [Google Scholar]
36. H. Linhart and W. Zucchini. (1986). Model Selection. New York, USA: John Wiley. [Google Scholar]
37. R. Shanker, H. Fesshaye and S. Selvaraj. (2015). “On modeling lifetimes data using exponential and Lindley distributions,” Biometric and Biostatistics International Journal, vol. 2, no. 5, pp. 1–9. [Google Scholar]
38. W. J. Zimmer, J. B. Keats and F. K. Wang. (1998). “The Burr XII distribution in reliability analysis,” Journal of Quality Technology, vol. 30, no. 4, pp. 386–394. [Google Scholar]
39. Y. L. Lio, T. R. Tsai and S. J. Wu. (2010). “Acceptance sampling plans from truncated life tests based on the Burr type XII percentiles,” Journal of the Chinese Institute of Industrial Engineers, vol. 27, no. 4, pp. 270–280. [Google Scholar]
40. A. A. Jemain, A. I. Al-Omari and K. Ibrahim. (2007). “Multistage median ranked set sampling for estimating the population median,” Journal of Mathematics and Statistics, vol. 3, no. 2, pp. 58–64. [Google Scholar]
41. E. Zamanzade and A. I. Al-Omari. (2016). “New ranked set sampling for estimating the population mean and variance,” Hacettepe Journal of Mathematics and Statistics, vol. 45, no. 6, pp. 1891–1905. [Google Scholar]
42. A. Haq, J. Brown, E. Moltchanova and A. I. Al-Omari. (2016). “Paired double ranked set sampling,” Communications in Statistics–-Theory and Methods, vol. 45, no. 1, pp. 2873–2889. [Google Scholar]
43. A. Haq, J. Brown, E. Moltchanova and A. I. Al-Omari. (2015). “Varied L ranked set sampling scheme,” Journal of Statistical Theory and Practice, vol. 9, no. 4, pp. 741–767. [Google Scholar]
 | This work is licensed under a Creative Commons Attribution 4.0 International License, which permits unrestricted use, distribution, and reproduction in any medium, provided the original work is properly cited. |
 in LBWLD
 in LBWLD