DOI:10.32604/cmc.2021.014614
| Computers, Materials & Continua DOI:10.32604/cmc.2021.014614 | |
| Article |
Suitability of VVC and HEVC for Video Telehealth Systems
1Faculty of Science, Engineering and Computing, Kingston University, London, KT1 2EE, UK
2School of Electrical Engineering, Superior University, Lahore, Pakistan
3Department of Unmanned Vehicle Engineering, Sejong University, Seoul, 05006, Korea
4Pangea Connected Ltd., London, KT1 1BL, UK
*Corresponding Author: Muhammad Arslan Usman. Email: arslanusman@ieee.org
Received: 03 October 2020; Accepted: 01 November 2020
Abstract: Video compression in medical video streaming is one of the key technologies associated with mobile healthcare. Seamless delivery of medical video streams over a resource constrained network emphasizes the need of a video codec that requires minimum bitrates and maintains high perceptual quality. This paper presents a comparative study between High Efficiency Video Coding (HEVC) and its potential successor Versatile Video Coding (VVC) in the context of healthcare. A large-scale subjective experiment comprising of twenty-four non-expert participants is presented for eight different test conditions in Full High Definition (FHD) videos. The presented analysis highlights the impact of compression artefacts on the perceptual quality of HEVC and VVC processed videos. Our results and findings show that VVC clearly outperforms HEVC in terms of achieving higher compression, while maintaining high quality in FHD videos. VVC requires upto 40% less bitrate for encoding an FHD video at excellent perceptual quality. We have provided rate-quality curves for both encoders and a degree of overlap across both codecs in terms of perceptual quality. Overall, there is a 71% degree of overlap in terms of quality between VVC and HEVC compressed videos for eight different test conditions.
Keywords: Mobile healthcare; subjective analysis; telemedicine; video compression; video quality assessment
Telehealth or telemedicine is the remote provision of healthcare services that is done by transferring medical data on communication channels. Mobile healthcare is one of the key aspects of telemedicine in which clinicians perform a range of different clinical tasks remotely, while a patient is in a mobile platform [1]. Such an example is the rising demand of pre-hospital medical treatments, which includes remote guidance to the in-ambulance paramedical staff from a physician. There are certain straightforward but strict requirements for allowing remote in-ambulance medical treatments. These include a fast, ultra-reliable and low-delay communication network through which the crew share the in-ambulance medical data of patients with the remote clinician. Such a scenario is called connected ambulance and is well explained in [1] and a typical example of a connected ambulance scenario is given in Fig. 1. Though, modern communication networks such as 5G networks possess the potential of fulfilling these requirements, still bandwidth is considered a precious and scarce resource [2]. This necessitates the importance of data compression in Telemedicine, as huge amounts of medical data not only need to be transmitted over communication channels but need to be stored for further post-processing tasks such as clinical diagnosis.

Figure 1: An illustration of a 5G enabled connected ambulance
A huge chunk of medical data is comprised of medical videos and in a connected ambulance, in-ambulance video streaming is of great importance. There are several state-of-the-art video encoders that are currently being used in real-time systems to perform video compression [3]. The most recent examples of codecs used in real-time applications include Joint Video Exploration Team’s (JVET) High Efficiency Video Coding (HEVC) and Google’s VP-9. In 2017, JVET introduced the potential successor of HEVC known as Versatile Video Coding (VVC) which has recently been standardized as H. 266 [4]. JVET has recently released the latest reference software for VVC known as VTM (VVC Test Model) version 8. From mobile healthcare perspective, video codecs play a great role in allowing high video compression so that seamless medical video transmission can be made possible for locations with limited network resources. When a connected ambulance is in transit, there can be low coverage areas where the network bandwidth becomes very low and to allow error-free video streaming, a video compression system is needed that can overcome such challenges by minimizing the bitrate and maintaining high video quality. While HEVC offers upto 50% reduced bitrate requirements as compared to its famous predecessor H. 264, VVC offers upto 50% further reduction in bitrates as compared to HEVC [3].
The aim of this study is to compare HEVC to its potential successor VVC in terms of impact of compression artefacts on perceptual quality of Full High Definition (FHD) videos. This study is presented from the context of mobile healthcare, mainly focusing on in-ambulance video streaming. For this reason, we have carefully chosen FHD videos from a publicly available video database for our subjective analysis and the details are provided in Section III of this paper. We have strictly followed the International Telecommunication Union’s (ITU) guidelines for conducting subjective experiments for videos containing spatial distortion, which are available in ITU BT-500-14 [5] and ITU P. 910 [6]. Our comparative analysis includes a large-scale subjective experiment with twenty-four test participants conducted in two separate phases. Phase one includes test conditions associated with HEVC compressed videos and phase two deals with the VVC compressed videos. The motivation and principal contributions for this study are provided in the next section which provides the survey of related works.
The rest of the paper is structured as follows. Section 2 covers the existing literature including medical video communication systems and emerging applications. The details of the subjective experiment are given in Section 3, followed by results and discussion in Section 4. Finally, a detailed conclusion along with suggested future work is provided in Section 5 of this paper.
2 Video Communication Systems in Healthcare
With the evolution in cellular networks, requirements of mobile healthcare can now easily be fulfilled [7]. Connected ambulances not only will enhance the provision of healthcare but also, they will help alleviate the pressure on accidents and emergencies (A&E) by making pre-hospital clinical decisions. The principle goal of a mobile healthcare system is to ensure reliable, fast and clinically secure communication throughout a streaming session. This is not an easy task as healthcare provision is necessary for every nook and corner of a country regardless of presence of strong network coverage. Bandwidth constraints, network outages, error-prone channels and end-to-end delay are some of the factors that can impact the seamless delivery of medical data. Several efforts are underway to design such medical data transmission systems that require minimum network resources but provide ubiquitous and seamless quality to the remote clinicians.
In this section we have covered the existing literature from two main aspects of medical video communication systems. First, recent subjective studies in the context of healthcare are discussed. Second, existing video communication systems, applications and services in the medical domain are discussed. Finally, at the end of this section, we have provided our main contributions for this study.
2.1 Recent Subjective Studies in Healthcare Domain
The authors in [3] have done a comparative analysis of latest video codecs including JVET’s HEVC and VVC, and Google’s VP-9 and AV-1. The authors have used three different video datasets which include ultrasound videos, emergency scenario videos and general-purpose videos from Netflix. They have concluded that VVC outperforms all codecs in terms of bitrate savings. The subjective tests performed by authors do not include playback of VVC encoded videos as at that time the video playback tools did not support VVC [3]. A recent survey [8] includes all major subjective studies conducted in the healthcare domain. The studies include useful findings and recommendations for different types of medical data when using various video codecs. The survey includes two studies about ultrasound videos, three about different types of endoscopic videos, three related to medical resonance imaging (MRI), one each about heart imagery, ophthalmology videos, pathology imaging and telesurgery videos. These studies have used several different types of encoders including JEPG-2000, H. 264/AVC, MPEG-2 and HEVC.
2.2 Medical Video Communication Systems and Applications
Diagnostically driven video encoding has come under limelight recently and there have been some recent studies under this domain [9–16]. The aim of such kind of video encoding is to identify regions of interest (ROI) in medical videos, e.g., a tumor in a colonoscopy imagery, and then compressing these regions in a better quality than other regions. In this way, bandwidth can be saved by allowing maximum compression in non-ROIs and also remote clinical decisions can be made more accurately. A near-lossless video compression can be achieved in the ROIs using diagnostically driven video encoding. The authors in [17] have proposed ROI based encoding system for low bandwidth scenarios using Kinect skeleton coordinates to highlight the ROIs. The authors have used H. 264/AVC processed Trauma videos in their study. Further, there are several recent studies that focus on adaptive medical video communication systems that utilize optimization and prioritization of streamed content. The authors in [18] have presented an HEVC based adaptive video encoding scheme that optimizes quality, bitrate and encoding time for transmission of ultrasound videos. In [19,20] subjective analyses have been provided for HEVC compressed endoscopic and ultrasound videos. The authors have shown different quality categories associated with different HEVC based compression levels. In [21] H. 264/AVC based mobile tele-echography platform has been proposed for cardiac ultrasound videos. Other works in the domain of medical video communication applications and services include augmented reality (AR) and mixed reality (MR) based clinical tools that are used in medical diagnosis and education [22,23].
In this paper, we have mainly focused on the aspect of designing a video communication system for connected ambulances by subjectively comparing two latest video codecs HEVC and VVC. The principle contributions for this paper are outlined as follows.
• Comparing VVC and HEVC video encoders under eight different test conditions for FHD videos in the context of healthcare.
• Providing a detailed subjective experiment comprised of 24 non-expert participants.
• Highlighting the impact of compression artefacts on the perceptual quality of VVC and HEVC compressed FHD videos.
• Recommended bitrates for VVC and HEVC for achieving optimal quality in the compressed domain.
In this section, we have thoroughly described the conducted subjective experiment for this study. First, preparation of the video dataset is described for both HEVC and VVC compressed videos, followed by a brief description of the participants and the experimental setup.
In rest of the paper, following terms have been used to define the video sequences used in this research.
• SRC: The original or pristine video sequence.
• PVS: The processed video sequence which in this study includes HEVC and VVC compressed videos.
3.1 Preparation of Video Dataset
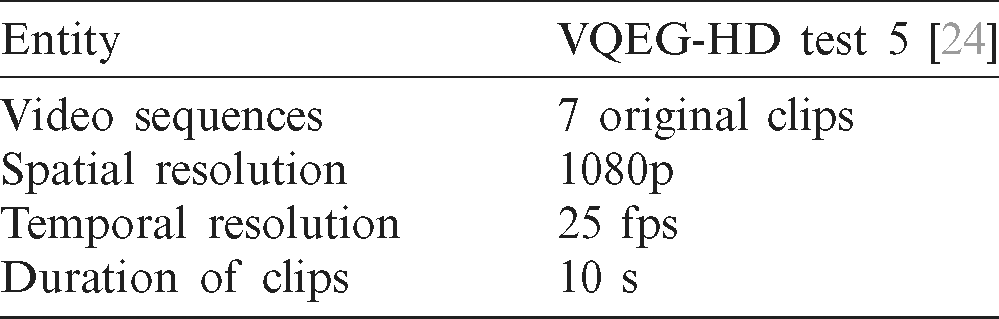
With the evolution in next generation cellular communication, wireless networks now possess the capability to maintain seamless and ubiquitous delivery of FHD videos with minimum delay and errors. Especially, 5G networks offer high bandwidth, ultra-reliability and end-to-end delay as low as 1 millisecond [1]. Based on our understanding of 5G networks and requirements of mobile healthcare, we chose FHD SRCs from the VQEG-HD video dataset [23]. The FHD SRCs from VQEG-HD dataset have a spatial resolution of  and a temporal resolution of 25 frames per second (fps). The details of these videos are given in Tab. 1.
Table 1: Details of the VQEG-HD test dataset
As mentioned earlier, apart from choice of the right video codec, these subjective experiments were conducted to design a video compression system for in-ambulance video streaming. The scenario we have considered for this study includes a single FHD video camera installed in an ambulance. Such a camera embedded in an ambulance can generate four different types of videos based on the movement of the camera and the objects. These four types are described as follows:
• Fixed camera and fixed objects
• Fixed camera and moving objects
• Moving camera, e.g., pan, tilt and zoom, fixed objects
• Moving camera and moving objects
To have a purposeful subjective experiment, we chose five FHD SRCs, out of total seven, from the VQEG-HD dataset that were matching the aforementioned four characteristics. This selection was done by measuring the motion content of the videos using the ITU P. 910 recommendations [5]. A snapshot of each SRC is given in Fig. 2. Next subsection briefly describes the selection process of videos based on motion content.

Figure 2: Snapshots of selected SRCs [24]. (a) Lion, (b) Cheetah, (c) Rainbow, (d) animals, and (e) animation
3.1.1 Selection of Videos Based on Motion Complexity
The process of selecting videos based on motion content characteristics has been clearly laid down by ITU in the P. 910 recommendation [5]. The motion complexity of video sequences is estimated by measuring the spectral content in an SRC. The spectral content is further comprised of two different entities namely spatial information (SI) and temporal information (TI). SI contains the spatial detail of an SRC i.e., the information within each video frame. This is calculated using the Sobel filter which underscores the regions having a high spatial frequency that correspond to edge regions. Following equation is used to measure SI in an SRC.

where,  refers to standard deviation computed for all the pixels of each video frame that is filtered through the Sobel filter. A time series of SI is created by repeating this process for all frames fn in an SRC and finally
  represents SI as the maximum value from the computed time series.
Temporal information or TI is measured as the motion difference between two successive video frames of an SRC. It is calculated using the following two equations.


where, Mn is the motion difference feature of the SRC and  in Eq. (2) represents the pixel intensity on the ith row and jth column of the nth video frame of the SRC. The maximum value
  of the time series of a set of standard deviation values
  defines the TI of an SRC.
ITU P. 910 recommendation contains motion complexity calculations for grayscale SRCs only, whereas the SRCs selected for this study are in the true color format, i.e., 24-bit RGB. For this purpose, we have used a simple algorithm that calculates SI and TI for true color format video sequences. The pseudo code for this algorithm is available in [19]. The threshold was kept at 0.0904 for the Sobel filter and the method used for calculating the edges was convolution and the direction was kept as vertical.
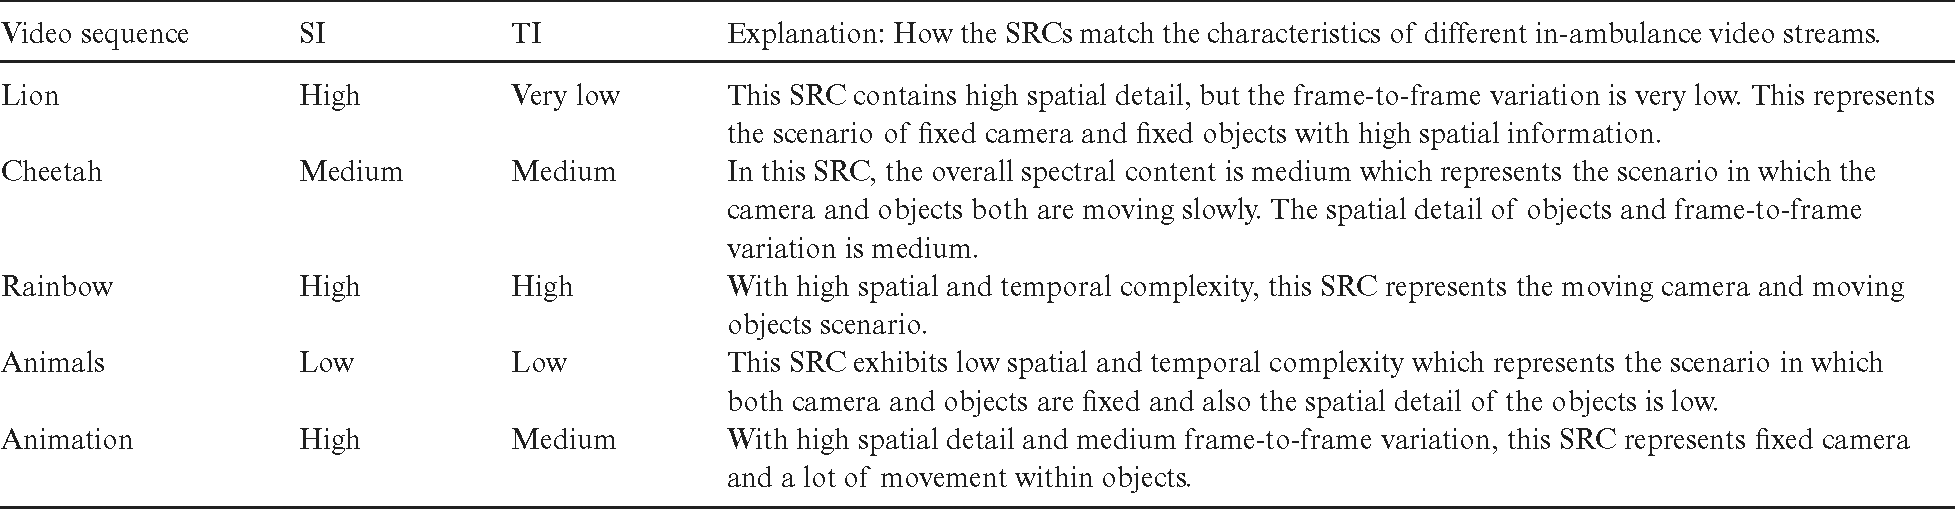
SI and TI result in numerical values that range between 0–100, where higher values mean higher spectral content. Fig. 3 shows the calculated SI and TI values for each of the seven SRCs from the VQEG-HD video dataset. Finally, Tab. 2 summarizes the selection of five SRCs from the VQEG-HD dataset which was done carefully for conducting a meaningful subjective test. The table clearly shows how these SRCs were matched with the characteristics of an in-ambulance video streaming scenario. The other two videos in Fig. 3, namely basketball match and a building with trees were not included in the tests in order to avoid redundancy.

Figure 3: SI-TI plot for FHD SRCs taken from VQEG-HD test dataset [24]
Table 2: Selection of videos for the subjective experiment
The next step in our experiment design was to compress the videos using HEVC and VVC and the details for this process are given in the next subsection.
3.1.2 Preparation of PVSs from the SRCs
After selection of SRCs, we compressed each video at eight different compression levels using both HEVC and VVC codecs. The compression levels are defined by eight quantization parameter (QP) values. Quantization parameter or QP performs non-uniform compression for each video frame of an SRC as compared to constant rate factor (CRF). The compression levels were selected based on the existing literature as explained in Section II of this paper. The flowchart in Fig. 4 gives a very clear explanation of what settings and profiles were used to compress the videos at eight QP levels.

Figure 4: An illustration explaining the preparation of PVSs for the subjective experiment
We used FFMPEG for HEVC compression and VTM 8.0 for VVC compression, where the former is commonly known as  265 and the latter is freely made available by the developers of VVC. The VTM 8.0 was built on a Macintosh system running MAC OS Catalina using the clang version 11.0. The eight selected QP values range between 27 and 41 with a step size of two, i.e.,
  , 29, 31, 33, 35, 37, 39 and 41. As both the encoders HEVC and VVC have been developed by the same developers, i.e., JVET, so the compression levels in terms of QP were kept the same for both.
When all the five SRCs are compressed using HEVC and VVC at eight compression levels, then forty PVSs are produced for each encoder. As the results of this subjective experiment will be used to develop a video compression system for live video streaming in connected ambulances, so we used the minimum delay profiles for both the encoders. For HEVC we used the zero-latency profile and for VVC we used the low delay profile. The spatial and temporal resolution along with the bit depth were kept at native, i.e.,  , 24 fps and 8 bits per color channel respectively.
After selection and compression of SRCs, the next step of this experiment was the selection of participants which is briefly described in the next subsection.
3.2 Description of Participants
The ITU recommends different subjective experiments and related measurements for different types of videos in the ITU-R BT.500-14 [6] and ITU-T P.910 [5]. According to the ITU requirements number of non-expert participants required for a test should be minimum 15. As the videos used in this subjective experiment are general purpose videos, so we included non-expert participants in our test. A total of 24 participants took part in the subjective tests with a good mix of gender, age and qualification. The participants were from undergraduate, postgraduate and doctoral level and had no prior knowledge or experience about video quality assessment or related fields. The subjective measurements from these participants were refined for any outliers and the results are provided in section IV of this paper.
The test methodology and the setup for conducting the tests is explained in the next subsection.
3.3 Test Methodology and Experimental Setup
There are several methodologies for performing subjective experiments for multimedia services that are detailed in ITU-R BT.500-13 [6] and ITU-T P.910 [5]. Based on our understanding of BT.500-14 [6] and recent literature [18,19], we have chosen the Double Stimulus Continuous Quality Scale (DSCQS) Type-II for our subjective experiment. The scale DSCQS Type II is suitable for estimating the subjective quality of videos that contain spatial impairments, e.g., compression. An equally divided five-point rating scale ranging between one and five is used, where one refers to poor quality and five refers to excellent quality. This scale is clearly defined in ITU-R BT 500-14 [6]. In DSCQS type-II, a participant is shown two videos side by side, out of which one is an SRC and the other a PVS. Unaware of which one is the SRC, the participants view both the videos simultaneously and based on their perception, score both the videos on the five-point continuous quality scale. The five-point ratings or scores are then converted to a normalized scale of 0–100 for ease of further calculations. The continuous quality scale, along with the normalized scale, is well defined in Tab. 3.
Table 3: Continuous quality rating scale

The ratings of the participants are recorded and are referred as opinion scores (OS). The mean of these scores is known as the mean opinion score (MOS). Subjective measurements for DSCQS type II are usually recorded using the differential MOS (DMOS) which is calculated by taking the difference of MOS for the SRC and PVS. DMOS is calculated as follows:

where,

where,  is the opinion score of ith
  participant for the mth video sequence. An illustration of DSCQS type-II and differential opinion score (DOS) is given in Fig. 5.

Figure 5: Continuous quality rating scale DSCQS type-II
The next subsection explains the test environment and materials used in the subjective experiment.
3.3.2 Experimental Setup and the Subjective Test
A room specifically designated for the subjective experiments was prepared which had white painted walls and no other visible distractions. A desk mounted with an FHD 21-inch LCD non-glare display was placed in the room along with a chair. The temperature level and gamma level for the display were kept at 6500 Kelvins and 2.2 respectively. The processing unit connected to the display was hidden under the desk to create a complete distraction free environment as per the strict guidelines for subjective experiments [6]. The viewing distance and angle were kept according to the FHD resolution as per the guidelines in [6].
As VVC has very recently been standardized, so the conventional playback tools do not support it. Other open source tools used for subjective experiments also do not support smooth playback for VVC compressed videos, so for this reason we used the FFPLAY provided by FFMPEG. FFPLAY recently included necessary libraries to run a VVC compressed video as recently published studies were unable to use FFPLAY [3].
The tests were conducted in two phases as ITU BT 500-14 recommends each test to be less than 30 minutes of duration to avoid participants being fatigued. First phase of the test included only HEVC compressed PVSs and second phase contained the VVC compressed PVSs. Both phases were conducted on two different days but with the same participants. After completion of the tests, the MOS and DMOS were calculated from the subjective measurements for each test condition.
In the next section we have provided detailed results from refining the subjective measurements to an in-depth analysis of which encoder outperforms other in terms of compression ratio, perceptual quality and bitrate savings.
4.1 Refining the Subjective Scores
After we successfully conducted both the phases of the subjective experiment and we proceeded with refining the recorded measurements. The refinement process is done so that only those scores are kept that represent the accurate perceptual quality of PVSs. Observers, whose scores contain outliers are not considered in further calculation and representation of results. For this purpose, ITU BT. 500-14 has provided very clear methods in annex 1 for screening the subjective measurements [6]. After screening the scores of each observer, we were able to detect outliers from only one observer and consequently we discarded the scores of that observer. The boxplots in Figs. 6 and 7 are a representation of subjective measurements from all the twenty-four test participants and contain outliers as well. It can be seen that for both, HEVC and VVC compressed videos, outliers are detected for only one video sequence, i.e., Animals.
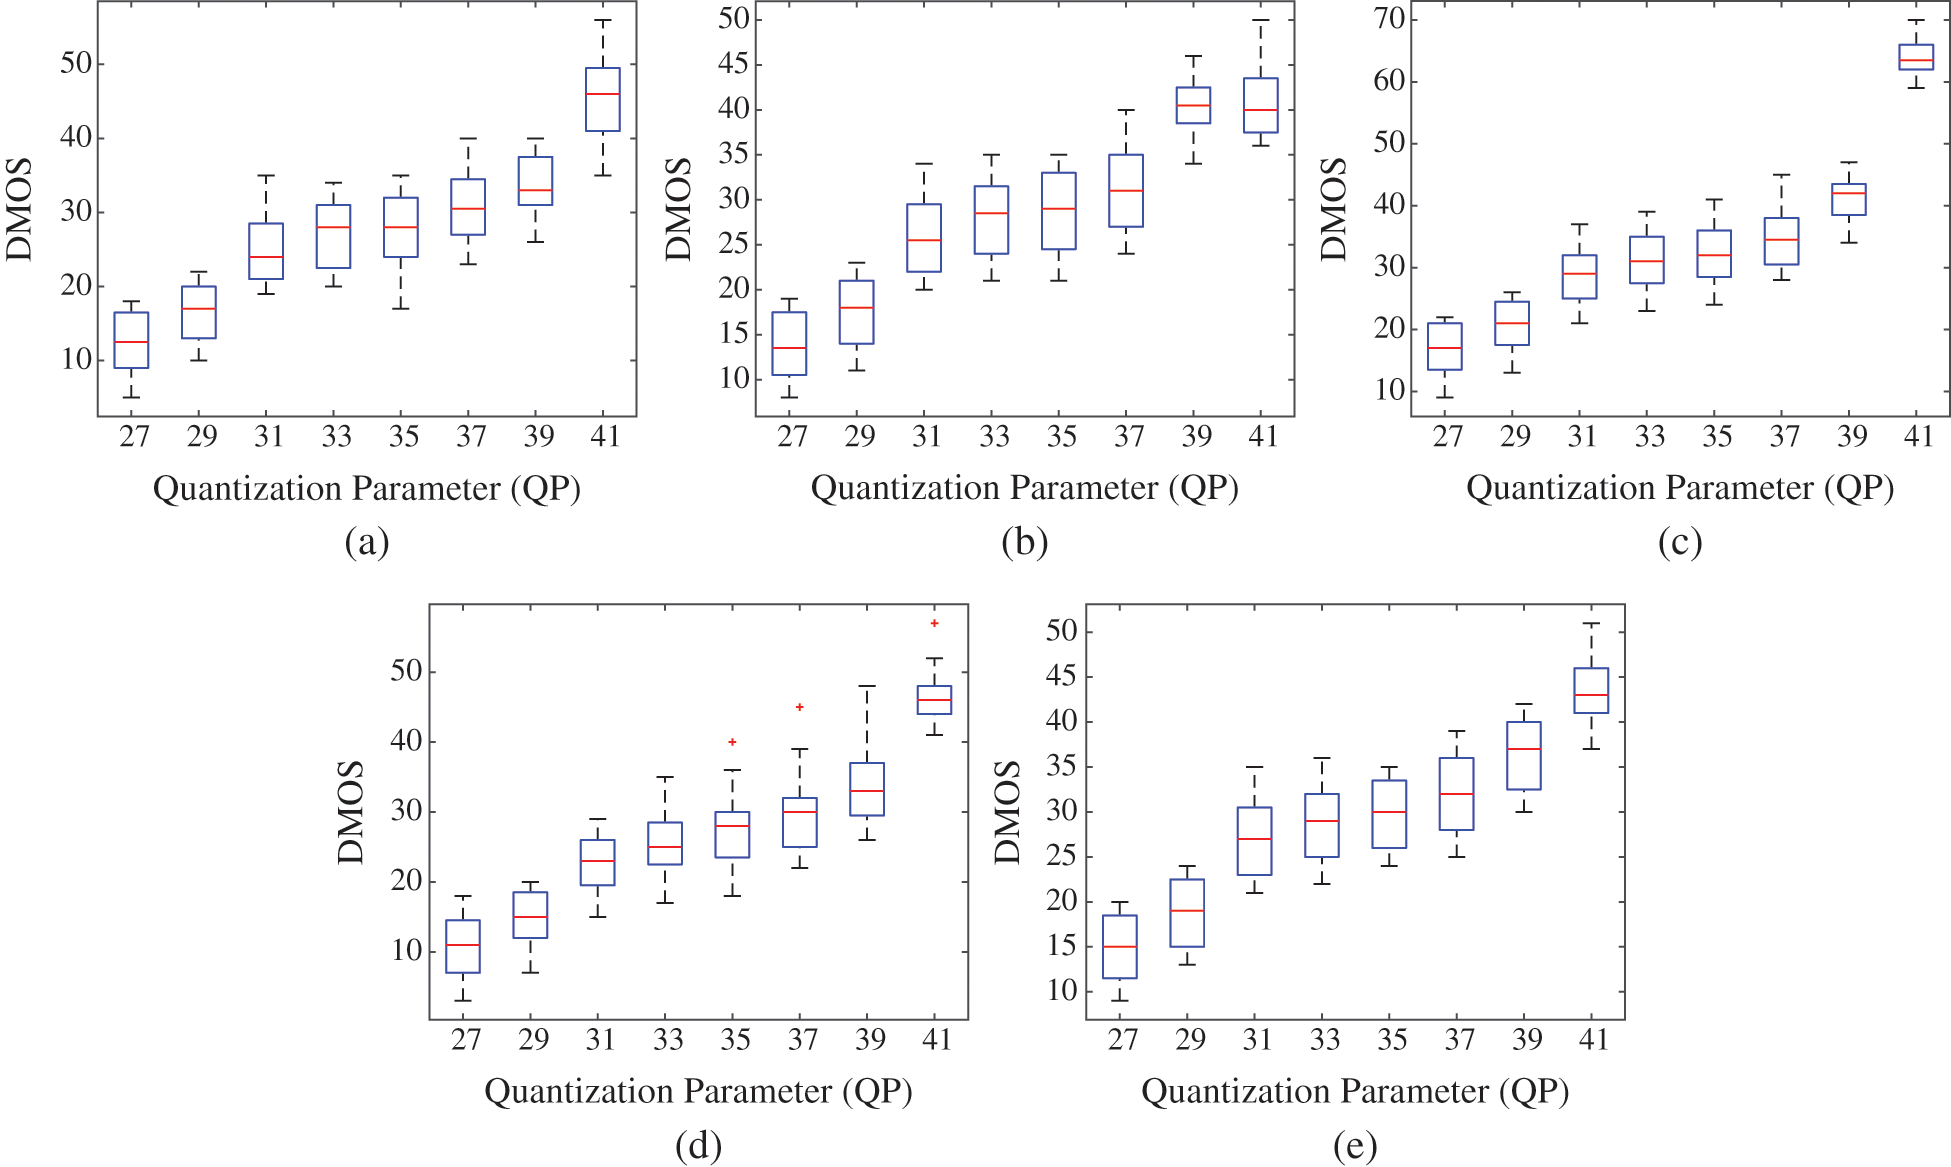
Figure 6: Boxplots for DMOS for HEVC compressed videos. (a) Lion, (b) Cheetah, (c) Rainbow, (d) animals, and (e) animation. The ‘+’ marker shows outliers which can be seen in Fig. 6d

Figure 7: Boxplots for DMOS for VVC compressed videos. (a) Lion, (b) Cheetah, (c) Rainbow, (d) animals, and (e) animation. The ‘+’ marker shows outliers which can be seen in Fig. 7d
Observing the boxplots for the HEVC compressed PVS Animals in Fig. 6d, it can be seen that outliers were detected for three compression levels, i.e., QP = 35, 37 & 41. For all other PVSs, it can be seen that no outliers are detected. Based on these results, we scrutinized the subjective measurements and were able to discard the scores of one participant that resulted in these outliers. Similar trend can be observed in the boxplots for the VVC compressed PVS Animals in Fig. 7d, as outliers can be seen for four different compression levels i.e., QP = 33, 35, 37 & 39. This led us to examine the subjective scores for VVC compressed videos and we were able to discard the scores of the participant that was leading to outliers.
Based on this screening process, the results presented in further sections are based on subjective measurements from twenty-three participants.
4.2 Subjective Test Results for Both Video Codecs
This subsection discusses the subjective test results in detail for both the video codecs under study. Observing the bar-graphs in Fig. 8 for each HEVC compressed video sequence, it can be observed that the videos compressed at QP = 27 have DMOS between 1 to 20 which corresponds to excellent quality according to the continuous quality scale in Tab. 3. Similar trend can be observed for videos compressed at QP = 29 except for the PVS Rainbow as its DMOS lies between 20 to 40 which translates to good quality. As the video sequence Rainbow contains high spectral contents, as shown in Fig. 3, so it is expected that the compression artefacts in this video are more visible to human eye, hence resulting in a higher DMOS. Observing the results for further compression levels of QP = 31, 33, 35 and 37 it can be seen that all the PVSs exhibit good quality with a DMOS range between 21 to 40 according to the continuous quality rating scale in Tab. 3. This shows that the test participants were not able to accurately identify the compression artefacts in HEVC compressed FHD videos for QP range of 31–37. For the last two compression levels QP = 39 and 41 the results are a mix of good and fair quality. The video sequences Lion, Animals and Animation have a DMOS between 21 to 60 which corresponds to good and fair quality for QP values of 39 and 41 respectively. Whereas, the video sequence Cheetah exhibits fair quality with a DMOS ranging between 41 to 60 for both QP values. Finally, the video sequence Rainbow exhibits fair and bad quality with a DMOS ranging between 41 to 80 for QP values of 39 and 41 respectively. The peculiarity of the video sequence Rainbow is due to its high temporal and spatial content which corresponds to the scenario in which a moving camera is capturing moving objects as explained in Tab. 2.

Figure 8: Bar Graphs for DMOS for HEVC and VVC Compressed videos for all eight QP values. (a) Lion, (b) Cheetah, (c) Rainbow, (d) animals, and (e) animation
Further, observing the bar-graphs in Fig. 8 it can be seen that the DMOS for VVC compressed PVSs is slightly different than HEVC compressed PVSs. For all the 40 PVSs, it can be seen that for videos compressed at P = 27 and 29 the DMOS ranges between 1 to 20 which corresponds to excellent video quality. This trend is the same as HEVC compressed PVSs except for the video Rainbow. Further, for QP = 31, the DMOS for the videos Lion and Animals follow the same trend as lower QP values. Whereas, the videos Cheetah, Rainbow and Animation exhibit good quality and their DMOS ranges between 41 to 60. For higher QP values ranging between 33 and 37, the DMOS ranges between 21 to 40 which corresponds to good video quality. This shows that for content compressed using VVC, the participants were unable to differentiate compression artefacts even when compression level was higher. Similar trend can be seen for PVSs compressed at QP = 39 except for the Rainbow video sequence. Finally, for QP = 41, the PVSs Lion, Rainbow and Animation show DMOS values ranging between 41 to 60 which translates to fair video quality according to the continuous quality scale in Tab. 3. Rest of the PVSs compressed at QP = 41 exhibit good quality.
The next subsections explain the subjective results further in detail from different perspectives.
4.3 Rate-Quality: DMOS vs. Bitrate
In this subsection, we have discussed the results in terms of rate-quality for both HEVC and VVC compressed videos. A rate quality curve helps understand the bitrate requirements for a video codec to encode at a certain quality level.
Observing the graphs in Fig. 9 it can be seen that for HEVC compressed video sequences, excellent quality can be achieved at a bitrate ranging between 2.5 Mbps to 4 Mbps, for videos that contain low to medium level spectral content in them. The markers in these figures represent eight QP levels and the bitrates ranging between 2.5 Mbps to 4 Mbps correspond to QP 27 and 29. But for achieving excellent quality for videos containing high spectral content i.e., high motion complexity, the bitrate ranges between 6 Mbps to 9 Mbps. This can be seen in Fig. 9c which shows results for the video sequence Lion. Further it can be noticed that for achieving good quality level the bitrate requirements, for videos with low to medium motion complexity, range between 0.5 Mbps to 2 Mbps for HEVC compressed content. These bitrates correspond to QP values ranging between 31 to 37. But this is not the case for videos containing high spectral content, as it can be seen in Fig. 9c that for achieving good quality the bitrate needs to be between 2 Mbps to 5 Mbps. Regardless of the spectral content of the videos, for HEVC, excellent and good quality levels can be achieved at bitrates ranging between 2.5 Mbps to 9 Mbps and 0.5 Mbps to 5 Mbps respectively. Further calculations show that HEVC compression in FHD videos can achieve a compression ratio ranging between 119:1 to 390:1 while maintaining excellent quality and 198:1 to 1300:1 while maintaining good quality. The variations in bitrate requirement and compression ratio is because every video contains different spatial and temporal complexity.

Figure 9: Rate-quality curves depicting the variation of DMOS with bitrate for both HEVC and VVC. (a) Lion, (b) Cheetah, (c) Rainbow, (d) animals, and (e) animation
For VVC compressed videos, it can be seen in Fig. 9 that the bitrate requirements are less as compared to HEVC. For achieving excellent quality in VVC based compression, the bitrate requirements range between 1 and 2.5 Mbps for videos with low-medium motion complexity. These bitrates correspond to QP values of 27 to 31. Further for videos with same motion complexity, good quality can be achieved with a bitrate ranging between 0.3 to 1 Mbps. These bitrates correspond to VVC PVSs that are compressed at QP levels of 33 to 37 and in some cases 39 as can be seen in Fig. 9. Like HEVC compressed videos, similar trend can be seen for VVC compressed videos when it comes to videos containing high spectral content. Bitrate ranging between 4 to 6 Mbps is required to achieve excellent quality and 1.5 to 4.5 Mbps is required to achieve good quality. Overall, maintaining excellent video quality in FHD videos using VVC based compression is achievable at bitrates ranging between 1 to 6 Mbps and for good quality between 0.3 to 4.5 Mbps. Further calculations for VVC compressed FHD videos show that a compression ratio ranging between 168:1 to 592:1 can be achieved while maintaining excellent video quality and 299:1 to 1600:1 can be achieved while maintaining good quality.
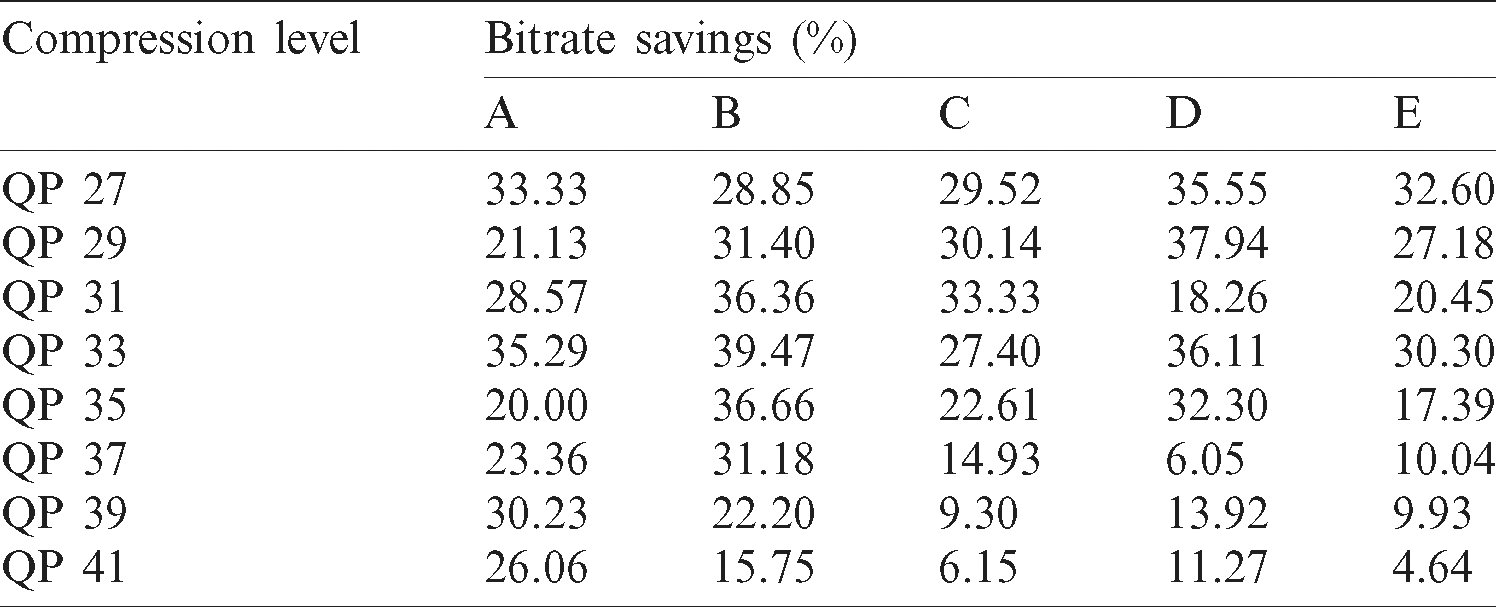
It was mentioned in earlier sections of this paper, VVC being the potential successor of HEVC promises upto 50% savings in terms of bitrate while maintaining same video quality. From the results presented in this subsection it can be inferred that VVC compressed videos have a significantly less bitrate as compared to HEVC compressed videos while maintain the same quality levels. In Tab. 4 we have presented results in terms of bitrate savings for VVC codec as compared to HEVC. It can be seen that VVC can achieve upto 40% of bitrate savings compared to its predecessor HEVC.
Table 4: Bitrate savings (%) for VVC per PVS compared to HEVC
In the next subsection we have summarized the performance of HEVC compared to VVC by measuring the degree of overlap between the two codecs in terms of perceptual quality.
4.4 Degree of Overlap: VVC vs. HEVC in Terms of Quality
Tabs. 5 and 6 show the results in terms of continuous quality rating with five categories namely excellent, good, fair, bad and poor as shown in Tab. 3. These five categories from both tables are used to measure the degree of overlap between VVC and HEVC. A flag of ‘1’ assigned if both video codecs exhibit same quality rating for a single test condition, otherwise ‘0’ is assigned. Here test condition refers to compression level in terms of QP. For example, observing Tabs. 5 and 6, it can be seen that the video sequence Animation has the same quality rating for all eight test conditions for both VVC and HEVC video encoder. After assigning flags to each test condition, following calculation is done to estimate the degree of Overlap for all the videos.

For each SRC, total test conditions were eight in terms of QP for both video encoders. Using Eq. (6) we calculated the degree of overlap in terms of quality across both video encoders and the results are shown in Fig. 10. It can be observed that the video sequence Rainbow having high temporal and spatial complexity, has the lowest degree of overlap which amounts to 62.5%, whereas the video sequence Animation has 100% degree of overlap. The clips Cheetah and Animals have the same degree of overlap that amounts to 75%, and the clip Lion shows 87.5% degree of overlap across both encoders. Finally, the overall degree of overlap for both video encoders amounts to 71%.
Table 5: Continuous quality scale-based categorization of subjective DMOS for the HEVC compressed videos
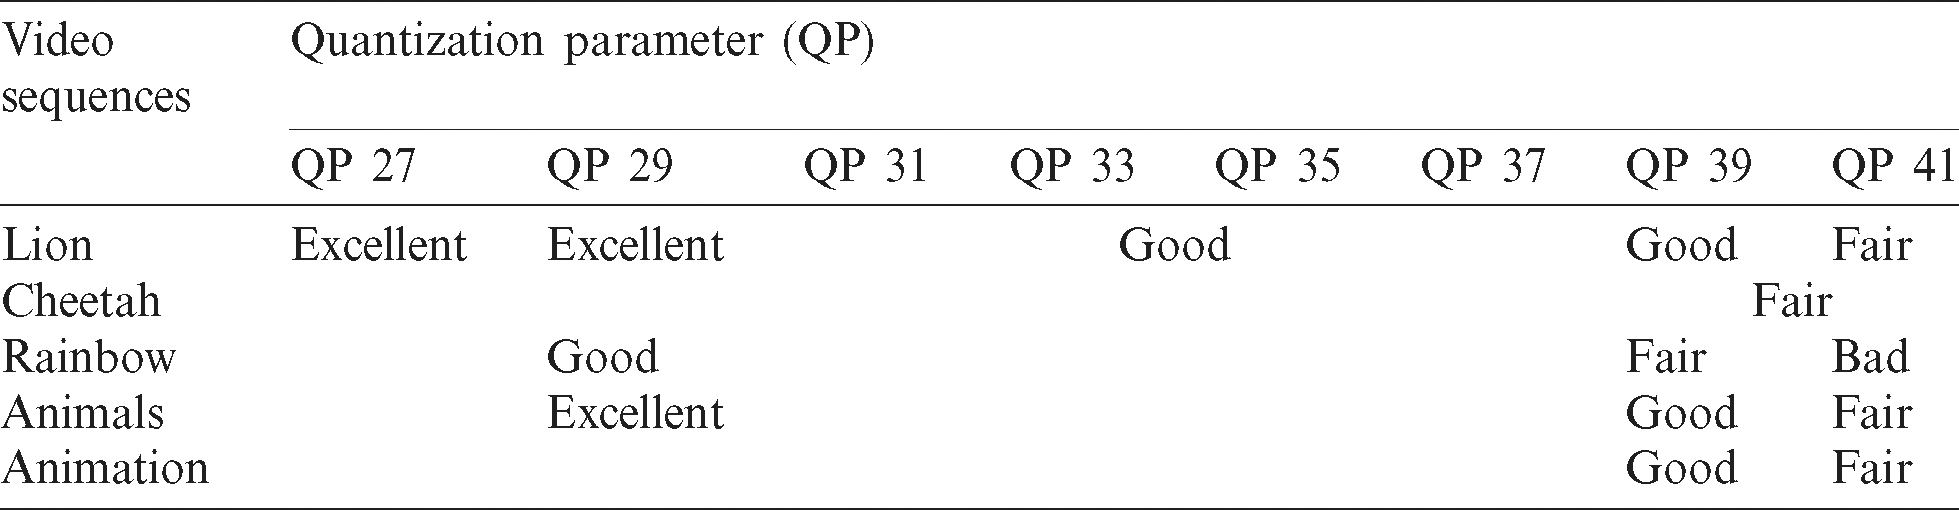
Table 6: Continuous quality scale-based categorization of subjective DMOS for the VVC compressed videos
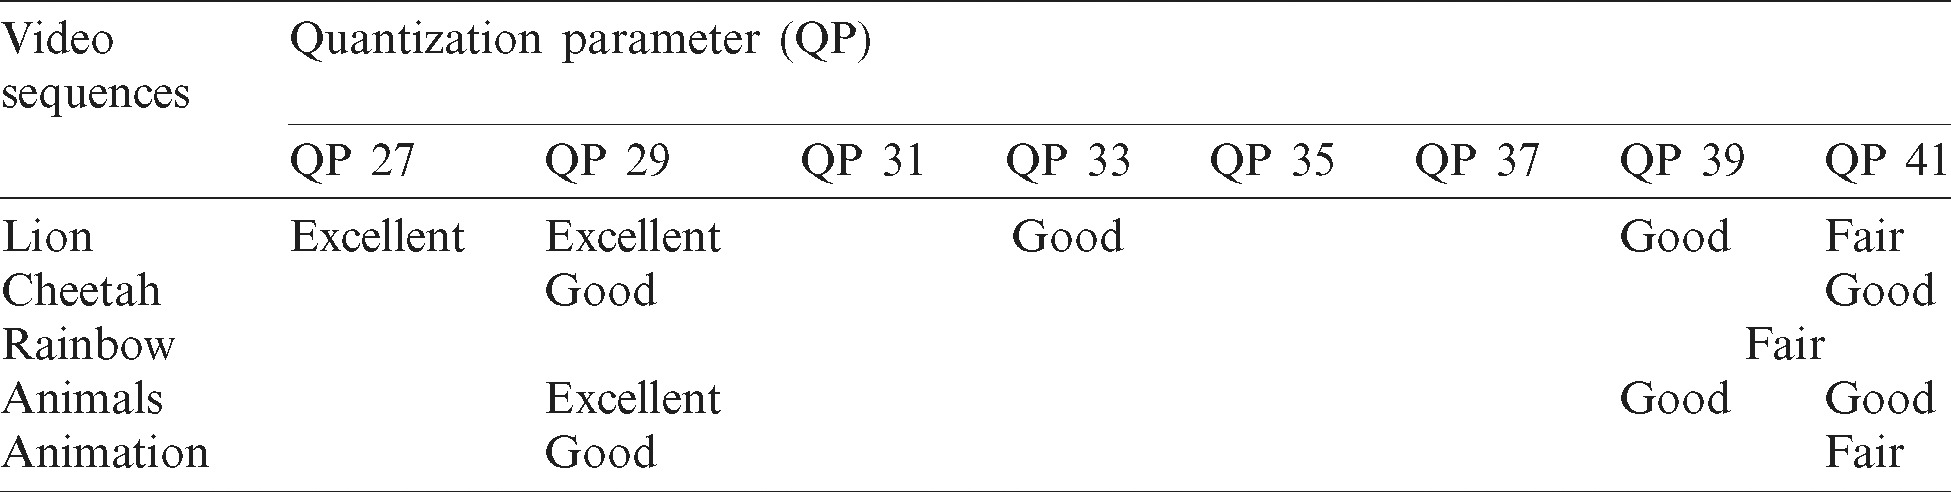

Figure 10: Degree of overlap across both video codecs in terms of perceptual quality
This shows that VVC and HEVC have a high degree of overlap in terms of perceptual quality. Observing Tabs. 5 and 6, it can be seen that VVC compressed videos exhibit better quality rating in some cases, especially at higher compression levels, but 71% overlap means HEVC can provide almost the same level of quality as VVC.
In this paper, a detailed subjective study was presented to compare two state-of-the-art video encoders HEVC and VVC in terms of estimating the impact of compression on perceptual quality. Eight different test conditions were used on five unique SRCs taken from VQEG-HD test dataset which resulted in forty PVSs for each encoder. A subjective test comprising of 24 participants was conducted in two separate phases for both HEVC and VVC processed videos. The subjective tests were carefully planned, structured and conducted by strictly maintaining every recommendation of ITU BT-500-14. We covered all the aspects of impact of compression artefacts, in terms of QP, on perceptual quality by recording the subjective ratings from all the test participants and processing them further to have valuable results.
Based on our findings, it can be concluded that for FHD videos VVC outperforms HEVC significantly in terms of bitrate savings. Our results show that VVC can reduce bitrates upto 40%, hence resulting in reduction of bandwidth and storage consumption, while maintaining same or even better visual quality as HEVC. For achieving excellent video quality in compressed FHD videos, VVC requires a bitrate of 1 Mbps to 6 Mbps which is substantially lower than what is required by HEVC i.e., 2.5 Mbps to 9 Mbps. Furthermore, our findings conclude that in terms of quality, there is an overall 71% degree of overlap across both the video encoders for all the considered test conditions.
As mentioned earlier, the results from this study will be used to develop a video streaming system for mobile healthcare and based on our reported results and findings, we conclude that VVC can save substantial amount of bandwidth and storage as compared to its predecessor HEVC. But HEVC, being commercially available for a long time qualifies for real time video streaming applications, whereas VVC is relatively very new and has recently been standardized. On the time of writing, VVC, in its current state, cannot be used in real-time video streaming applications and services as the compression times are much higher as compared to HEVC. The aim of this study was to estimate the performance of VVC as compared to HEVC for its future use in real-time applications such as connected ambulance.
Funding Statement: This research was supported by Innovate UK, which is a part of UK Research & Innovation, and Pangea Connected Ltd., under the Knowledge Transfer Partnership (KTP) program (Project No. 11433).
Conflicts of Interest: The authors declare that they have no conflicts of interest to report regarding the present study.
References
1. M. A. Usman, N. Y. Philip and C. Politis. (2019). “5G enabled mobile healthcare for ambulances,” in IEEE Globecom Workshops, Waikoloa, Hawaii, USA.
2. M. A. Usman, M. R. Usman and S. Y. Shin. (2018). “Exploiting the spatio-temporal attributes of HD videos: A bandwidth efficient approach,” IEEE Transactions on Circuits and Systems for Video Technology, vol. 28, no. 9, pp. 2418–2422.
3. A. S. Panayides, M. S. Pattichis, M. Pantziaris, A. G. Constantinides and C. S. Pattichis. (2020). “The battle of the video codecs in the healthcare domain-a comparative performance evaluation study leveraging VVC and AV1,” IEEE Access, vol. 8, pp. 11469–11481.
4. Fraunhofer Heinrich Hertz Institute, Joint Video Experts Team (JVET). (2020). “Joint Video Experts Team (JVETTest Model 8 of Versatile Video Coding (VTM 8),” . [Online] https://vcgit.hhi.fraunhofer.de/jvet/VVCSoftware_VTM.
5. ITU-T Recommendation, Audiovisual quality in multimedia services, P. 910. (2008). “Subjective video quality assessment methods for multimedia applications,” . [Online] https://www.itu.int/rec/T-REC-P.910-200804-I.
6. ITU-R. Recommendation, BT. 500-14. (2019). “Methodology for the subjective assessment of the quality of television images,” . [Online] https://www.itu.int/rec/R-REC-BT.500.
7. Q. Zhang, J. Liu and G. Zhao. (2018). “Towards 5G enabled tactile robotic telesurgery,” in, arXiv:1803.03586.
8. L. Leveque, H. Liu, S. Baraković, J. B. Husić, M. Martini et al. (2018). , “On the subjective assessment of the perceived quality of medical images and videos,” in 10th IEEE Int. Conf. on Quality of Multimedia Experience (QoMEXSardinia, Italy.
9. A. S. Panayides, M. S. Pattichis and C. S. Pattichis. (2013). “Mobile health systems use diagnostically driven medical video technologies,” IEEE Signal Processing Magazine, vol. 30, no. 6, pp. 163–172.
10. A. Panayides, M. S. Pattichis, C. S. Pattichis, C. N. Schizas, A. Spanias et al. (2010). , “An overview of recent end-to-end wireless medical video telemedicine systems using 3G,” in Annual Int. Conf. of the IEEE Engineering in Medicine and Biology, Buenos Aires, Argentina, pp. 1045–1048. [Google Scholar]
11. A. Panayides, M. S. Pattichis, C. S. Pattichis, C. P. Loizou, M. Pantziaris et al. (2011). , “Atherosclerotic plaque ultrasound video encoding, wireless transmission, and quality assessment using H. 264,” IEEE Transactions on Information Technology in Biomedicine, vol. 15, no. 3, pp. 387–397. [Google Scholar]
12. C. J. Debono, B. W. Micallef, N. Y. Philip, A. Alinejad, R. S. H. Istepanian et al. (2012). , “Cross-layer design for optimized region of interest of ultrasound video data over mobile WiMAX,” IEEE Transactions on Information Technology in Biomedicine, vol. 16, no. 6, pp. 1007–1014. [Google Scholar]
13. E. Cavero, A. Alesanco and J. Garcia. (2014). “Real time echocardiogram transmission protocol based on regions and visualization modes,” IEEE Journal of Biomedical and Health Informatics, vol. 18, no. 5, pp. 1668–1677. [Google Scholar]
14. A. Panayides, Z. Antoniou, V. I. Barberis, M. S. Pattichis, C. S. Pattichis et al. (2012). , “Abdominal aortic aneurysm medical video transmission,” in IEEE-EMBS Int. Conf. on Biomedical Health Informatics, Hong Kong, pp. 679–682. [Google Scholar]
15. R. Delhaye, R. Noumeir, G. Kaddoum and P. Jouvet. (2019). “Compression of patient’s video for transmission over low bandwidth network,” IEEE Access, vol. 7, pp. 24029–24040. [Google Scholar]
16. M. Hanif, R. A. Naqvi, S. Abbas, M. A. Khan and N. Iqbal. (2020). “A novel and efficient 3D multiple images encryption scheme based on chaotic systems and swapping operations,” IEEE Access, vol. 8, pp. 123536–123555. [Google Scholar]
17. Z. Antoniou, A. S. Panayides, M. S. Pattichis, S. Stavrou, E. Kyriacou et al. (2015). , “Adaptive emergency scenery video communications using HEVC for responsive decision support in disaster incidents,” in 37th Annual Int. Conf. of the IEEE Engineering in Medicine and Biology Society (EMBCItaly, pp. 173–176. [Google Scholar]
18. Z. C. Antoniou, A. S. Panayides, M. Pantzaris, A. G. Constantinides, C. S. Pattichis et al. (2018). , “Real-time adaptation to time-varying constraints for medical video communications,” IEEE Journal of Biomedical and Health Informatics, vol. 22, no. 4, pp. 1177–1188. [Google Scholar]
19. M. A. Usman and M. G. Martini. (2019). “On the suitability of VMAF for quality assessment of medical videos: Medical ultrasound & wireless capsule endoscopy,” Computers in Biology and Medicine, vol. 113, 103383. [Google Scholar]
20. M. A. Usman, M. R. Usman and S. Y. Shin. (2017). “Quality assessment for wireless capsule endoscopy videos compressed via HEVC: From diagnostic quality to visual perception,” Computers in Biology and Medicine, vol. 91, pp. 112–134. [Google Scholar]
21. S. Khire, S. Robertson, N. Jayant, E. A. Wood, M. E. Stachura et al. (2012). , “Region-of-interest video coding for enabling surgical telementoring in low bandwidth scenarios,” in Military Communications Conf. (MILCOMOrlando, Florida, USA. [Google Scholar]
22. S. Wang, M. Parsons, J. Stone-McLean, P. Rogers, S. Boyd et al. (2017). , “Augmented reality as a telemedicine platform for remote procedural training,” Sensors, vol. 17, no. 10. [Google Scholar]
23. T. Nazir, A. Irtaza, A. Javed, H. Malik, D. Hussain et al. (2020). , “Retinal image analysis for diabetes-based eye disease detection using deep learning,” Applied Sciences, vol. 10, no. 18. [Google Scholar]
24. A. Webster and F. Speranza. (2010). “Report on the validation of video quality models for high definition video content,” in Technical Report, Video Quality Experts Group, Boulder, Colorado, USA. [Google Scholar]
 | This work is licensed under a Creative Commons Attribution 4.0 International License,, which permits unrestricted use, distribution, and reproduction in any medium, provided the original work is properly cited. |