DOI:10.32604/cmc.2021.014848
| Computers, Materials & Continua DOI:10.32604/cmc.2021.014848 | |
| Article |
Generic Attribute Scoring for Information Decay in Threat Information Sharing Platform
Department of Information Technology, Majmaah University, Majmaah, 11952, Saudi Arabia
*Corresponding Author: Mohammed Alshehri. Email: ma.alshehri@mu.edu.sa
Received: 21 October 2020; Accepted: 19 November 2020
Abstract: Cyber Threat Intelligence (CTI) has gained massive attention to collect hidden knowledge for a better understanding of the various cyber-attacks and eventually paving the way for predicting the future of such attacks. The information exchange and collaborative sharing through different platforms have a significant contribution towards a global solution. While CTI and the information exchange can help a lot in focusing and prioritizing on the use of the large volume of complex information among different organizations, there exists a great challenge ineffective processing of large count of different Indicators of Threat (IoT) which appear regularly, and that can be solved only through a collaborative approach. Collaborative approach and intelligence sharing have become the mandatory element in the entire world of processing the threats. In order to covet the complete needs of having a definite standard of information exchange, various initiatives have been taken in means of threat information sharing platforms like MISP and formats such as SITX. This paper proposes a scoring model to address information decay, which is shared within TISP. The scoring model is implemented, taking the use case of detecting the Threat Indicators in a phishing data network. The proposed method calculates the rate of decay of an attribute through which the early entries are removed.
Keywords: Information interchange; cyber threat intelligence; indicators of threats; threat intelligence sharing platform
Over the last decade, many organizations have carried out emergent research in sharing threat information and cyber-attacks [1]. There is an urgent need to join the forces on the fight against these attacks exponentially growing over time. The count and the complexity of these attacks have also increased through the years that resulted in many intrusions with more severe breaches on the security aspect. It is a nightmare for detecting these complex and diverged attacks by their own as an individual organization. Hence, organizations share information that is available on different incidents and cyber-attacks. These pieces of information are called Cyber Threat Intelligence (CTI). However, the research shows that it is very challenging to achieve collaborative solutions, as many incidents reported are inaccurate and incomplete, which are also outdated. Different empirical analysis has shown that the quality of CTI plays a vital role in achieving continued success in moving towards a collaborative solution [2]. The information exchange and effective utilization depend on measuring quality. The essentiality is strengthened as the information quality stated has an impact on response time for an incident.
It is also important for the stakeholders to let know about the quality of CTIs. This can always help the analysts for narrowing down the information available for acquiring the necessary knowledge. Hence, analysts can develop better decisions on reacting to incidents reported within CTI [3]. On the other hand, the knowledge on the domain from security experts is an important source of “fitness” of a particular CTI artifact. In order to leverage the knowledge of experts, it is highly necessary for assessing data quality transparent [4]. As a further process, the users’ need to be allowed to contribute to the quality of threat intelligence which can increase the trust in both the platform and threat intelligence. Regularly, several new kinds of threats appear in the cyber-crime without indicators [5]. Fighting against these attacks individually has become impossible in recent times, which evolved the concept of community sharing, bringing out collaborative solutions for handling the problems. Collaborative approach and intelligence sharing have become the mandatory element in the entire world of processing the threats. Obviously, on one side, the information sharing has become a crucial point due to sensitive data, and on the other side, combined efforts for handling the problem directly impact the response time and the resources [6].
In order to address the quality of CTI and the Indicators of Threat, A generic attribute scoring model for information decay in the distributed exchange of information in a common TISP is proposed in this paper. The MISP is taken as the base sharing platform. The objective of MISP allows different users say it be from public or private IT-community, for sharing their information. Indicators of Threats, malware, and other compromised occurring are shared in this common platform [7]. It is not new that a piece of the given information is transited through different producer nodes to the target consumer. The MISP gives various other features for sharing the extra information on this context. Presently there are 59 taxonomies available in MISP for providing the context on a piece of the given information. The paper presents a scoring model that can use these operational parameters to help the attributes be given appropriate scores, which will help in decision-making on the quality of CTI. The rest of the paper is organized as follows: Section 2 presents the relevant research carried out in the similar domain, Section 3 gives the basic idea of the MISP, which is followed by the attribute scoring proposed. Section 4 elaborates on the generic scoring of the indicators of threats, and Section 5 discusses the evaluation through experiments. Section 6 presents a case study on the malware hashes, and the paper is concluded in Section 7 with scope for future works highlighted.
Large amounts of research have been carried out in cyber threats, ranging from automatic derivation of signatures to the exploration of anomaly identification mechanisms with the Machine learning methods [8,9]. However, only a few types of research have been successful in the efficient sharing of signatures. MISP [10] was indeed capable of sharing and exporting the signatures ingested by various IDS. It also gives features where the intrusion and detecting techniques and humans can prove feedbacks irrespective of the size of information and the validity. This feedbacks are then distributed among the communities that follow peer-peer data exchange [11]. The section below provides a gist of relevant research carried out in the interoperability issues and data formats for the CTI interchange among different platforms. A relevant study in cybersecurity [12] shows that one of the key elements for successful CTI is information interchange in different speculations either by a trusted third party or TISPs. A case study was presented in [13] on the sharing of information, where a critical survey was conducted on various aspects such as hurdles and issues and legal entities in the sharing of information. The major output from here is that the information exchange remains as a collective activity. In [14], it is presented that information exchange or sharing has many overheads, particularly in the CTI perspective. It also presented the key need for any successful TISP lies in the value-added data and privacy.
In [15], a facility for sharing the information and auto extraction of information is discussed. A redefinition on the problems of data control into a knowledge concept was also presented. This highlighted on the importance of non-neglecting of false positives. In [16], an assessment-based approach for the malware threats is presented based on the scores and different factors of attribute weight. In [17], a data mining technique was adopted, which uses the similarity metrics for identifying the statistical relationships among the information being shared. In [18], a data-driven technique was proposed to evaluate and visualize mixed data from news and other social media platforms based on emotional intelligence. A common method for the IDS is presented here that triggers security alarms. In [19], an empirical survey on the weight-based technique for attribute quality is presented. In [20], A requirement definition was proposed for the CTI platform. The requirements for such a platform includes certain QA measures and QC processes. The authors here have not specified the dimensions of the quality for assessing the proposed architecture’s CTI quality. In [21], the authors have pointed out that support is missing for the QC in the CTI management. Hence, It is proposed to have standard measures of quality among CTI sharing. The authors have proposed that it is essential for all organizations to have a definite QC process for providing multiple QA parameters. Even though QA’s need is discussed in detail, the authors failed to describe how such an assessment be implemented in a TISP. The Tab. 1 shows the related work in a comparative manner.
Table 1: Overview of the literature analysis
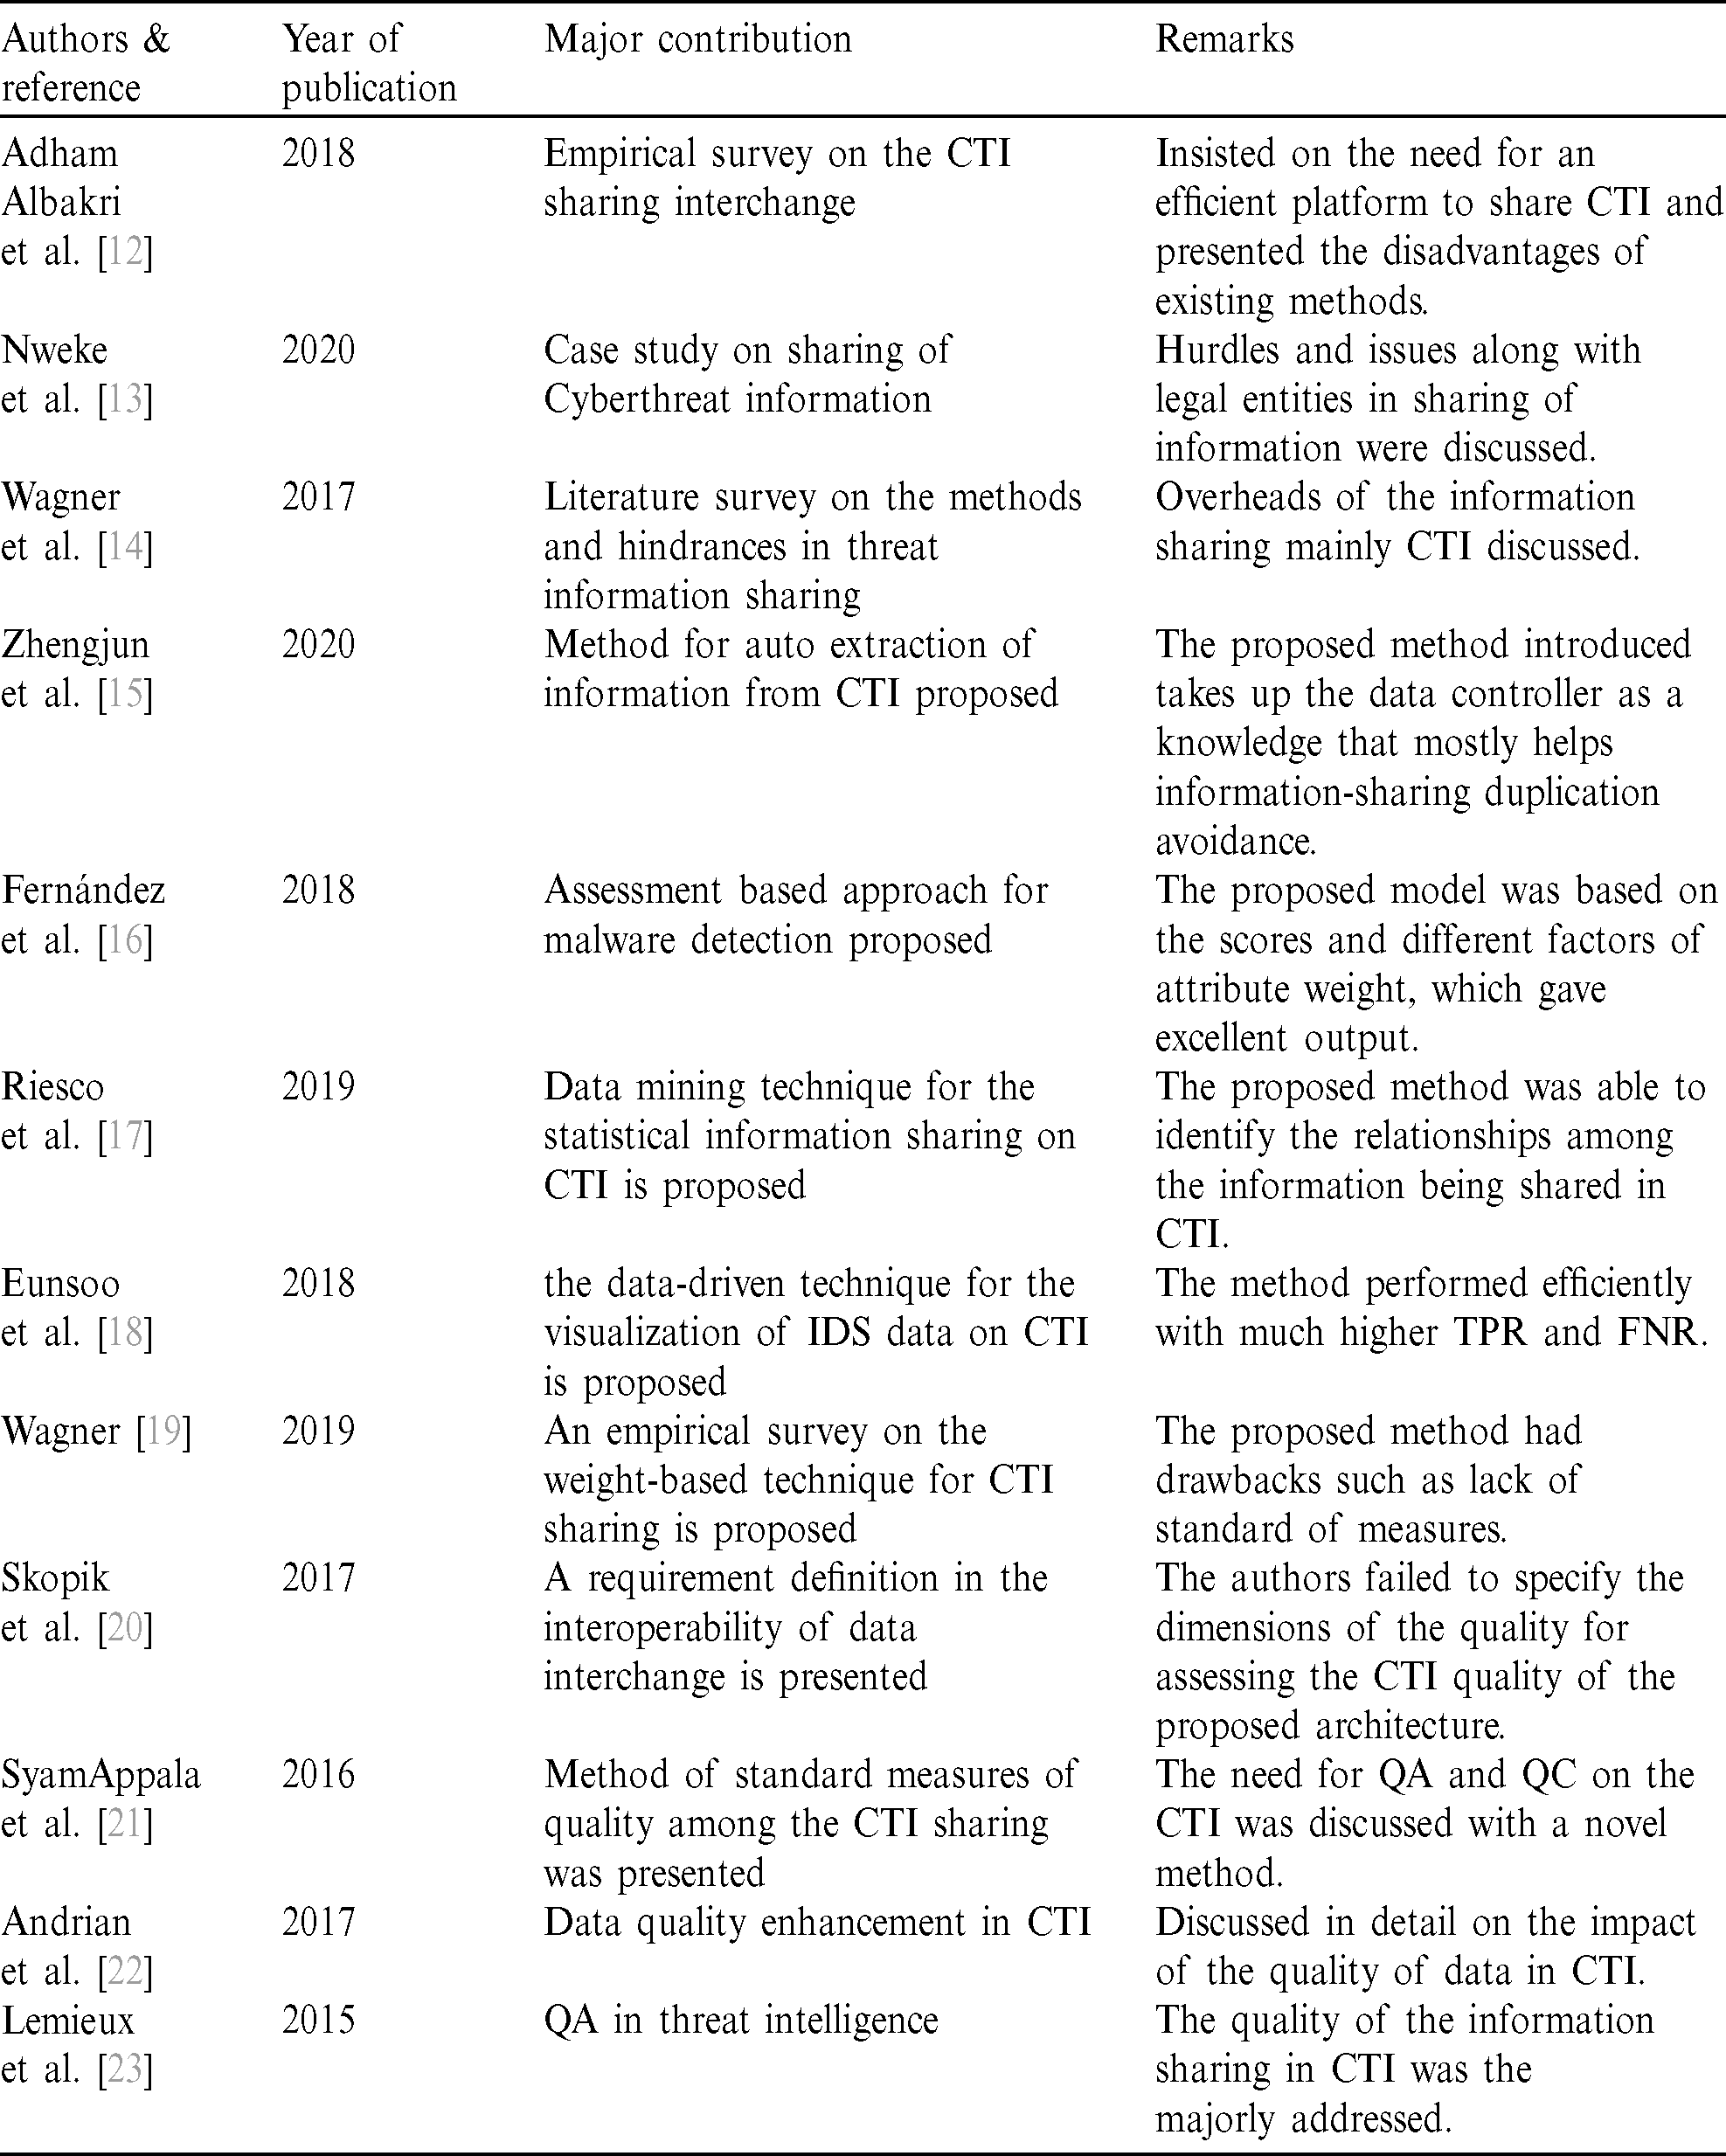
In [22], a series of group discussions were presented, which were conducted among various threat experts. They have derived several identifications as to how the quality of data can influence the threat information. Here, the authors suggested that there is no need to identify the new quality issues specific to the CTI domain. However, the authors have given various recommendations for future research directions that can bring out quality in data exchange. In [23], a novel methodology was presented for the evaluation of quality in threat intelligence. It also seems to be applied to a wider aspect of organizational security as the quality compromise in CTI can be a major issue. As an outcome of the survey, it can be said that no specific academic research that addresses the open issues presented above. Further, no TISPs that are commercialized can able to measure the quality of CTI actively.
MISP is one of the open-sourced TISP where the users from different communities could share all the information on the threats, especially on the Threat Indicators. It also offers a sharing platform for the financial mules that are used for money laundering. The data model of MISP is implemented in such a way that it can share information easily. The users here can decide the granularity of the information that he wishes to share with MISP, and at the same time, the level of sharing can also be set for the information he wishes to share. For getting familiar with the commonly used terminology of MISP, a few terms on the same are discussed. MISP follows a peer-peer architecture where various instances can exchange information among each other. The protocol used for synchronization in MISP results from the trial-error method, where the main conditions are aimed to be accurate, consistent, and scalable.
Any piece of information that is shared is called an event. An event usually comprises of attributes (IP addresses, hashes). Presently there are 145 types of attributes available in MISP. An attribute is usually identified with the tuple that is associated with it. An event can also be linked to context information such as the date, level of threat, description, and organization about the threat indicators. To effectively handle the information over load on the MISP and remove the burden of additional time load in filling the form, a text import option is also integrated, which allows the users to insert raw data by just copying and pasting. This text can then be analyzed using a heuristic technique for extracting the attributes that can be validated. In order to filter out the events, taxonomies are used. Fig. 3 shows the MISP interface.
4 Generic Scoring of Indicators of Threat
A basic understanding of the overhead of correctness handling in the information that is shared is needed. Few numbers provided from the MISP community discussed for this purpose. The case taken for the study is a consortium with 15312 users and 785 organizations. The users from these organizations have shared 9785 events, and there are supposed to be 135685 attributes until the latest dump (June 2019). The fact which makes tough for handling the attributes are more tedious is because of the non-homogeneous users. On one side, the user needs to use the data to implement security solutions such as to perform some blocking accesses based on the attributes that are shared, such as the hashes and IP address. Here, the False Negatives are not important as the data should be correct and more reliable. On the other side, some organizations need correlations among the attributes and inter-connect them with some additional Threat indicators. Hence reliable information on the data history is needed.
A generic attribute scoring method is proposed for the attributes that decay overtime in MISP, including the sightings and taxonomies and the reliability of sources. The lifetime of different attributes are not found to be homogeneous. For example, the hosts of some machines that are related to the IP address are altered and cleaned. The IPs ad the domains are traded and have got used variously over time. Hence, every attribute will have a decay function. The hash files usually do not tend to vary across time. Never a given shared file can be considered false-positive over a given time by the organization with an individual trust level. In order to thoroughly evaluate the attribute’s score, some of the predefined criteria are taken, which are as follows:
The initial score of the given attribute is termed as  It is the weight of the initial confidence of the source and different taxonomies attached to it. It also indicates the initial value in the life cycle of a Threat indicator. It is also represented as the new score of an indicator as and when a new sight is inserted.
• The period that is expressed between the time a particular attribute was first identified to the time it is identified lastly.
• The  of a given attribute represented as Ta gives the time where the total score is 0.
The rate of decay denoted by  gives the speed in which the total score gets decreased in due course of time. It is always preferable that the speed of decay is a variable and changes over time. For illustrating the same, the context of the IP address is considered. The decay rate of the given IP must be low in the initial hours, but are expected to decay faster as time goes on. When coming into the sighting, this IP’s initial activities have better prospects of being the threat indicators remain active or are executing the operations to be followed up. When these IPs are shared with the target community from the threat actors, more victims can take appropriate measures to block the IP. Hence, the effects of the attack here are minimized by forcing the actors to use another IP. In case the IP is compromised, the reassignment of the same to a genuine customer is avoided, which could have significant damage due to the malicious activity of this IP.
MISP follows peer-peer architecture where the people are free to produce and to consume much information on threats in a shared manner. Hence, it is entirely for the transition of information over the multiple instances of MISP till it reaches the consumer. The information producers can then add tags defined in various taxonomies on the confidence or the reliability of the source of given information encoded. The consumers will get this information and have various levels of trust. The  in a given attribute is represented in Eq. (1) as
  . Here, it depicts that the score of an attribute under consideration before it decays starter. It is comprised of tags that are weighted along with the confidence value of the source represented as
  .
.
The weight of a taxonomy applied here defines the predicate level and represents the acceptance inside a given community. For example, if a tag is of taxonomy given the namespace as admirable_scale and the predicate reliable_source is often used, a low weight is usually assigned. However, inside the same taxonomy, the predicate credible_information tags that frequently used get more weight. The  can also influence an additional factor called the
  . This factor takes into consideration of more stable evaluation of the trust. For instance, in the scenario, a given organization has goodwill, but due to some situation in a given time frame, its trust has decreased. The best scenario being an organization is compromised by an attacker and taken over.

The  presented in the Eq. (1) is described as follows
•  ,
,  ,
,  , Wg = 100$ or
  , a way of adjusting the focus on tag or the source confidence. As the rebalancing of trust in a organization is researched on a distributed threat information sharing, the factor
  is set to $100 − Wg.
•  , The score that are derived out of the taxonomies are presented in Eq. (2).
•  , represents the confidence that is allotted for the source which publishes the attribute. The
  presented in the Eq. (1) provides a possibility for influencing the
  , which is supposed to be a number in-between 0 and 100. Every source in the range of 1 to N has the
  . In case if a given source is wholly trusted, the confidence is assigned as 1. If there is no trust associated, the level of source is then set to 0. The user is also allowed to set the intermediate values that could approximate how far the source is reliable. The given learning in the confidence of a particular source is based on the information produced in sue coursed of time that needs more research.
The Tag represented in Eq. (1) is derived from the existing taxonomies that a producer shall attach to the given information. A few of the used taxonomies are also allowed to add more reliability and confidence to reproduced information. The tags presented in the taxonomy can then be attached to each of the individual attributes that are encoded. The taxonomies available in MISP for deriving the confidence and the reliability are shown in Tab. 2.
Table 2: Confidence and reliability
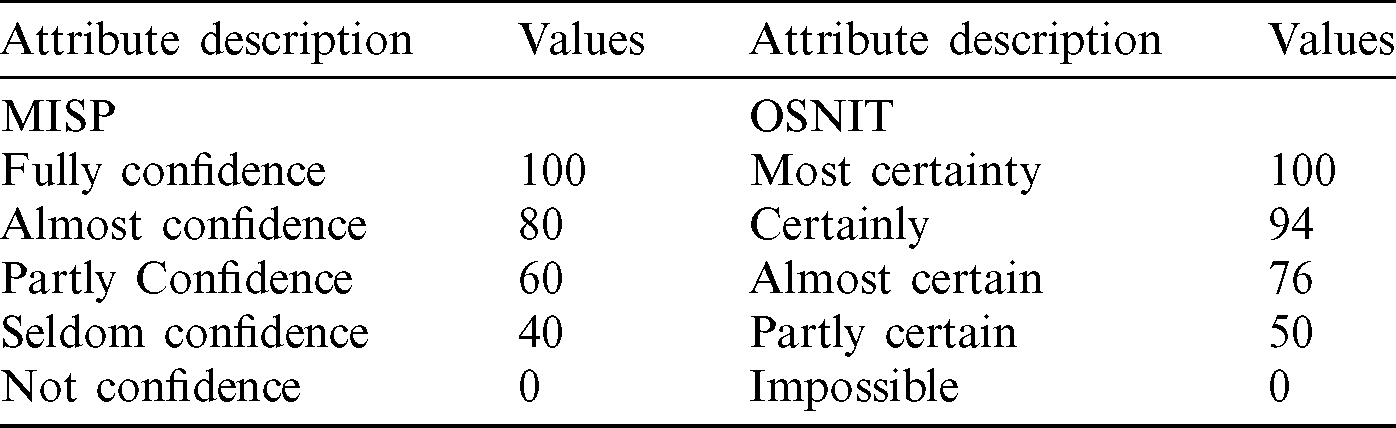
The taxonomies here used are the MISP tag , admirable scale and OSINT. These taxonomies use by a large community, and hence a scoring model is a need as an alternative to the suggestion of new taxonomies. Once a value of confidence is not defined, the  incomputable and hence undefined. The total score becomes undefined, leading to the cancellation of other scoring factors that are in tags.
The scores derived from the given taxonomies are represented in Eq. (2). Here, G represents the count of taxonomy in predefined groups, and T gives the count of taxonomies that are used in a single group. The weights are then defined on a predicate and must be an integer between 0–100.

The objective is to make the  as minimum as possible over a given time. When the value reaches 0, the concerned indicator of threat is discarded. The overall value of score to be used in Eq. (3) is given as

 , which is described in Eq. (1) is described as
1.  that represents the rate of decay or the same expressed as the rate at which the given score in an attribute comes down over time.
2. Tt and Tt + 1 are the representation of the timestamp. The Tt represent the present time and Tt + 1 describes the last time the attribute receives a sighting. It is noted that Tt < Tt + 1.
Fig. 2 depicts the rate of decay of an attribute ‘a’ with  as 80 and the rate of decay
  . The parameter evaluation shows that the end_time or the decay rate, which is a variable, can be kept under control. By keeping the decay rate constant, the end_time could not be specified for a score in an attribute. Similarly, even when the decay rate is kept controlled using a constant, the decay can be fixed. To address the latter issue, digression can be implemented, as shown in Eq. (4).

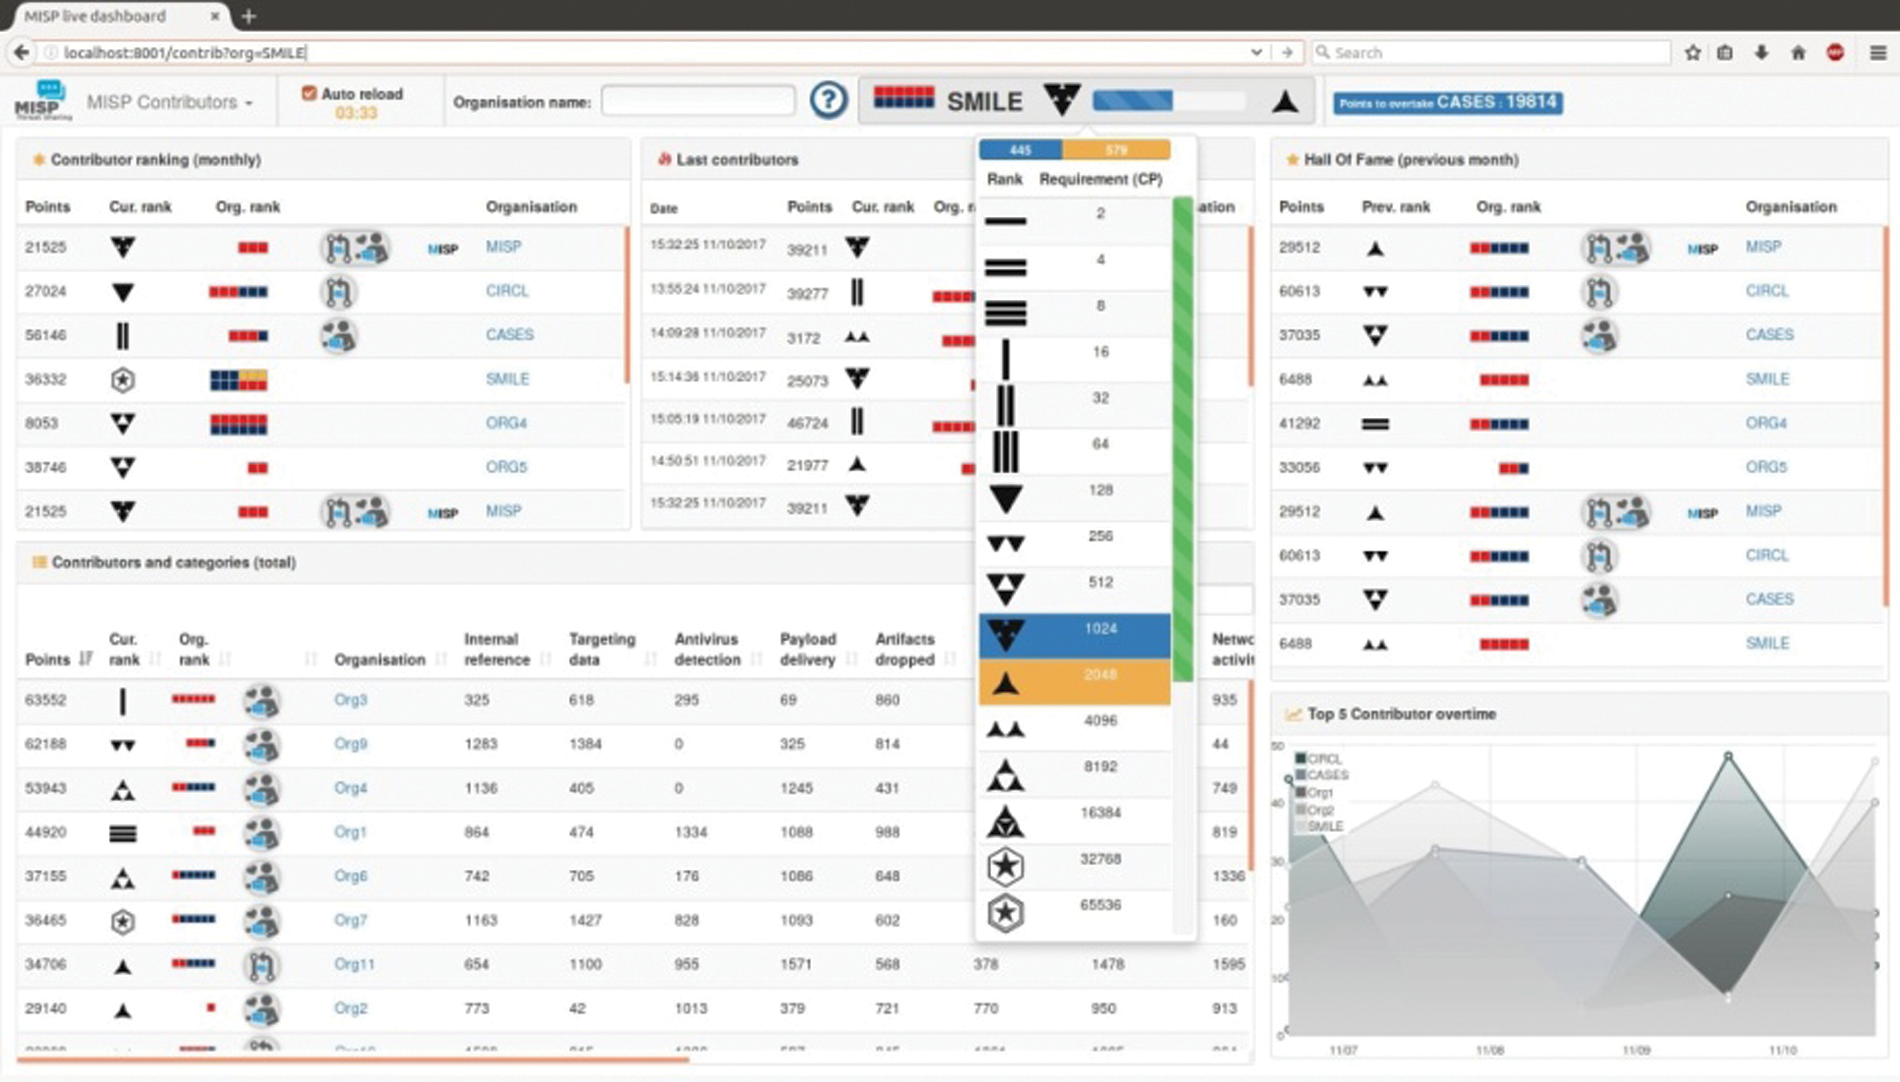
Figure 1: MISP user interface [24]
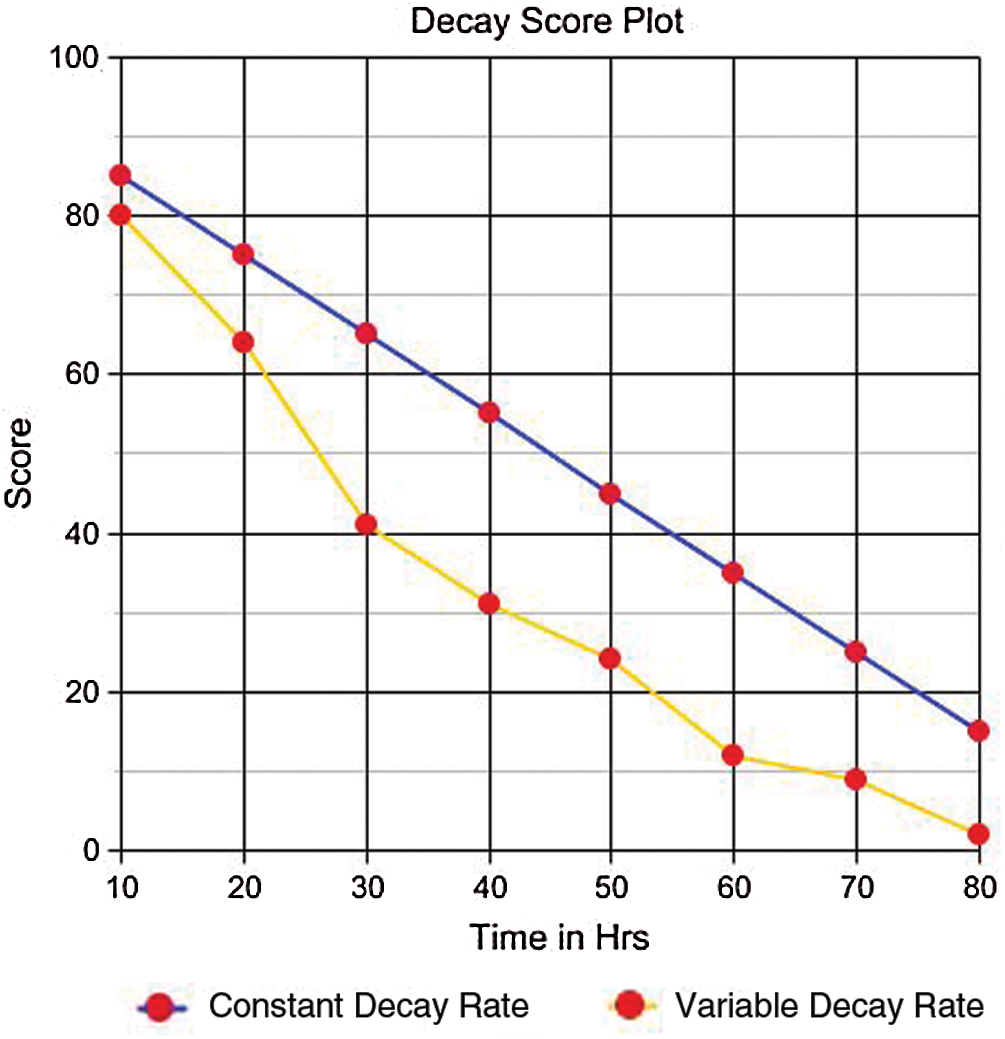
Figure 2: Decay score plot
Here, the rate of decay can be kept as a variable. The non-linear slope in Fig. 4 seems to be high initially and comes down as the time elapses. However, the rate of decay cannot be kept influenced. The expression will not be used to get a slower decay at the beginning, followed by a speedy digression. Behavior which can be identified in a dynamic IP allotment by the threat actor as already discussed. Also, the actual time when the total score of an attribute must be 0 is controlled by the decay rate. Hence, manipulation of slope and the end_time as well are not possible. It can also be seen that the choice of parameter ‘a’ will be in a range kept between 0 and 1 owing to the digression tendency happening exponentially to become 0 suddenly. The final value of the score is defined in Eq. (5) with all the conditions captured.

Considering the term  , as the rate of decay,
•  , is the end_time or the time required for the
  . The end_time defined by any sighting, where a given organization knows when can an indicator expires. The best example will be the grace time taken by the ISP to resolve the issue.
• The sane derived from the present sighting where the organization provides data about the sighting over the past. The time factor t = Tt − Tt −1, is an integer > 0.
The polynomial has a couple of advantages on the exponential factor. Initially, the end_time Ta could be controlled easily. The rapid digression in the initial stage can be acquired; a slower digression follows that opposite. An example of the varying rate of decay  is depicted in Fig. 3. It is seen from the figure that as the
  is increased, the total score tends to come down in the beginning stage. The rate
  approaches zero if the total score exponentially decreases in the beginning. The score will be 0 for all the rates at a given Ta.
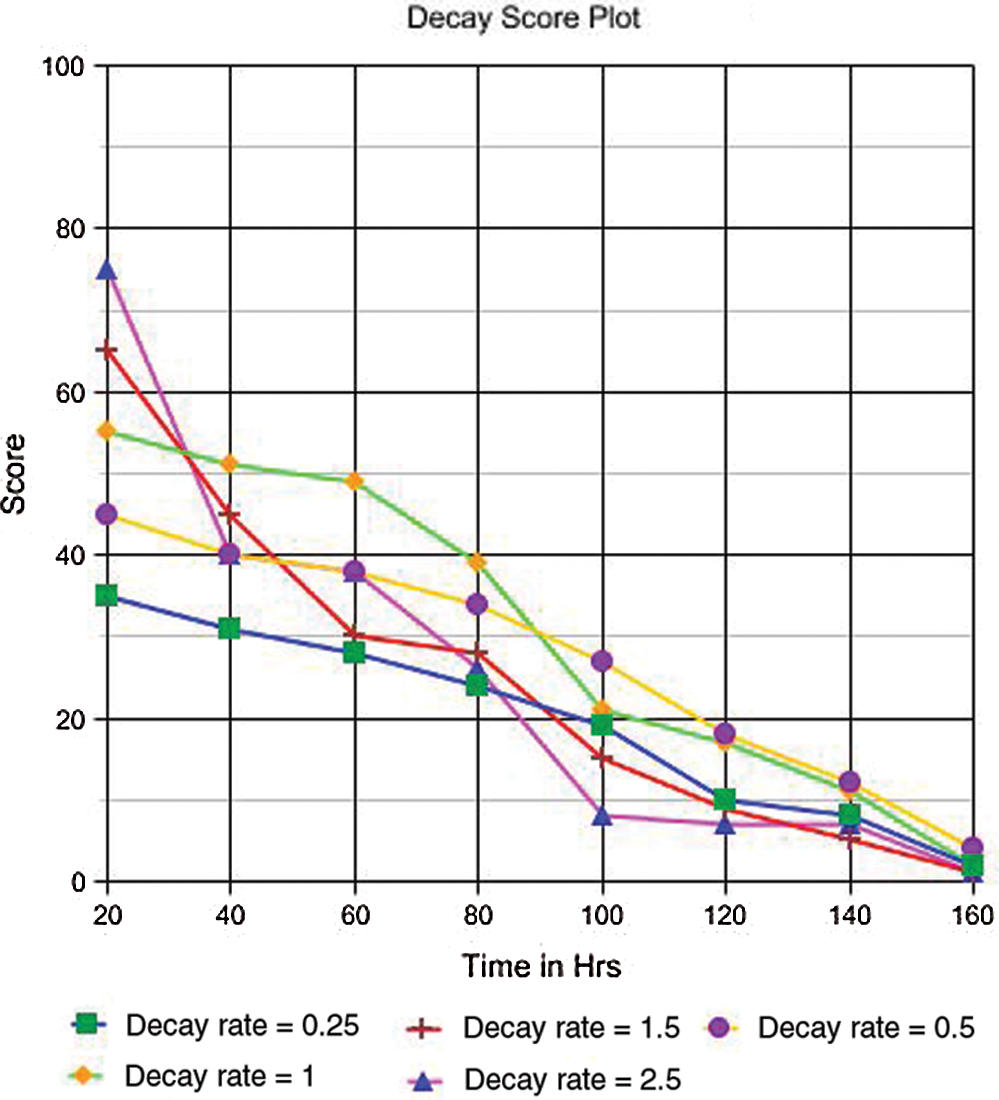
Figure 3: Plot for varying decay rate
The example considered for the experiment is the attribute of an IP, which is compromised. The attribute that belong to a shared event in the MISP belong to the activity with the type ip-destination, which means the IP of the destination of a web server which has been compromised. Few organizations that have spotted the same have to share that information. The IPs are encoded in lists that are open to public. The threat indicators might have noticed the detection and would have started to move the services to another server. It is assumed that ISP gives the consumer 1 week of time for fixing the web server. If the same is not fixed in the given time, The IP will be 0-routed, which means that it cannot be accessed further. Hence, Ta = 7.28 h. Considering the hypothesis that blacklisting takes 48 h for being applied in browsers, the total score is halved in a couple of days.
Hence,  can take a value of 1.81. At last, if the total score of an attribute is taken as the
  based on taxonomy and
  , the Eq. (5) is reduced as in Eq. (6). Where t denotes the time frame between the present and the last appearance of sighting expressed in hours. The decay rate plot of the attribute of the IP which is compromised is presented in Fig. 4

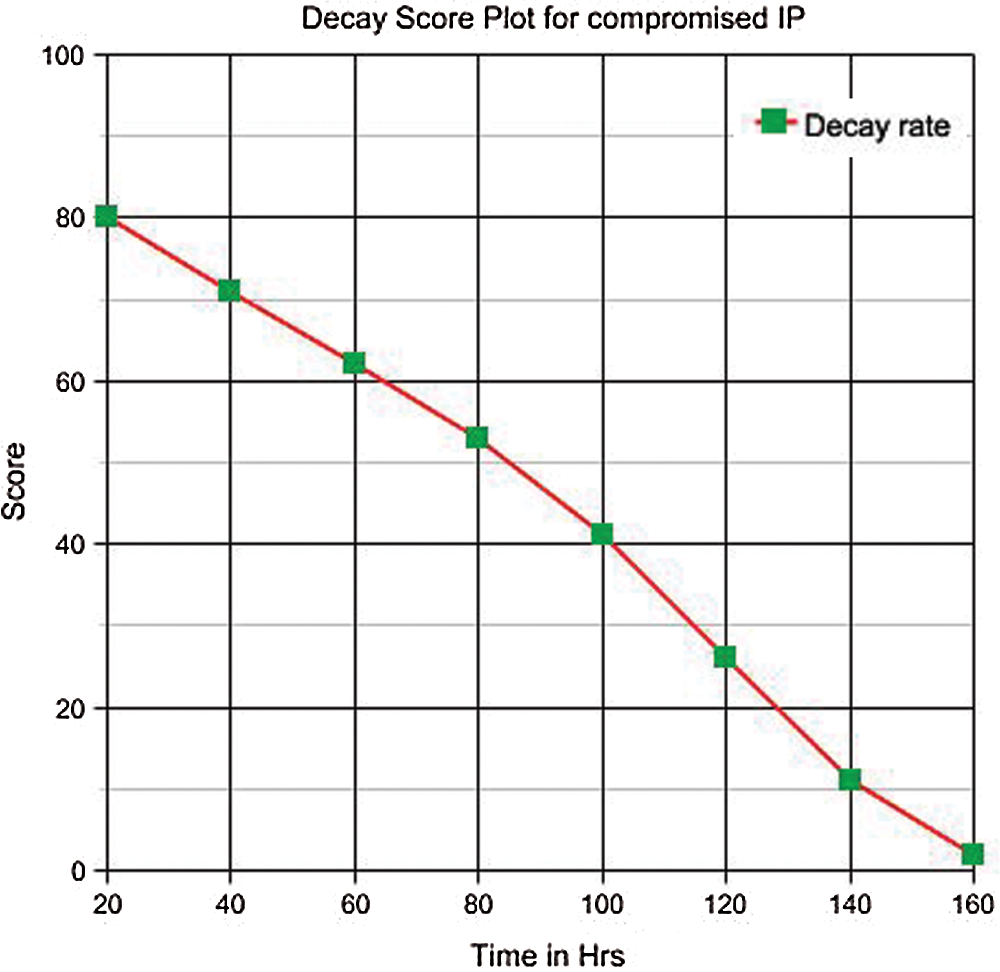
Figure 4: Decay plot for compromised IP
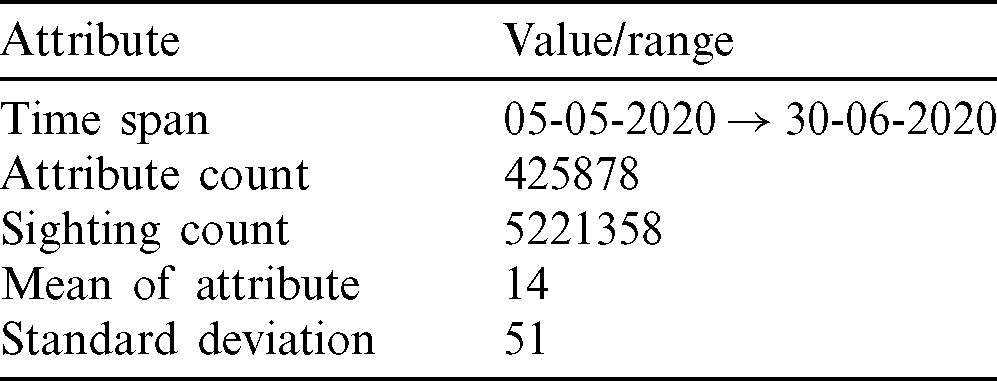
The efficiency of scoring relies on the tuning of parameters. It is achieved through a statistical approach to real-time data. The data considered for the study is taken from the phishing data repository. The statistics on the dataset is showed in Tab. 3.
Table 3: Data set statistics for parameter tuning
The dataset is processed for detecting the end of every attribute by making use of the sightings. For all of the attributes, the end time is calculated as in Eq. (7).

Here, the t0 denote the time where the given attribute is seen the first time and similarly, tn is the last time an attribute is seen and  denotes the long time that is elapsed in-between the sightings.
From the CSIRT view, it is critical to note down the servers that are compromised as quickly as possible. Fig. 5 depicts the elapsed time sequence of the events occurrence. Even if the URLs with a long lifetime are critical, only the shorter URLs are considered for evaluation. Longer living URLs are considered unique and are not considered in this section and kept as outliers. The processed data is then used for deducting the parameters. Initially, the first parameter, which is given more importance, is the end_time. The histogram presented in Fig. 6 shows the computed end_time’s re-partition overtime on a larger scale. It is also seen that the count of attributes that has an end_time more than 7 days drops with a constant factor.
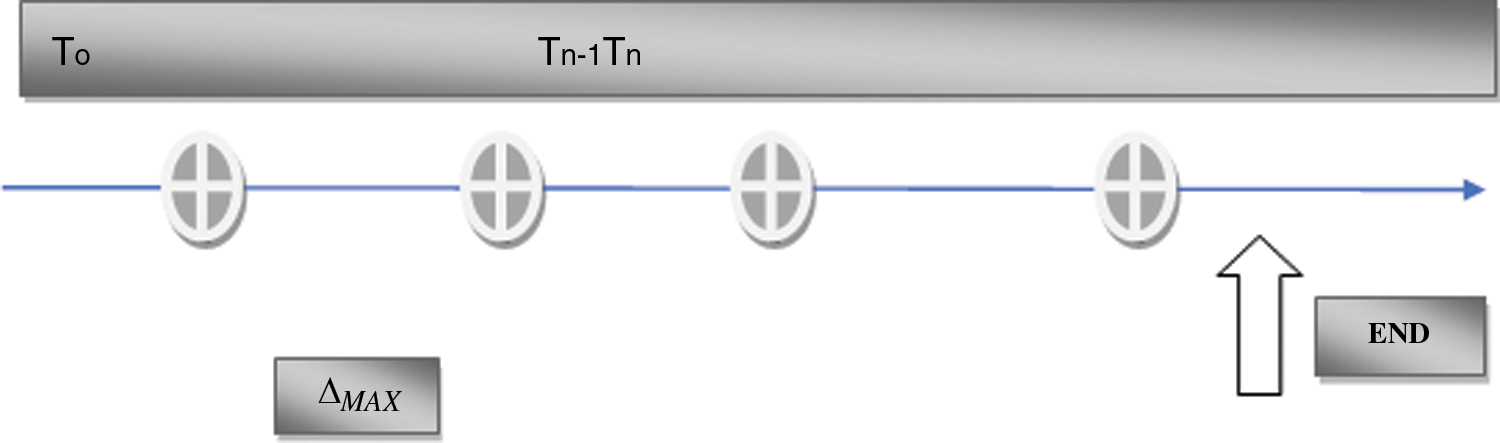
Figure 5: Elapsed time sequence
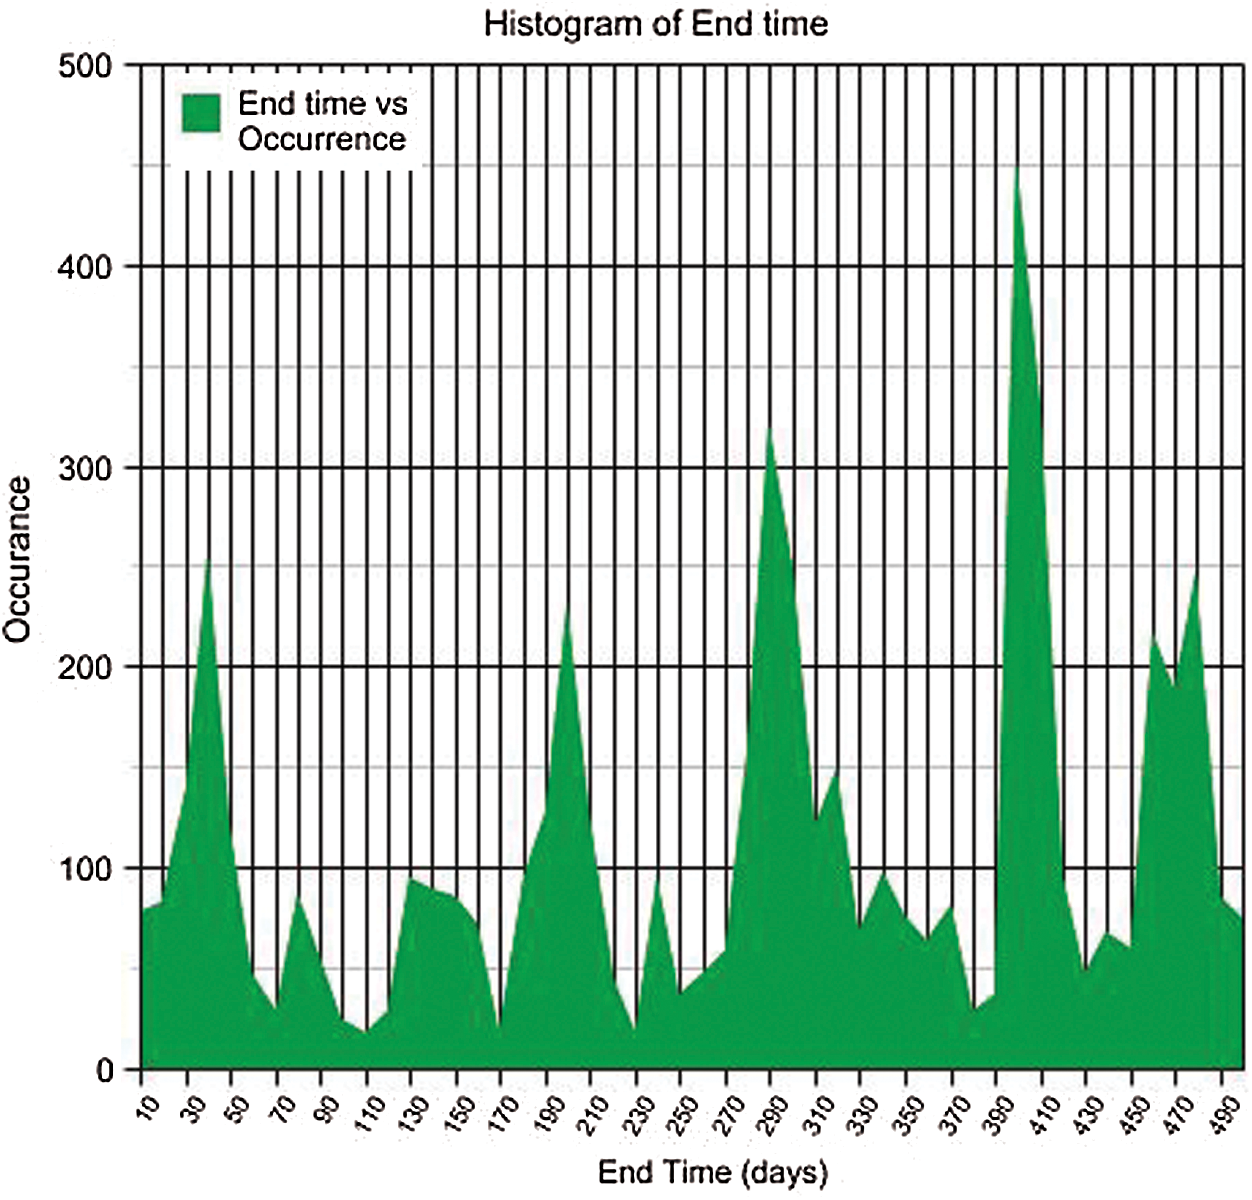
Figure 6: Endpoint histogram
If we have a closer look at the histogram, the initial week gives more useful information. As seen before, the initial focus is kept on the initial week since a large number of attributes that has similar end-timeliest there. The CDF is the figure indicates that approximately 90% of the total attributes start decaying in the first five days. The value of the next parameter is then estimated after looking at the shape of the histogram obtained. The slope’s cavity is then directed down bottom, which indicates an increase in the rate at which decay happens. Even before computing,  we can conclude that the parameter is a positive integer. Also, 50% of all attributes’ total end_time in the first 7 days are present within the initial 72 h. Hence after 3 days, half the total attributes have been expired. The score
  can be computed as

Finally, the attributes belonging to type URL that is concerned with phishing data can use these parameters for scoring. The evaluation can be made used by the Intrusion detection system for rule formation. Practically, these IDS have limited entry and hence only a particular part of the attributes can be used as a rule. An evaluation of the IDS’s table is performed as a support for the proposed model. In order to do so, the subset of the data is replayed in the IDS and evaluations were recorded. The experimental data consists of original data where only the sightings for a month are considered. The results are presented in Fig. 7.
The Fig. 7 shows the estimation on the accuracy front of the removal of entries. The calculations were performed based on the following rules.
• Each removal of entry is recorded separately in a set {expired}
• Each addition of entry is pre-checked for its availability in the {expired} set.
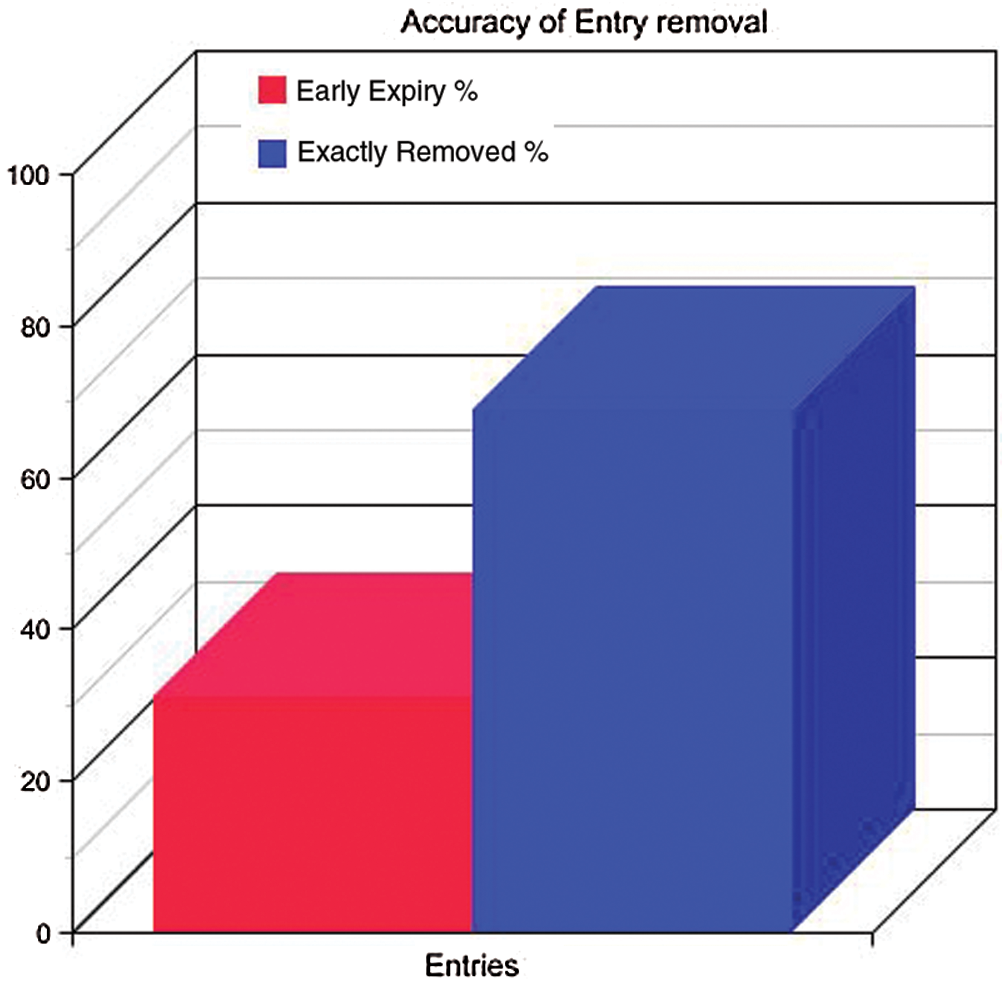
Figure 7: Accuracy comparison
If it is so, the record is labelled as added_bits. The part that expired so soon actually corresponds to the count of entries available in the added_bits and the parts that are correctly done correspond to the total entries present in {entries} set but not present in added_bits. It is also seen that approximately 50% of those entries are removed correctly of the IDS tables, while almost 50% of them are removed when pre-matured. In regard to the experimental data, the success rate obtained is very encouraging, and thus the attribute scoring model can work in a production environment.
A case study of the Intrusion detection table of the malware hashes is presented to ensure the proposed model’s effectiveness. In order to perform the experiment, the subset of data run on the IDS environment and the results in the table were recorded. The data set used is from the original set of data presented in Tab. 3 where only the sighting of a particular month, i.e., from February to March, is considered. The hypothesis here is that if the Hash value is not having a False Positive, the malware is not supposed to be decayed. It could be taken for consideration that the presented attribute could not have any record after a span of 60 days. The rate of decay hence would be  and
and  . it is considered that the case has the same
  as that of the previous value of 120. Hence, we have,

The focus is made on the initial 7 days of the attribute decay. The CDF shoes that approximately 90% of the attributes fall tend to decay in the first 5 days. Then as per the proposed model, the end-time for total decay would be 5 days i.e., 120 h. The value of the score is then obtained by the hypothesis that if the slope of the decay is tending to the bottom, there is an increased speed in the decay rate over time.
Again, if half of the total lifetime is expired, the CDF will be 50%; It can see that half of the attributes have already decayed. Hence at this juncture, the score point will be 50. We can now calculate the value of  as
as


Similarly, the decay score of all the attributes of the malware hashes can be calculated, and the attribute whose score tending to zero are considered to be decaying and are removed from the malware hash tables, which helps greatly in providing more space and also reduces the time complexity in the detection of malware.
Threat Information Sharing has become vital in obtaining a collaborative solution for cyber threats. The MISP is a unique open-source platform that allows the information exchange and users to contribute to the community over a trusted space. In this paper, an initial proposal is made on the scoring of attributes shared within the MISP. Taking into consideration that the MISP is peer–peer, different trust aspects have to be maintained. The fact that the producer has some taxonomy inside MISP for adding more credibility to the attribute, this paper presents a scoring method for combining the aspects of trust. As the lifetime of attributes corresponding to the Threat Indicators is different, a generic scoring method is proposed. The proposed method calculates the rate of decay of an attribute through which the early entries are removed. Future research is planned to apply Machine Learning techniques for the automated scoring of attributes and train the system to eliminate the unwanted attributes to participate in the evaluation of data shared by the organizations for attaining a collaborative solution for cyber threats.
Funding Statement: The author extends their appreciation to the Deanship of Scientific research at Majmaah University for the funding this work under Project No. 1439-48.
Conflicts of Interest: The authors declare that they have no conflicts of interest to report regarding the present study.
References
1. V. Mavroeidis and S. Bromander. (2017). “Cyber threat intelligence model: An evaluation of taxonomies, sharing standards, and ontologies within cyber threat intelligence,” in Proc. European Intelligence and Security Informatics Conference, Athens, pp. 91–98.
2. A. Zibak and A. Simpson. (2019). “Cyber threat information sharing: Perceived benefits and barriers,” in Proc. 4th Int. Conf. on Availability, Reliability and Security, Association for Computing Machinery, New York, USA, vol. 85, pp. 1–9.
3. Y. Lin, H. Wang, B. Yang, M. Liu, Y. Li et al. (2019). , “A blackboard sharing mechanism for community cyber threat intelligence based on multi-agent system,” In: X. Chen, X. Huang, J. Zhang (eds.Machine Learning for Cyber Security, ML4CS 2019, Lecture Notes in Computer Science, vol. 11806, Cham: Springer.
4. S. Brown, T. Moye, R. Hubertse and C. Glăvan. (2019). “Towards mature federated cyber incident management and information sharing capabilities in nato and nato nations,” in Proc. IEEE Military Communications Conf., Norfolk, VA, USA, pp. 1–5.
5. A. Albakri, E. Boiten and R. De Lemos. (2019). “Sharing cyber threat intelligence under the general data protection regulation,” In: M. Naldi, G. Italiano, K. Rannenberg, M. Medina, A. Bourka (eds.Privacy Technologies and Policy, APF 2019, Lecture Notes in Computer Science, vol. 11498, Cham: Springer.
6. A. Aggarwal, M. Alshehri, M. Kumar, O. Alfarraj, P. Sharma et al. (2020). , “Landslide data analysis using various time-series forecasting models,” Computers & Electrical Engineering, vol. 88, pp. 1–11.
7. Y. T. Chen, J. J. Tao, L. Y. Liu, J. Xiong, R. L. Xia et al. (2020). , “Research of improving semantic image segmentation based on a feature fusion model,” Journal of Ambient Intelligence and Humanized Computing.
8. N. Gong. (2019). “Barriers to adopting interoperability standards for cyber threat intelligence sharing: An exploratory study,” In: K. Arai, S. Kapoor, R. Bhatia (eds.Intelligent Computing, SAI 2018, Advances in Intelligent Systems and Computing, vol. 857, Cham: Springer, pp. 666–684.
9. D. Mann, S. S. Shapiro and D. Bodeau. (2014). “Bilateral analysis of information sharing efforts: Determining the expected effectiveness of information sharing efforts,” in Proc. Workshop on Information Sharing & Collaborative Security, Association for Computing Machinery, New York, NY, USA, pp. 41–50.
10. P. Sharma and K. Saxena. (2017). “Application of fuzzy logic and genetic algorithm in heart disease risk level prediction,” International Journal of System Assurance Engineering and Management, vol. 8, no. 2, pp. 1109–1125. [Google Scholar]
11. T. D. Wagner, E. Palomar, K. Mahbub and A. E. Abdallah. (2018). “Towards an anonymity supported platform for shared cyber threat intelligence,” In: N. Cuppens, F. Cuppens, J. L. Lanet, A. Legay, J. Garcia-Alfaro (eds.Risks and Security of Internet and Systems, CRiSIS, Lecture Notes in Computer Science, vol. 10694, Cham: Springer, pp. 175–183. [Google Scholar]
12. F. Yu, L. Liu, L. Xiao, K. L. Li and S. Cai. (2019). “A robust and fixed-time zeroing neural dynamics for computing time-variant nonlinear equation using a novel nonlinear activation function,” Neurocomputing, vol. 350, pp. 108–116. [Google Scholar]
13. L. O. Nweke and S. Wolthusen. (2020). “Legal issues related to cyber threat information sharing among private entities for critical infrastructure protection,” in 12th Int. Conf. on Cyber Conflict, Estonia, pp. 63–78. [Google Scholar]
14. T. D. Wagner, E. Palomar, K. Mahbub and A. E. Abdallah. (2017). “Relevance filtering for shared cyber threat intelligence,” In: J. Liu, P. Samarati (eds.Information Security Practice and Experience, Lecture Notes in Computer Science, vol. 10701, Cham: Springer. [Google Scholar]
15. Z. Liu, Z. Sun, J. Chen, Y. Zhou, T. Yang et al. (2020). , “Yang etal, STIX-based network security knowledge graph ontology modeling method,” in Proc. 3rd Int. Conf. on Geoinformatics and Data Analysis, Association for Computing Machinery, New York, NY, USA, pp. 152–157. [Google Scholar]
16. R. Samikannu, R. Ravi, S. Murugan and B. Diarra. (2020). “An efficient image analysis framework for the classification of glioma brain images using CNN approach,” Computers, Materials & Continua, vol. 63, no. 3, pp. 1133–1142. [Google Scholar]
17. R. Riesco and V. A. Villagrá. (2019). “Leveraging cyber threat intelligence for a dynamic risk framework,” International Journal of Information Security, vol. 18, no. 6, pp. 715–739. [Google Scholar]
18. W. Wang, Y. T. Li, T. Zou, X. Wang, J. Y. You et al. (2020). , “A novel image classification approach via dense-mobile net models,” Mobile Information Systems, vol. 2020, pp. 1–8. [Google Scholar]
19. T. D. Wagner. (2019). “Cyber threat intelligence for “Things”,” in Int. Conf. on Cyber Situational Awareness, Data Analytics and Assessment (Cyber SAOxford, UK, pp. 1–2. [Google Scholar]
20. M. Kumar, M. Alshehri, R. AlGhamdi, P. Sharma and V. Deep. (2020). “A DE-ANN inspired skin cancer detection approach using fuzzy c-means clustering,” Mobile Networks and Applications, vol. 25, no. 4, pp. 1319–1329. [Google Scholar]
21. S. Appala, N. C. Winget, D. McGrew and J. Verma. (2015). “An actionable threat intelligence system using a publish-subscribe communications model,” in Proc. 2nd ACM Workshop on Information Sharing and Collaborative Security, Association for Computing Machinery, New York, NY, USA, pp. 61–70. [Google Scholar]
22. J. Andrian, C. Kamhoua, K. Kiat and L. Njilla. (2017). “Cyber threat information sharing: A category-theoretic approach,” in Proc. 3rd Int. Conf. on Mobile and Secure Services, Miami Beach, FL, pp. 1–5. [Google Scholar]
23. F. Lemieux. (2015). “Defending critical infrastructures against cyberattacks: Cooperation through data-exchange infrastructure and advanced data analytics,” In: F. Lemieux (eds.Current and Emerging Trends in Cyber Operations, Palgrave Macmillan’s Studies in Cybercrime and Cybersecurity, London: Palgrave Macmillan. [Google Scholar]
24. K. Fotiadou, T. Velivassaki, A. Voulkidis, K. Railis, P. Trakadas et al. (2020). , “Incidents information sharing platform for distributed attack detection,” IEEE Open Journal of the Communications Society, vol. 1, pp. 593–605. [Google Scholar]
 | This work is licensed under a Creative Commons Attribution 4.0 International License, which permits unrestricted use, distribution, and reproduction in any medium, provided the original work is properly cited. |