DOI:10.32604/cmc.2021.014910
| Computers, Materials & Continua DOI:10.32604/cmc.2021.014910 | |
| Article |
Identifying Driver Genes Mutations with Clinical Significance in Thyroid Cancer
1Department of Surgery, Seoul National University Bundang Hospital, Seongnam-si, Korea
2Department of Software, Sejong University, Seoul, Korea
3Department of Surgery, College of Medicine, Ewha Womans University, Seoul, Korea
4Department of Internal Medicine, Seoul National University Hospital and College of Medicine, Seoul, Korea
5Department of Surgery, Seoul National University Hospital and College of Medicine, Seoul, Korea
*Corresponding Author: June Young Choi. Email: juneychoi@snubh.org
Received: 26 October 2020; Accepted: 30 November 2020
Abstract: Advances in technology are enabling gene mutations in papillary thyroid carcinoma (PTC) to be analyzed and clinical outcomes, such as recurrence, to be predicted. To date, the most common genetic mutation in PTC is in BRAF kinase (BRAF). However, whether mutations in other genes coincide with those in BRAF remains to be clarified. The aim of this study was to find mutations in other genes that co-exist with mutated BRAF, and to analyze their frequency and clinical relevance in PTC. Clinical and genetic data were collected from 213 PTC patients with a total of 36,572 mutation sites in 735 genes. After matching with genes from PTC entries in a global database (NCBI Gene), 69 genes with mutations in coding regions were chosen for further study. Through frequency-based analysis, we identified commonly mutated genes co-existing with mutated BRAF and, using the mutation count correlation matrix (MCCM) method, analyzed their incidence according to age and gender. We designed Chord diagrams to reveal gene relationships concerning age and gender, and found that mutations in ALK, ATM, COL1A1, MSTIR, PRKCA, and WNK1 most commonly coincide with mutated BRAF, followed by APC, AURKA, and AURKB. These findings provide further insight into the genetic profile of PTC.
Keywords: Medical informatics; papillary thyroid carcinoma; cancer; gene mutation analysis; BRAF; clinical significance
Acquiring and deciphering patient genomic/molecular data to inform diagnostics, personalized targeted therapy, and assessment of risks is a rapidly growing area of research [1]. In addition, to support the quest to conquer cancer, researchers are seeking specific biomarkers [2]. Thyroid cancer is one of the most common cancers worldwide [3]. In the past, thyroid cancer-related interests have focused on surgical methods and techniques, complications, treatment outcomes, prognoses, and mortality [4]. As genetic analysis technology advances, interest has shifted to identifying and characterizing genes related to thyroid cancer [5]. To identify the cause of thyroid cancer, many researchers have studied gene mutations and found representative affected genes such as BRAF [6]. In thyroid cancer, mutated BRAF affects MAPK and PI3K-AKT signaling pathways [7] and occurs in 36%–70% of cases [8,9]. Whereas other diseases may have multiple specific biomarkers, to date mutated BRAF is the only one to be definitively identified in thyroid cancer [10], despite many efforts using pyrosequencing, Sanger sequencing, whole genome sequencing, and genome-wide association studies.
In a recent study, the increase in global mortality and the size of large thyroid cancer were not sufficiently described by screening programs and overdiagnosis [11]. Thyroid cancer is mostly indolent, but in some patients the tumor bears genetic mutations and behaves aggressively [12]. With advances in surgical techniques, studies have been actively conducted to analyze gene mutations beyond thyroid cancer, and to predict clinical outcomes such as mortality and recurrence. To date, genetic variation associated with thyroid cancer is most commonly found in BRAF kinase (BRAF), NRAS, P53, RET, HRAS, CDKN2A, ATM, KMTSD, PTEN, PIK3CA, NF1, and KRAS, and that BRAF has a strong relationship with papillary thyroid carcinoma (PTC) [13].
RAF kinase is a component of the RAS, RAF, MEK, and MAP/ERK signaling pathways involved in cell growth, differentiation, and oncogenesis [14]. Among RAF kinases, BRAF is the strongest activator in these signaling pathways. Transversion mutation of nucleotide 1796 of exon 15 of the BRAF gene from thymine to adenine is the most common genetic abnormality in PTC [8]. This mutation is specific for PTC and correlates with high-risk clinicopathological features such as lymph node metastases, extrathyroidal invasion, higher recurrence rate, and advanced clinical stage [15–17]. While there have been many studies related to BRAF, the incidence of other affected genes in PTC and their relation to BRAF is not well known. Thyroid cancer is associated with clinical prognosis depending on age and gender [18], and there are not many studies on genes observed simultaneously with BRAF.
Through this study, therefore, our intention was to identify mutations in other genes that co-exist with those in BRAF in PTC, and to analyze their frequency and clinical correlation with age and gender. The aim of this integrative analysis was to identify the cancer driving (driver) genes and their association with the clinically relevant parameters of age and gender to reveal which affected genes best correlate with a tumor that could lead to the surgery in PTC.
2.1 Dataset and Method Overview
Archived tumor tissue, clinical, and genetic data were collected from 213 PTC patients seen at Seoul National University Hospital [19]. The target regions of genomic DNA were captured using a SureSelect DNA Kinome Kit (Agilent, Santa Clara, CA, USA) and sequenced using an Hi-Seq 2500 system (Illumina, San Diego, CsA, USA). Among the 213 PTC samples, a total of 36,572 mutation sites in 735 genes were identified in coding, intronic, untranslated (5 UTR and 3
 UTR), intergenic, splice site, and promoter regions. The genetic data were preprocessed using operations (filtering out, replacing, grouping, transposing, and merging) and then aligned with the clinical data to enable an integrative analysis using a three-step process, as shown in Fig. 1. At the first level, genes in the study (local) dataset were checked with genes in the NCBI Gene (global) database [20] reported for PTC and the common genes (found in both local and global databases). The common genes were carried out for further analysis and frequency-based analysis was performed to find driver genes found simultaneously with BRAF. Second, these driver genes were integrated with the clinical data, and an integrative analysis was performed using the mutation count correlation matrix (MCCM) method.
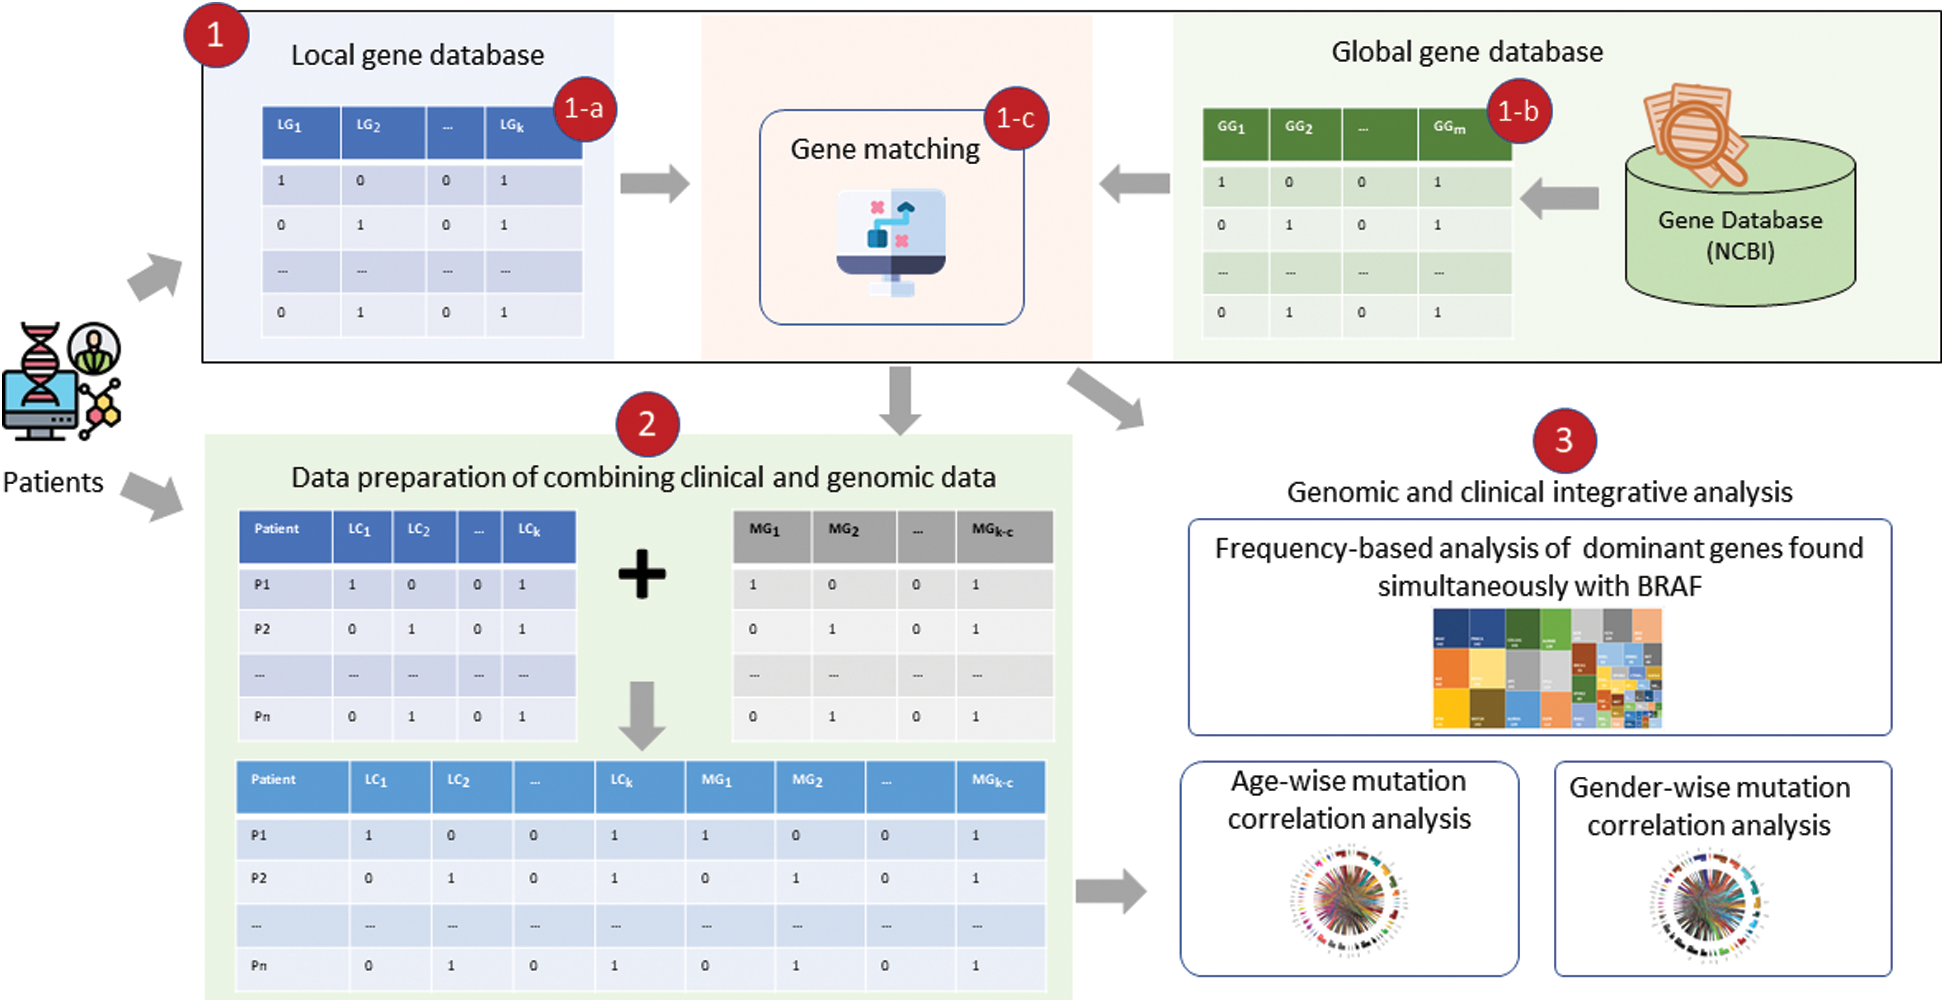
Figure 1: Clinical and genome data integrative analysis framework: (1) Shows driver gene identification, with (a) showing genes picked up from the local dataset, (b) Showing genes in the global database (NCBI Gene), and (c) Showing matching function that finds common genes in local and global databases; (2) Shows the process of data preparation of clinical and genetic data combination for integrative analysis; and (3) Shows different types of analysis including driver gene frequency analysis and mutation count correlation analysis
2.2 Identification of Driver Genes
To find the important genes in the local dataset, the genomic data were preprocessed using a program developed in the Python programming language with the Pandas package for DataFrame object manipulations. Initially, the dimensionality of the data was reduced by removing the attributes that are least important for the analysis process, such as chromosome number, names, and identifiers. Driven by the domain experts’ (i.e., the physicians’) guidance, the three most important attributes, ‘location,’ ‘symbol,’ and ‘consequence,’ were thus left for further study. The ‘location’ of a gene mutation itself consists of several locations: coding, 3 UTR, 5
 UTR, intron, intergenic, promoter, and splice site. All the location values, except that of the coding location, were filtered out from the analysis due to their least correlation with a tumor that could lead to the surgery in PTC. Similarly, because of the known strong impact of nonsynonymous substitutions on tumor occurrence, all other types of gene modifications were filtered out. Thus, mutations occurring in coding regions with a nonsynonymous consequence were the main focus for analysis in this study. The values of gene mutations were normalized by grouping the multiple locations into a single record, with 1 representing the mutation occurrence and 0 representing no mutation at this location. The formula for normalizing multiple records into a single record is given in Eq. (1). The records were grouped using Pandas GroupBy function based on the gene symbol.

As given in Eq. (2), the grouped data were further processed to normalize the sum values generated by the GroupBy function to either 1 or 0 values because a value of 1 or > 1 represents the same effect with respect to mutation occurrence.

The normalized data is a subset of the overall data. From this subset, only those genes that feature in the gene database [20] were chosen. The gene database was searched for “papillary thyroid carcinoma” and returned a list of 607 genes. These genes were inspected in the local normalized data using a match function of Pandas (see Eq. (3)).

The subset of matched genes was channeled for further analysis. In the next step, mutations of BRAF, the most frequently identified thyroid cancer-causing mutations, including in PTC [14], were the main focus. To identify any association of BRAF with other genes in the data, all records in which BRAF was not mutated were filtered out. Among the records with BRAF mutation, frequency-based analysis identified highly mutated genes throughout.
2.3 Integration of Clinical and Genomic Data
The driver genes found using frequency-based analysis were combined with clinical data. The MCCM method was used to determine relationships among the driver genes based on the patient age and gender. Data were first prepared in the form of a correlation matrix using Python DataFrame, where each cell of the matrix represents the number of samples with a mutation in each of the genes. The further steps of the MCCM method were as follows:
a) Exclusion of genes which are mutated in an equal or higher number of samples than BRAF from the analysis, as the focus of the study was on mutated genes that are related to BRAF but occur at a lower frequency than mutated BRAF.
b) Exclusion from the analysis of all genes having no mutation in the coding region.
c) Splitting of the data into four different groups: Two age groups ( < 45 and > 45 years) and two gender groups.
d) Development of a relation for each group to find order pair between genes in terms of mutation count as defined in Eq. (4):

where a and b are two genes, and R is their relationship, which represents the number of patient samples in which both a and b are mutated in the coding region.
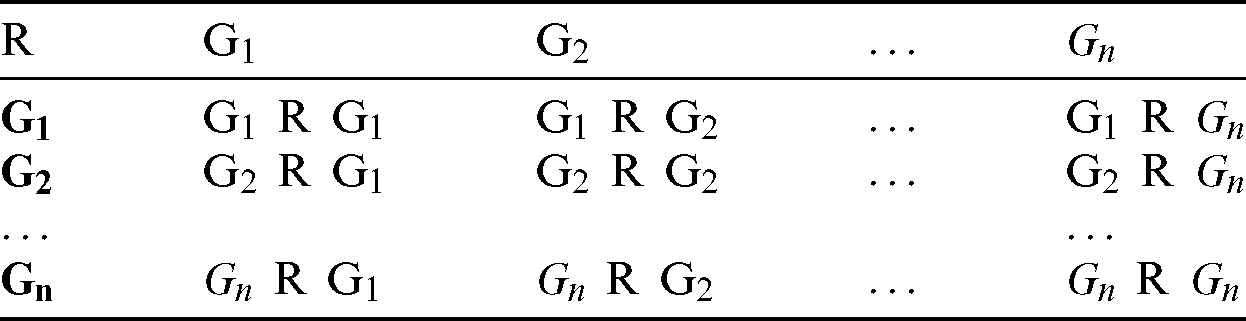
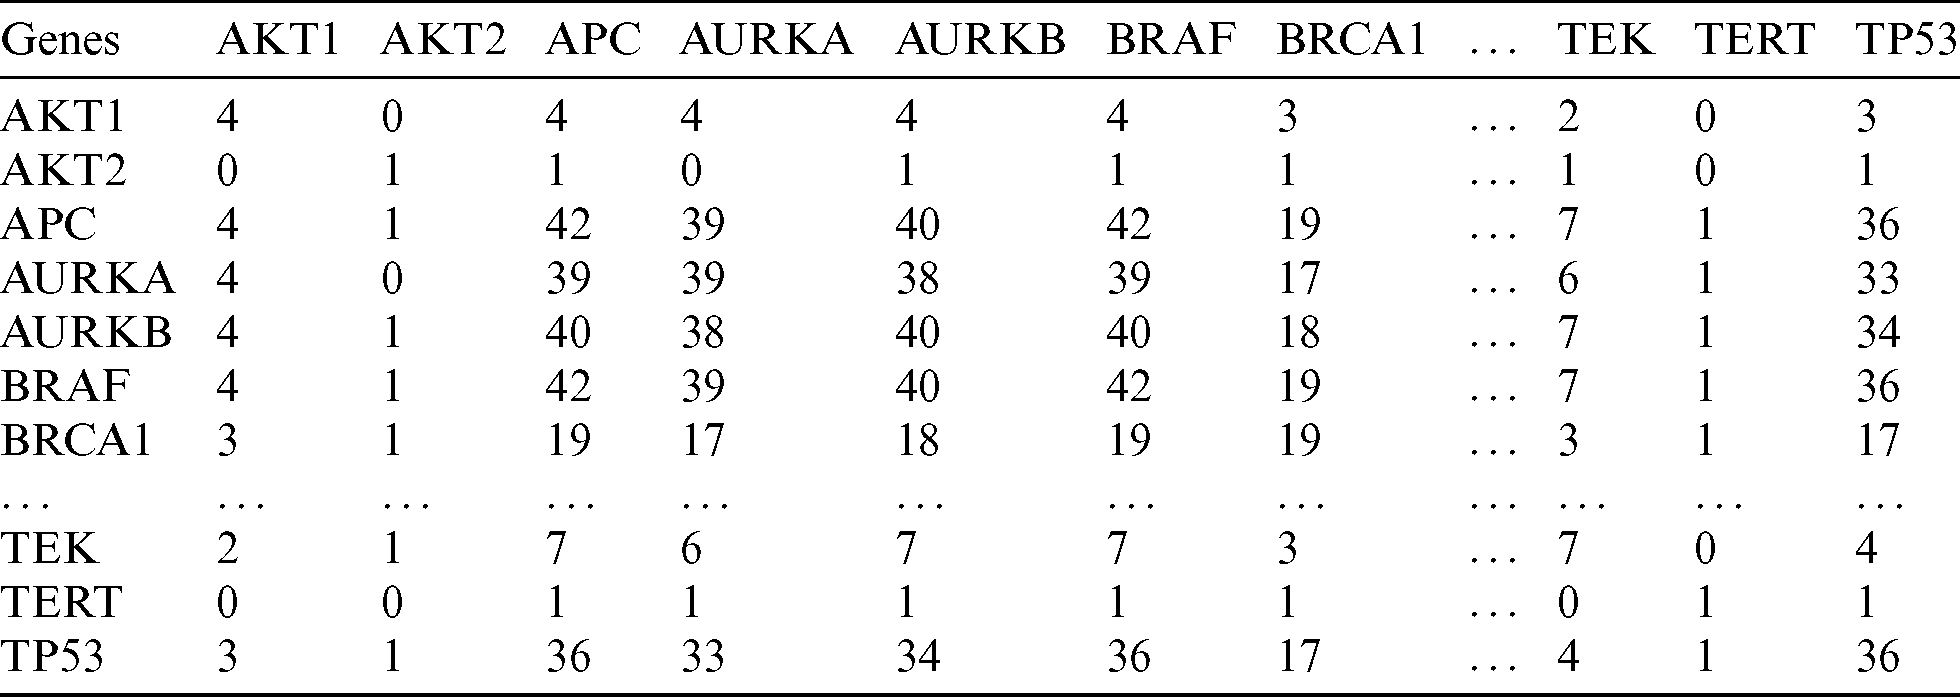
e) Using the relationship R in Eq. (4), a MCCM for each group (as shown in Tab. 1) was calculated. Each cell represents the relationship R between two genes (G1–Gn) based on the number of samples with mutations. For instance, G1 R G2 represents the number of samples in which both G1 and G2 are mutated.
f) Based on the mutation count in Tab. 1, a script in R programming language was developed to design Chord diagrams [21] for learning the outgoing and incoming connections between one gene and another.
Table 1: Mutation count correlation matrix of driver genes
Tumor samples included 183 (85.9%) of classical-type and 30 (14.1%) follicular-variant PTCs. The mean age of the patients was  years, and the male-to-female ratio was 1:6.6. Mean tumor size was
  cm, and lymph node metastasis was found in 99 (46.5%) patients. Twenty-three patients (10.8%) experienced recurrences. 3.2 Display style.
As described earlier, the 69 genes that were selected for the analysis, we filtered out all those genes mutated in less than one patient, which left 62 genes. Using frequency-based analysis, we identified driver genes and mapped them with their corresponding frequencies, as shown in Fig. 2. Mutations in BRAF, and in PRKCA, ALK, ATM, WNK1, MST1R, and COL1A1, among the overlapping genes, were found in the greatest number of samples, occurring in 142 samples, followed by mutated APC, which was found in 141 samples; these were the most ‘commonly mutated genes.’ The second tier of driver genes with 100–129 samples comprised AURKA, AURKB, TPS3, EGFR, KDR, FLT4, and IRS2. The third tier of driver genes with 44–79 samples encompassed BRCA1, SPHK2, IRAK1, KSR1, ERBB2, and RET. The fourth tier was composed of the remaining 41 genes.
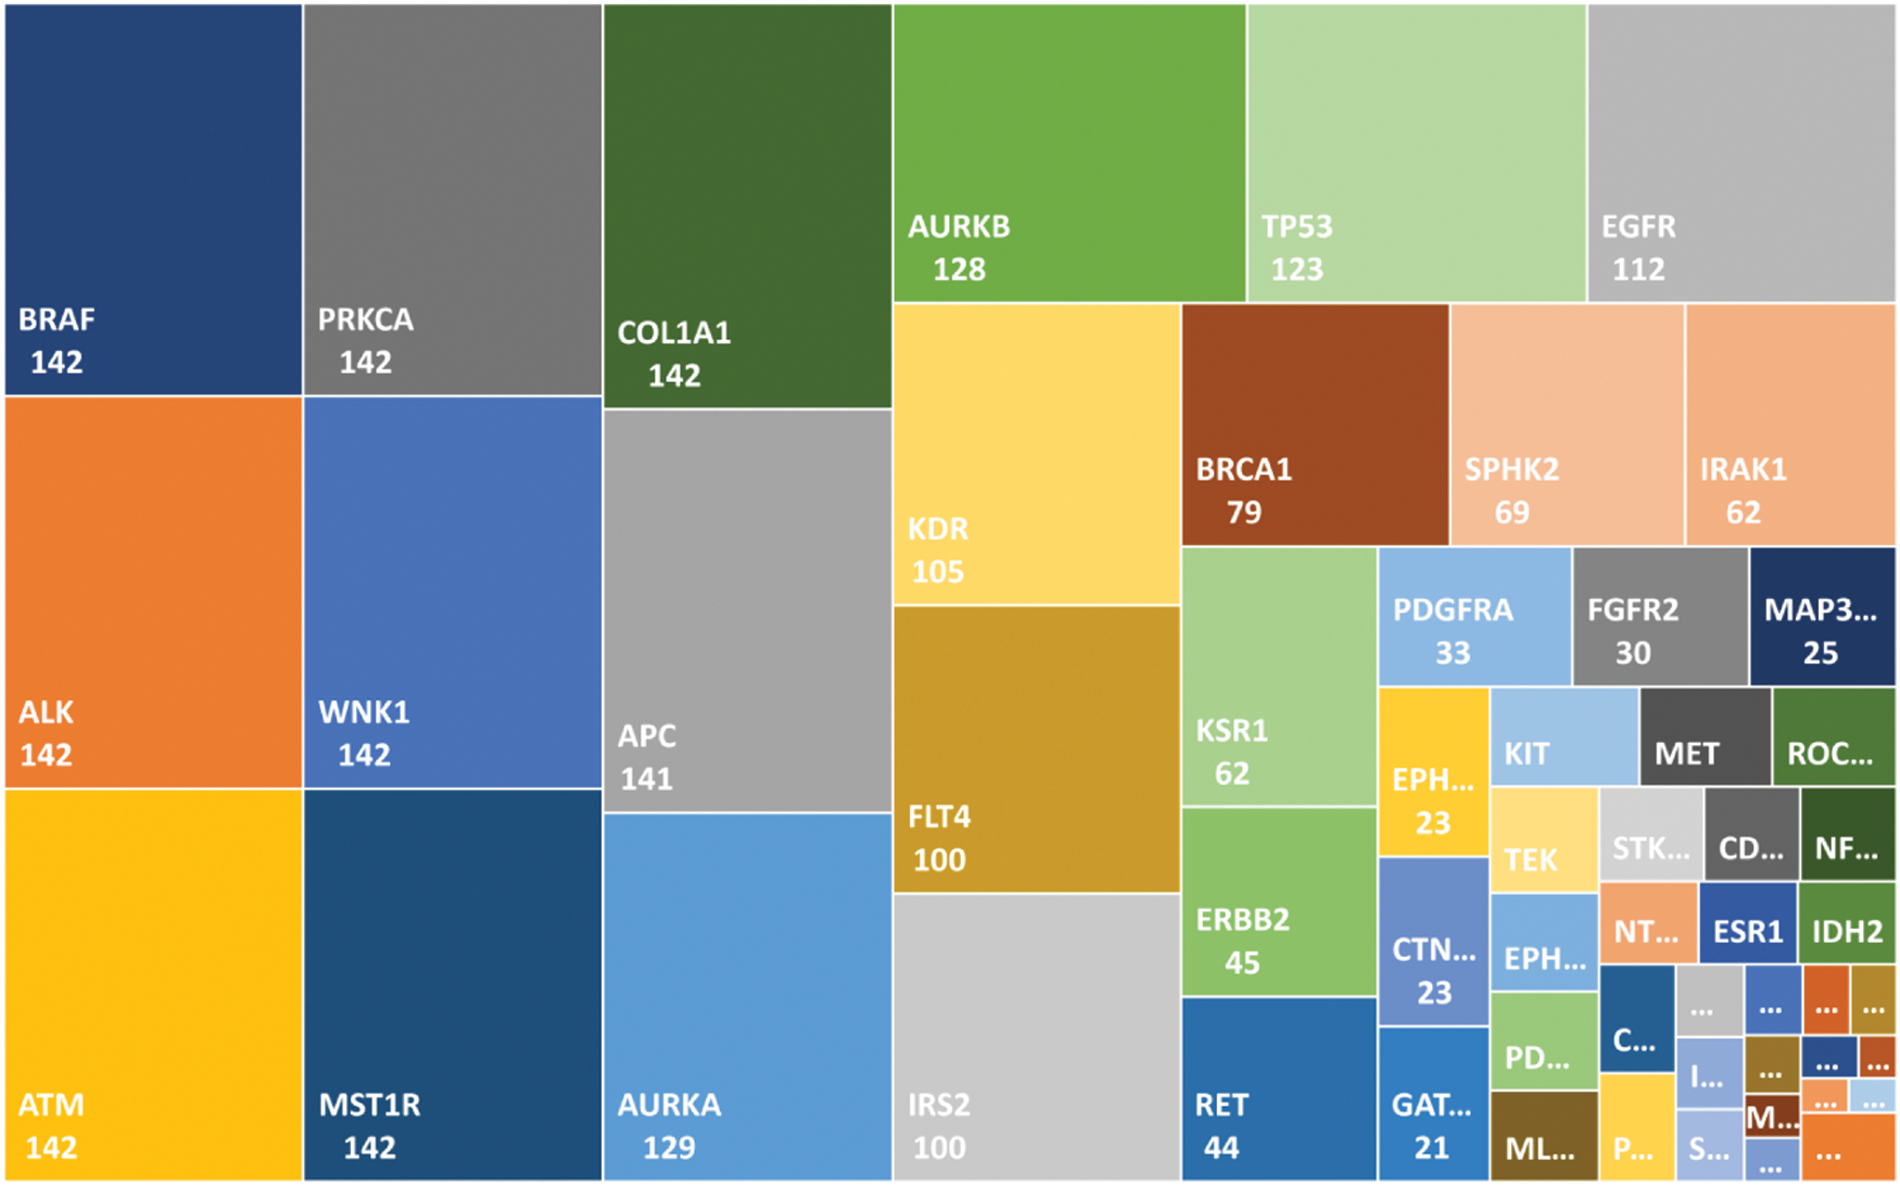
Figure 2: Mutated genes in the local dataset matched in the global gene database are shown with a frequency value. The genes in the top-left positions are the driver genes (commonly mutated) as compared with the genes in the smaller boxes in the bottom-right positions
3.3 Integrative Analysis: Correlation of Age and Gender with Genomic Data
Age and gender are clinically important in thyroid cancer. Therefore, we combined each of these two factors with genomic data making four groups to determine the clinical significance of mutations in BRAF and the other affected genes. These four groups are labeled as: (i) < 45 years age group, (ii)  45 years age group; (iii) male group, and female group with distribution of 42, 72, 15, and 99 samples, respectively. It should be noted that in the integrative analysis, we excluded the genes overlapping with BRAF (i.e., the first-tier driver mutated genes found in 142 samples). Thus, of the 62 total overlapping genes, data from 55 were included in the integrative analysis.
Using the MCCM method described in the Materials and Methods section, we generated a correlation matrix for the age and gender groups according to the incidence of affected genes. The matrix shown in Tab. 2 represents a partial list of mutated genes in the < 45 years age group. In this matrix, each relationship (cell) shows the number of samples in which the mutation is found in relation to other genes. The higher the value, the more frequently among the PTC samples that the genes are mutated together. For instance, BRAF and APC had a correlation count value of 42, which means that these genes are both mutated in 42 samples from patients in the < 45 years age group.
Table 2: A snippet of the mutation count correlation matrix showing a partial list of genes (age < 45 years group)
We computed the correlation matrices thus, for each of the age and gender groups. Based on the computed matrices, we developed a script in R programming language to design Chord diagrams as shown in Figs. 3 and 4, to reveal the outgoing and incoming connections between one gene and another. The outer fragmented arc on the circle represents the number of samples with mutations in each individual gene. The size of the fragment is proportional to the dominance of the gene: The larger the fragment, the more samples in which the mutated gene occurs.
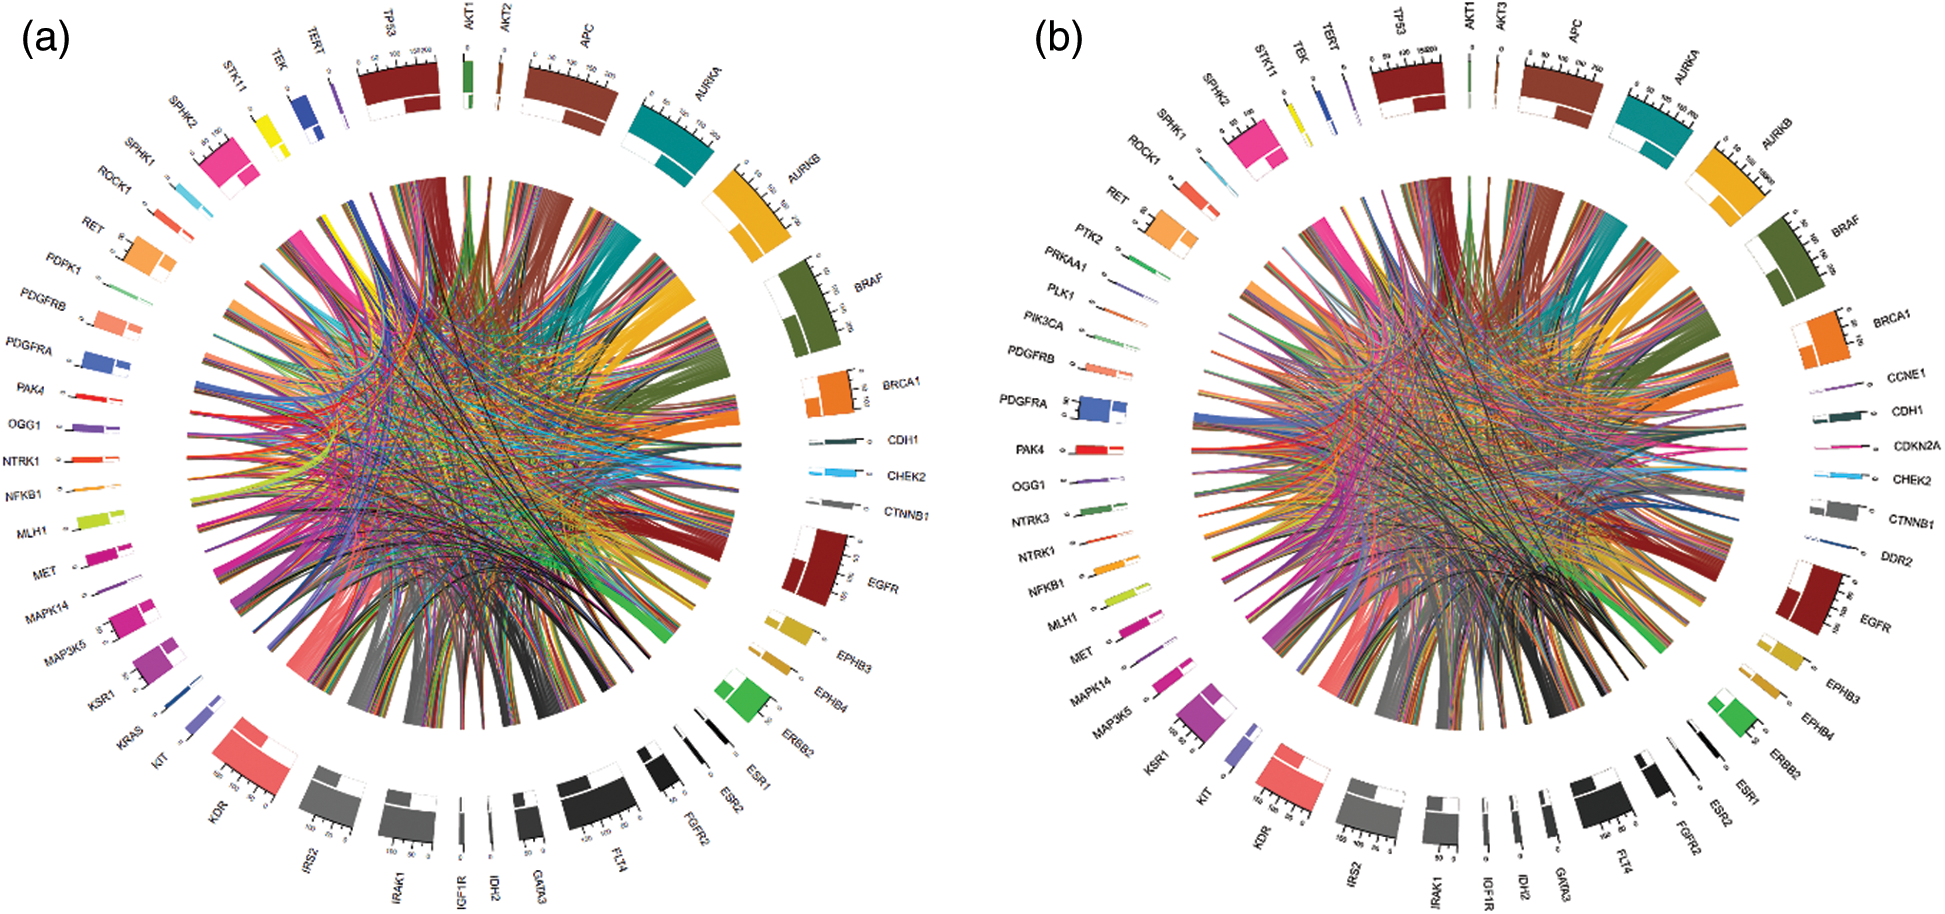
Figure 3: Chord diagrams representing the correlations between mutated BRAF and other genes, and among themselves, in the < 45 years age group (a) and the  45 years age group (b)
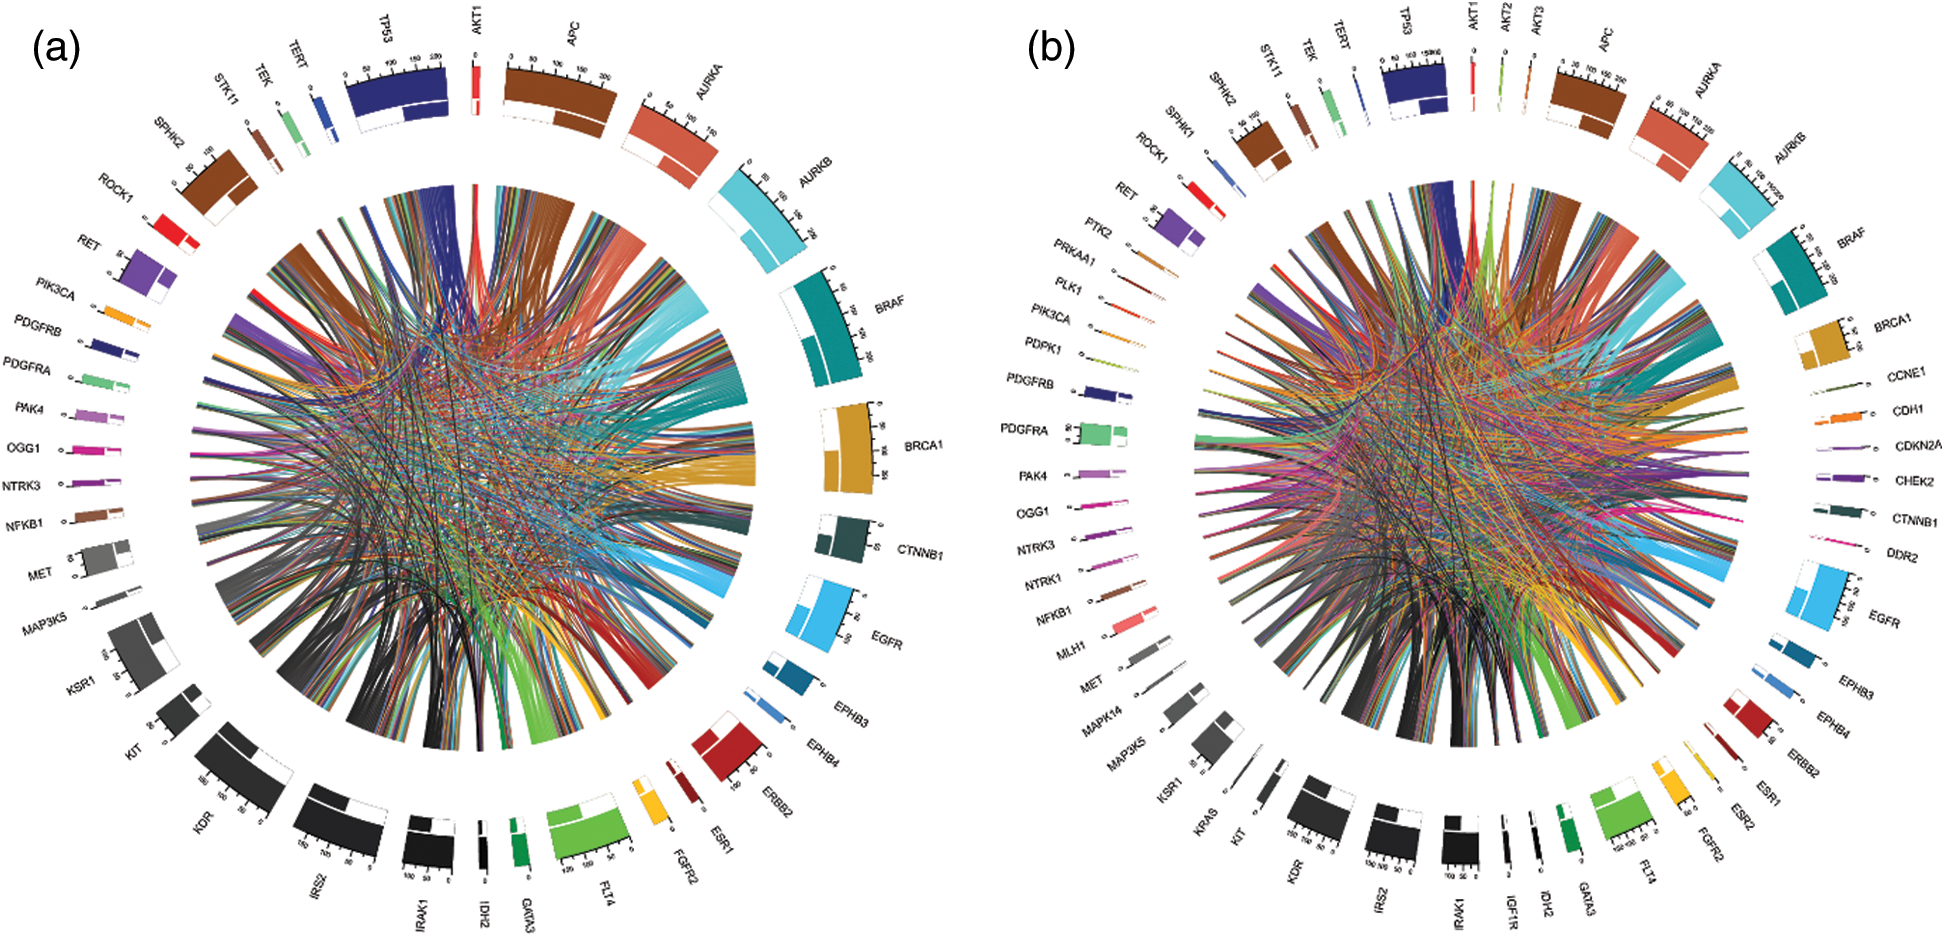
Figure 4: Chord diagrams representing the correlations between mutated BRAF and other genes, and among themselves, in the male group (a) and the female group (b)
For example, BRAF and APC (mutated in 100% of cases) were the most mutated genes having the highest proportion of mutations in the samples from the < 45 years age group (See Fig. 3a). IDH2 (mutated 2.4% of cases), NFKB1 (mutated 2.4% of cases), and others were the less mutated genes, with a smaller number of samples detected with these mutations. Furthermore, BRAF (mutated in 100% of cases) and APC (mutated 98.61% of cases) were also the driver genes in the  45 years age group (See Fig. 3b).
Gene dominance according to gender is represented in Figs. 4a and 4b. In the male group, BRAF and APC (mutated in 100% of cases), were the most mutated genes, while MAP3K5 (mutated 6.7% of cases) and NTRK3 (mutated 6.7% of cases) were the least mutated genes. Similarly, for the female group, BRAF (mutated 100% of cases) and APC (mutated 98.98% of cases) were the most mutated genes.
The thickness of the band reflects the number of patient samples that have mutations in those two connected genes. To understand the relationships between genes at a micro level, we took an example of the < 45 years age group as shown in Fig. 5, where mutations in BRAF most commonly coincide with mutations in APC and AURKB, as indicated by the thickest bands. Whereas, the thinner bands used with AKT2, IDH2, and some other genes indicate that mutations in BRAF less commonly coincide with mutations in these genes. It is important to note that absence of a band connection between two genes indicates that they are not both mutated simultaneously. This is more obvious with that are mutated in fewer samples and is less likely to coincide with other mutated genes. For example, in the < 45 years age group, NFKB1 (mutated in 2.4% of cases) mutations are uncommon and the rarest gene with smallest number of connections with other genes. So far as BRAF (mutated in 100% of cases), APC (mutated in 100% of cases), AURKB (mutated in 95.2% of cases), and EGFR (mutated in 78.6% of cases) are sharing mutation with all other genes and hence maximum inbound and outbound band connections are reflected in the Chord diagram.
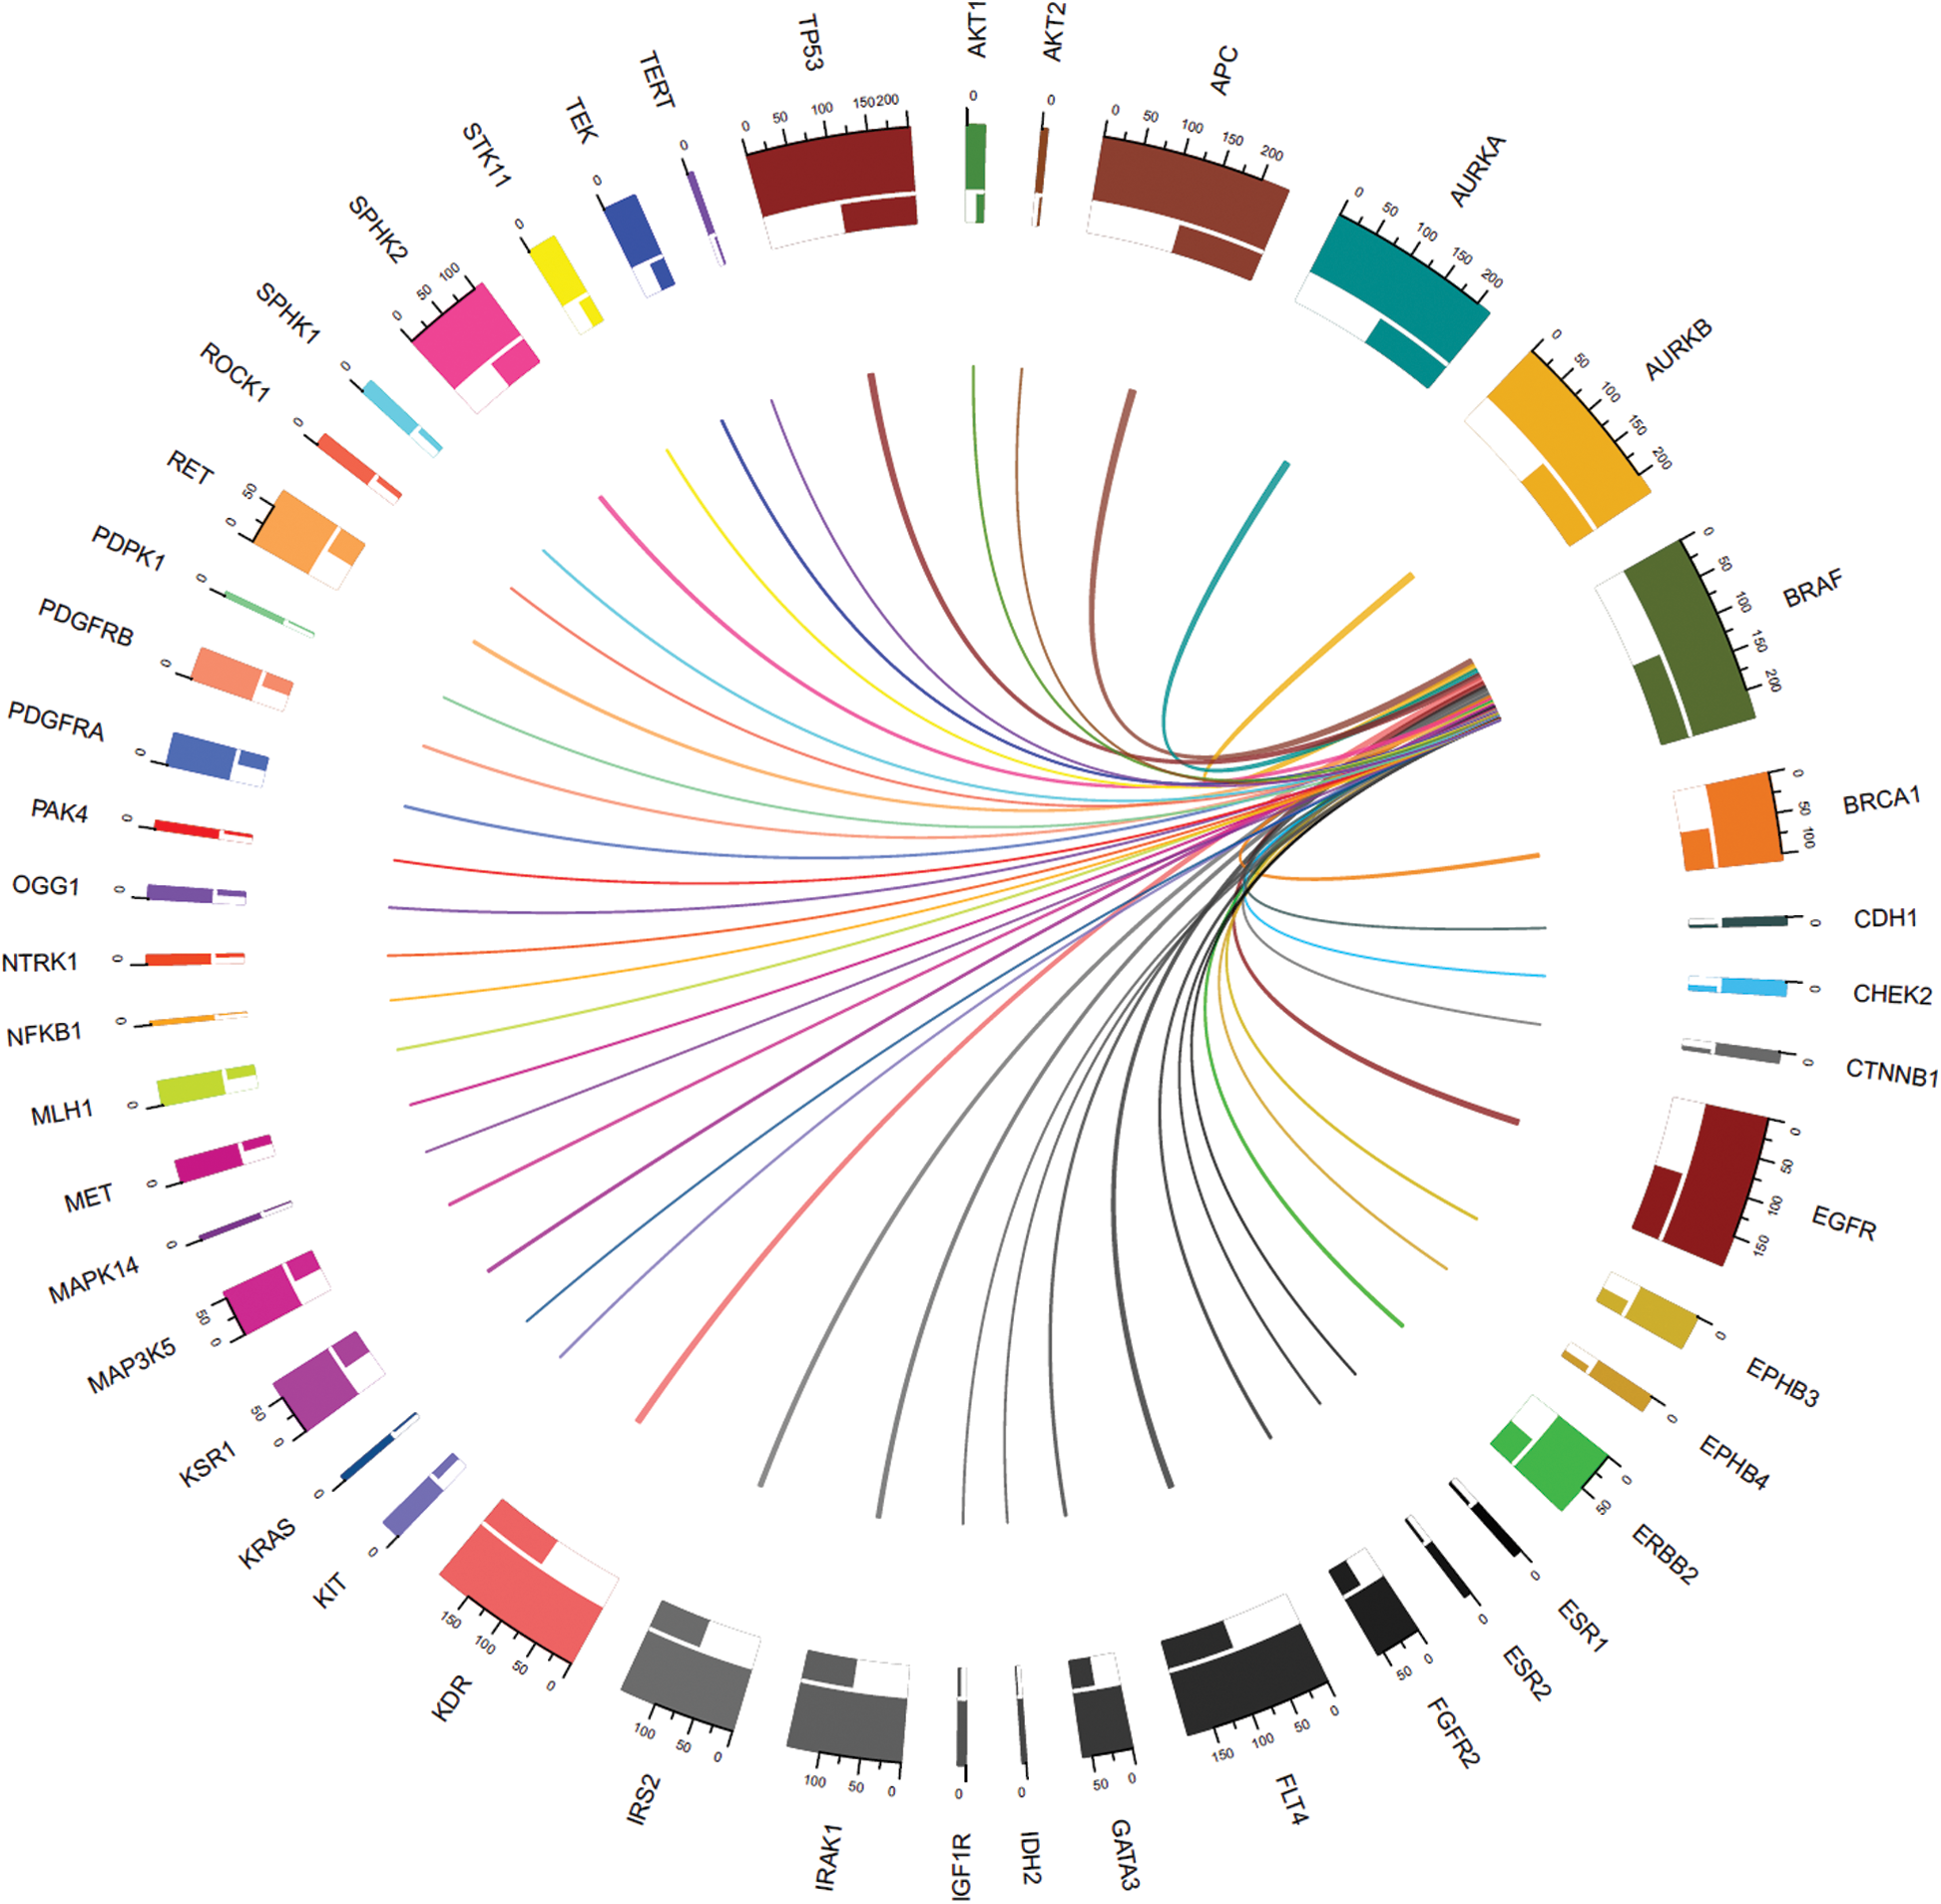
Figure 5: Connections between genes with mutations including mutated BRAF (mutated in all samples) in the < 45 years age-group samples
The presence of mutated BRAF is associated pathologically with the tall cell subtype of thyroid cancer, infiltrative growth, and intraglandular tumor spread, and clinically with lymph node metastases, extrathyroidal invasion, high recurrence rate, and advanced stage [15–17,22]. In addition, patients without the BRAF mutation have a mortality rate of 1.1%, whereas the rate for those with a mutation is 5.3% [6]. To date, genes with mutations known to be associated with thyroid cancer include BRAF, NRAS, P53, RET, HRAS, CDKN2A, ATM, KMTSD, PTEN, PIK3CA, NF1, and KRAS [13]. However, most have been reported as the percentage frequency observed in entire cohorts. In a large cohort from 19,000 samples, the NRAS gene was affected in 11.3%, RET in 9.72%, HRAS in 4.91%, PTEN in 3.73%, PIK3CA in 3.44%, NF1 in 2.9%, and NRAS in 2.65% [13]. While the genes affected can be identified in the cohort, it is not known which occur simultaneously with or how they relate to mutated BRAF, the most important genetic marker for thyroid cancer. Our objective was, therefore, to identify gene mutations in which synergy with BRAF was observed; thus, our analysis focused on patients with BRAF mutation and the correlations of BRAF with other affected genes, based on patient age and gender.
We identified the driver genes in the samples from the PTC patient dataset that matched those in the NCBI gene database [20]. In line with the global gene database, we found that there were 69 affected genes coincident with mutated BRAF. We categorized these genes into four groups: the group consisting of ALK, ATM, PRKCA, WNK1, MST1R, COL1A1, and APC was the most frequently observed; that of AURKA, AURKB, TP53, EGFR, KDR, FLT4, and IRS2 was the second most frequently observed; and that of BRCA1, SPHK2, IRAK1, KSR1, ERBB2, and RET was the third most frequently observed. The remaining least frequently observed genes comprised the fourth group.
To reveal clinical correlations with the most frequently affected genes, we visualized the results using Chord diagrams to highlight the frequency of each mutated gene correlated with mutated BRAF and with the other mutated genes. All the genetic variations correlated with each other, and differences in the correlations between different genes were observed depending on age and gender. Comparing the < 45 and  45 years age groups, mutated APC, AURKA, and AURKB were common in both groups but with varied frequency. For instance, after BRAF, APC was the second most affected gene observed in both age groups, but it was more frequent in the < 45 years group. Similarly, the third most frequently observed mutated gene was AURKB in the < 45 years group, whereas it was AURKA in the
  45 years group. In addition, comparison by gender revealed a unique correlation pattern of the most frequently affected genes. The male group was characterized by the highly correlated genes BRAF, APC, and AURKB, whereas in the female group, we observed a strong correlation between BRAF, APC, and AURKA. Thus, overall, APC, AURKA, and AURKB were highly correlated with BRAF in our study.
Our study is limited by its retrospective design. Larger-scale prospective studies are now required to confirm our findings. In addition, we did not differentiate the observed gene mutations into germ line and somatic mutations, and this work is currently underway in a follow-up study. In conclusion, this study provides a foundation for revealing cancer driver gene correlations as well as for integrative analysis of patient demographic information with genetic variations, which could aid discovery of the mechanisms underlying thyroid carcinogenesis and help to improve the precision of clinical decisions.
Funding Statement: This work was supported by Grant No. 02-2015-015 from the Seoul National University Bundang Hospital research fund. The funders had no role in the design of the study; the collection, analyses, or interpretation of the data; the writing of the manuscript; or the decision to publish the results.
Conflicts of Interest: The authors declare that they have no conflicts of interest to report regarding the present study.
References
1. J. N. Weitzel, K. R. Blazer, D. J. MacDonald, J. O. Culver and K. Offit. (2011). “Genetics, genomics, and cancer risk assessment,” CA: A Cancer Journal for Clinicians, vol. 61, no. 5, pp. 327–359.
2. A. M. Tsimberidou. (2015). “Targeted therapy in cancer,” Cancer Chemotherapy and Pharmacology, vol. 76, no. 6, pp. 1113–1132.
3. M. E. Cabanillas, D. G. McFadden and C. Durante. (2016). “Thyroid cancer,” Lancet, vol. 388, no. 10061, pp. 2783–2795.
4. G. H. Sakorafas. (2010). “Historical evolution of thyroid surgery: From the ancient times to the dawn of the 21st century,” World Journal of Surgery, vol. 34, no. 8, pp. 1793–1804.
5. S. K. Yoo, Y. S. Song, E. K. Lee, J. Hwang, H. H. Kim et al. (2019). , “Integrative analysis of genomic and transcriptomic characteristics associated with progression of aggressive thyroid cancer,” Nature Communications, vol. 10, no. 1, pp. 14.
6. M. Xing, A. S. Alzahrani, K. A. Carson, D. Viola, R. Elisei et al. (2013). , “Association between BRAF V600E mutation and mortality in patients with papillary thyroid cancer,” Journal of the American Medical Association, vol. 309, no. 14, pp. 1493–1501.
7. S. Jin, O. Borkhuu, W. Bao and Y. T. Yang. (2016). “Signaling pathways in thyroid cancer and their therapeutic implications,” Journal of Clinical Medicine Research, vol. 8, no. 4, pp. 284–296.
8. Y. Cohen, M. Xing, E. Mambo, Z. Guo, G. Wu et al. (2003). , “BRAF mutation in papillary thyroid carcinoma,” Journal of the National Cancer Institute, vol. 95, no. 8, pp. 625–627.
9. A. Bounacer, R. Wicker, B. Caillou, A. F. Cailleux, A. Sarasin et al. (1997). , “High prevalence of activating ret proto-oncogene rearrangements, in thyroid tumors from patients who had received external radiation,” Oncogene, vol. 15, no. 11, pp. 1263–1273.
10. H. J. Schulten, R. Alotibi, A. Al-Ahmadi, M. Ata, S. Karim et al. (2015). , “Effect of BRAF mutational status on expression profiles in conventional papillary thyroid carcinomas,” BMC Genomics, vol. 16, no. 1, pp. 1–10. [Google Scholar]
11. J. Kim, J. E. Gosnell and S. A. Roman. (2020). “Geographic influences in the global rise of thyroid cancer,” Nature Reviews Endocrinology, vol. 16, no. 1, pp. 17–29. [Google Scholar]
12. J. Van Griensven, T. Edwards and S. Baize. (2016). “Efficacy of convalescent plasma in relation to dose of ebola virus antibodies: To the editor,” New England Journal of Medicine, vol. 375, no. 23, pp. 2307–2309. [Google Scholar]
13. The AACR Project GENIE Consortium. (2017). “AACR project genie: Powering precision medicine through an international consortium,” Cancer Discovery, vol. 7, no. 8, pp. 818–831. [Google Scholar]
14. L. M. Caronia, J. E. Phay and M. H. Shah. (2011). “Role of BRAF in thyroid oncogenesis,” Clinical Cancer Research, vol. 17, no. 24, pp. 7511–7517. [Google Scholar]
15. J. Ming, Z. Lie, W. Zeng, Y. Maimaiti, Y. Guo et al. (2015). , “Association between BRAF and RAS mutations, and RET rearrangements and the clinical features of papillary thyroid cancer,” International Journal of Clinical and Experimental Pathology, vol. 8, no. 11, pp. 15155–15162. [Google Scholar]
16. C. Li, K. C. Lee, E. B. Schneider and M. A. Zeiger. (2012). “BRAF V600E mutation and its association with clinicopathological features of papillary thyroid cancer: A meta-analysis,” Journal of Clinical Endocrinology and Metabolism, vol. 97, no. 12, pp. 4559–4570. [Google Scholar]
17. A. Chakraborty, A. Narkar, R. Mukhopadhyaya, S. Kane, A. D’Cruz et al. (2012). , “D’Cruz etal, BRAFV600E mutation in papillary thyroid carcinoma: Significant association with node metastases and extra thyroidal invasion,” Endocrine Pathology, vol. 23, no. 2, pp. 83–93. [Google Scholar]
18. B. R. Haugen, E. K. Alexander, K. C. Bible, G. M. Doherty, S. J. Mandel et al. (2015). , “American thyroid association management guidelines for adult patients with thyroid nodules and differentiated thyroid cancer: The american thyroid association guidelines task force on thyroid nodules and differentiated thyroid cancer,” Thyroid, vol. 26, no. 1, pp. 1–133. [Google Scholar]
19. Y. S. Song, B. H. Kang, S. Lee, S.-K. Yoo, Y. S. Choi et al. (2020). , “Genomic and transcriptomic characteristics according to size of papillary thyroid microcarcinoma,” Cancers (Basel), vol. 12, no. 5, pp. 1345. [Google Scholar]
20. NCBI. (2016). “Home-Gene-NCBI,” [Online]. https://www.ncbi.nlm.nih.gov/gene. [Google Scholar]
21. Z. Gu, L. Gu, R. Eils, M. Schlesner and B. Brors. (2014). “Circlize implements and enhances circular visualization in R,” Bioinformatics, vol. 30, no. 19, pp. 2811–2812. [Google Scholar]
22. G. Tallini, D. de Biase, C. Durante, G. Acquaviva, M. Bisceglia et al. (2015). , “BRAF V600E and risk stratification of thyroid microcarcinoma: A multicenter pathological and clinical study,” Modern Pathology, vol. 28, no. 10, pp. 1343–1359. [Google Scholar]
 | This work is licensed under a Creative Commons Attribution 4.0 International License, which permits unrestricted use, distribution, and reproduction in any medium, provided the original work is properly cited. |