DOI:10.32604/cmc.2021.014696
| Computers, Materials & Continua DOI:10.32604/cmc.2021.014696 | |
| Article |
QI-BRiCE: Quality Index for Bleeding Regions in Capsule Endoscopy Videos
1Faculty of Science, Engineering and Computing, Kingston University, London, KT1 2EE, UK
2School of Electrical Engineering, Superior University, Lahore, Pakistan
3School of Applied Sciences, Telkom University, Bandung, Indonesia
4Department of Network Computing, System Architecture Lab, Dongguk University, Seoul, Korea
5Department of IT Convergence Engineering, Kumoh National Institute of Technology, Gumi, Korea
*Corresponding Author: Soo Young Shin. Email: wdragon@kumoh.ac.kr
Received: 09 October 2020; Accepted: 05 December 2020
Abstract: With the advent in services such as telemedicine and telesurgery, provision of continuous quality monitoring for these services has become a challenge for the network operators. Quality standards for provision of such services are application specific as medical imagery is quite different than general purpose images and videos. This paper presents a novel full reference objective video quality metric that focuses on estimating the quality of wireless capsule endoscopy (WCE) videos containing bleeding regions. Bleeding regions in gastrointestinal tract have been focused in this research, as bleeding is one of the major reasons behind several diseases within the tract. The method jointly estimates the diagnostic as well as perceptual quality of WCE videos, and accurately predicts the quality, which is in high correlation with the subjective differential mean opinion scores (DMOS). The proposed combines motion quality estimates, bleeding regions’ quality estimates based on support vector machine (SVM) and perceptual quality estimates using the pristine and impaired WCE videos. Our method Quality Index for Bleeding Regions in Capsule Endoscopy (QI-BRiCE) videos is one of its kind and the results show high correlation in terms of Pearsons linear correlation coefficient (PLCC) and Spearman’s rank order correlation coefficient (SROCC). An F-test is also provided in the results section to prove the statistical significance of our proposed method.
Keywords: Automated bleeding detection; high efficiency video coding; video quality assessment; wireless capsule endoscopy
The swift evolution in multimedia communication systems has strongly emphasized the need for provision of quality of experience (QoE) to the consumers [1–3]. With the recent advent in healthcare services, in the form of telemedicine and telesurgery, etc., the network operators need to employ stringent criteria for maintaining high standards in the multimedia content provision towards end users. Such high standards can be maintained by continuously monitoring the quality of the multimedia content being transmitted through communication systems. Quality of service (QoS) and QoE are vital aspects in assessing the validity and reliability of multimedia telemedicine applications. Unlike telemedicine, the entertainment domain has seen intense research in the field of quality estimation and modelling for multimedia services and applications. An inefficient and costly way of quality estimation is by employing volunteers who can provide subjective measurements for the quality of the videos in question. The participants of these tests can be from expert (physicians, doctors etc.) and non-expert categories. Another way is to develop objective metrics, whose outputs are highly correlated with subjective measurements. The need of the hour is to develop efficient and accurate video quality metrics (VQM) for quality estimation of specific medical videos such as various ultrasound videos [4], endoscopy videos [3] and laparoscopic videos etc. With the provision of such metrics, the doctors and physicians will have enough confidence to use the medical multimedia content for various purposes, such as diagnosis, even after processing and transmission of data over wireless channels.
Wireless transmission offers two major challenges i.e., limitation in resources such as available bandwidth and the error prone nature of channels through which the data is transmitted. Bandwidth limitations force the network operators to adopt certain lossless [5–7] and lossy [8,9] compression algorithms in order to make sure that there is no interruption (stalling, frame freezing etc.) in services to the end users. Medical videos are considered highly sensitive/vital content as they contain vital information such as disease traces which help the doctors and physicians to perform diagnosis [3,10–12]. But with realization of modern video compression standards such as H. 265, the network operators can compress medical videos with minimum loss of perceptual and diagnostic quality. High efficiency video coding (HEVC) or H. 265 offers up to 50% bandwidth savings as compared to its predecessors.
For medical videos, perceptual quality holds lesser importance as compared to diagnostic quality in the context of video quality assessment (VQA) [3]. In telemedicine and telesurgery, the end users are mostly physicians and doctors who are more interested in the diagnostic quality of the videos. The diagnostic quality of medical videos mainly depends on the clarity of the sensitive content [3]. Objective VQMs for medical videos should be able to estimate the quality based on diagnostic as well as perceptual quality of the videos.
Wireless capsule Endoscopy (WCE) is a process in which a pill-shaped swallowable electronic device, as shown in Fig. 1, is swallowed by a patient and the device captures and transmits video of the gastro-intestinal (GI) tract to a post processing workstation. A Typical WCE video usually contains roughly 60,000 frames [13] and they require a lot of bandwidth if these frames are wirelessly transmitted. So, an efficient compression method is needed to avoid wasting network resources and also losing clarity in any diagnostic data. HEVC allows such compression with minimum amount of degradation in the diagnostic quality [3,4]. But, such compression requires continuous quality monitoring and the provision of efficient objective VQMs specifically designed for quality estimation of WCE videos can overcome this. The most common type of anomaly that occurs in GI tract of humans is the GI bleeding which leads to various kinds of fatal diseases. There have been several works highlighting the importance of GI bleeding in human beings [14].
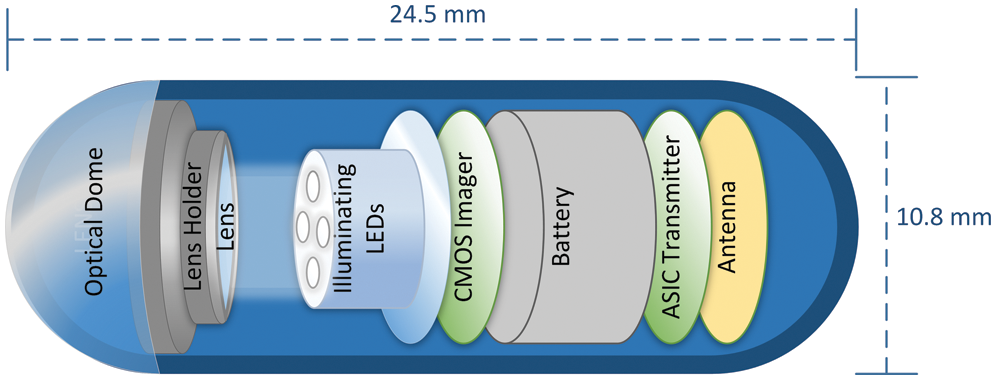
Figure 1: Components of a WCE device [13]; CMOS: Complementary metal oxide semiconductor, ASIC: Application specific integrated circuit. (Dimensions taken from Intromedic ltd. for MIROCAM capsule)
This paper presents a novel objective full reference (FR) VQM: Quality Index for Bleeding Regions in Capsule Endoscopy (QI-BRiCE). The metric mainly focuses on joint estimation of perceptual and diagnostic quality of impaired WCE videos that contain bleeding regions. The method jointly estimates the diagnostic and perceptual quality of impaired WCE videos that contain bleeding traces. To the best of authors’ knowledge, no work has been done to provide an objective VQM specifically designed for WCE videos. The main contributions of this paper are highlighted at the end of the next section.
In the following section, we have provided a survey of the state-of-the-art and the principal contributions of this work.
Though limited, but there have been efforts in designing, standardizing and modelling video quality metrics specially designed for estimating the quality of medical videos. This section firstly discusses the published works in video quality assessment (VQA) for medical videos and then discusses the state-of-the-art FR objective VQMs.
2.1 VQA in the Context of Medical Videos & Images
The authors in [15–17] have conducted a VQA study for various types of medical resonance (MR) images. All the three works have considered medical experts in their subjective tests and have studied different types of distortions in MR images. In [15], the authors have carried out subjective tests to assess the quality of MR images of the human brain, spine, knee and abdomen distorted with 6 types of distortion (Rician & White Gaussian noise, Gaussian blur, discrete cosine transform (DCT), JPEG and JPEG 2000 compression) at 5 various levels. In another study [16], MR images of brain, liver, breast, foetus, hip, knee, and spine were studied by considering the impact of a set of common distortions (Ghosting, edge ghosting, white and coloured noise) on the perceived quality. A similar study in [17] considers the perceptual impact of different types of distortions and noise in MR images. The study in [18] investigates the effects of blurring, colour, gamma parameters, noise, and image compression on animal digital pathology images. In this study, the test subjects belonged to both expert and non-expert category. In [19], a subjective study comprising of both expert and non-expert subjects is presented for studying the effects of angular resolution and light field reconstruction of 3D heart images. The authors in [20] conducted subjective tests with several medical experts and concluded that the highly compressed endoscopic videos presented to the experts did not modify their perception and opinion. Another study in [21], on H. 264 encoded laparoscopic videos was conducted to evaluate the impact of resolution and the constant rate factor (CRF) changes on overall image and semantic quality. In [3], the authors have presented a detailed objective and subjective study for HEVC compressed WCE videos. The study included both expert and non-expert participants and concluded maximum compression levels for WCE videos from the view point of diagnostic and perceptual quality. A similar study was conducted in [4] for HEVC compressed Ultrasound videos. In [22] subjective tests were conducted on 4 videos representing different stages of a laparoscopic surgery. A quality threshold in terms of bitrate was concluded from the viewpoint of experts’ opinion about MPEG2 compressed laparoscopic surgery videos. The authors in [23] studied the impact of delay, jitter, and packet loss ratio (PLR) on ophthalmology videos from the view point of telemedicine. In [24] the authors have conducted Subjective tests to investigate the impact of H. 264 and HEVC compression on hepatic ultrasound videos. A detailed and comprehensive survey related to medical VQA is available in a recent publication [14]. Finally, an FR VQM specifically designed for cardiac ultrasound videos is presented in [25].
Objective VQA is an economical as well as the least complex method of assessing the quality of videos for the purpose of network optimization. Network Operators employ objective FR VQA models for the purpose of network optimization because the results of an objective VQA model function as feedback to the network. Based on the results, the network operator optimizes the network in order to overcome the encoder and transmission errors. For medical purposes, this is very important as preserving the diagnostic information in medical videos is required. Objective VQA models can be classified into three major categories. First one is Full Reference (FR) VQA model, in which the source or original video is present at the reception side and the quality of the video is based on the comparison between the original video and the received video. Second one is Reduced Reference (RR) in which instead of the whole original video, some of its features are present at the reception side in this VQA model and the quality of the video is assessed based on the comparison of features of the original and the received video and finally third one is No Reference (NR) method in which there is no information of the original video available at the reception side.
A detailed review of FR metrics can be found in [26–28]. A brief description of FR VQMs used in this work is given as follows. Peak signal-to-noise-ratio (PSNR) is based on statistical measurements. Mean square error (MSE) is calculated for each pixel of a frame of a video sequence, which serves as noise in order to calculate the ratio of signal over noise. Structural similarity index metric (SSIM) [29] measures the quality of the video based on the structural similarity between the original video and the impaired video. The similarity is measured based on luminance, contrast and structural comparison. SSIM’s better version Multi-scale SSIM index metric (MSSSIM) [30] measures the quality of the image on multiple scales, with one as the lowest scale and M as the highest scale. The contrast and the structural comparison are calculated on a scale J but the luminance is measured on a scale M. The overall evaluation of the video is obtained by combining these measurements on different scales. Visual signal-to-noise ratio (VSNR) [31] uses contrast thresholds to identify the impairments in the video sequences. All the impairments above these thresholds are mapped to represent the quality of the video sequences. Information fidelity criterion (IFC) [32] is based on natural scene statistics (NSS); the reference video is transformed to the wavelet domain and then information based on NSS is extracted from it. The same information is extracted from the impaired video. Both extracted quantities are combined to form a model for estimating the visual quality of the video sequence. In Visual information fidelity (VIF) [33] metric the reference video is quantified and certain information is extracted from it by transforming each frame of the video into wavelet domain. This reference information is based on HVS i.e., the information that can easily be extracted by human brain from a video sequence. This same reference information is then extracted from the impaired video sequence. The two quantities are then combined in order to measure the visual quality of the distorted image. Pixel-based VIF (VIFP) [33] is a lower complexity version of the VIF metric. The information extracted from the reference and distorted videos are based on the pixels of each frame of the video sequences. Universal quality index (UQI) [34] measures the structural impairments in a video sequence and then maps these measurements to a model that can predict the visual quality based on these degradations. Noise quality measure (NQM) [35] considers the variation in contrast sensitivity, local luminance mean and contrast measures of the video sequence. This metric is a weighted signal to noise ratio measure between the reference and the processed video sequence. Weighted signal-to-noise ratio (WSNR) [35] metric uses a contrast sensitivity function (CSF) and defines WSNR as the ratio of the average weighted signal power to the average weighted noise power. It is measured on the dB scale.
The FR metrics explained in this section are freely available online for research and academic purposes. A full understanding of the mathematical models of these metrics can be found in their corresponding publications. These FR metrics are simulated in this paper for comparison purposes with the recommended simulation parameters taken from the corresponding publications.
Inferring from the presented survey of related works and with the authors’ best of knowledge, there has been so far no VQM that is specifically designed for WCE videos. As emphasized in earlier sections, GI bleeding is the most common type of abnormality that occurs in the GI tract of human beings. An efficient bleeding detection algorithm is needed that can highlight the bleeding regions or pixels in WCE videos. The diagnostic quality of a WCE video containing bleeding regions mainly depends on the detection of such regions. We combined a number of observations from the detailed subjective and objective VQA study presented in [3] and combined these observations with the bleeding detection algorithm presented in [14]. Further in this section, a novel quality estimation method QI-BRiCE is presented which takes into account the following estimates to build a quality index. The basic flowchart of the QI-BRiCE model can be seen in Fig. 2.
• Motion estimates between the pristine video and the impaired video, which are used to model a motion-quality model. Motion estimation models are available in [36,37].
• Bleeding pixels’ estimates of the pristine and impaired videos, which are used to build a quality model for detected bleeding regions using the method in [14].
• Quality estimates of non-bleeding video frames using the VIFP FR-VQM [33], which is the best performing metric for WCE videos based on the results from [3].
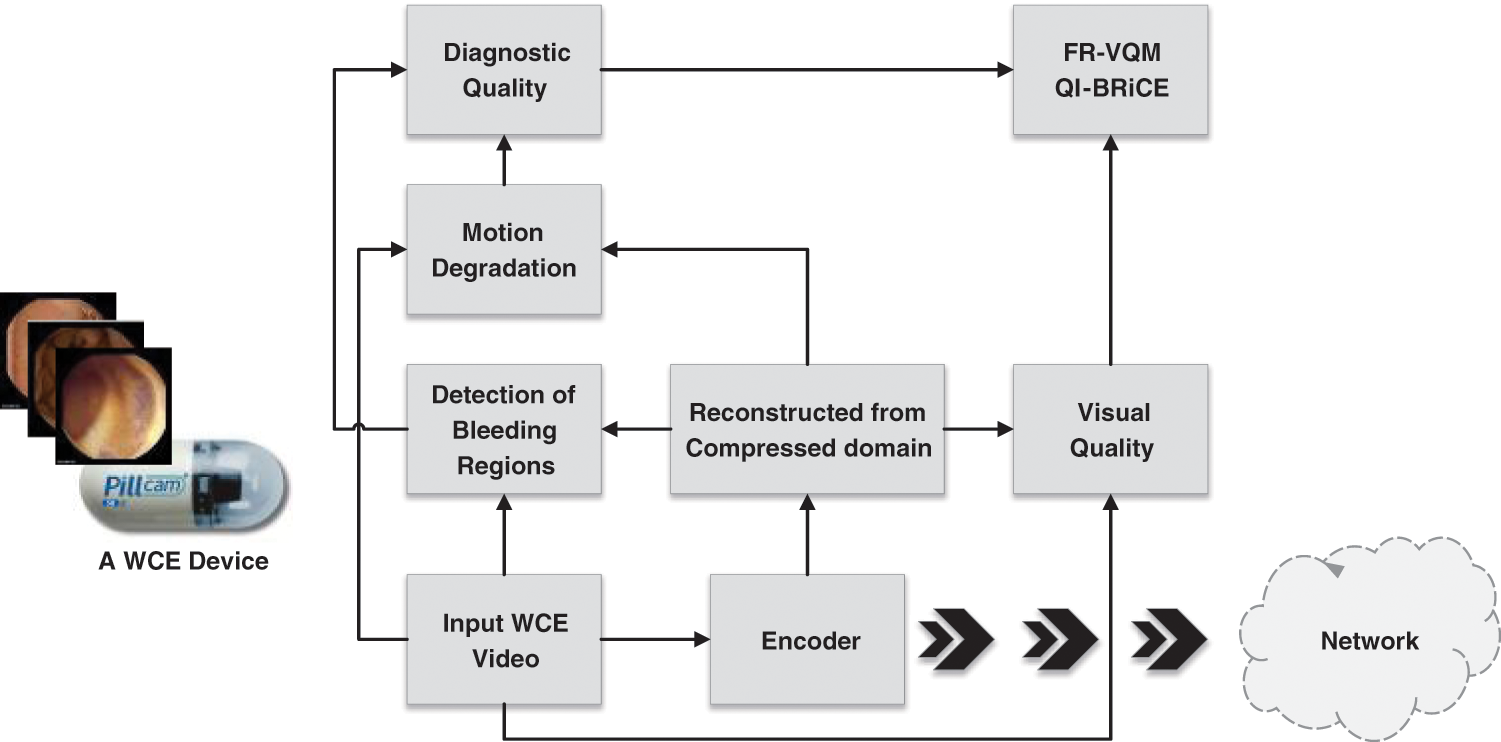
Figure 2: Flowchart of the proposed FR-VQM QI-BRiCE
The next section contains detailed explanation and step by step implementation of our proposed method QI-BRiCE.
The rest of the paper is organized as follows: Section 3 contains all the necessary theoretical and mathematical details about the proposed NR-VQM, including the frame freeze detection method. Section 4 encompasses the details about the preparation of video datasets that are used for model’s evaluation and validation in Section 5. Also, a comparison with other contemporary methods is provided in Section 5. Statistical significance tests, for further validating the proposed model as compared to other VQMs, are provided in Section 6. A brief discussion on the results, the conclusion, which is followed by the future work, is provided in Sections 7–9, respectively.
The contemporary FR-VQMs presented in Section 2 are designed to evaluate the visual or perceptual quality of a video. As these methods are not application specific, so they are considered general purpose FR-VQMs. For quality estimation of medical data, application specific VQMs are needed and so far, there has been limited work in this field of research [25]. In this section we have presented an FR method that jointly estimates the visual, as well as diagnostic quality of WCE videos that contain bleeding regions.
In Fig. 3, it can be observed that there is a significant difference between a compressed WCE video and an original one. The compressed WCE video was compressed at QP 41 using HEVC. This shows that the compression clearly effects the temporal information between frames of a video. In order to measure the degradation due to compression in WCE videos, we have used frame difference information between consecutive frames of WCE videos. The frame difference is calculated using (1) and (2), and it gives an estimate of how much motion degradation has occurred between consecutive frames of the compressed WCE video in consideration. For decreasing the computation complexity of this process, we firstly convert the pristine and impaired videos into binary color space where only one bit represents each pixel i.e., 0 s or 1 s. Compared to the natural RGB color space, where each pixel is represented by 24 bits, the binary color space offers significantly less computational time and provides the same level of accuracy as shown in [2]. So, the motion degradation is estimated by firstly calculating the frame difference between consecutive frames for the original and impaired WCE videos as follows.


where,  and
and  are the frame difference calculations for the original/reference and impaired/distorted WCE videos respectively. BR and BD represent the nth frame of the reference and distorted video in the binary color space,
  are the coordinates for each pixel and N
  is the total number of frames in the clips. The frame difference measurements for reference and distorted videos shown in Fig. 4 were plotted using (1) and (2). Further, in (3) and (4) we have taken mean of the frame difference measurements from previous equations.


avgMR and avgMD are the means of motion estimates for both the reference and distorted videos respectively. Finally, subtracting the mean motion estimate avgMD of the distorted video from the mean motion estimate avgMD of the reference video, we get the average motion degradation for the distorted video as follows:

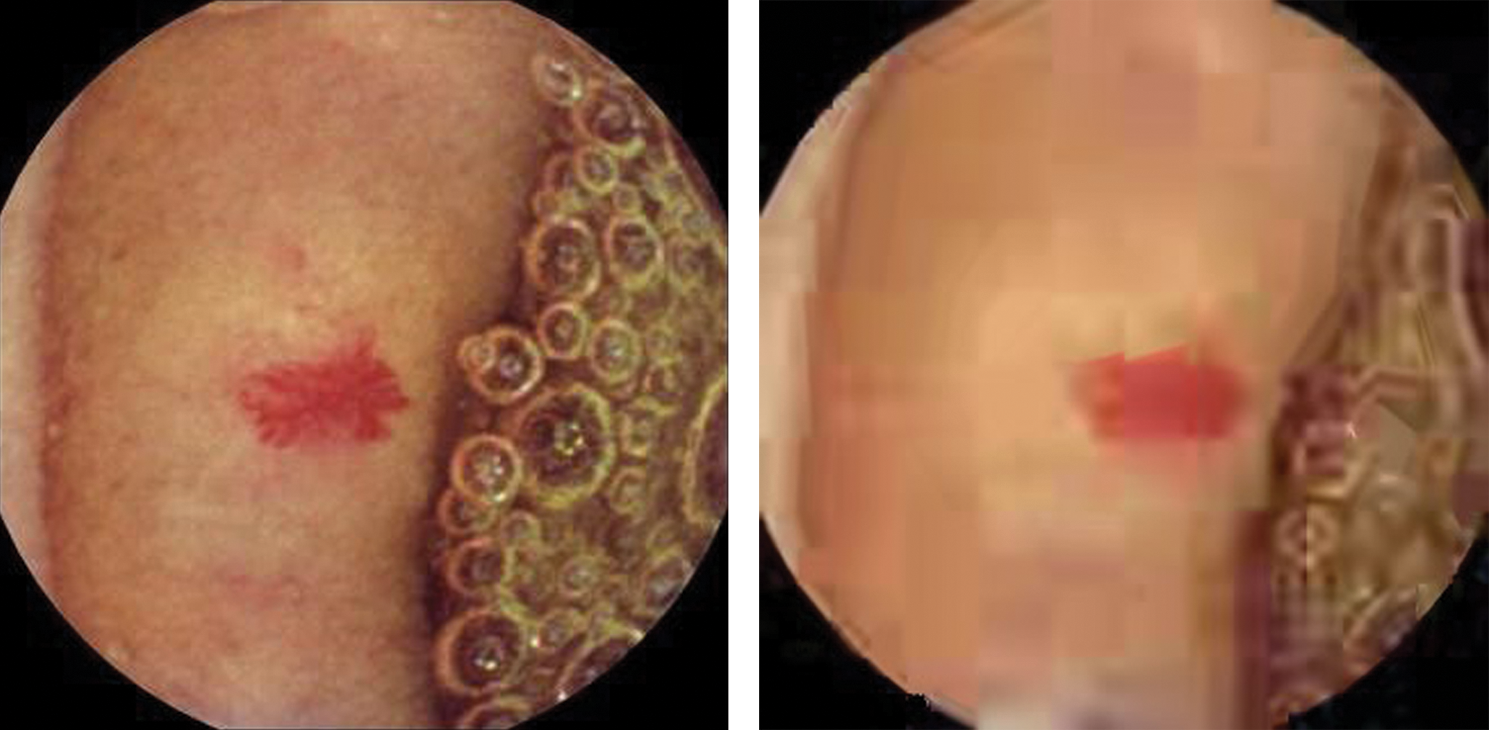
Figure 3: Left: Frame of a pristine WCE video. Right: Frame of a compressed WCE video. The anomaly shown in the frame is Angiodysplasia
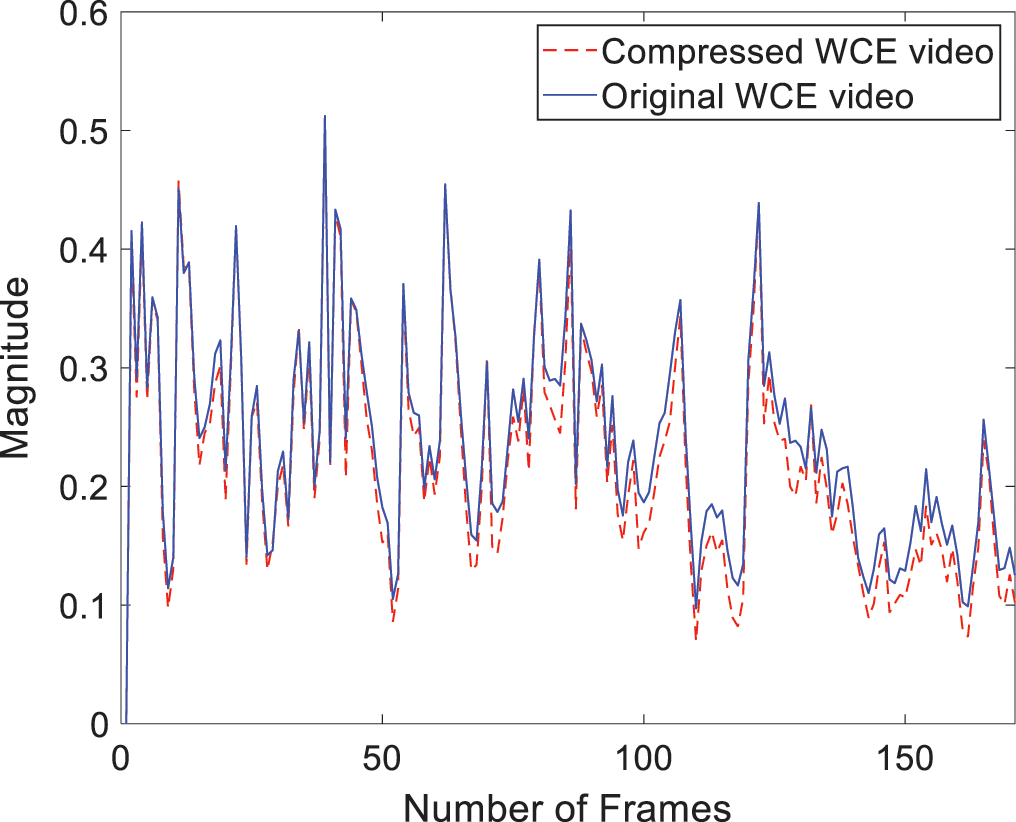
Figure 4: Motion difference between the original and compressed WCE video
In order to have a model for motion quality QM, we simply subtract the average motion degradation from (1) as shown in (6).

Next, we calculate the diagnostic quality estimates using the detected bleeding regions from the WCE videos.
3.2 Quality Estimates for Bleeding-Pixels
In this section, a model for quality estimation of bleeding pixels is presented, which is mainly dependent on the bleeding detection process. We have used the method used in [13] for the detection of bleeding regions in WCE videos and an overview of this method is given in the next subsection.
3.2.1 Bleeding Detection in WCE Videos
The bleeding detection method presented in [CMIG] uses color threshold analysis along with an optimal support vector machine (SVM) classifier to identify bleeding regions in WCE videos. Threshold analysis is used in HSV color space to build up features for the training of support vector machine classifier. The trained SVM classifier accurately classifies between bleeding and non-bleeding regions in WCE videos. A flowchart of this method is given in Fig. 5, where the training of the SVM based model is also shown. The details of this method can be found in its relevant publication [13].
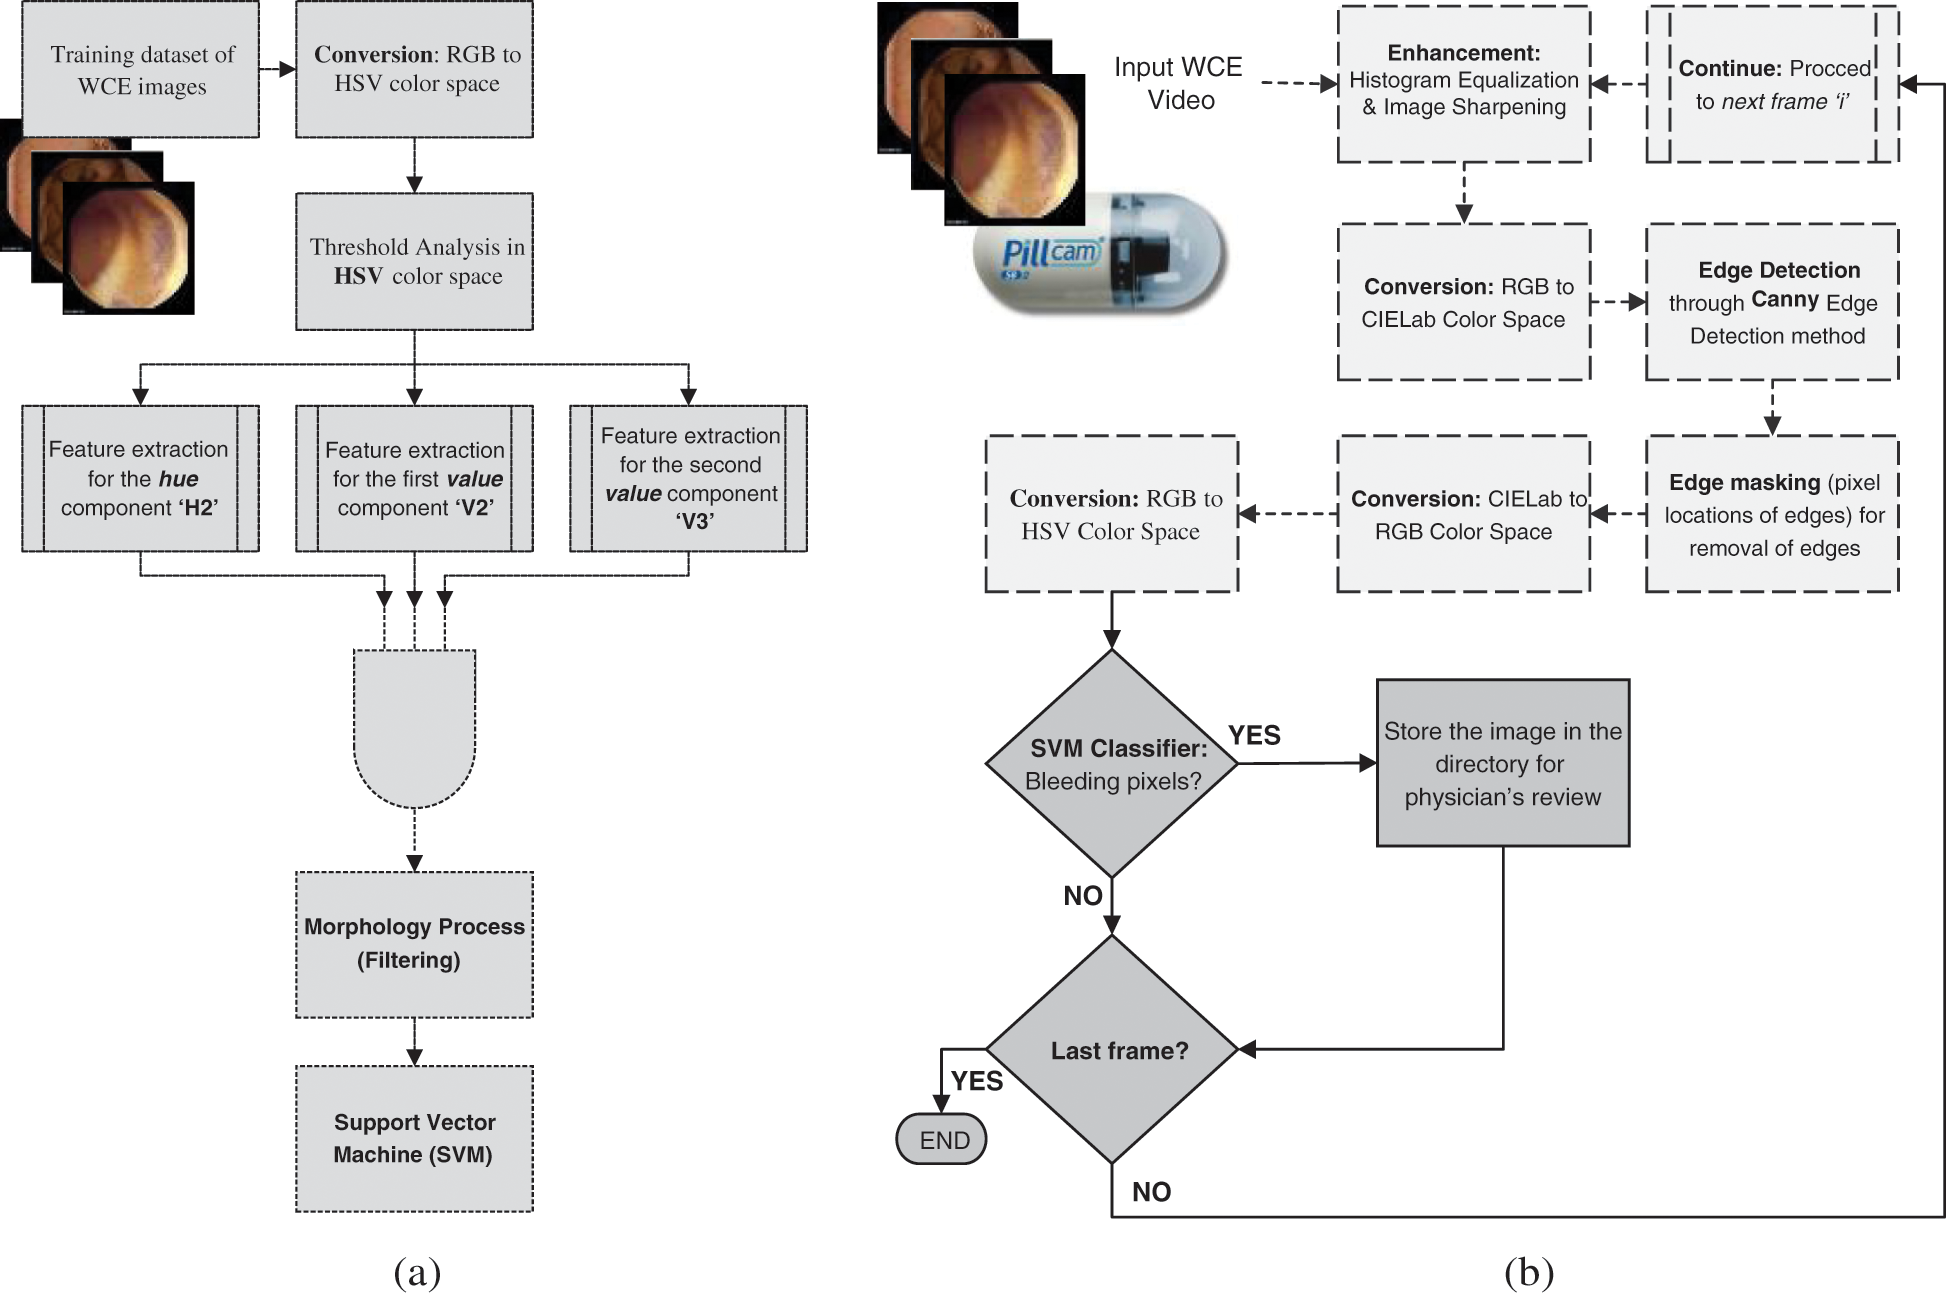
Figure 5: Flowchart of the bleeding detection method [13]. (a) Training model for the bleeding detection method (b) Bleeding detection method
The next subsection presents the quality estimation model for bleeding regions.
3.2.2 Quality Estimation for Bleeding Pixels
From the bleeding detection method explained briefly in the previous subsection, we have used the information of detected bleeding pixels. As the bleeding regions in the WCE video frames are the ones that are used for diagnosis of different GI tract diseases, so the quality estimation for such frames is more important as compared to non-bleeding frames. From (7) and (8), we calculate the number of bleeding pixels from all the detected frames that contain bleeding traces. Fig. 6 contains examples of WCE video frames that contain bleeding regions and their corresponding results for bleeding detection using the method in [13].


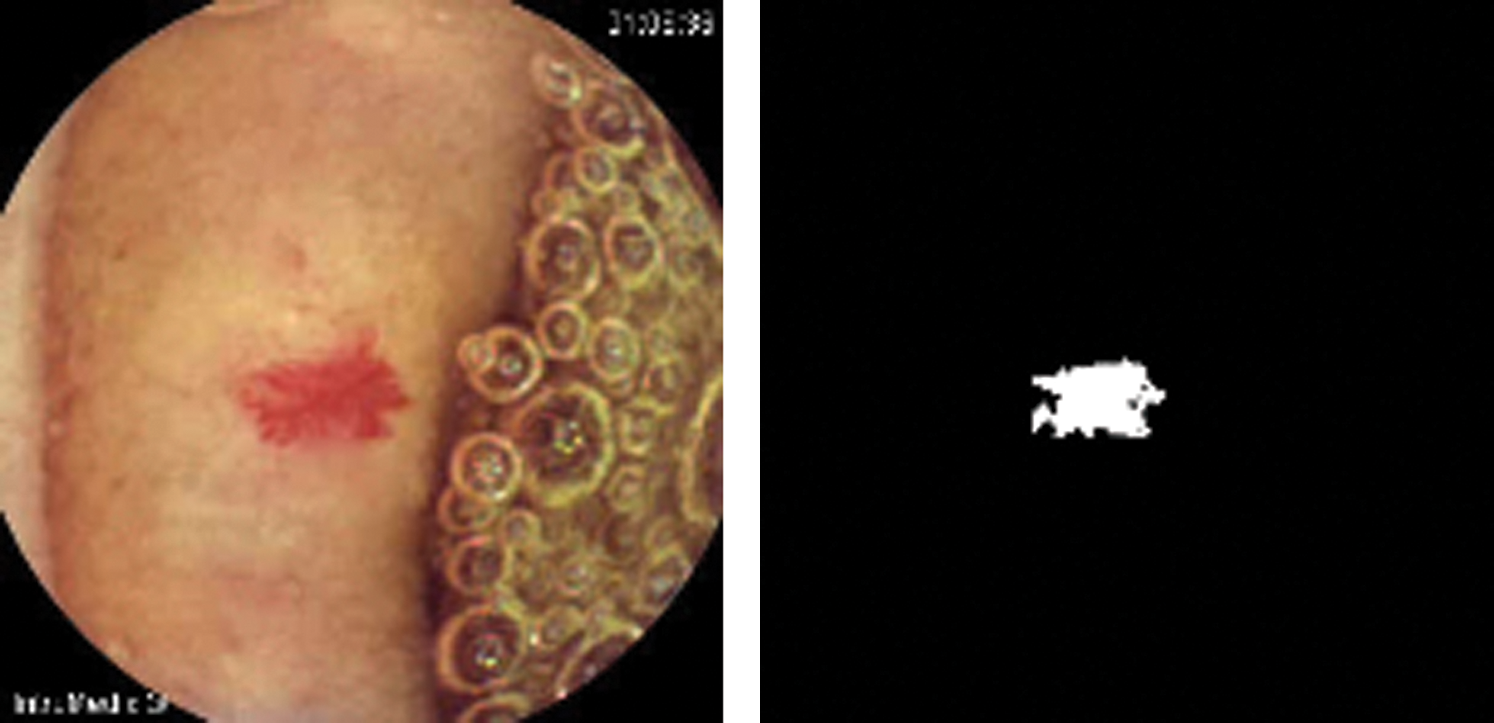
Figure 6: An example-result of the bleeding detection method in [13]
RBP and DBP are the average number of bleeding pixels, from all the WCE video frames that contain bleeding regions, for the reference and distorted WCE video.
Next step in quality estimation for bleeding regions is by calculating the ratio between  and RBP as shown in (9). The maximum value for this ratio is 1, and the minimum is 0. A value of 1 represents that RBP = DBP, which shows that the bleeding detection method [13], shows same results for the reference and distorted WCE video.

Using (6) and (9), we can model the diagnostic quality estimation model in the WCE videos as follows.

Now, we have a diagnostic quality estimation model in (10) which serves as the measure of diagnostic quality for the WCE videos containing bleeding traces. Next, we calculate the visual quality of the WCE videos.
3.3 Quality Estimates for Non-Bleeding-Pixels
From the observations in Section 4.1, we found that the contemporary FR-VQM visual information fidelity for pixels (VIFP) is the best performing metric in terms of correctly estimating the quality of WCE videos. Though VIF [33] and IFC [32] were among the best performing metrics as well but they have high computational time as compared to VIFP [33].
So, for the non-bleeding regions in WCE videos i.e., for calculating the visual quality QVis, we have used VIFP for all the frames that do not contain bleeding regions.

where, FNBP represents the total number of frames NNBP that do not contain bleeding regions. Using (11), we estimate the visual quality of the WCE videos and now we can move to the final quality estimation for the WCE videos.
The joint estimation of diagnostic and visual quality is performed by taking a product of QDiag, from (10), and QVis, from (11). As in medical videos, the diagnostic information is of high importance, so we assign different weights to both QDiag and QVis, where QDiag contains the diagnostic quality estimates.

Using (12), we can estimate the overall quality of a WCE video that contains bleeding regions. We calculated the best values for the weighting factors w1 and w2, based on the highest degree of overlap for subjective measurements and our proposed model’s predictions. For optimal performance of our model, we assigned 70% weightage to QDiag and 30% to QVis. In this way w1 = 0.7 and w2 = 0.3. The weightage is assigned by keeping in view that in medical videos, diagnostic quality is more important than visual or perceptual quality. In the next section, we have performed performance evaluation of our presented FR-VQM with other contemporary FR-VQMs.
4 Model Evaluation and Results
The subjective tests and their corresponding results used to evaluate our presented model in this paper are thoroughly presented in [3]. In this section, we have briefly explained the WCE video dataset, subjective tests, scores and the corresponding results.
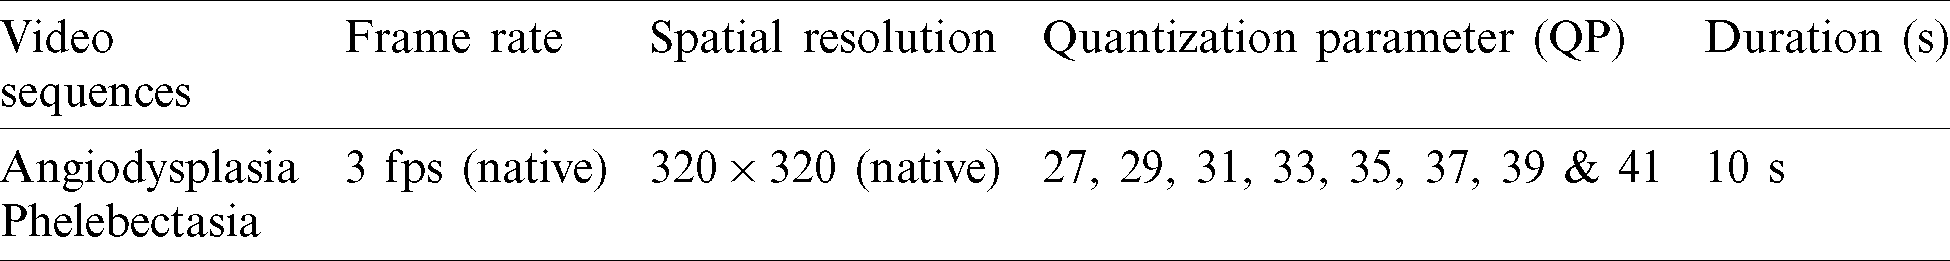
For the evaluation of our proposed method, we have used 2 original WCE videos containing bleeding regions. These two pristine videos correspond to the diseases Angiodysplasia and Phlebectasia, which are most common GI bleeding diseases, as shown in Fig. 7. These videos were compressed using HEVC video encoder (HM 8.0 software) [3] at eight different compression levels. The compression level was maintained using the quantization parameter (QP) in HEVC. We compressed the videos at QP values of 27, 29, 31, 33, 35, 37, 39 and 41. So, in this way the total number of processed video clips became 16 and 18 videos in total, including the two pristine videos. The details about these videos are given in Tab. 1.
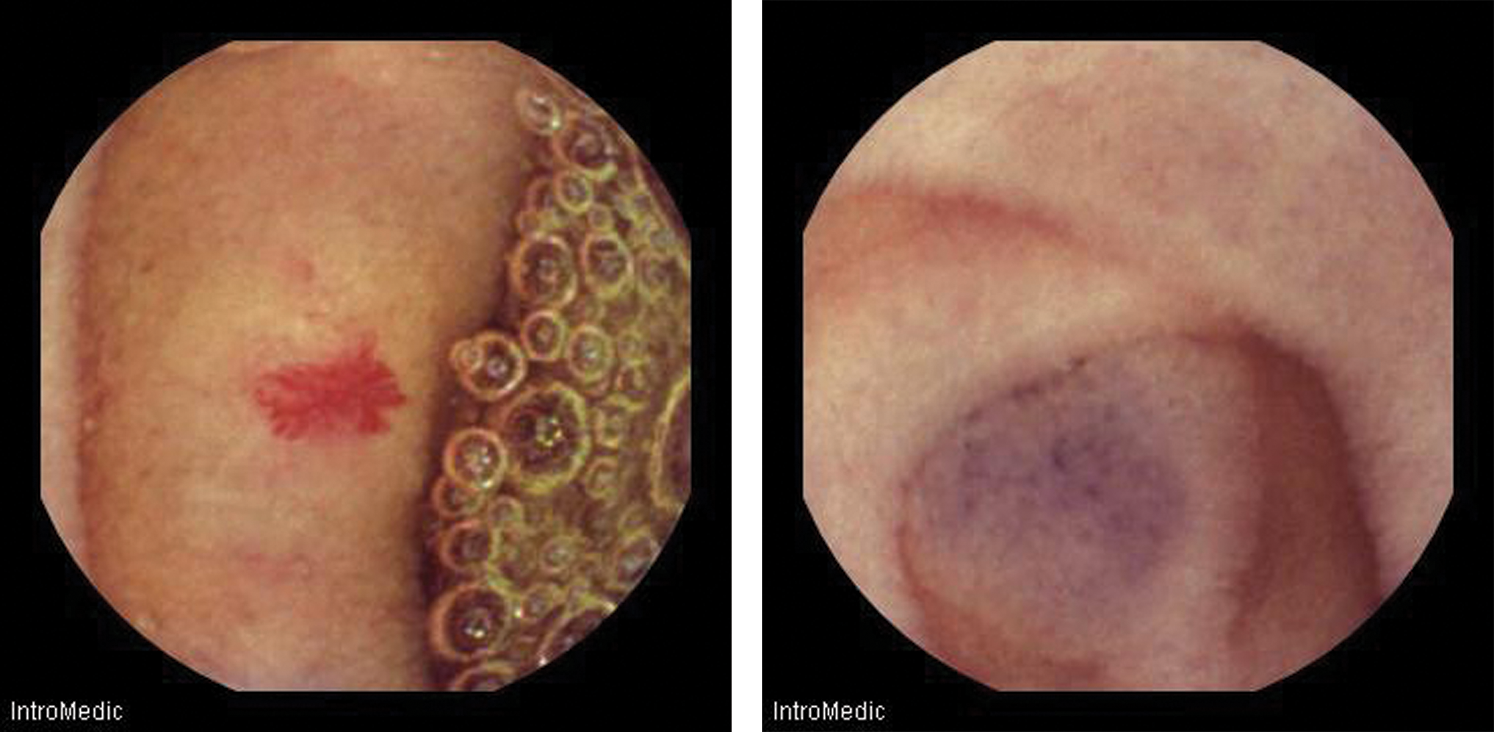
Figure 7: Snapshots of videos used for model evaluation. Left: Angiodysplasia, Right: Phlebectasia
Table 1: Information about the videos used for model evaluation
The selection of observers in our subjective tests consisted of 6 experts (clinicians) and 19 non-experts, the description and process of selection of these participants is provided in [3]. As explained in [3], after screening of the observers, one non-expert’s measurements were discarded. The method DSCQS type-II was used to evaluate the quality of the clips on 5-point continuous rating scale ranging from 1 to 5. In the DSCQS type-II method, a participant is shown two videos, an original and processed video, at the same time, but the participant is unaware which one is the original. As the participants view both clips, they are asked to rate them on the scale separately. The recorded opinion scores (OS) on the five point rating scale are converted to a normalized scale that ranges between 0 and 100. The details about the scoring method are provided in [3].
4.2 Performance Evaluation and Results
To evaluate the performance of our method QI-BRiCE, we have used the correlation analysis i.e., correlation between the expert and non-expert subjective measurements and the model’s predictions. A high correlation means the performance of the proposed method is good and vice versa.
Furthermore, we have used 3rd order polynomial curve fitting model for improving the performance of our proposed method. This is done by fitting the output of our proposed method to the curve fitting model, which results in better quality prediction. In the presented work, the fitting is done using robust least square regression and the method used is bi-square weights. The curve fitting is performed for both the expert and non-expert measurements and the results are shown in Fig. 8.
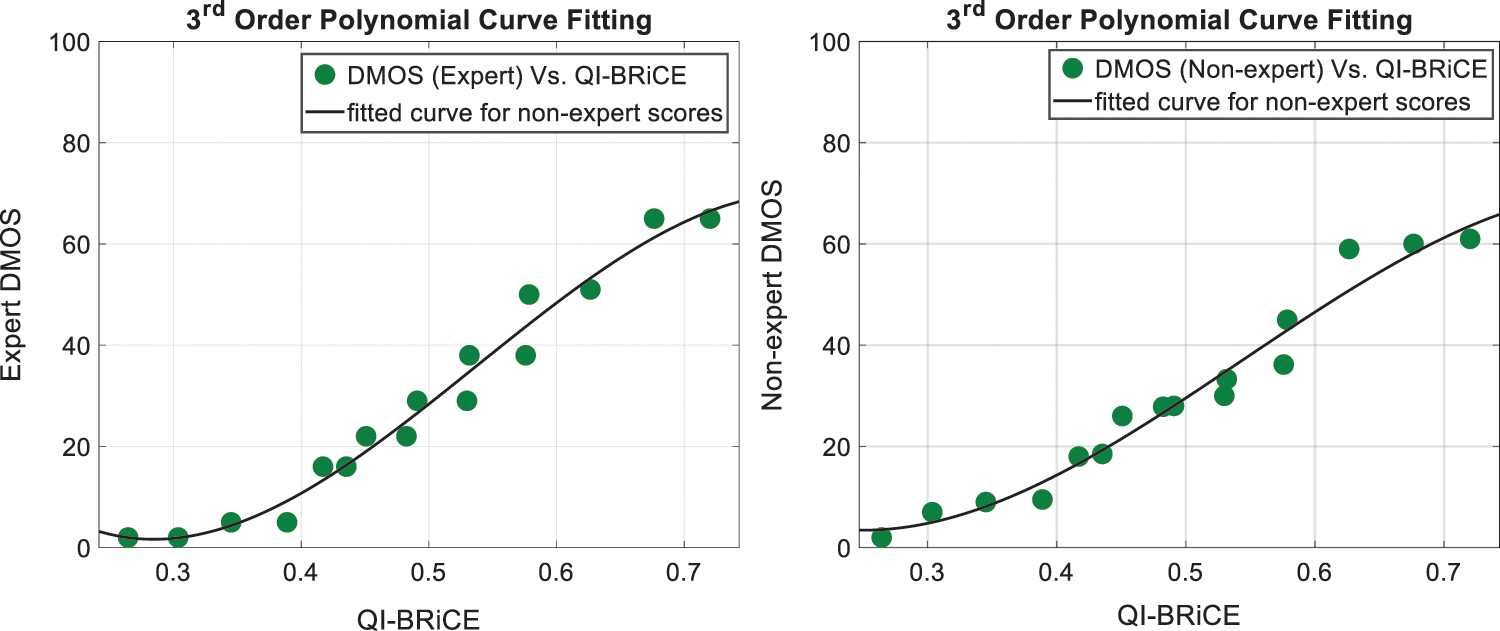
Figure 8: Curve fitting results for the expert and non-expert DMOS
Further, Tab. 2 shows the results in terms of Pearson linear correlation coefficient (PLCC) and Spearman rank order correlation coefficient (SROCC). It can be observed that our method exhibits highest correlation in terms of both PLCC and SROCC. To further emphasize the performance of our method, we have performed statistical significance tests to see which objective metric is statistically superior to others. We have used the F-Test which is based on the errors between the average DMOS and objective metrics’ predictions. For a particular objective metric, this test results in three conclusions i.e., whether the metric is statistically superior, inferior or equal to other metrics. Similar tests have been conducted in [1–3].
Table 2: Comparison between contemporary FR-VQMs and QI-BRiCE (PLCC & SROCC)

In an F-test, the ratio of the variance of the residual error from one objective metric to that of another metric is calculated. Using (13) [3], as follows, the residual errors between the objective metric predictions and the DMOS are calculated.

where,  represents the fitted score of objective VQA model for the jth WCE clip, DMOSJ represents the DMOS for the same clip and N is the total number of WCE clips.

where, var represents variance and the F-Test is applied on this ratio at 95% significance level. In an F-test, the null hypothesis states that the variances of error residuals of two objective metrics are equal. If the null hypothesis is rejected, then this concludes that either of the metrics’ is superior to the other. The ratio which is calculated using (14) is compared to an F-Critical value. The metric with higher variance in error residuals is kept in the numerator while calculating the F-ratio in (14). If the F-ratio is greater than the F-critical value then it is concluded that the metric in denominator is superior to the metric in numerator, hence the null hypothesis is rejected.
The results for the F-test are given in Tab. 3. The F-critical value can be calculated using the significance level and the number of video clips. From Tabs. 3a and 3b, it can be summarized that the performance of QI-BRiCE, for expert DMOS, is statistically superior to that of PSNR, SSIM, MSSSIM, VSNR, UQI, NQM and WSNR but it is statistically equivalent to the performance of VIF, VIFP and IFC.
Table 3: (a) Statistical significance test results (F-test using experts’ scores). (b) Statistical significance test results (F-test using non-experts’ scores)

Note: A symbol value of “1” indicates that the statistical performance of the VQA model in the row is superior to that of the model in the column. A symbol value of “0” indicates that the statistical performance of the model in the row is inferior to that of the model in the column and “=” indicates that the statistical performance of the model in the row is equivalent to that of the model in the column.
In this paper, we have presented a novel FR VQM QI-BRiCE that estimates the diagnostic and perceptual quality of impaired WCE videos containing bleeding regions. The diagnostic quality is measured by considering motion quality estimates and bleeding regions’ quality estimates, whereas perceptual quality is measured using the contemporary VQM VIFP. Both diagnostic and perceptual quality are then combined together using a weighted sum approach. The method outperforms other contemporary FR VQMs in terms of PLCC and SROCC. Also, the statistical significance of QI-BRiCE is superior to most of the FR-VQMS.
The potential future extensions of the presented work are as follows but are not limited to. The method can be enhanced to include other anomalies in WCE videos such as various types of GI tumors. Other anomaly detection approaches can be combined with the proposed method in order to estimate the quality of WCE videos containing different types of anomalies other than GI bleeding.
Funding Statement: This research was supported by Innovate UK, which is a part of UK Research & Innovation, under the Knowledge Transfer Partnership (KTP) program (Project No. 11433). This research was supported by the Grand Information Technology Research Center Program through the Institute of Information & Communications Technology and Planning & Evaluation (IITP) funded by the Ministry of Science and ICT (MSIT), Korea (IITP-2020-2020-0-01612).
Conflicts of Interest: The authors declare that they have no conflicts of interest to report regarding the present study.
1. A. K. Moorthy, L. K. Choi, A. C. Bovik and G. De Veciana. (2012). “Video quality assessment on mobile devices: Subjective, behavioral and objective studies,” IEEE Journal of Selected Topics in Signal Processing, vol. 6, no. 6, pp. 652–671. [Google Scholar]
2. M. A. Usman, M. R. Usman and S. Y. Shin. (2018). “A novel no-reference metric for estimating the impact of frame freezing artifacts on perceptual quality of streamed videos,” IEEE Transactions on Multimedia, vol. 20, no. 9, pp. 2344–2359. [Google Scholar]
3. M. A. Usman, M. R. Usman and S. Y. Shin. (2017). “Quality assessment for wireless capsule endoscopy videos compressed via HEVC: From diagnostic quality to visual perception,” Computers in Biology and Medicine, vol. 91, pp. 112–134. [Google Scholar]
4. M. Razaak, M. G. Martini and K. Savino. (2014). “A study on quality assessment for medical ultrasound video compressed via HEVC,” IEEE Journal of Biomedical and Health Informatics, vol. 18, no. 5, pp. 1552–1559. [Google Scholar]
5. M. A. Usman, M. R. Usman and S. Y. Shin. (2018). “Exploiting the spatio-temporal attributes of HD videos: A bandwidth efficient approach,” IEEE Transactions on Circuits and Systems for Video Technology, vol. 28, no. 9, pp. 2418–2422. [Google Scholar]
6. M. R. Usman, M. A. Usman and S. Y. Shin. (2018). “A novel encoding-decoding scheme using Huffman coding for multimedia networks,” in 15th IEEE Annual Consumer Communications & Networking Conf., San Jose, California, USA. [Google Scholar]
7. M. B. Shahab, M. A. Usman and S. Y. Shin. (2017). “Bandwidth adaptation by squeezing idle traffic in browsers: An active window detection based approach for next generation networks,” IEEE Communications Letters, vol. 21, no. 2, pp. 310–313. [Google Scholar]
8. J. R. Ohm, G. J. Sullivan, H. Schwarz, T. K. Tan and T. Wiegand. (2012). “Comparison of the coding efficiency of video coding standards—Including high efficiency video coding (HEVC),” IEEE Transactions on Circuits and Systems for Video Technology, vol. 22, no. 12, pp. 1669–1684. [Google Scholar]
9. ITU-R. (2016). “Recommendation, E41298. H.265,” High Efficiency Video Coding. [Google Scholar]
10. M. Razaak and M. G. Martini. (2013). “Medical image and video quality assessment in e-health applications and services,” in EEE 15th Int. Conf. on e-Health Networking, Applications and Services, Lisbon, Portugal, pp. 6–10. [Google Scholar]
11. A. Kumcu, K. Bombeke, L. Platisa, L. Jovanov, J. V. Looy et al. (2017). , “Performance of four subjective video quality assessment protocols and impact of different rating preprocessing and analysis methods,” IEEE Journal of Selected Topics in Signal Processing, vol. 11, no. 1, pp. 48–63. [Google Scholar]
12. M. G. Martini. (2008). “Wireless broadband multimedia health services: Current status and emerging concepts,” in IEEE 19th Int. Symp. on Personal, Indoor and Mobile Radio Communications, Nantes, France, pp. 1–6. [Google Scholar]
13. M. A. Usman, G. B. Satrya, M. R. Usman and S. Y. Shin. (2016). “Detection of small colon bleeding in wireless capsule endoscopy videos,” Computerized Medical Imaging and Graphics, vol. 54, pp. 16–26. [Google Scholar]
14. L. Leveque, H. Liu, S. Baraković, J. B. Husić, M. Martini et al. (2018). , “On the subjective assessment of the perceived quality of medical images and videos,” in 10th IEEE Int. Conf. on Quality of Multimedia Experience, Sardinia, Italy. [Google Scholar]
15. L. Chow, H. Rajagopal, R. Paramesran and Alzheimer’s Disease Neuroimaging Initiative. (2016). “Correlation between subjective and objective assessment of magnetic resonance (MR) images,” Magnetic Resonance Imaging, vol. 34, pp. 820–831. [Google Scholar]
16. H. Liu, J. Koonen, M. Fuderer and I. Heynderickx. (2016). “The relative impact of ghosting and noise on the perceived quality of MR images,” IEEE Transactions on Image Processing, vol. 25, pp. 3087–3098. [Google Scholar]
17. J. Suad and W. Jbara. (2013). “Subjective quality assessment of new medical image database,” International Journal of Computer Engineering and Technology, vol. 4, pp. 155–164. [Google Scholar]
18. L. Platisa, L. Van Brantegem, Y. Vander Haeghen, C. Marchessoux, E. Vansteenkiste et al. (2013). , “Psychovisual evaluation of image quality attributes in digital pathology slides viewed on a medical color LCD display,” in Proc. of SPIE Medical Imaging, Florida, USA, vol. 8676. [Google Scholar]
19. P. Kara, P. Kovacs, S. Vagharshakyan, M. Martini, S. Imre et al. (2017). , “Perceptual quality of reconstructed medical images on projection-based light field displays,” eHealth, vol. 181, pp. 476–483. [Google Scholar]
20. A. Chaabouni, Y. Gaudeau, J. Lambert, J. M. Moureaux and P. Gallet. (2014). “Subjective and objective quality assessment for H.264 compressed medical video sequences,” in Proc. of the 4th Int. Conf. in Image Processing, Paris, France, pp. 1–5. [Google Scholar]
21. B. Münzer, K. Schoeffmann, L. Böszörmenyi, J. Smulders and J. Jakimowicz. (2014). “Investigation of the impact of compression on the perceptual quality of laparoscopic videos,” in IEEE 27th Int. Symp. on Computer-Based Medical Systems, New York, USA, pp. 153–158. [Google Scholar]
22. N. Nouri, D. Abraham, J. Moureaux, M. Dufaut, J. Hubert et al. (2010). , “Subjective MPEG2 compressed video quality assessment: Application to tele-surgery,” in IEEE Int. Symp. on Biomedical Imaging: From Nano to Macro, Rotterdam, Netherlands, pp. 764–767. [Google Scholar]
23. B. Tulu and S. Chatterjee. (2008). “Internet-based telemedicine: An empirical investigation of objective and subjective video quality,” Decisions Support Systems, vol. 45, pp. 681–696. [Google Scholar]
24. L. Leveque, W. Zhang, P. Parker and H. Liu. (2017). “The impact of specialty settings on the perceived quality of medical ultrasound video,” IEEE Access, vol. 5, pp. 16998–17005. [Google Scholar]
25. M. Razaak and M. G. Martini. (2016). “CUQI: Cardiac ultrasound video quality index,” Journal of Medical Imaging, vol. 3, no. 1, pp. 11011. [Google Scholar]
26. S. Winkler. (1999). “Issues in vision modeling for perceptual video quality assessment,” Signal Processing, vol. 78, no. 2, pp. 231–252. [Google Scholar]
27. Z. Wang, H. R. Sheikh and A. C. Bovik. (2003). “Objective video quality assessment, ” in The Handbook of Video Databases: Design and Applications, B. Furht, O. Marques (Eds.USA: CRC Press. [Google Scholar]
28. S. Daly. (1992). “The visible difference predictor: An algorithm for the assessment of image fidelity,” Proceedings of SPIE, vol. 1616, pp. 2–15. [Google Scholar]
29. Z. Wang, A. C. Bovik, H. R. Sheikh and E. P. Simoncelli. (2004). “Image quality assessment: From error visibility to structural similarity,” IEEE Transactions on Image Processing, vol. 13, no. 4, pp. 600–612. [Google Scholar]
30. Z. Wang, P. E. Simoncelli and A. C. Bovik. (2003). “Multiscale structural similarity for image quality assessment,” in Conf. Record of the Thirty-Seventh Asilomar Conf. on Signals, Systems and Computers, Pacific Grove, CA, USA, vol. 2. [Google Scholar]
31. D. M. Chandler and S. S. Hemami. (2007). “VSNR: A wavelet-based visual signal-to-noise ratio for natural images,” IEEE Transactions on Image Processing, vol. 16, no. 9, pp. 2284–2298. [Google Scholar]
32. H. R. Sheikh, A. C. Bovik and G. de Veciana. (2005). “An information fidelity criterion for image quality assessment using natural scene statistics,” IEEE Transactions on Image Processing, vol. 14, no. 12, pp. 2117–2128. [Google Scholar]
33. Y. Han, Y. Cai, Y. Cao and X. Xu. (2013). “A new image fusion performance metric based on visual information fidelity,” Information Fusion, vol. 14, no. 2, pp. 127–135. [Google Scholar]
34. Z. Wang and A. C. Bovik. (2002). “A universal image quality index,” IEEE Signal Processing Letters, vol. 9, no. 3, pp. 81–84. [Google Scholar]
35. N. D. Venkata, T. D. Kite, W. S. Geisler, B. L. Evans and A. C. Bovik. (2000). “Image quality assessment based on a degradation model,” IEEE Transactions on Image Processing, vol. 9, no. 4, pp. 636–650. [Google Scholar]
36. A. B. Watson, J. Hu and J. F. McGowan. (2001). “Digital video quality metric based on human vision,” Journal of Electronic Imaging, vol. 10, no. 1, pp. 20–29. [Google Scholar]
37. B. Ortiz-Jaramillo, A. Kumcu, L. Platisa and W. Philips. (2014). “A full reference video quality measure based on motion differences and saliency maps evaluation,” in Int. Conf. on Computer Vision Theory and Applications, SCITEPRESS Digital Library, Lisbon, Portugal, vol. 2, pp. 714–722. [Google Scholar]
 | This work is licensed under a Creative Commons Attribution 4.0 International License, which permits unrestricted use, distribution, and reproduction in any medium, provided the original work is properly cited. |