DOI:10.32604/cmc.2021.014774
| Computers, Materials & Continua DOI:10.32604/cmc.2021.014774 | |
| Article |
M-IDM: A Multi-Classification Based Intrusion Detection Model in Healthcare IoT
1Healthcare AI Team, National Cancer Center, Goyang-si, 10408, Korea
2Department of Computer Science and Engineering, Seoul National University of Science and Technology, (SeoulTech), Seoul, 01811, Korea
*Corresponding Author: Jong Hyuk Park. Email: jhpark1@seoultech.ac.kr
Received: 15 October 2020; Accepted: 12 December 2020
Abstract: In recent years, the application of a smart city in the healthcare sector via loT systems has continued to grow exponentially and various advanced network intrusions have emerged since these loT devices are being connected. Previous studies focused on security threat detection and blocking technologies that rely on testbed data obtained from a single medical IoT device or simulation using a well-known dataset, such as the NSL-KDD dataset. However, such approaches do not reflect the features that exist in real medical scenarios, leading to failure in potential threat detection. To address this problem, we proposed a novel intrusion classification architecture known as a Multi-class Classification based Intrusion Detection Model (M-IDM), which typically relies on data collected by real devices and the use of convolutional neural networks (i.e., it exhibits better performance compared with conventional machine learning algorithms, such as naïve Bayes, support vector machine (SVM)). Unlike existing studies, the proposed architecture employs the actual healthcare IoT environment of National Cancer Center in South Korea and actual network data from real medical devices, such as a patient’s monitors (i.e., electrocardiogram and thermometers). The proposed architecture classifies the data into multiple classes: Critical, informal, major, and minor, for intrusion detection. Further, we experimentally evaluated and compared its performance with those of other conventional machine learning algorithms, including naïve Bayes, SVM, and logistic regression, using neural networks.
Keywords: Smart city healthcare IoT; neural network; intrusion classification; machine learning
Nowadays, information and communication technology is increasingly applied to the the healthcare sector in smart city infrastructure, the foundation of which is network technology for data transmission and reception. Network flows in such infrastructure are also increasing in complexity owing to advanced technologies such as Internet of Things (IoT), cloud computing, big data, mobile, artificial intelligence, and blockchain technologies [1].
Before the advent of IoT, interactions between patients and medical staff were limited to visits and telephone calls. As such, it was impossible to monitor patients continuously. The application of IoT has enhanced the connectivity of devices related to healthcare and has redefined the interaction space of devices and people when medical services are provided, significantly improving the medical sector. With the emergence of IoT-applied medical services, all members in a city, including healthy people, patients, medical staff, hospitals, and health insurance companies, can now remotely monitor a person’s health status with no distinction between inside and outside a medical institution. This capability has increased the ease and efficiency of interacting with medical staff. It not only shortens hospital stays and prevents re-hospitalization, but also substantially reduces medical costs and improves treatment outcomes [2–4].
A vast amount of data in smart city healthcare field has been actively trasferred between people through devices based on edge nodes or edge cloud. There are also various types of connectivity-based equipment. Such an environment, however, contains either directly or indirectly sensitive information, which potentially exposes personal information to attacks. Unlike other fields, healthcare cyberattacks in smart cities can cause physical and logical confusion to individuals and society. Therefore, it should be able to defend against interrupting service requests on the network [2–4].
Previous studies mostly focused on security threat detection and blocking technology (based on testbed data composed of a single medical IoT device or simulator) [5–12]. However, such approaches lack reflection of features that exist in the real world.
Therefore, in this study, machine learning technology was applied to classify network events into four different classes (critical, informal, major, and minor) using data collected by real devices in order to sufficiently reflect the complex network flow and characteristics of the actual healthcare IoT environment. We built real world data-based models using a neural network-based multi-class intrusion classification algorithm for these classes.
To address the above problems in healthcare IoT, we proposed a Multi-class classification based Intrusion Detection Model (M-IDM) for healthcare IoT in a smart city that relies on machine learning techniques. The contributions of this paper are as follows:
• We proposed a novel intrusion classification architecture based on machine learning techniques to overcome problems related to the detection of unknown attacks in healthcare IoT.
• A service scenario is presented to classify the security event in the network as “normal” or “anomaly (critical, major, minor)” based on various features.
• We experimentally evaluated and analyzed the proposed model architecture using a large amount of data to demonstrate its practicability and feasibility.
The structure of the rest of this paper is as follows. Section 2 discusses related works on intrusion detection and machine learning. Section 3 proposes a prediction model using machine learning algorithms for intelligent network intrusion detection. Section 4 provides analysis and comparison of the existing and proposed models for network intrusion detection. Finally, Section 5 summarizes the main findings of this study and the concluding remarks.
This procedure is divided into the network intrusion detection system (NIDS) and host-based intrusion detection system (HIDS) according to the detection location. The NIDS analyzes the network traffic, and the result is combined with other technologies to increase the performance of the detection and prediction speed. In particular, artificial neural network-based intrusion detection systems can recognize intrusion patterns more efficiently, which helps them analyze large amounts of data. Meanwhile, the HIDS monitors important operating system files and the inbound and outbound packets of the device and also sends alerts in cases of a suspicious activity.
Classification techniques can be divided into signature-based and anomaly-based methods. Signature-based methods search for specific patterns, such as byte sequences of network traffic or sequences of known malicious instructions using malware. In contrast, anomaly-based methods can easily detect known attacks but show poor detection performance in the case of new attacks in which patterns cannot be used. Anomaly-based methods are primarily used to classify unknown attacks due to the rapid development of a malicious code. Essentially, the machine learning algorithm is used to create a reliable model, then, its operations are compared. Although unknown attacks can be detected, this method may also result in false positives. An efficient feature selection algorithm must be used to enhance the reliability of classification [13–19].
In theoretical terms, machine learning is a field of artificial intelligence in which algorithms are developed that enable machines to learn and execute operations that are not specified in codes. Representation and generalization are the key elements among the many features that are involved in machine learning. Representation refers to the evaluation of given data, whereas generalization refers to processing of unknown data. In practice, the three key elements of machine learning are the training set, model, and inference. The training set refers to data used for learning, the model is the output obtained through the training set, and the inference is the training output prediction based on input values through actual data [20,21]. Fig. 1 summarizes the above descriptions.
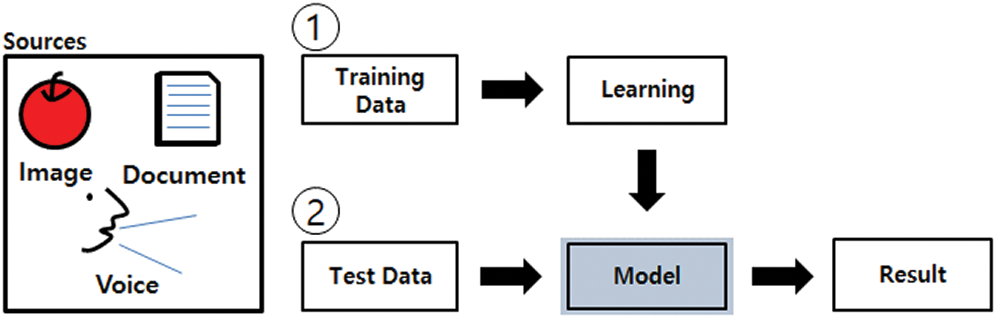
Figure 1: Workflow of a machine learning-based model
In a conventional program, data are input and the program presents the results of processing the input data. However, when machine learning processes the data, the model (algorithm) developed from the training dataset provides the prediction results of the input values in the test dataset. Hence, machine learning algorithms are suitable for solving problems where it is difficult to explain the sequence or reasoning clearly [20].
The machine learning model was selected based on whether the data were labeled or not; if the data are labeled, supervised learning models are used to perform classification and prediction, whereas if the data are unlabeled, unsupervised learning models are used to perform clustering. The two models are different, but when applying actual data to the model, a harmonized methodology is used because labeled data are rare [20–22].
Kabir et al. [23] proposed an algorithm that selects representative samples from sub-groups so that the samples faithfully reflect the entire dataset. In the optimal allocation technique, least-squares support vector machine (SVM) is applied to the extracted sample to detect intrusion after generation based on the diversity of observations in the subgroup.
Wang et al. [24] proposed an effective intrusion detection framework with improved functionality based on SVMs, emphasizing that high-quality training data are important for enhancing detection performance. In this framework, log marginal density ratio conversion is implemented to achieve high-quality SVM detection.
Farnaaz et al. [25] constructed a model for an intrusion detection system using a random forest (RF)-based classifier. The RF algorithm is used to detect four types of attacks: denial of service (DoS), probe, U2R, and R2L attacks. Cross-validation is adopted to achieve accurate classification, and a feature selection algorithm is applied to the dataset to remove redundant or irrelevant features.
Swarnkar et al. [26] proposed a novel and efficient data structure called the probability tree structure. If not found in the database in the test phase, or if the probability of packet occurrence is not found in the training phase, then the short sequence is treated as an anomaly. The possibility of an abnormal short sequence is used to generate the class label for the test packet. Some intelligence algorithms are utilized to optimize the parameters of machine techniques for feature selection or feature weighting in network intrusions. In this regard, Yang et al. [27] presented a modified naïve Bayes algorithm based on the artificial bee population algorithm.
For the search strategy, Khammassi et al. [28] applied a wrapper method based on a genetic algorithm, whereas for the learning algorithm for network intrusion detection, they used a method that selects the best subset of functions by applying logistic regression.
Caminero et al. [29] first applied hostile reinforcement learning to intrusion detection and proposed a novel technique that integrates the behavior of the environment into the learning process of the modified reinforcement learning algorithm. The researchers demonstrated that the proposed algorithm is appropriate for supervised learning based on labeled datasets and verified its performance through comparisons with other well-known machine learning models for two datasets.
To identify a variety of unauthorized use, misuse, and abuse of computer systems, Liu et al. [30] proposed an adaptive network intrusion detection technique based on the selective ensemble of a kernel extreme learning machine with random functions.
Handling redundant or irrelevant features in high-dimensional datasets has been a long-term challenge in network anomaly detection. Removing these features through spectral information not only speeds up the classification process but also helps classifiers make accurate decisions during instances of attack recognition.
Salo et al. [31] proposed a new hybrid dimension reduction technique, namely the principal component analysis–ensemble technique, using an ensemble classifier based on information gain, an SVM, an instance-based learning algorithm, and a multi-layer perceptron.
Divyasree et al. [32] proposed an efficient intrusion detection system using the ensemble core vector machine (CVM) method. The CVM algorithm, which is based on the minimum enclosing ball concept, detects attacks such as U2R, R2L, probe, and DoS attacks. CVM classifiers are modeled for each type of attack; chi-square tests are used to select the relevant function for each attack, and the functions are weighted for dimension reduction.
Al-Jarrah et al. [33] presented a semi-supervised multi-layer clustering (SMLC) model for network intrusion detection and prevention. SMLC, which achieves a detection performance similar to that of the supervised ML-based intrusion detection system (IDS) intrusion prevention system (IPS), performs learning using partially classified data. SMLC’s performance is identical to those of algorithms that make up the layers of the well-known semi-supervised model (tri-training) and the supervised RF, bagging, and AdaboostM1 machine learning models.
Hady et al. [34] built a real-time testbed to monitor patient biometrics and collect network flow metrics. They combined network flow data with a patient’s biometric data to improve system performance and used it as a training dataset. The proposed system improved the area under curve (AUC) by up to 25%. The aforementioned system used four machine learning methods: RF, K-nearest neighbors, SVM, and artificial neural network.
Gao et al. [35] developed a feature set specifically for implanted medical devices and conducted experiments to test the performance of different learning algorithms including decision tree, SVM, and K-means algorithms. The study showed that decision-tree based algorithms achieved the highest detection accuracy, low false-positive rate, and fast training and prediction speed compared with other algorithms. In addition, several other researchers discussed intrusion detection from different perspectives, including distributed DoS attacks, deep packet inspection, emotion classification, and network sub-slicing [36–39].
In this paper, we demonstrated that a model created using machine learning based on extracting actual data from the hospital environment can respond to the security threats of IoT medical devices, which are otherwise difficult to manage. Moreover, it is useful to classify detailed risks to enable greater focus on serious events in an IoT medical device mass produced from heterogeneous medical devices, as it shows that it is possible to classify threats of four labels beyond simple binary classification with high accuracy.
In summary, existing studies demonstrated that machine learning is a good approach to support network intrusion detection in communication and distributed infrastructure. Thus, this paper presents an M-IDM to respond to the security threats of IoT medical devices, which are difficult to manage, through a model trained by extracting actual data from the hospital environment. The proposed model shows that it is possible to classify threats of four labels beyond simple binary classification with high accuracy.
3 Multi-Class Intrusion Classification Model (M-IDM)
The proposed security model M-IDM relies on the concept of intrusion classification in which a machine learning model is trained over the baseline dataset to classify the anomaly behaviors from legitimate ones. Unlike existing studies, the proposed M-IDM uses the actual healthcare IoT environment of the National Cancer Center, South Korea, and actual network data from real medical devices, such as a patient’s monitor, including electrocardiogram and thermometers. Moreover, it employs convolutional neural network (CNN), which exhibits better performance compared with conventional machine learning algorithms such as naïve Bayes and SVM, to classify the data into multiple classes (critical, informal, major, and minor) for intrusion detection. This section describes the architectural design overview of the M-IDM, including major module data description, data preprocessing, and service scenario.
3.1 Proposed Model Architecture
The architectural design overview of the proposed M-IDM is shown in Fig. 2. It consists of five stages: Input data, preprocessing, feature extraction, classification, and output.
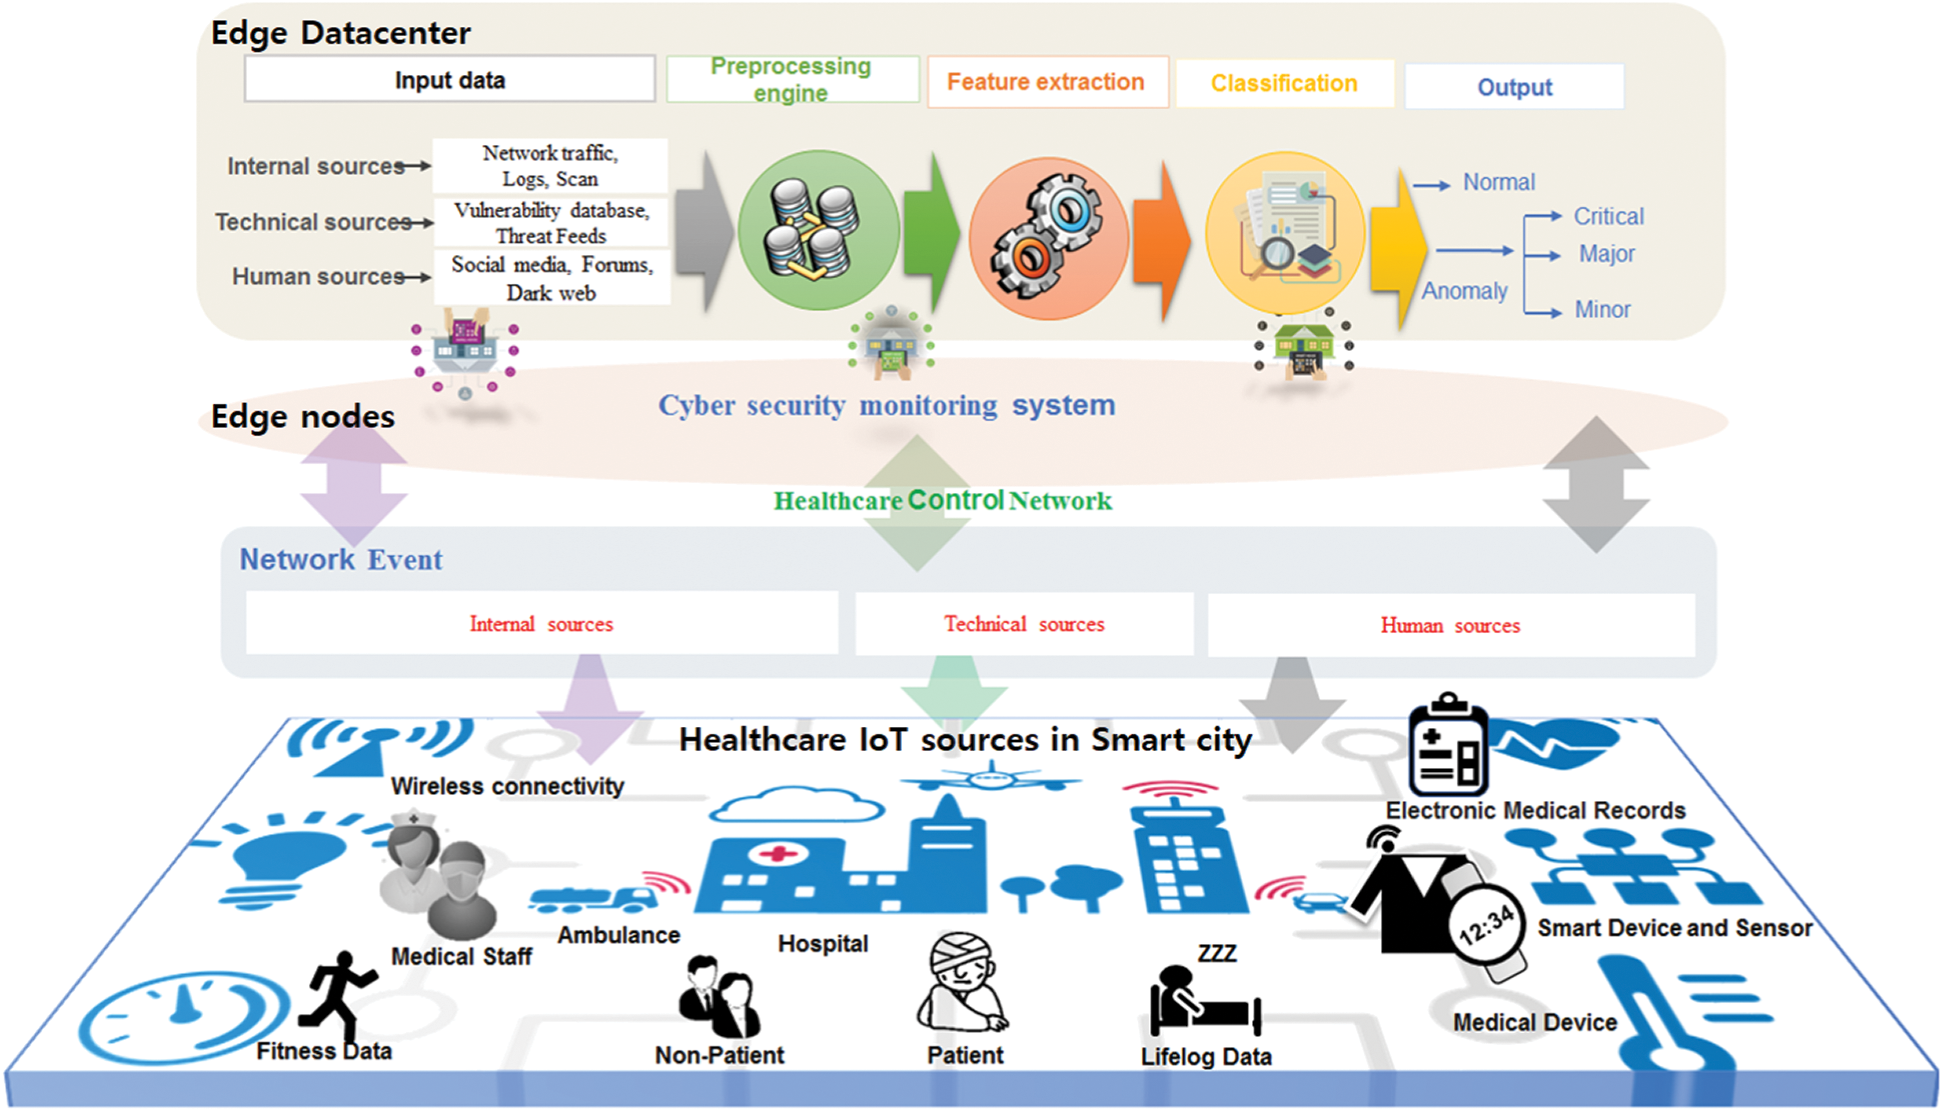
Figure 2: Overview of proposed model architecture
During the input stage, raw data is accumulated, which includes network traffic, logs, scan from internal medical sources, vulnerability database, threat feeds from technical sources, social media, forums, and dark web from human sources. Preprocessing eliminates some inappropriate, multifunctional, or noisy data that might be present in subsequent raw data. The feature extraction component provides extraction and specification of the relevant features, including network security event data such as the IP, port, protocol, and severity from heterogeneous medical devices to support security threat classification in the healthcare IoT environment. The classification module is responsible for creating a trained model with relevant features from the preprocessed data. It uses various machine learning algorithms for classification purposes.
Here, the processed data is divided into training and test data. The classification model is trained using only the training data. The trained model is then repeatedly validated using the validation data. The process either proceeds to the next stage or corrects the parameters, learning method, etc., based on the validation results, and training is repeated. The model is completed through this process. In the output stage, the actual values are input into the model completed in the previous stage to confirm the classification. The classes are normal and anomaly (critical, major, minor).
The proposed M-IDM architecture uses the actual healthcare IoT environment of National Cancer Center, South Korea, and actual network data from real medical devices, unlike previous studies. The dataset was collected from a total of six medical devices with the same IP band, such as a patient’s monitor, an electrocardiogram, a thermometer, a sphygmomanometer, a hygrometer, and a fall prevention bed with an alarm watch, which is used in an isolated internal-medical-device-only wireless network. There is a network tab device configured using the mirror method for transmitting and receiving all traffic between the medical IoT device and gateway. We obtained monthly logs of all traffic going through this firewall to the gateway. Out of the 300,000 cases collected (12 months), 100,000 cases (4 months, approximately 833/day) were selected in an even distribution. For the data label, four risk labels defined in the firewall were used: Normal, critical, major, and minor.
The network event data consists of 11 features: one target variable and ten explanatory variables for machine learning, as listed in Tab. 1. The target variable is the severity classification value of each event, that is, normal, critical, major, and minor. The type of source/destination IP refers to the type of IP that attempts to access or receive access from the device, that is, private-internal, public-external. The date variable was recorded as year, month, day, hour, and second based on when the event was created. Flag is used in the TCP flag, that is, URG, ACK, PSH, RST, SYN, and FIN.
Table 1: Variable descriptions

There are two types of dataset attributes in the proposed M-IDM: Symbolic and numeric. The data set attribute is numeric. However, the data of symbolic properties cannot be directly processed. Thus, it is necessary to convert symbolic data to numeric data. Tab. 2 lists symbolic attributes and their associated values. In the table, the two redefined attributes “Working hour” and “Type of source/destination IP” have a value of 0 or 1; in this case, these can be processed in the same way as the numeric attribute. Furthermore, “Protocol” and “Flag” attributes were converted as a sequence of integers, that is, Protocol: 1–17, Flag: 1–6, after being represented as on-hot vector.
Table 2: Symbolic attributes and their associated values

The protocol attribute has 17 unique values; similarly, the flag attribute is defined with 6 unique values. Many approaches have been proposed for handling symbolic attributes. In an experiment conducted as part of this study, we employed a method that uses conditional probability and dummy indicator variables to process protocol and flag properties [40,41]. However, using only this method increases the dimension of the dataset; thus, we clustered similar types in symbolic attributes. In Tabs. 2 and 3, it can be observed that the dimension is reduced by clustering into different classes for different protocol properties. The study in [42] also performed clustering into a similar type of symbolic attribute. Then, we converted these classes into indicator variables as presented in Tabs. 3 and 4. Data scaling was performed because normalized data is required to perform classification.
Table 3: Clustering of protocol attribute

Table 4: Clustering of flag attribute

In this experimental evaluation of the proposed M-IDM architecture, the selected data (i.e., 100,000 cases or instances) were randomly sampled and divided into training or labeled data and testing or unlabeled data. The ratio of training and testing dataset was 90:10, where 90% (i.e., 90,000 instances) is training data and the remaining 10% (i.e., 10,000) is testing data.
This section describes the service scenario of the proposed M-IDM, which classifies the security event data into classes of “normal” or “anomaly (critical, major, minor).” Fig. 3 shows a schematic diagram of the service scenario for the proposed model. This section describes details of the procedures for each stage from ➀ to ➃.
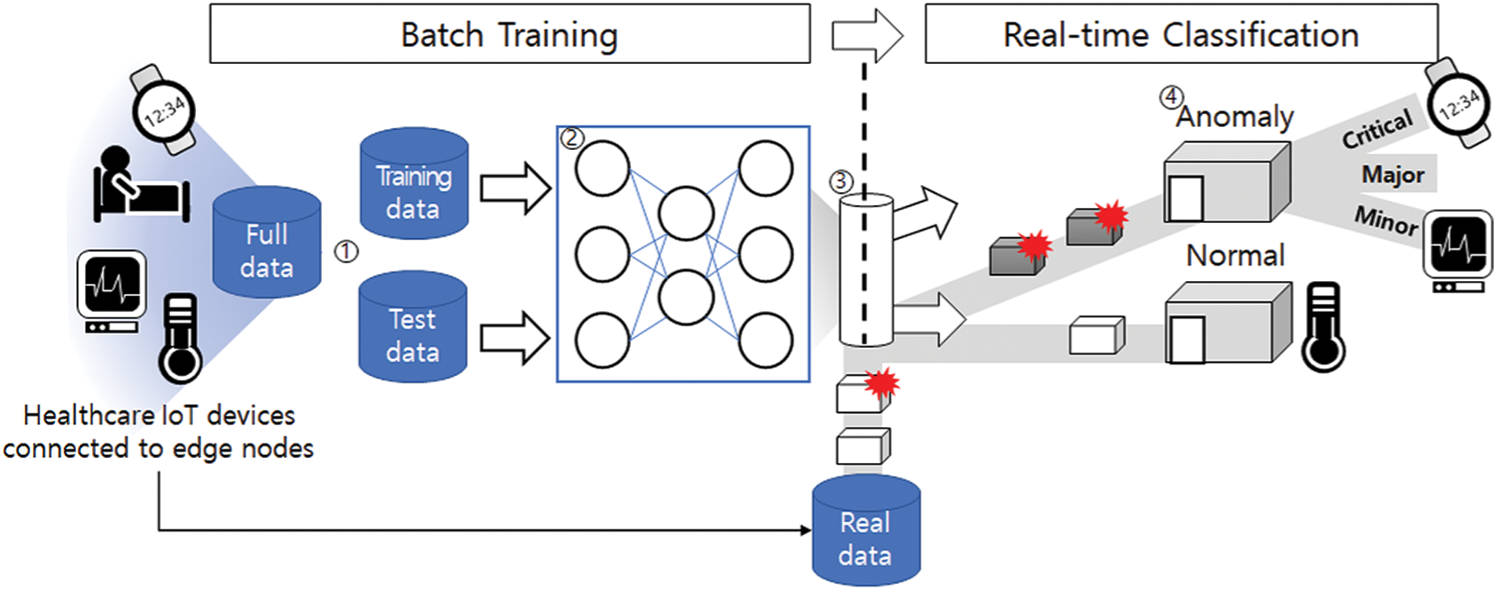
Figure 3: Service scenario of proposed M-IDM model
The details of the service scenario are as follows:
➀ Data separation: All security event data collected on the healthcare network are randomly sampled and divided into training and test data. The separated data are used to generate the model through learning and to validate the reliability of the model.
➁ Model training: The learning algorithm is selected considering various conditions; then, the parameters are adjusted according to the algorithm and learning is performed using only the training data from the data separated in ➀. After assessing the precision of the learning model using the test data, this process is repeated by applying different parameters and algorithms and other methods until the desired result is obtained. The processes in ➀ and ➁ are performed in batch form.
➂ Real-time classification 1: The model generated in ➁ is applied to the classifier; then, the real IoT medical devices network security event data (the real data do not overlap with the data in ➀) are input in real-time. The input data are first classified as “normal” or “anomaly” using a trained model that is not based on rules.
➃ Real-time classification 2: The IoT medical devices security event data classified as “anomaly” in ➂ are further classified as “critical,” “major,” or “minor.” The processes in ➂ and ➃ are performed in real-time.
4 Experiment and Performance Evaluation
In this study, we experimentally evaluated the performance of the proposed M-IDM, which was developed by employing CNN algorithms in Python 3.7.0 environment with orange. We selected a CNN by validating its classification performance and those of conventional machine learning algorithms such as naïve Bayes and SVM. The CNN has the structure:  , where the weights and bias parameters are
  for the Conv layer,
  for the fully connected layer, and
  for the output layer. We set other training parameters (i.e., learning rate, no. of epochs, number of iterations) as 0.5, 1, and 1500, respectively.
The specifications of the PC used for the experimental setup are as follows: CPU i7-8700 3.2 GHz, memory 8 GB, and graphic card RTX 2060 4 GB. Several standard measures, such as precision, recall, area under the receiver operating characteristic curve (AUC), and F1-score were used.
4.1 Effect of Number of Instances
To achieve an objective comparison of the proposed algorithm against existing conventional algorithms, the precision, recall, AUC, and F1-score [43–45] were investigated for different number of instances. When using the same data (sampling type: 10-fold cross-validation, target class: average over classes), the CNN exhibited the best performance in all items for all the number of instances, as presented in Tab. 5.
Table 5: Performance of machine learning methods for different number of instances

— M-IDM (activation: ReLu, hidden layer: 100, maximal number of iterations: 200, regulation  : 0.0001, optimizer: Adam)
— Logistic regression (regulation type: ridge, strength:  )
)
— SVM (cost: 1.0, regression loss epsilon: 0.1, iteration limit: 100).
Excluding the SVM in which the precision was significantly reduced, the naïve Bayes and logistic regression approaches ( ,000) both yielded AUCs of at least 0.932. Tab. 6 presents the detailed classification results for each class. The prediction rate for each class of the M-IDM, which exhibited the best performance (
 ,000), was confirmed using a confusion matrix. According to the results, the “major” class had a relatively low prediction rate of 87.7% compared with the other classes (with prediction rates of 94.3%–98.8%).
Table 6: Proportions of predictions obtained using M-IDM

Figs. 4 and 5 also show the AUC for each machine learning method for the same data ( ,000). Compared with other ML methods, the proposed method showed better performance for each class. In particular, the SVM showed a large deviation of 0.5 (more or less) for each label. The threshold for each method and label was set to 0.5.
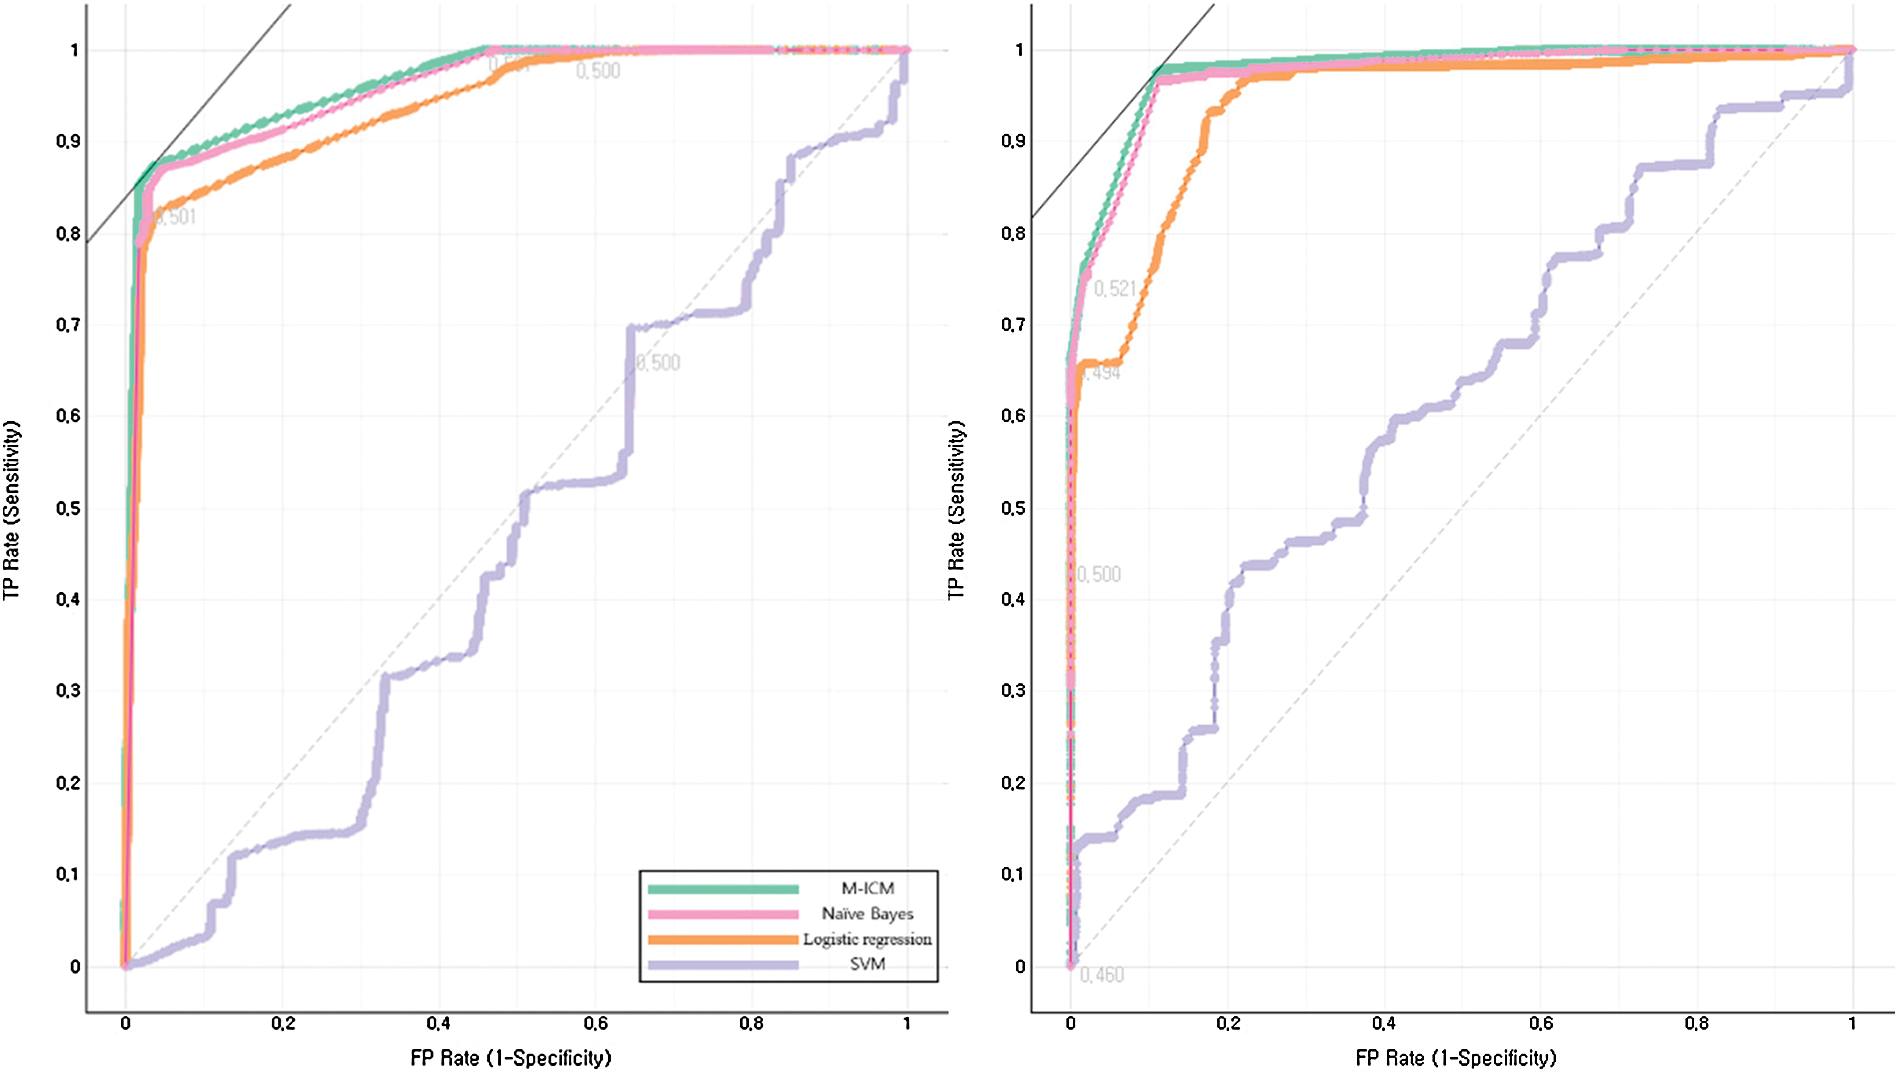
Figure 4: Machine learning method-specific AUC for four labels (normal, critical)

Figure 5: Machine learning method-specific AUC for four labels (major, minor)
This section describes the effect of the number of labels on the prediction. The same data and conditions were used in these tests as those used for the M-IDM algorithm ( ), which exhibited the best performance, as presented in Section 4.1. The accuracy for each label was confirmed as the number of labels was increased from two to four. Fig. 6 shows the accuracy of each algorithm in terms of predicting a certain label based on the number of classes.

Figure 6: Prediction rate by label
The following rates were observed: Anomaly 99.3% and normal 94.4% at two classes; critical 93.5%,  85.3%, and informal 95.9% at three classes; and critical 98.6%, major 87.7%, minor 97.7%, and informal 94.3% at four classes.
All the algorithms showed good accuracy of 85.3%–99.3%. At four classes, the accuracy by class ranged from 87.7% to 98.6%, where “major” had a relatively low accuracy of 87.7% compared with the other classes.
We compared the findings of this study with those obtained in existing studies based on various aspects. Tab. 7 summarizes the result of the comparison based on 10 aspects of methodology, number of feature/record/class/hidden layers, minimum/maximum AUC, verification, data source, number of device types, and detection range. In Tab. 7, “Methodology” indicates the main method used in this study, and “Number of feature/record/class/hidden layers” indicates basic information of data or learning model. Furthermore, “Min/Max AUC” denotes the method used to perform model learning. “Validation” is a job confirming that the result of a learning model have enough fidelity. “Data source” is the environment from which the data was extracted, and “Number of device types” is the number of devices used to generate training data. “Detection range” indicates the range of detection from sensor to server.

In existing studies, binary classification is mainly used and only simple classification is possible. Moreover, because the number of devices used for data acquisition and generation is from a testbed, it is difficult to reflect the characteristics that occur in a mixed environment of heterogeneous devices. However, this study classifies various classes while considering the constraints of the IoT environment by acquiring traffic logs that multiple actual IoT medical devices communicate with and learning from the data an environment in which heterogeneous IoT medical devices are mixed.
We evaluated the complexity across the proposed model. As shown in Fig. 7, we observed the average of the calculation resources (CPU and memory) for each data size. As the data volume increased, more average calculation resources were required. Additionally, the ratio of data growth and computational resource use was compared. When the volume of data doubled, the average computational resource usage increased by up to a factor of 1.3, and when the data volume increased by five times, it increased by up to a factor of 1.8. Therefore, it can be observed that the computational overhead of the proposed model is not a significant problem.

Figure 7: Computational complexity of the proposed model
In this study, we proposed a multi-class security event classification model based on machine learning. The proposed model was built using real-world data and neural network-based multi-class intrusion classification algorithm for four classes. This work sufficiently reflects the complex network flow and characteristics of a real healthcare IoT environment, and machine learning technology was applied using data from real devices to classify network events into four different classes. In future work, more meaningful features should be found in security event data before refining to enhance the performance of the proposed approach, and methods should be developed to improve the somewhat low accuracy for rare classes to address the problem of data imbalance between the classes.
Funding Statement: This research was supported by a grant of the Korea Health Technology R&D Project through the Korea Health Industry Development Institute (KHIDI), funded by the Ministry of Health & Welfare, Republic of Korea (Grant No. HI19C0839).
Conflicts of Interest: The authors declare that there is no conflict of interests to report regarding the present study.
1. J. H. Park, M. M. Salim, J. H. Jo, J. C. S. Sicato, S. Rathore et al. (2019). , “Ciot-net: A scalable cognitive iot based smart city network architecture,” Human-centric Computing and Information Sciences, vol. 9, no. 29, pp. 1–20. [Google Scholar]
2. S. Sengan, V. Subramaniyaswamy, S. K. Nair, V. Indragandhi, J. Manikandan et al. (2020). , “Enhancing cyber-physical systems with hybrid smart city cyber security architecture for secure public data-smart network,” Future Generation Computer Systems, vol. 112, pp. 724–737. [Google Scholar]
3. D. T. Ramotsoela, G. P. Hancke and A. M. Abu-Mahfouz. (2019). “Attack detection in water distribution systems using machine learning,” Human-Centric Computing and Information Sciences, vol. 9, no. 13, pp. 1–22. [Google Scholar]
4. A. Nieto and R. Rios. (2020). “Cybersecurity profiles based on human-centric IoT devices,” Human-Centric Computing and Information Sciences, vol. 9, no. 39, pp. 1– 23. [Google Scholar]
5. Y. Sun, Y. Yuan, Q. Wang, L. Wang, E. Li et al. (2019). , “Research on the signal reconstruction of the phased array structural health monitoring based using the basis pursuit algorithm,” Computers, Materials & Continua, vol. 58, no. 2, pp. 409–420. [Google Scholar]
6. J. Liu, J. Li, Y. Chen, X. Zou, J. Cheng et al. (2019). , “A robust zero-watermarking based on sift-dct for medical images in the encrypted domain,” Computers, Materials & Continua, vol. 61, no. 1, pp. 363–378. [Google Scholar]
7. M. Zou, J. Hu, H. Zhang, X. Wu, J. He et al. (2019). , “Rigid medical image registration using learning-based interest points and features,” Computers, Materials & Continua, vol. 60, no. 2, pp. 511–525. [Google Scholar]
8. K. M. Awan, N. Ashraf, M. Q. Saleem, O. E. Sheta, K. N. Qureshi et al. (2019). , “A priority-based congestion-avoidance routing protocol using IoT-based heterogeneous medical sensors for energy efficiency in healthcare wireless body area networks,” International Journal of Distributed Sensor Networks, vol. 15, no. 6, pp. 1–16. [Google Scholar]
9. M. A. Habib, C. N. Faisal, S. Sarwar, M. A. Latif, F. Aadil et al. (2019). , “Privacy-based medical data protection against internal security threats in heterogeneous internet of medical things,” International Journal of Distributed Sensor Networks, vol. 15, no. 9, pp. 1–12. [Google Scholar]
10. C. Zhang, F. Chen, J. Yang, J. Zhu, Z. Zhang et al. (2017). , “Heterogeneous component model for architecture of community medical internet of things,” Lecture Notes of the Institute for Computer Sciences, Social Informatics and Telecommunications Engineering, vol. 202, pp. 140–151. [Google Scholar]
11. X. Cheng, Z. Zhang, F. Chen, C. Zhao, T. Wang et al. (2019). , “Secure identity authentication of community medical Internet of Things,” IEEE Access, vol. 7, pp. 115966–115977. [Google Scholar]
12. S. Rathore and J. H. Park. (2018). “Semi-supervised learning based distributed attack detection framework for IoT,” Applied Soft Computing, vol. 72, pp. 79–89. [Google Scholar]
13. Y. H. Lee, H. Ahn, H. B. Ahn and S. Y. Lee. (2019). “Visual object detection and tracking using analytical learning approach of validity level,” Intelligent Automation and Soft Computing, vol. 25, no. 1, pp. 205–215. [Google Scholar]
14. S. Rathore, B. W. Kwon and J. H. Park. (2019). “Blockseciotnet: Blockchain-based decentralized security architecture for IoT network,” Journal of Network and Computer Applications, vol. 143, pp. 167–177. [Google Scholar]
15. H. C. Chen and S. S. Kuo. (2019). “Active detecting ddos attack approach based on entropy measurement for the next generation instant messaging app on smartphones,” Intelligent Automation and Soft Computing, vol. 25, no. 1, pp. 217–228. [Google Scholar]
16. N. Y. Kim, S. Rathore, J. H. Ryu, J. H. Park and J. H. Park. (2018). “A survey on cyber physical system security for IoT: Issues, challenges, threats, solutions,” Journal of Information Processing Systems, vol. 14, no. 6, pp. 1361–1384. [Google Scholar]
17. M. Liu, L. Cheng, K. Qian, J. Wang, J. Wang et al. (2020). , “Indoor acoustic localization: A survey,” Human-Centric Computing and Information Sciences, vol. 10, no. 2, pp. 1–24. [Google Scholar]
18. J. Wang, X. Gu, W. Liu, A. K. Sangaiah and H. J. Kim. (2019). “An empower hamilton loop based data collection algorithm with mobile agent for WSNs,” Human-Centric Computing and Information Sciences, vol. 9, no. 1, pp. 1–14. [Google Scholar]
19. S. Rathore, Y. Pan and J. H. Park. (2019). “Blockdeepnet: A blockchain-based secure deep learning for IoT network,” Sustainability, vol. 11, no. 14, pp. 1–15. [Google Scholar]
20. A. L. Buczak and E. Guven. (2016). “A survey of data mining and machine learning methods for cyber security intrusion detection,” IEEE Communications Surveys & Tutorials, vol. 18, no. 2, pp. 1153–1176. [Google Scholar]
21. U. Tariq. (2019). “Intrusion detection and anticipation system (idas) for ieee 802.15.4 devices,” Intelligent Automation and Soft Computing, vol. 25, no. 2, pp. 231–242. [Google Scholar]
22. M. Fredrikson, J. Somesh and R. Thomas. (2015). “Model inversion attacks that exploit confidence information and basic countermeasures,” in Proc. SIGSAC, Denver, Colorado, USA, pp. 1322–1333. [Google Scholar]
23. E. Kabir, J. Hu, H. Wang and G. Zhuo. (2018). “A novel statistical technique for intrusion detection systems,” Future Generation Computer Systems, vol. 79, pp. 303–318. [Google Scholar]
24. H. Wang, G. Jie. and W. Shanshan. (2017). “An effective intrusion detection framework based on SVM with feature augmentation,” Knowledge-Based Systems, vol. 136, pp. 130–139. [Google Scholar]
25. N. Farnaaz and M. A. Jabbar. (2016). “Random forest modeling for network intrusion detection system,” Computer Science, vol. 89, no. 1, pp. 213–217. [Google Scholar]
26. M. Swarnkar and N. Hubballi. (2016). “OCPAD: One class naive bayes classifier for payload based anomaly detection,” Expert Systems with Applications, vol. 64, pp. 330–339. [Google Scholar]
27. L. Yang, C. Ding, M. Wu and K. Wang. (2017). “Robust detection of false data injection attacks for data aggregation in an internet of things-based environmental surveillance,” Computer Networks, vol. 129, pp. 410–428. [Google Scholar]
28. C. Khammassi and S. Krichen. (2017). “A GA-LR wrapper approach for feature selection in network intrusion detection,” Computers & Security, vol. 70, pp. 255–277. [Google Scholar]
29. G. Caminero, M. Lopez-Martin and B. Carro. (2019). “Adversarial environment reinforcement learning algorithm for intrusion detection,” Computer Networks, vol. 159, pp. 96–109. [Google Scholar]
30. J. Liu, J. He, W. Zhang, T. Ma, Z. Tang et al. (2019). , “Anid-SEoKELM: Adaptive network intrusion detection based on selective ensemble of kernel elms with random features,” Knowledge-Based Systems, vol. 177, pp. 104–116. [Google Scholar]
31. F. Salo, A. B. Nassif and A. Essex. (2019). “Dimensionality reduction with IG-PCA and ensemble classifier for network intrusion detection,” Computer Networks, vol. 148, pp. 164–175. [Google Scholar]
32. T. H. Divyasree and K. K. Sherly. (2018). “A network intrusion detection system based on ensemble CVM using efficient feature selection approach,” Computer Science, vol. 143, pp. 442–449. [Google Scholar]
33. O. Y. Al-Jarrah, Y. Al-Hammdi, P. D. Yoo, S. Muhaidat and M. Al-Qutayri. (2018). “Semi-supervised multi-layered clustering model for intrusion detection,” Digital Communications and Networks, vol. 4, no. 4, pp. 277–286. [Google Scholar]
34. A. A. Hady, A. Ghubaish, T. Salman, D. Unal and R. Jain. (2020). “Intrusion detection system for healthcare systems using medical and network data: A comparison study,” IEEE Access, vol. 8, pp. 106576–106584. [Google Scholar]
35. S. Gao and G. Thamilarasu. (2017). “Machine-learning classifiers for security in connected medical evices,” in Proc. ICCCN, Vancouver, Canada, pp. 1–5. [Google Scholar]
36. I. Alrashdi, A. Alqazzaz, E. Aloufi, R. Alharthi, M. Zohdy et al. (2019). , “Ad-iot: Anomaly detection of iot cyberattacks in smart city using machine learning,” in Proc. CCWC, University of Nevada, Las Vegas, NV, USA, pp. 305–310. [Google Scholar]
37. A. F. Oliva, F. M. Perez, J. V. Berna-Martinez and M. A. Ortega. (2019). “Non-deterministic outlier detection method based on the variable precision rough set model,” Computer Systems Science and Engineering, vol. 34, no. 3, pp. 131–144. [Google Scholar]
38. M. B. Nejad and M. E. Shiri. (2019). “A new enhanced learning approach to automatic image classification based on salp swarm algorithm,” Computer Systems Science and Engineering, vol. 34, no. 2, pp. 91–100. [Google Scholar]
39. S. K. Singh, M. M. Salim, J. Cha, Y. Pan and J. H. Park. (2020). “Machine learning-based network sub-slicing framework in a sustainable 5G environment,” Sustainability, vol. 12, no. 15, pp. 1–22. [Google Scholar]
40. D. W. Aha, D. Kibler and M. K. Albert. (1991). “Instance-based learning algorithms,” Machine Learning, vol. 6, no. 1, pp. 37–66. [Google Scholar]
41. M. H. Kutner, C. J. Nachtsheim, J. Neter and W. Li. (2005). Regression models for quantitative and qualitative predictors. in Applied Linear Statistical Models, 5 ed. New York, USA: McGraw-Hill Irwin, pp. 313–324. [Google Scholar]
42. E. Hernández-Pereira, J. A. Suárez-Romero, O. Fontenla-Romero and A. Alonso-Betanzos. (2009). “Conversion methods for symbolic features: A comparison applied to an intrusion detection problem,” Expert Systems with Applications, vol. 36, no. 7, pp. 10612–10617. [Google Scholar]
43. C. Yin, B. Zhou, Z. Yin and J. Wang. (2019). “Local privacy protection classification based on human-centric computing,” Human-Centric Computing and Information Sciences, vol. 9, no. 1, pp. 1–14. [Google Scholar]
44. Y. S. Jeong and J. H. Park. (2019). “Learning algorithms in ai system and services,” Journal of Information Processing Systems, vol. 15, no. 5, pp. 1029–1035. [Google Scholar]
45. B. V. Santhosh Krishna and T. Gnanasekaran. (2019). “Retinal vessel extraction framework using modified adaboost extreme learning machine,” Computers, Materials & Continua, vol. 60, no. 3, pp. 855–869. [Google Scholar]
 | This work is licensed under a Creative Commons Attribution 4.0 International License, which permits unrestricted use, distribution, and reproduction in any medium, provided the original work is properly cited. |