DOI:10.32604/cmc.2021.014863
| Computers, Materials & Continua DOI:10.32604/cmc.2021.014863 | |
| Article |
Statistical Medical Pattern Recognition for Body Composition Data Using Bioelectrical Impedance Analyzer
1Stefan cel Mare University of Suceava, Suceava, 720229, Romania
2The Interdisciplinary Research Center for Human Motricity and Health Sciences, Suceava, 720229, Romania
3College of Computer Science and Information Technology, University of Anbar, Ramadi, 31001, Iraq
4College of Agriculture, Al-Muthanna University, Samawah, 66001, Iraq
*Corresponding Author: Florin Valentin Leuciuc. Email: florin.leuciuc@usm.ro
Received: 22 October 2020; Accepted: 07 December 2020
Abstract: Identifying patterns, recognition systems, prediction methods, and detection methods is a major challenge in solving different medical issues. Few categories of devices for personal and professional assessment of body composition are available. Bioelectrical impedance analyzer is a simple, safe, affordable, mobile, non-invasive, and less expensive alternative device for body composition assessment. Identifying the body composition pattern of different groups with varying age and gender is a major challenge in defining an optimal level because of the body shape, body mass, energy requirements, physical fitness, health status, and metabolic profile. Thus, this research aims to identify the statistical medical pattern recognition of body composition data by using a bioelectrical impedance analyzer. In previous studies, a pattern was identified for four indicators that concern body composition (e.g., body mass index (BMI), body fat, muscle mass, and total body water). The novelty of our study is the fact that we identified a recognition pattern by using medical statistical methods for a body composition that contains seven indicators (e.g., body fat, visceral fat, BMI, muscle mass, skeletal muscle mass, sarcopenic index, and total body water). The youth that exhibited the body composition pattern identified in our study could be considered healthy. Every deviation of one or more parameters outside the margins of the pattern for body composition could be associated with health issues, and more medical investigations would be needed for a diagnosis. BIA is considered a valid and reliable device to assess body composition along with medical statistical methods to identify a pattern for body composition according to the age, gender, and other relevant parameters.
Keywords: Statistical method; pattern recognition; body composition; assessment
In recent years, people became more interested in assessing and diagnosing their health status. Nowadays, many medical devices are available, thereby allowing the assessment and screening of one’s health. Identifying patterns, recognition systems [1], prediction methods [2], detection methods [3–6], and benchmark methods [7] to solve different medical issues is a major challenge [8,9]. For body composition there are few categories of devices for personal and professional assessment: dual-energy X-ray absorptiometry (DXA), magnetic resonance imaging (MRI), and bioelectrical impedance analyzer (BIA).
DXA is used to assess the bone mineral density and body composition. The body measurement must be taken by a licensed radiological technician, and a complete scan lasts for 5 minutes [10–12]. MRI is a non-invasive technology that produces three-dimensional (3D) images for soft body tissues. This technology does not use ionizing radiation and allows the detection of changes in the protons found in the water of the human body. Special software processes the image pixels. MRI is considered a reference method for body composition assessment along with DXA [12–14].
BIA is considered a valid method for the assessment of body composition, and its reliability could be influenced by several factors, such as device, operator, subject, and environment [15]. Furthermore, it is a simpler, safer, more affordable, mobile, non-invasive, and less expensive alternative than other devices or methods used for body composition assessment [16]. BIA allows the selection of standard or athletic mode, gender, age, and height. Nevertheless, statistically significant differences are observed among BIAs because of calibration, different electric current frequencies, and different numbers of electrodes [12,17].
The novelty of this research is that we will determine the pattern recognition for body composition data by using BIA and statistical medical methods for at least seven parameters (e.g., body fat, visceral fat, body mass index (BMI), muscle mass, skeletal muscle mass, sarcopenic index, and total body water). The medical technology evolves rapidly, and new functions are available for use. However, each person is unique because although their age, height, and weight are the same, their body shapes, body composition, energy requirements, physical fitness, health status, and metabolic profiles are different. Establishing a pattern for body composition related to the age and gender is necessary.
A synaptic overview of the different devices used to assess the body composition in the analyzed studies is presented in Tab. 1.
Table 1: Previous studies that used devices to assess body composition
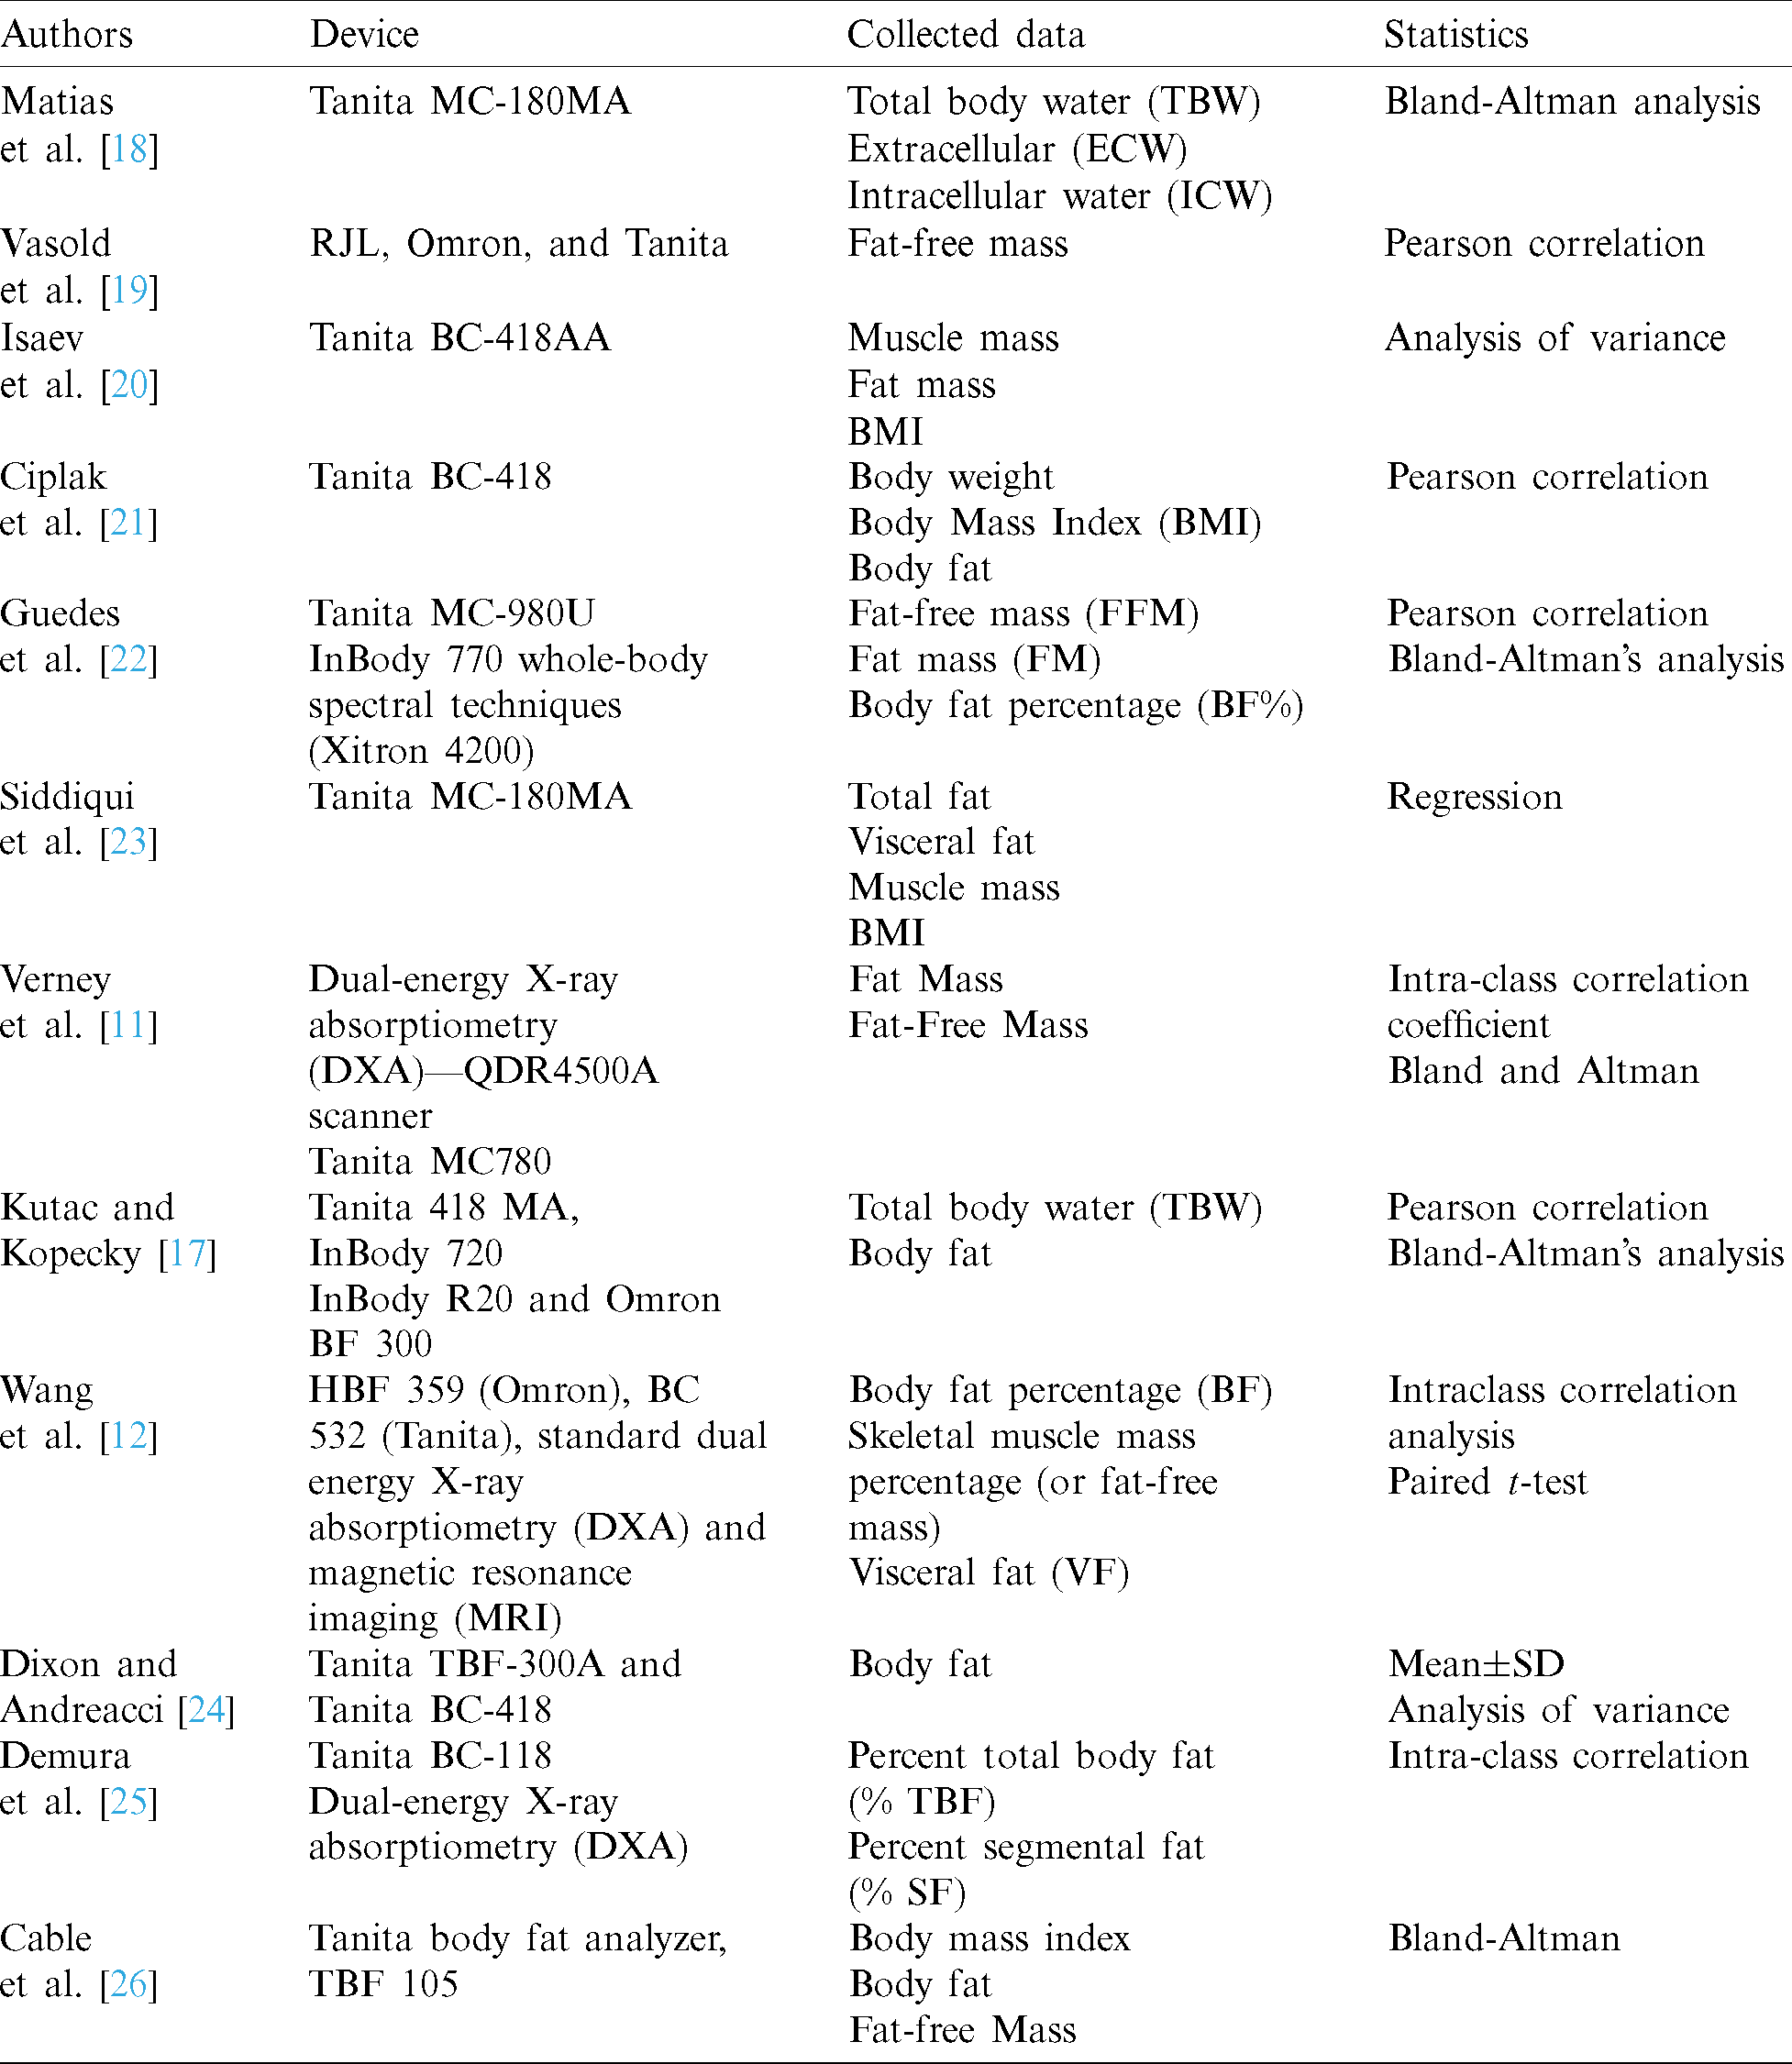
Many of the previously analyzed studies used Pearson correlation and Bland–Altman analysis, but some of them used the analysis of variance (ANOVA) and paired t-test [12,20,24].
The statistical expression for ANOVA is:


SST—
SSE—
SS(Tr)—
m—Number of samples
n—Total size of all the samples.
Finally, with previous data, determining the value of F is possible:

MS—Mean square.
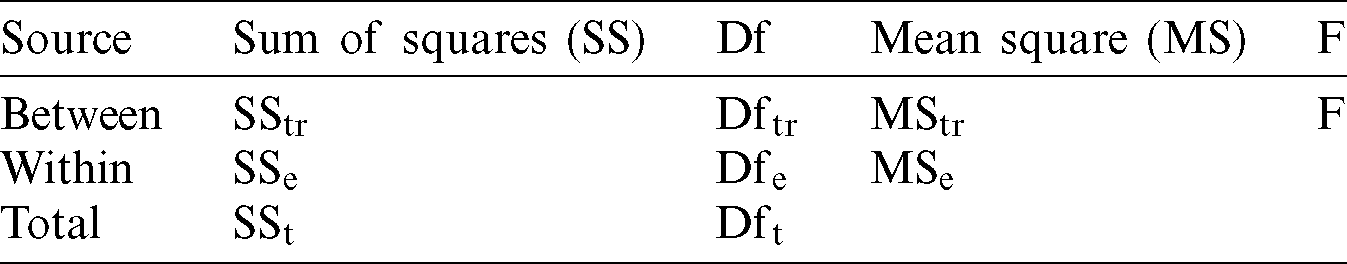
A synthetic view for all this operation to determine F by using analysis of variance (ANOVA) is shown in Tab. 2.
Table 2: Summary table of one-way ANOVA
The statistical significance of at least  is required for ANOVA and paired t-test according to the number of cases/subjects.
The paired t-test statistic value is calculated by using the following formula:

m—Mean differences
n—Sample size
s—Standard deviation.
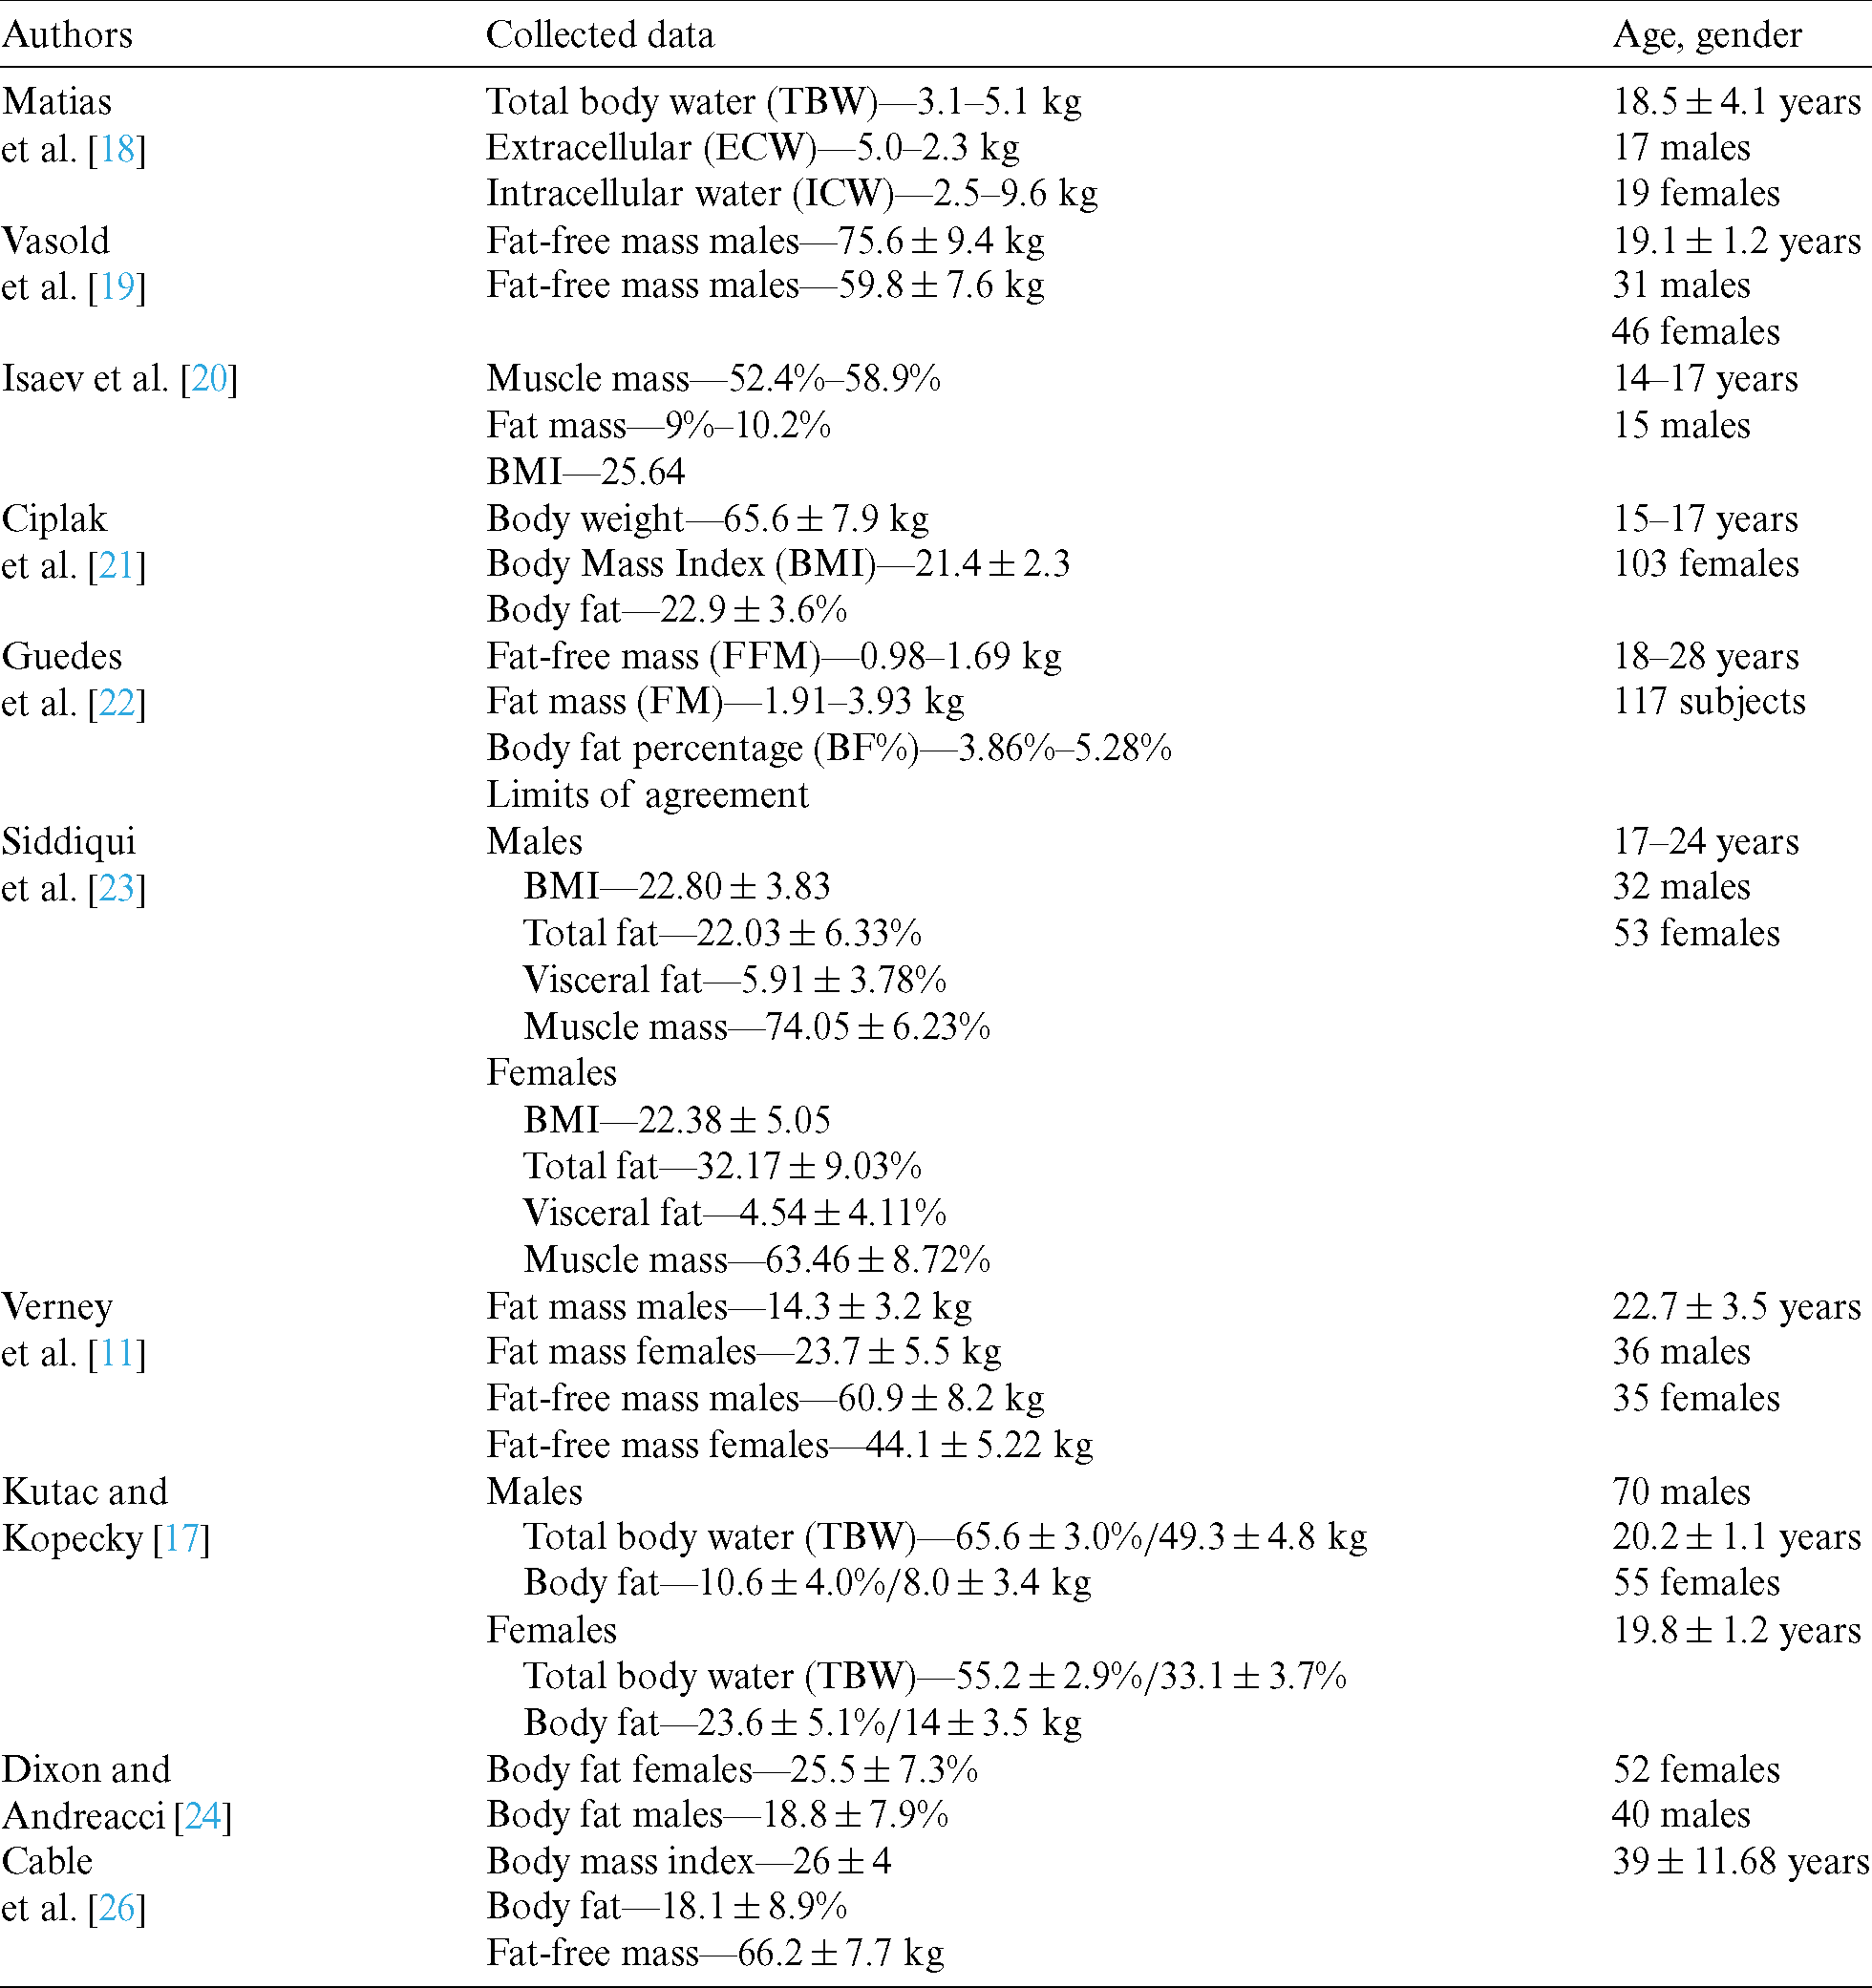
Also, these studies allow us to identify a pattern because analyzed data concerning body composition are presented in Tab. 3.
Table 3: Patterns for body composition identified by analyzing other studies
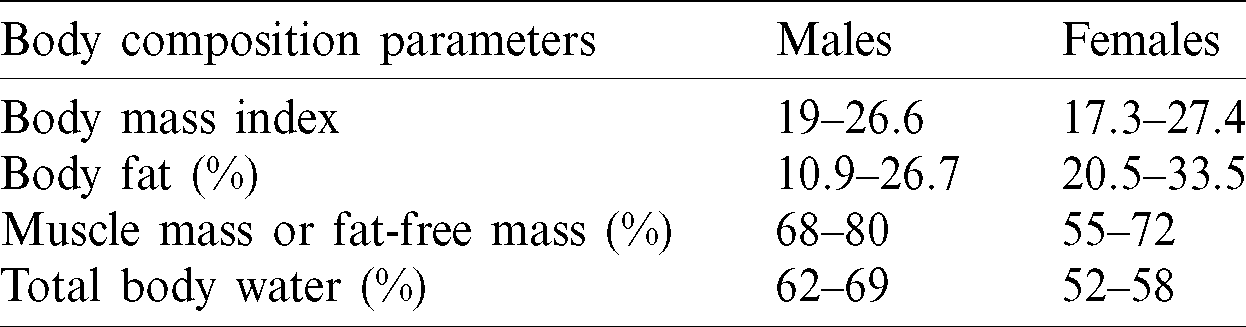
According to the data from other studies, we identified the patterns for youth by using the statistical data for body composition in Tab. 4.
Table 4: Body composition pattern for youth
Identifying the body composition pattern of individuals with different age and gender is a major challenge in defining an optimal level because of the differences in their body shape, body mass, energy requirements, physical fitness, health status, and metabolic profile. These patterns allow the identification of possible health issues or disorders very easily and encourage people to have a healthy lifestyle along with a very good quality of life.
Studies on different age categories with various numbers of subjects and genders were identified by reviewing literature concerning the topic, and their components were analyzed using different kinds of devices for body mass composition. For youth, we identified a pattern for four body composition parameters in previous studies. By using a BIA device and statistical medical methods, we aim to establish a pattern for body composition for youth that comprises more parameters to identify the healthy profile particular for that age.
This research is organized as follows. Section 2 presents the methodology. Section 3 presents the results collected by BIA and analyzed by statistical medical methods. Section 4 analyzes the results and identifies the pattern recognition for the body composition of males and females. Section 5 presents the conclusions and prospects for future work.
This research aims to identify the statistical medical pattern recognition for body composition data by using BIA.
The research subjects include students who provided written informed consent prior to the research. The protocol was approved by the University Ethic Research Committee. The body characteristics and age averages by gender are presented in Tab. 5.
Table 5: Body characteristics of the subjects
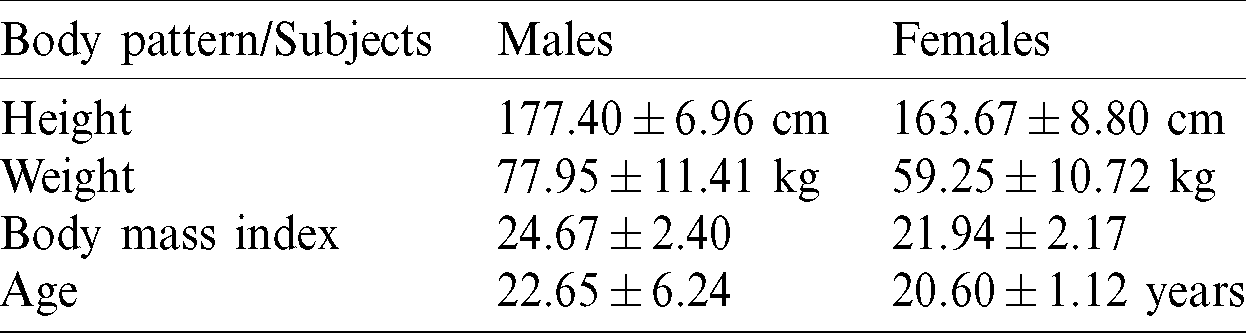
The BMI is a parameter that allows determining the body composition very easily:

The normal index must be between 18.5 and 25 points, the people who are in this range are considered to have a normal weight, and their health status is usually optimal. A point that falls below 18.5 are considered underweight, and an individual health status could be affected in this situation. Values over 25 points suggests an overweight level and over 30 corresponds to obesity, that is, the health status of an individual is deteriorating with poor effects at the physical and physiological level. Along with the health issues, the people who are in these categories (over 25 or 30) are also affected at the psychological level, because they cannot perform their daily tasks. The BMI is moderately correlated to the level of body fat [27,28].
The subjects followed four hours of physical activities according to their curricula and additional 4 to 8 hours of extracurricular physical activities weekly. The assessments were made throughout the first and in the last week of the research during the same day and at the same hour.
In this research, we used a BIA (Tanita MC-780 MA) to assess body composition with high-frequency current (50 Khz, 90  A) and eight electrodes that allow the current to flow into the upper and lower limbs (tetrapolar). All subjects in the standard mode were selected. The assessment protocol by BIA is shown in Fig. 1.
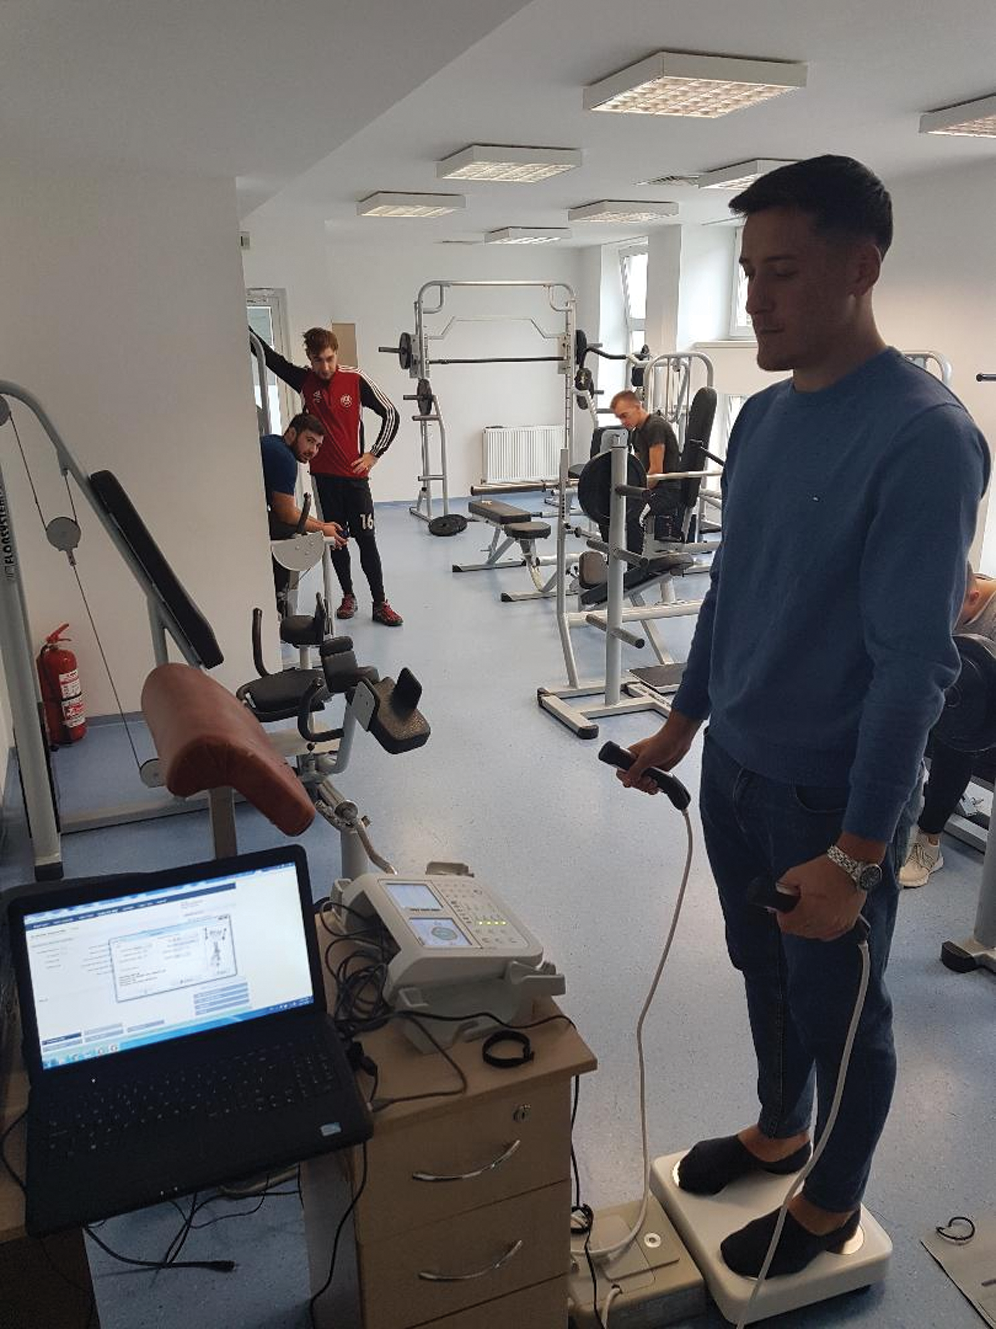
Figure 1: Assessment protocol using BIS (Tanita MC-780 MA)
The descriptive statistics, including Pearson correlation and Bland–Altman analysis, were calculated on the basis of the collected data by using IBM SPSS version 26. To achieve statistical significance, the value was set at  .
.
Pearson correlation formula was applied to determine the concordance between data sets.


 .
.
The value of r ranges between +1 and −1. If the correlation coefficient is −1, then a strong negative connection exists, and it is a perfect negative connection between the variables. If the correlation coefficient is 0, then there is no connection. If the correlation coefficient is 1, then a strong positive connection exists. A level of confidence of 95% was established by the Bland–Altman analysis, and we obtained a bias and lower and upper limits of agreement (LOA).
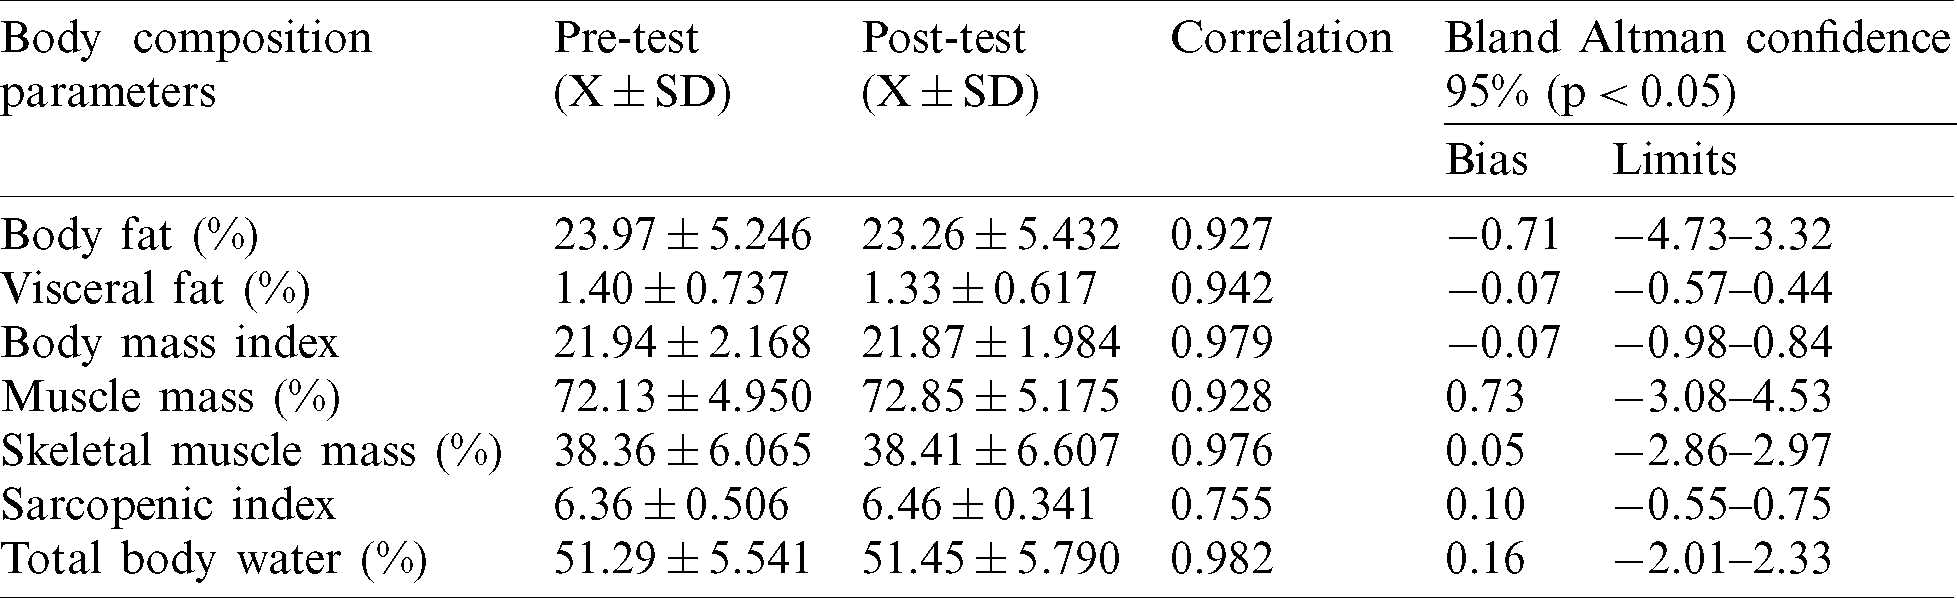
In our research, data concerning body composition (body fat, visceral fat, BMI, muscle mass, skeletal muscle mass, sarcopenic index, and total body water) were collected. The collected data were analyzed separately for each gender because differences concerning body composition are observed, as shown in Tabs. 6 and 7.
Table 6: Statistical analysis for body composition (males)
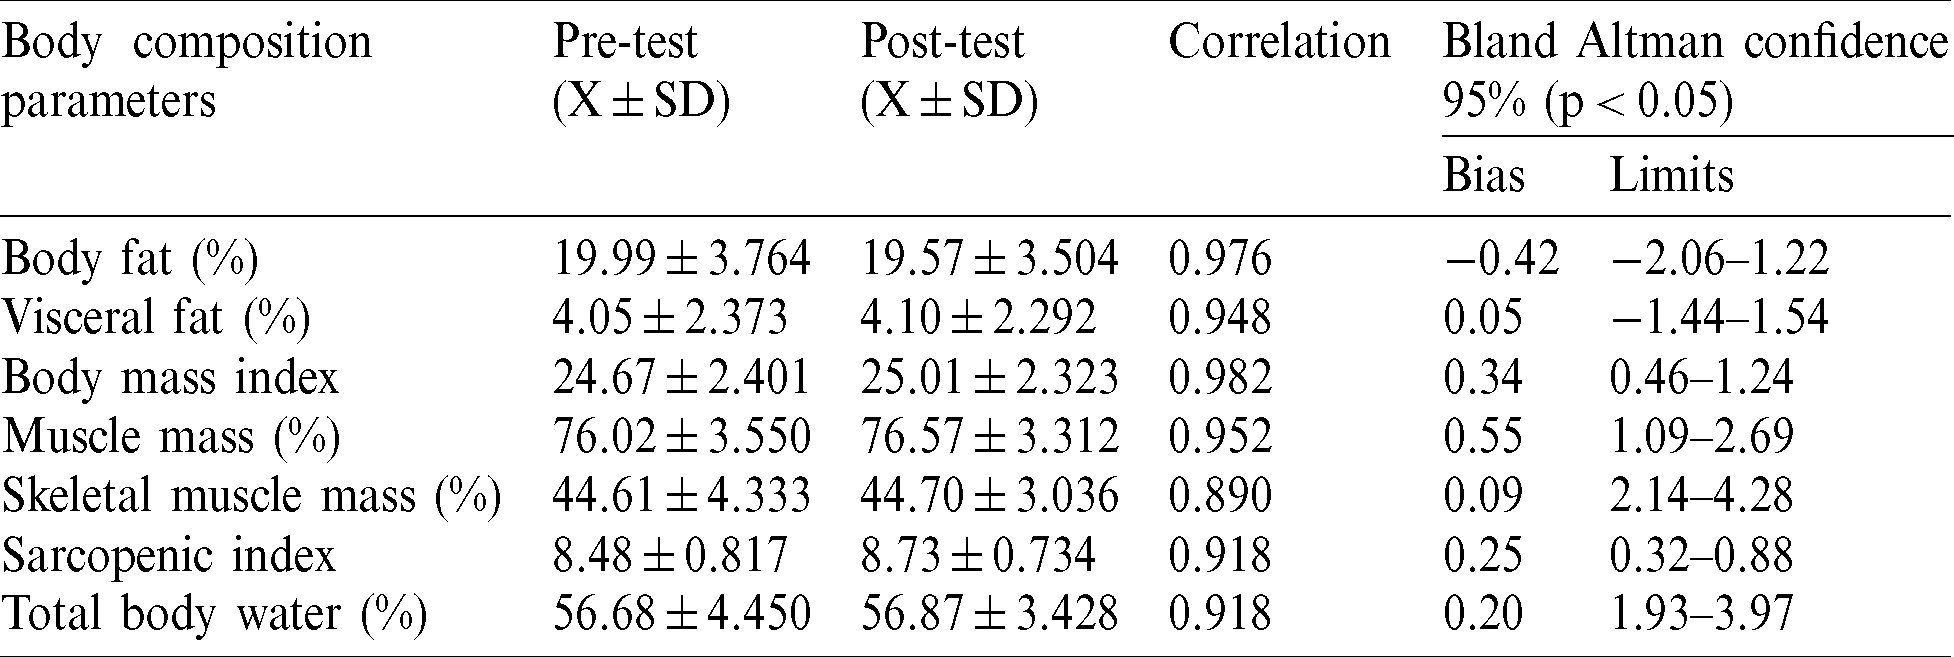
Table 7: Statistical analysis for body composition (females)
By applying ANOVA and paired t-test at each gender and for each parameter of the body composition between pre and post-test, the statistical significance of 10 out of 14 indicators were not achieved (Tab. 8). These results confirm that BIA is a reliable device in assessing body composition, and its results could be used at the benchmark to determine pattern recognition.
Table 8: Statistical analysis for body composition (paired t-test, ANOVA)
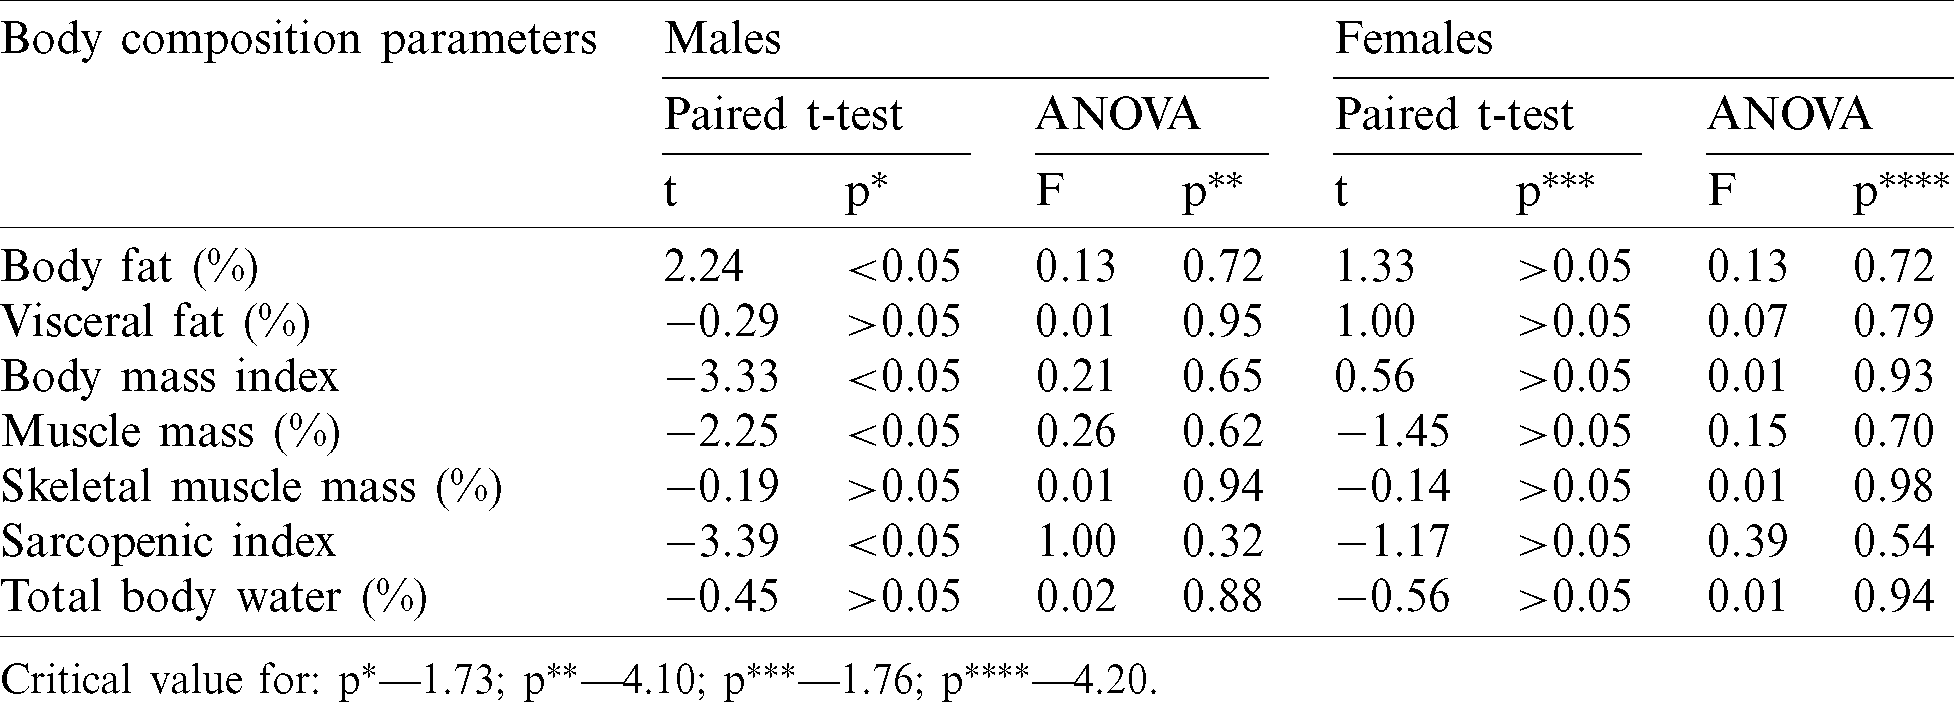
Critical value for:  —1.73;
  —4.10;
  —1.76;
  —4.20.
The average values for each body composition parameters did not show any significant differences between pre and post-test at males (Fig. 2) and females (Fig. 3). These aspects confirm that BIA had an excellent accuracy for assessing body composition.
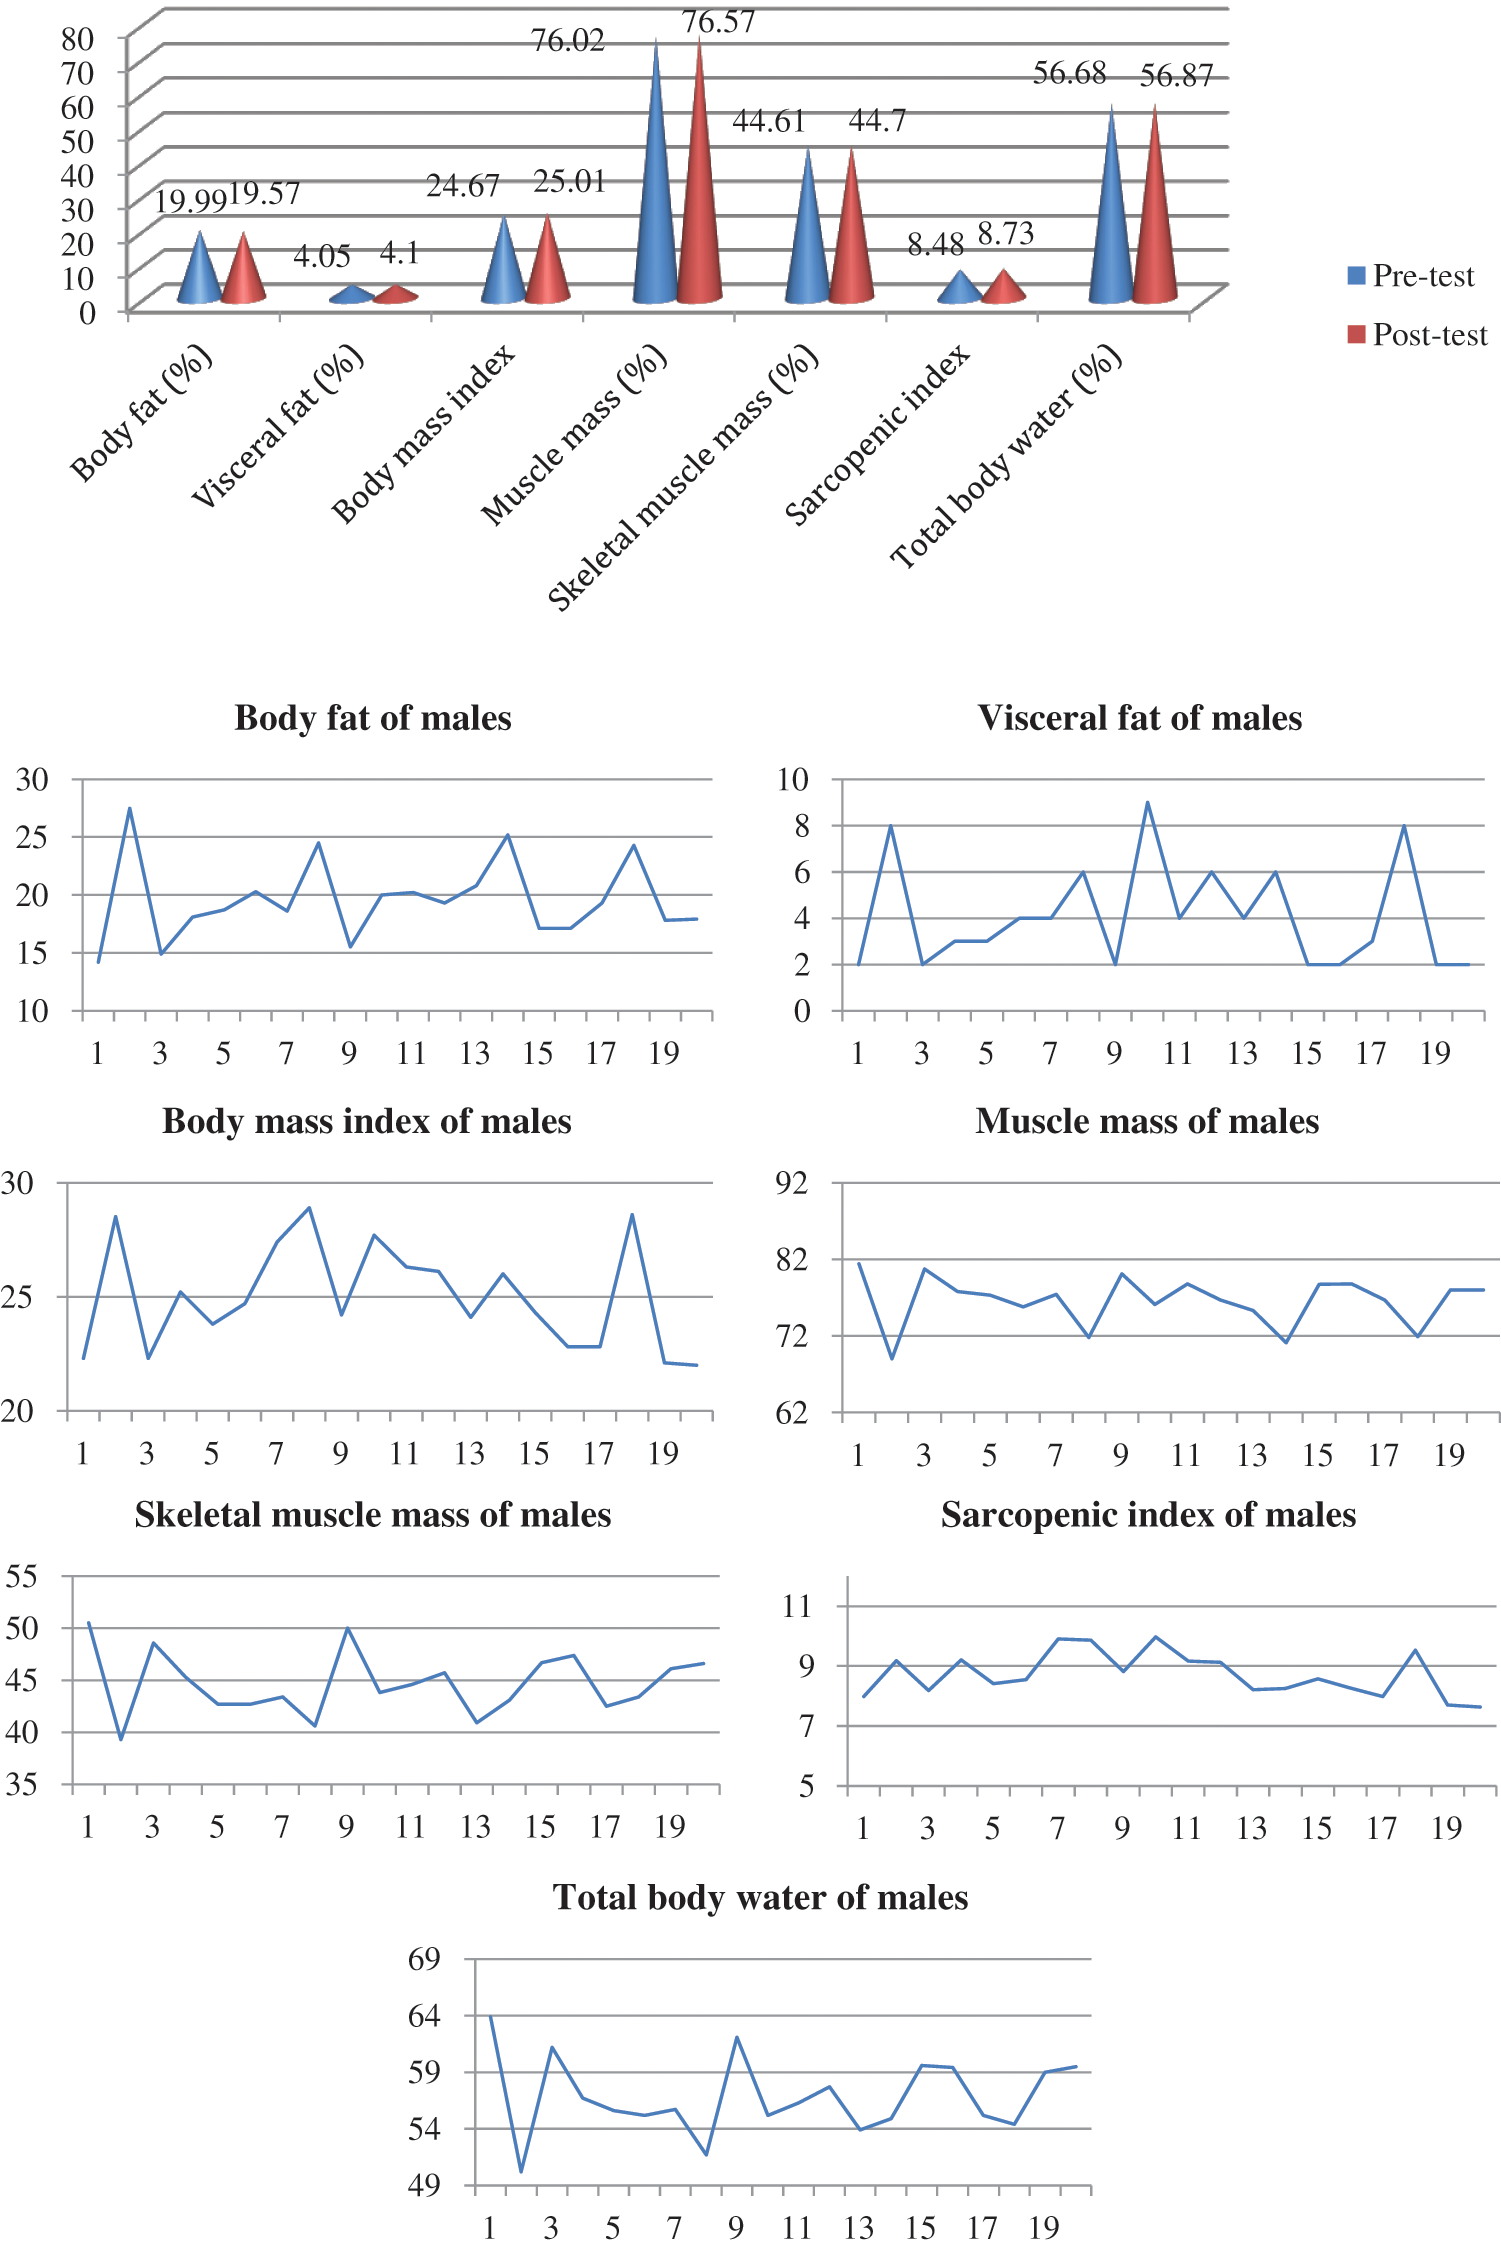
Figure 2: Assessment results using bioelectrical impedance analyzer (males)
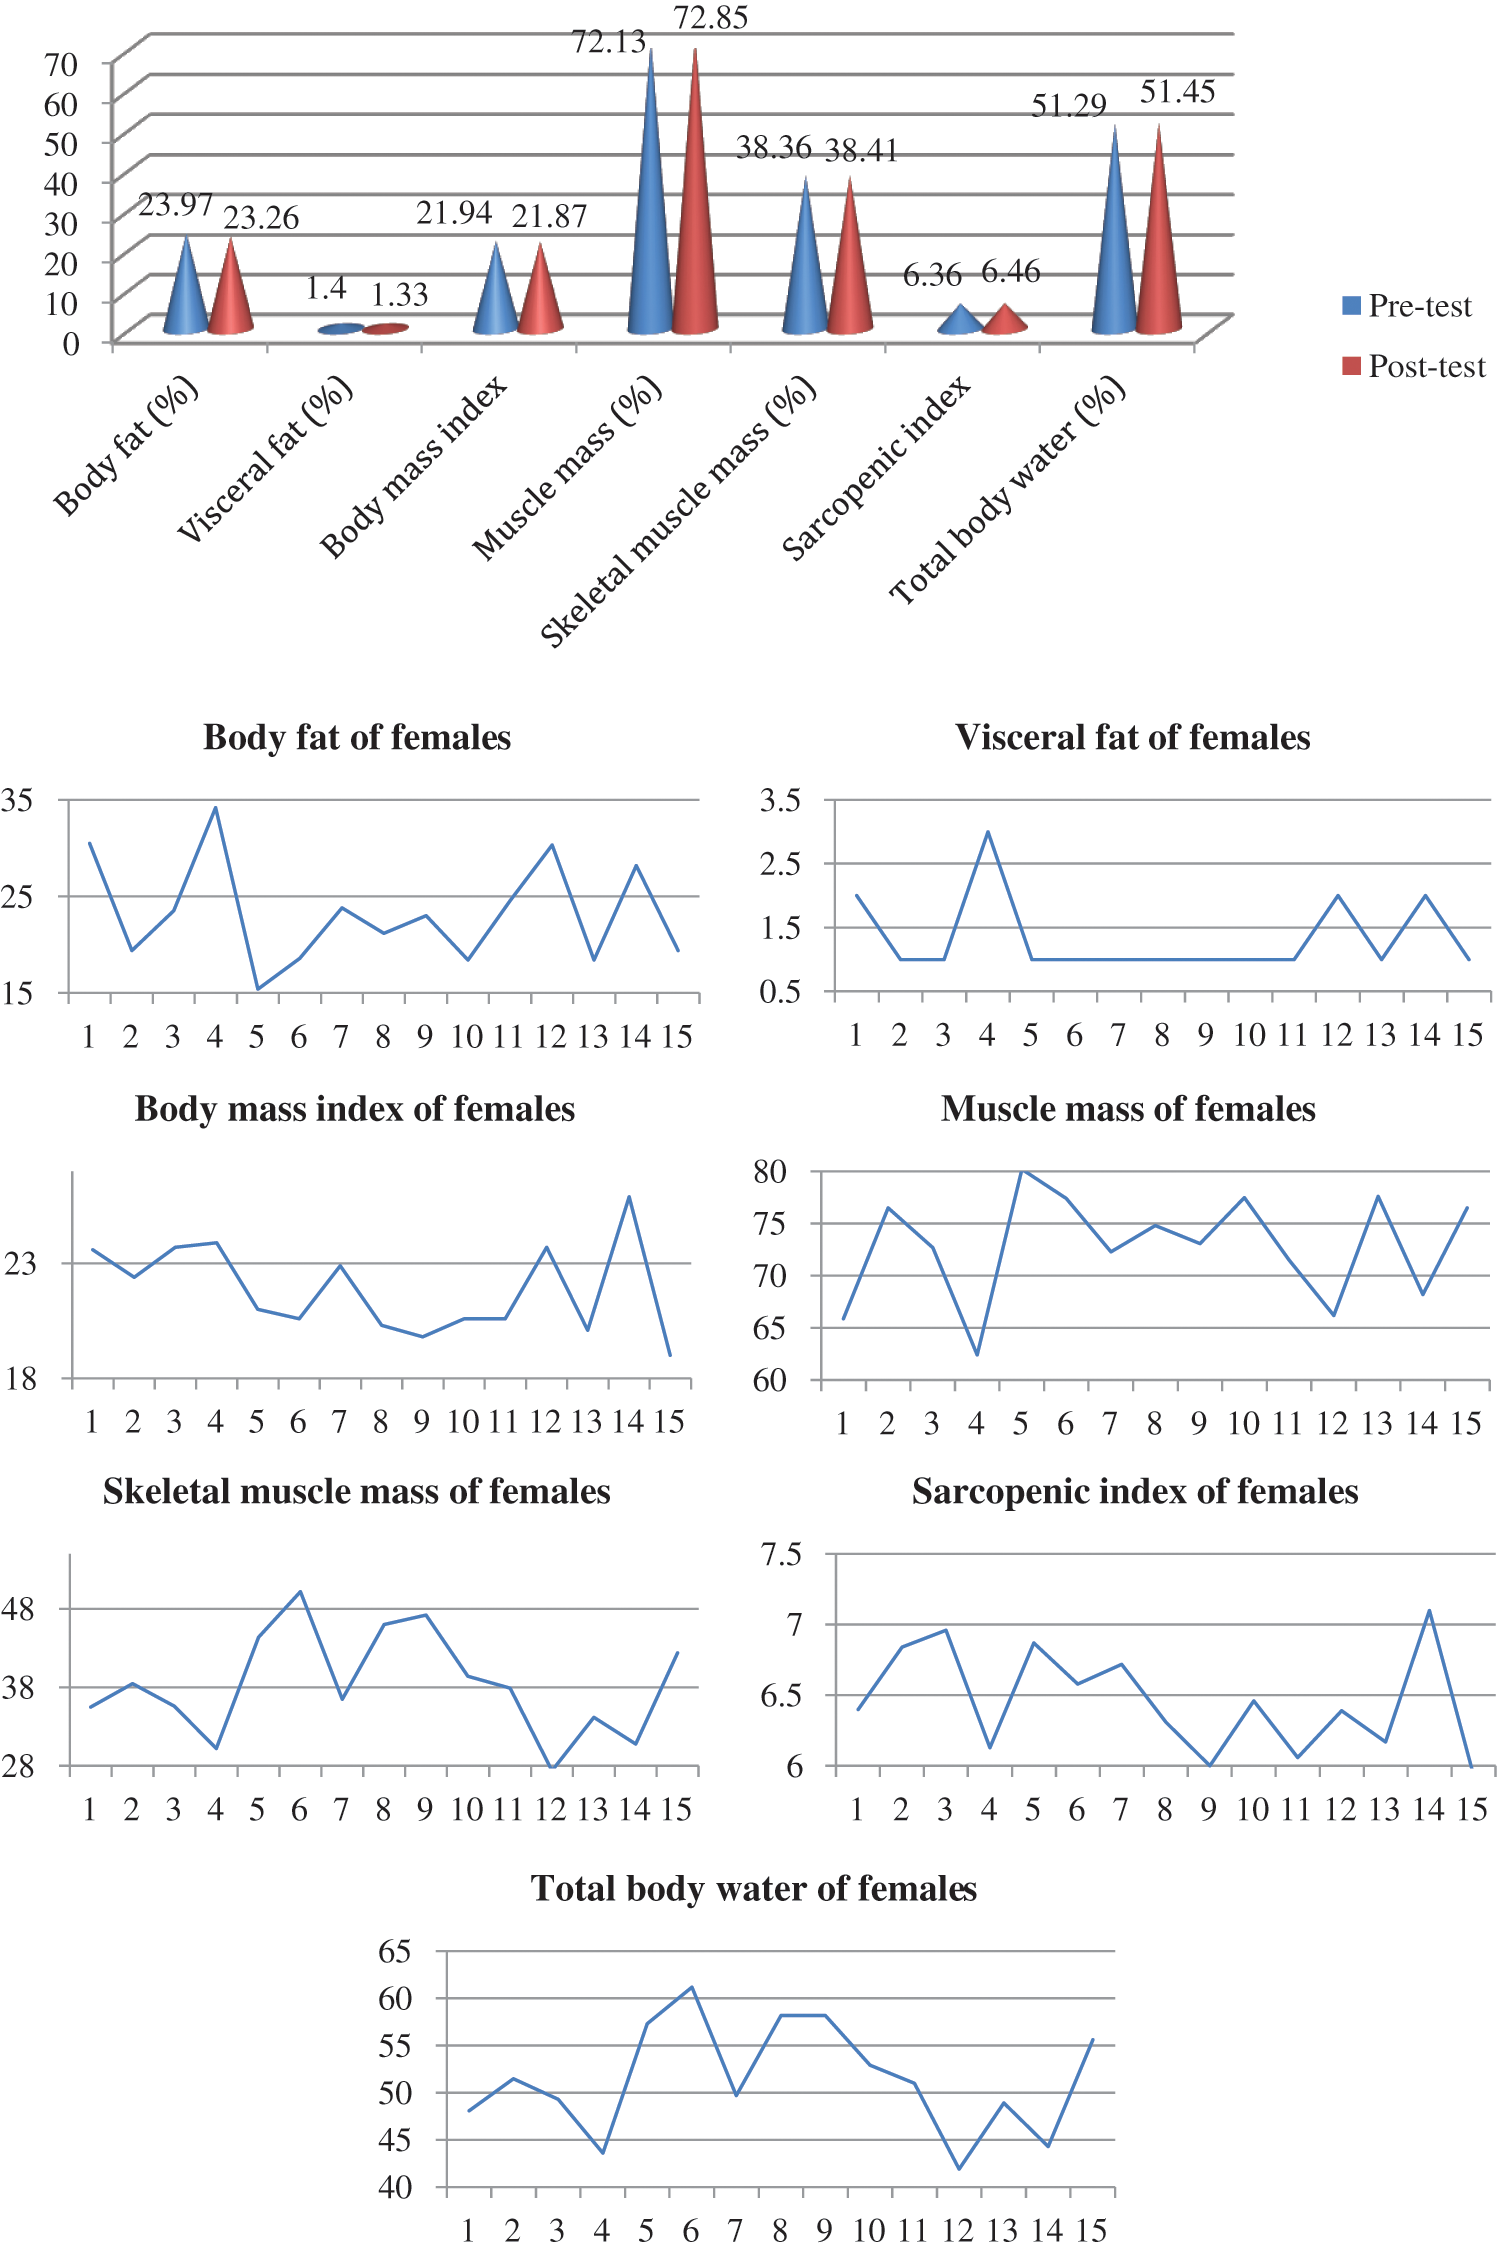
Figure 3: Assessment results using BIA (females)
For Pearson correlation, at males, 6 out of 7 values were over 0.900 and that means a strong positive correlation and for one indicator the value was 0.890. For females, one indicator has a value of 0.755, and the six other indicators have values over 0.900, indicating a strong positive correlation. According to the data collected from BIA (Tanita MC 780 MA) and by applying Bland–Altman analysis (Figs. 2 and 3) and Pearson correlation, we determined the body composition pattern of the subjects involved in our study (males and females) and compared them with our previous studies. The body composition pattern of males is shown in Tab. 9, and the distribution of values is shown in Fig. 4.
Table 9: Male body composition pattern
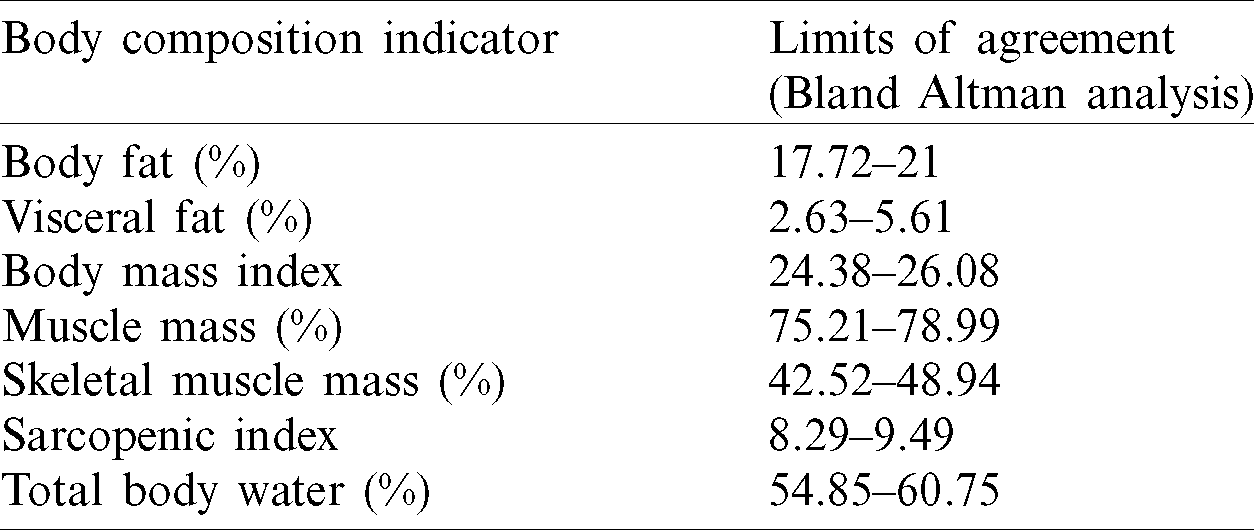
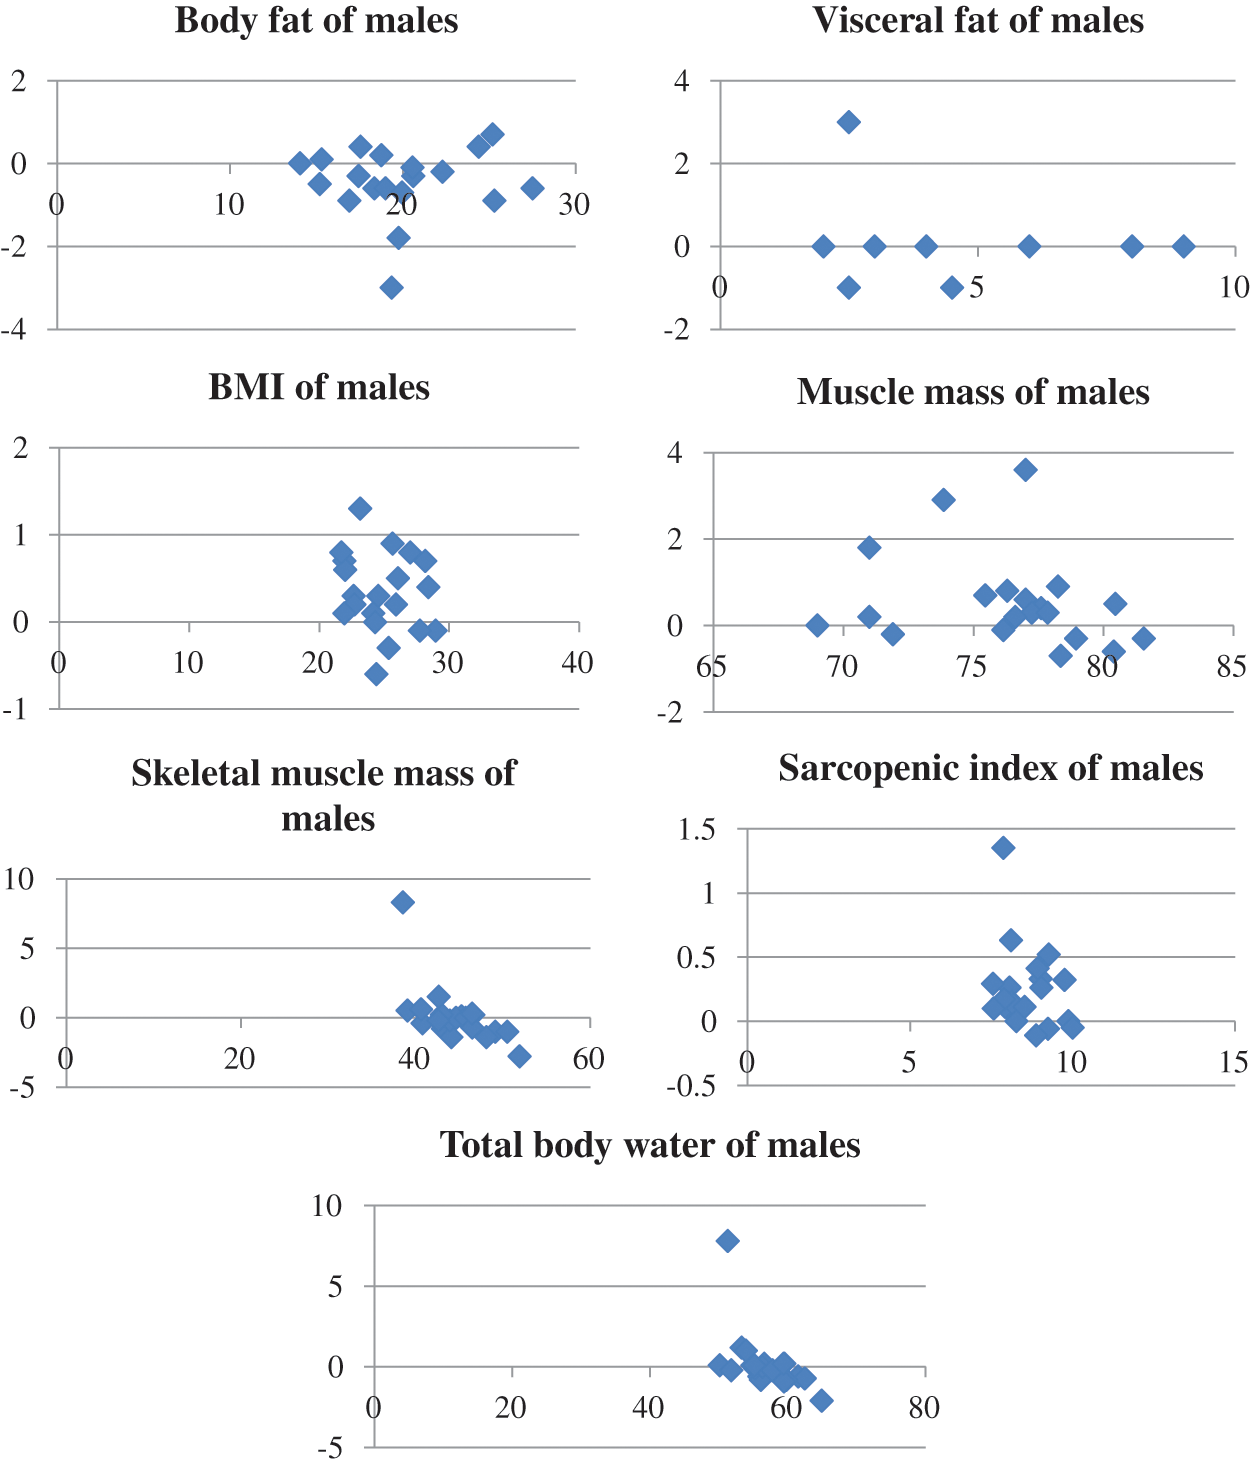
Figure 4: Bland–Altman plot for male body composition parameters
The body composition pattern of females is shown in Tab. 10, and the distribution according to Bland Altman analysis is presented in Fig. 5.
Table 10: Female body composition pattern
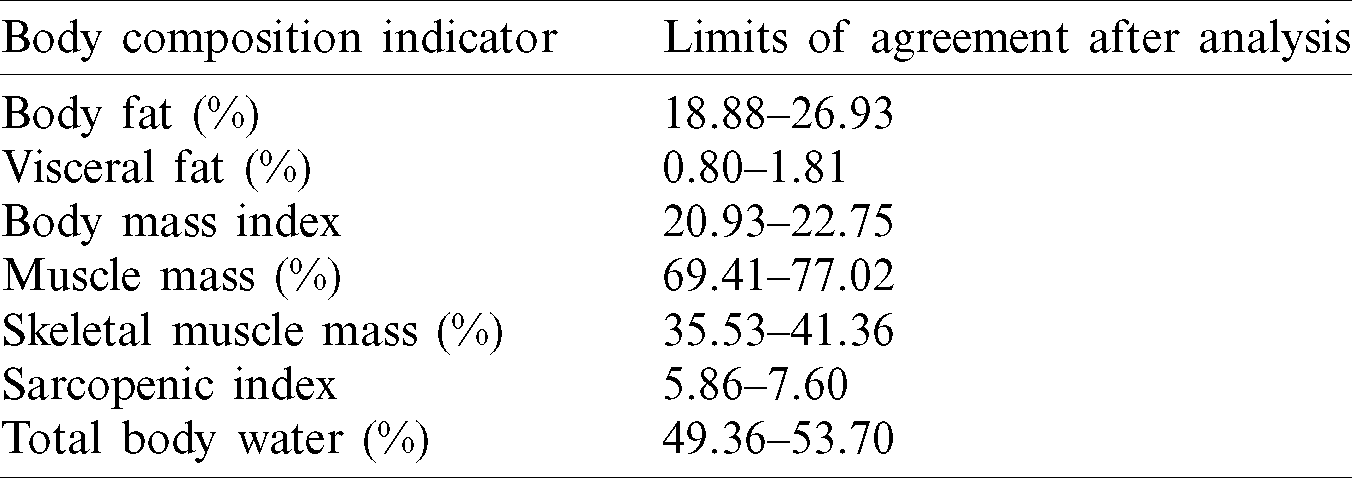
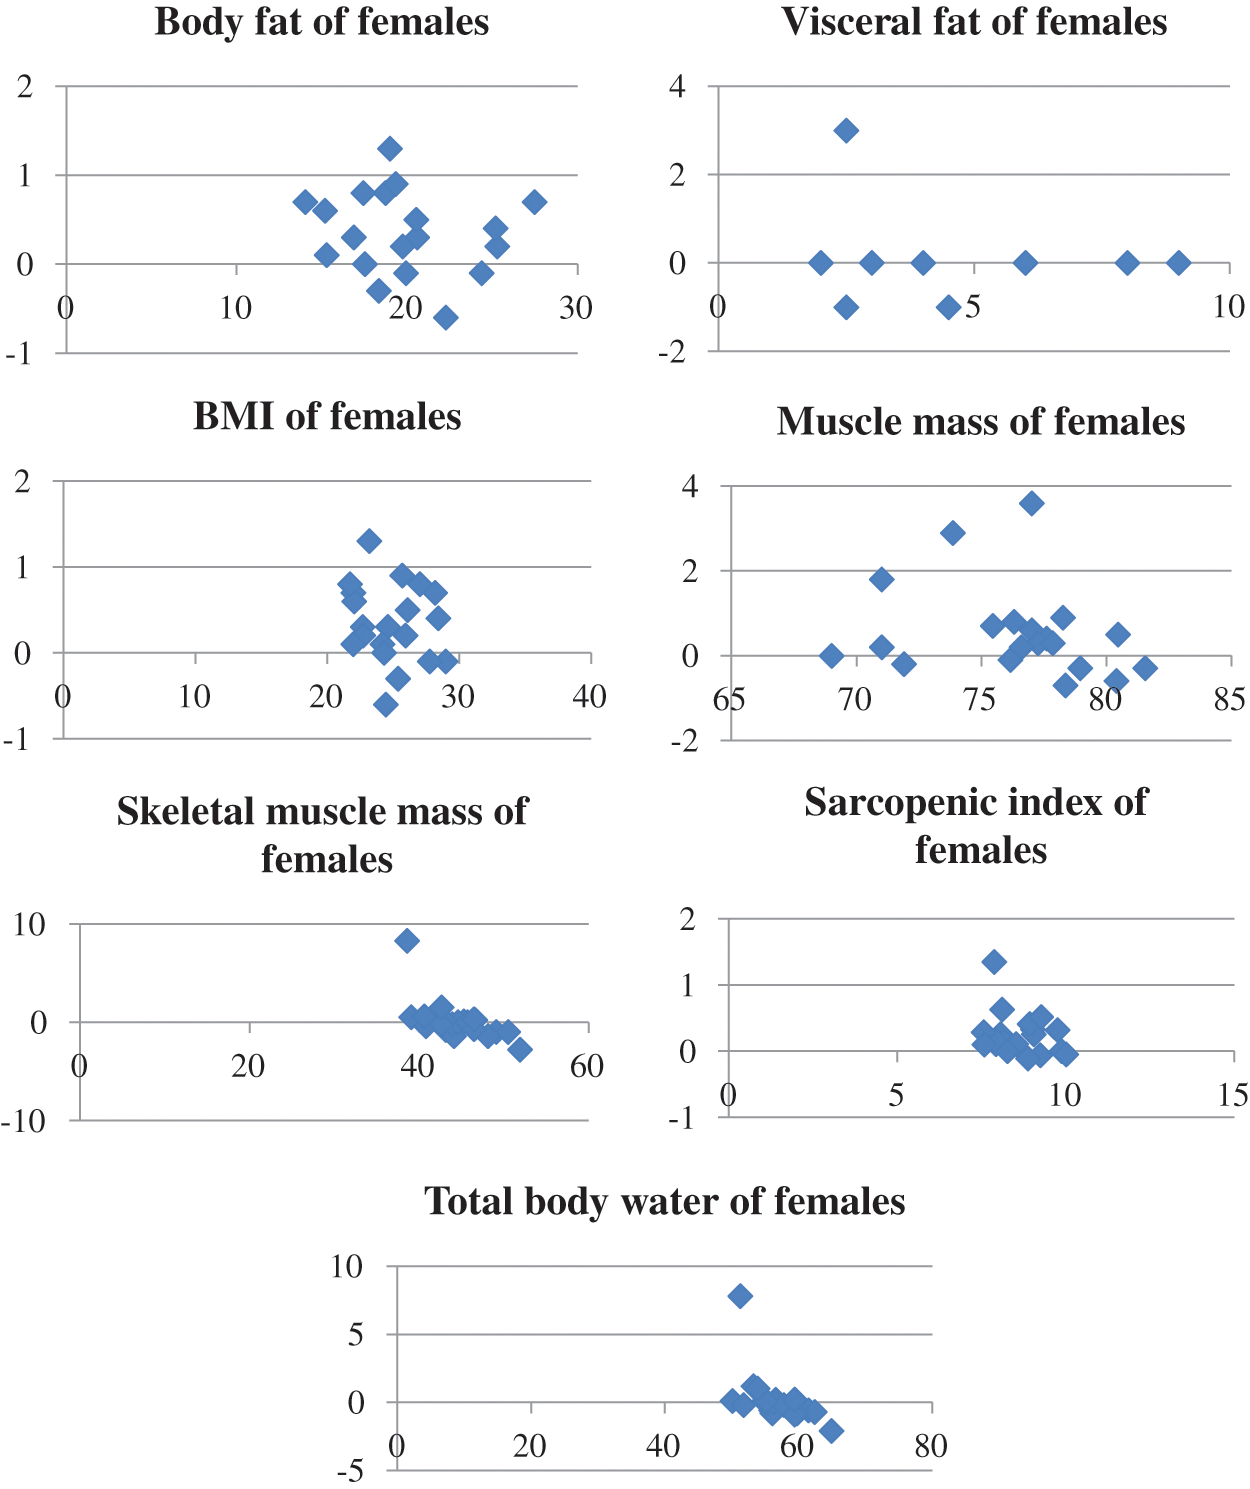
Figure 5: Bland–Altman plot for female body composition parameters
For body fat (BF%), at males, there was obtained a value of 0.976 at Pearson correlation, that means a strong positive correlation; at Bland–Altman analysis the bias was −0.42, and the LOA were −2.06 (lower) and +1.22 (upper). For females, a strong positive correlation was also recorded; the bias value was −0.71, and the LOA were −4.73 and +3.32. The visceral fat (VF%) for both genders exhibited a strong positive correlation (males—0.948, females—0.942). The Bland–Altman analysis for males shows that the lower and upper LOA were −1.44 and +1.54, respectively; whereas those for females were −0.57 and +0.44, respectively [17,24,25,29–32].
At BMI, the correlations were strong for both genders. The LOA for males and females at the Bland–Altman analysis was +0.46 and +1.24 and −0.98 and +0.84, respectively. The upper limit for the BMI of males is 26.08, which indicates a tendency for being overweight; the same situation is also observed in previous studies [26,32,33]. The correlations concerning the muscle mass and skeletal muscle mass for females were strong, and those for the muscle mass and skeletal muscle mass (0.890) of males are strong and moderate to strong, respectively. The LOA for the muscle mass and skeletal muscle mass of females were −3.08 and +4.53 and −2.86 and +2.97, respectively. For males The LOA for the muscle mass and skeletal muscle mass of males were +1.09 and 2.69 and +2.14 and +4.28, respectively [16,34,35].
At sarcopenic index, the bias for males and females was 0.25 and 0.10, respectively. The LOA for males and females was +0.32 and +0.88 and −0.55 and +0.75, respectively [36–38]. For total body water (TBW%), the Pearson correlation was strong for both genders, and the LOA for males and females was +1.93 and +3.97 and −2.01 and 2.34, respectively [18,39].
This research is subjected to several limitations, including the number of participating subjects, the device settings, and the software algorithms used. The reason is that a wide range of BIA is available on the market, and differences are observed among them.
In previous studies, a pattern was identified for the four indicators that concern body composition (e.g., BMI, body fat, muscle mass, and total body water). The novelty of our study is the fact we identified a recognition pattern by using medical statistical methods for a body composition that contains seven indicators (e.g., body fat, visceral fat, BMI, muscle mass, skeletal muscle mass, sarcopenic index, and total body water). To statistically validate the pattern for the body composition obtained in our study for males and females, we used four different statistical methods (e.g., Bland–Altman analysis, paired t-test, ANOVA, and Pearson correlation). The limits of agreement allowed us to establish the margins for every analyzed indicator for each body composition. The statistical methods used confirmed the reliability of the device utilized in the research. Our results are in the margins of previous studies for both genders, except for the total body water (TBW), wherein the data were at a lower limit and below. The youth that possesses the body composition pattern identified in our study could be considered healthy. Every deviation of one or more parameters outside the margins of the pattern for body composition could be associated with health issues and more medical investigations would be needed for diagnosis. BIA is considered a valid and reliable device to assess body composition along with medical statistical methods to identify a pattern for body composition according to the age, gender, and other relevant parameters. Other studies that involve more subjects are needed to determine the pattern of body composition for different ages, weights, and physical activity levels.
Author Contributions: All authors contributed to writing, original draft preparation, conceptualization, designing, analysis, investigations, data analysis, review, and editing of the content. All authors read and agreed to the published version of the manuscript.
Funding Statement: The authors received no specific funding for this study, and the APC was funded by “Ştefan cel Mare” University of Suceava, Romania. The authors gracefully thank “Ştefan cel Mare” University of Suceava for providing material and financial support.
Conflicts of Interest: The authors declare that they have no conflicts of interest to report regarding the present study.
1. F. Liu, J. Yan, W. Wang, J. Liu and J. Li et al. (2020). , “Scalable skin lesion multi-classification recognition system,” Computers, Materials & Continua, vol. 62, no. 2, pp. 801–816. [Google Scholar]
2. Y. Chen, X. Qin, L. Zhang and B. Yi. (2020). “A novel method of heart failure prediction based on DPCNNXGBOOST model,” Computers, Materials & Continua, vol. 65, no. 1, pp. 495–510. [Google Scholar]
3. J. Wan, T. Chen, B. Chen, Y. Yu and Y. Sheng et al. (2020). , “A polyp detection method based on Fbnet,” Computers, Materials & Continua, vol. 63, no. 3, pp. 1263–1272. [Google Scholar]
4. A. Mittal, D. Kumar, M. Mittal, T. Saba and I. Abunadi et al. (2020). , “Detecting pneumonia using convolutions and dynamic capsule routing for chest X-ray images,” Sensors, vol. 20, no. 4, pp. 1068. [Google Scholar]
5. J. Prasanna, M. S. P. Subathra, M. A. Mohammed, S. Maashi Mashael, B. Garcia-Zapirain et al. (2020). , “Detection of focal and non-focal electroencephalogram signals using fast Walsh-Hadamard transform and artificial neural network,” Sensors, vol. 20, no. 17, pp. 4952. [Google Scholar]
6. M. A. Mohammed, H. K. Abdulkareem, A. S. Mostafa, M. Khanapi Abd Ghani, S. M. Maashi et al. (2020). , “Voice pathology detection and classification using convolutional neural network model,” Applied Sciences, vol. 10, no. 11, pp. 3723. [Google Scholar]
7. M. A. Mohammed, H. K. Abdulkareem, A. S. Al-Waisy, S. A. Mostafa, S. Al-Fahdawi et al. (2020). , “Benchmarking methodology for selection of optimal COVID-19 diagnostic model based on entropy and TOPSIS methods,” IEEE Access, vol. 8, pp. 99115–99131. [Google Scholar]
8. B. Zhang, S. Zhou, L. Yang, L. Jianhua and M. Zhong. (2020). “Study on multi-label classification of medical dispute documents,” Computers, Materials & Continua, vol. 65, no. 3, pp. 1975–1986. [Google Scholar]
9. K. Mehshan Ahmed, M. A. Khan, F. Ahmed, M. Mittal, L. M. Goyal et al. (2020). , “Gastrointestinal diseases segmentation and classification based on duo-deep architectures,” Pattern Recognition Letters, vol. 131, pp. 193–204. [Google Scholar]
10. M. Marra, R. Sammarco, De A. Lorenzo, F. Iellamo, M. Siervo et al. (2019). , “Assessment of body composition in health and disease using bioelectrical impedance analysis (BIA) and dual energy X-ray absorptiometry (DXAA critical overview,” Contrast Media & Molecular Imaging, vol. 35, pp. 482–484. [Google Scholar]
11. J. Verney, C. Schwartz, S. Amiche, B. Pereira and D. Thivel. (2015). “Comparisons of a multi-frequency bioelectrical impedance analysis to the dual-energy X-ray absorptiometry scan in healthy young adults depending on their physical activity level,” Journal of Human Kinetics, vol. 47, no. 1, pp. 73–80. [Google Scholar]
12. J. G. Wang, Y. Zhang, H. E. Chen, Y. Li, X. G. Cheng et al. (2013). , “Comparison of two bioelectrical impedance analysis devices with dual energy X-ray absorptiometry and magnetic resonance imaging in the estimation of body composition,” Journal of Strength and Conditioning Research, vol. 27, no. 1, pp. 236–243. [Google Scholar]
13. A. Bosy-Westphal, W. Later, B. Hitze, T. Sato, E. Kossel et al. (2008). , “Accuracy of bioelectrical impedance consumer devices for measurement of body composition in comparison to whole body magnetic resonance imaging and dual X-ray absorptiometry,” Obesity Facts, vol. 1, no. 6, pp. 319–324. [Google Scholar]
14. T. Lemos and D. Gallagher. (2017). “Current body composition measurement techniques,” Current Opinion in Endocrinology, Diabetes, and Obesity, vol. 24, no. 5, pp. 310–314. [Google Scholar]
15. G. Sergi, M. De Rui, B. Stubbs, N. Veronese and E. Manzato. (2017). “Measurement of lean body mass using bioelectrical impedance analysis: A consideration of the pros and cons,” Aging Clinical and Experimental Research, vol. 29, no. 4, pp. 591–597. [Google Scholar]
16. F. Buckinx, J. Y. Reginster, N. Dardenne, J. L. Croisiser, J. F. Kaux et al. (2015). , “Concordance between muscle mass assessed by bioelectrical impedance analysis and by dual energy X-ray absorptiometry: A cross-sectional study,” BMC Musculoskeletal Disorders, vol. 16, no. 1, pp. 60. [Google Scholar]
17. P. Kutac and M. Kopecky. (2015). “Comparison of body fat using various bioelectrical impedance analyzers in university students,” Acta Gymnica, vol. 45, no. 40, pp. 177–186. [Google Scholar]
18. C. N. Matias, F. A. Noujeimi, L. B. Sardinha, V. H. Teixeira and A. M. Silva. (2019). “Total body water and water compartments assessment in athletes: Validity of multi-frequency bioelectrical impedance,” Science & Sports, vol. 34, no. 6, pp. e307–e313. [Google Scholar]
19. K. L. Vasold, A. C. Parks, D. Phelan, M. B. Pontifex and J. M. Pivarnik. (2019). “Reliability and validity of commercially available low-cost bioelectrical impedance analysis,” International Journal of Sport Nutrition and Exercise Metabolism, vol. 29, no. 4, pp. 406–410. [Google Scholar]
20. A. P. Isaev, R. V. Khomenko, A. V. Nenasheva, A. V. Shevtsov and A. E. Batueva. (2019). “Biomechanical, physiological and age-related features of personification and individualization during quickness and speed-strength qualities enhancement in young weightlifter,” Human Sport Medicine, vol. 19, no. 3, pp. 28–35. [Google Scholar]
21. M. E. Ciplak, S. Eler, M. Joximovic and N. Eler. (2019). “The relationship between body composition and physical fitness performance in handball players,” International Journal of Applied Exercise Physiology, vol. 8, no. 3. 1, pp. 347–353. [Google Scholar]
22. D. P. Guedes, J. C. Calabrese and P. M. Pirolli. (2019). “Use of different segmental multi-frequency bioelectrical impedance devices for analysis of body composition in young adults: Comparison with bioelectrical spectroscopy,” Nutricion Hospitalaria, vol. 36, no. 3, pp. 618–625. [Google Scholar]
23. N. I. Siddiqui, S. A. Khan, M. Shoeb and S. Bose. (2016). “Anthropometric predictors of bio-impedance analysis (BIA) phase angle in healthy adults,” Journal of Clinical and Diagnostic Research: JCDR, vol. 10, no. 6, pp. CC01–CC4. [Google Scholar]
24. C. B. Dixon and J. L. Andreacci. (2011). “Effect of mode selection when using contact-electrode bioelectrical impedance analyzers to estimate percent body fat in young adults,” Journal of Sports Medicine and Physical Fitness, vol. 51, no. 2, pp. 241–248. [Google Scholar]
25. S. Demura, S. Sato and T. Kitabayashi. (2005). “Estimation accuracy of percent total body fat and percent segmental fat measured by single-frequency bioelectrical impedance analysis with 8 electrodes: The effect of difference in adiposity,” Journal of Sports Medicine and Physical Fitness, vol. 45, no. 1, pp. 68–76. [Google Scholar]
26. A. Cable, D. C. Nieman, M. Austin, E. Hogen and A. C. Utter. (2001). “Validity of leg-to-leg bioelectrical impedance measurement in males,” Journal of Sports Medicine and Physical Fitness, vol. 41, no. 3, pp. 411–414. [Google Scholar]
27. D. S. Freedman, M. Horlick and G. S. Berenson. (2013). “A comparison of the Slaughter skinfold-thickness equations and BMI in predicting body fatness and cardiovascular disease risk factor levels in children,” American Journal of Clinical Nutrition, vol. 98, no. 6, pp. 1417–1424. [Google Scholar]
28. C. Wohlfahrt-Veje, J. Tinggaard, K. Winther, A. Mouritsen, C. P. Hagen et al. (2014). , “Body fat throughout childhood in 2647 healthy Danish children: Agreement of BMI, waist circumference, skinfolds with dual X-ray absorptiometry,” European Journal of Clinical Nutrition, vol. 68, no. 6, pp. 664–670. [Google Scholar]
29. J. R. Beam and D. J. Szymanski. (2010). “Validity of 2 skinfold calipers in estimating percent body fat of college-aged men and women,” Journal of Strength and Conditioning Research, vol. 24, no. 12, pp. 3448–3456. [Google Scholar]
30. R. Kutlu and F. G. Cihan. (2017). “Comparison of the body compositions in obese and nonobese individuals: Can learning body compositions motivate losing weight?,” Nigerian Journal of Clinical Practice, vol. 20, no. 1, pp. 82–87. [Google Scholar]
31. M. Velazquez-Alva, M. E. Irigoyen-Camacho, R. Huerta-Huerta and J. Delgadillo-Velazquez. (2014). “A comparison of dual energy X-ray absorptiometry and two bioelectrical impedance analyzers to measure body fat percentage and fat-free mass index in a group of Mexican young women,” Nutricion Hospitalaria, vol. 29, no. 5, pp. 1038–1046. [Google Scholar]
32. C. M. Wright, A. Sherriff, S. C. Ward, J. H. McColl, J. J. Reilly et al. (2008). , “Development of bioelectrical impedance-derived indices of fat and fat-free mass for assessment of nutritional status in childhood,” European Journal of Clinical Nutrition, vol. 62, no. 2, pp. 210–217. [Google Scholar]
33. M. Franco-Villoria, C. M. Wright, J. H. McColl, A. Sherriff, M. S. Pearce et al. (2016). , “Assessment of adult body composition using bioelectrical impedance: Comparison of researcher calculated to machine outputted values,” BMJ Open, vol. 6, no. 1, pp. e008922. [Google Scholar]
34. O. Alizadehkhaiyat, D. H. Hawkes, G. J. Kemp, A. Howard and S. P. Frostick. (2014). “Muscle strength and its relationship with skeletal muscle mass indices as determined by segmental bio-impedance analysis,” European Journal Of Applied Physiology, vol. 114, no. 1, pp. 177–185. [Google Scholar]
35. M. A. Bredella. (2017). “Sex differences in body composition,” Advances in Experimental Medicine and Biology, vol. 1043, pp. 9–27. [Google Scholar]
36. S. A. Alkahtani. (2017). “A cross-sectional study on sarcopenia using different methods: Reference values for healthy Saudi young men,” BMC Musculoskeletal Disorders, vol. 18, no. 1, pp. 119. [Google Scholar]
37. M. Correa-Rodríguez, J. Schmidt-Rio Valle, Á.M. de la Fuente-Vílchez and B. Rueda-Medina. (2018). “Analysis of lifestyle and bone mineralization in a population of Spanish young adults,” Colombia Medica (Cali, Colombia), vol. 49, no. 3, pp. 213–218. [Google Scholar]
38. A. Keska, G. Lutosławska, J. Bertrandt and M. Sobczak. (2018). “Relationships between bone mineral density and new indices of body composition in young, sedentary men and women,” Annals of Agricultural and Environmental Medicine: AAEM, vol. 25, no. 1, pp. 23–25. [Google Scholar]
39. A. Andreoli, G. Melchiorri, A. De Lorenzo, I. Caruso and P. Sinibaldi Salimei. (2002). “Bioelectrical impedance measures in different position and vs. dual-energy X-ray absorptiometry (DXA),” Journal of Sports Medicine and Physical Fitness, vol. 42, no. 2, pp. 186–189. [Google Scholar]
40. X. He, Z. Li, X. Tang, L. Zhang, L. Wang et al. (2018). , “Age-and sex-related differences in body composition in healthy subjects aged 18 to 82 years,” Medicine, vol. 97, no. 25, pp. e11152. [Google Scholar]
41. B. Agarwal, V. Balas, L. Jain, R. Chandra Poonia and M. Sharma. (2020). “Deep Learning Techniques for Biomedical and Health Informatics. st ed., Amsterdam, Netherlands: Academic Press, . [Online]. Available: https://www.elsevier.com/books/deep-learning-techniques-for-biomedical-and-health-informatics/agarwal/978-0-12-819061-6. [Google Scholar]
 | This work is licensed under a Creative Commons Attribution 4.0 International License, which permits unrestricted use, distribution, and reproduction in any medium, provided the original work is properly cited. |