DOI:10.32604/cmc.2021.014868
| Computers, Materials & Continua DOI:10.32604/cmc.2021.014868 | |
| Article |
Evaluating the Impact of Prediction Techniques: Software Reliability Perspective
1Department of Computer Science, Dr. Shakuntala Misra National Rehabilitation University, Lucknow, 226017, India
2Department of Computer Engineering, College of Computer and Information Systems, Umm Al-Qura University, Makkah, 21955, Saudi Arabia
3Department of Computer Application, Shri Ramswaroop Memorial University, Barabanki, 225003, India
4Department of Information Technology, Babasaheb Bhimrao Ambedkar University, Lucknow, 226025, India
*Corresponding Author: Rajeev Kumar. Email: rs0414@gmail.com
Received: 13 October 2020; Accepted: 10 November 2020
Abstract: Maintaining software reliability is the key idea for conducting quality research. This can be done by having less complex applications. While developers and other experts have made significant efforts in this context, the level of reliability is not the same as it should be. Therefore, further research into the most detailed mechanisms for evaluating and increasing software reliability is essential. A significant aspect of growing the degree of reliable applications is the quantitative assessment of reliability. There are multiple statistical as well as soft computing methods available in literature for predicting reliability of software. However, none of these mechanisms are useful for all kinds of failure datasets and applications. Hence finding the most optimal model for reliability prediction is an important concern. This paper suggests a novel method to substantially pick the best model of reliability prediction. This method is the combination of analytic hierarchy method (AHP), hesitant fuzzy (HF) sets and technique for order of preference by similarity to ideal solution (TOPSIS). In addition, using the different iterations of the process, procedural sensitivity was also performed to validate the findings. The findings of the software reliability prediction models prioritization will help the developers to estimate reliability prediction based on the software type.
Keywords: Software reliability; reliability prediction; prediction techniques; hesitant-fuzzy-AHP; hesitant-fuzzy-TOPSIS
Software reliability serves as a vital feature of programme continuity. Software reliability can be described in the standard form as the likelihood of software execution over a specified period of time in a specified environment without failure [1]. Software reliability is defined by IEEE as the ability of a system or component to perform its required functions for a specified period of time under the stated conditions [2]. Due to technology malfunctions arising from software errors, technology is unstable. Moreover, the highly dynamic design of software makes it difficult to calculate reliability. There are various software reliability analysis and prediction models available in literature. But every model fits with a specific dataset. There is no global model for reliability prediction which is flexible with each dataset and application.
To achieve reliable software, many researchers like Musa et al. [3] have shown that certain model families typically have some features which are considered better than others. Same as this, other researchers provided models of SRGM such as Goel–Okumoto model [3], Yamada et al. [4], Zhang et al. [5], Alijahdali [6], Bisi et al. [7], etc. These models are either based on statistical methods or soft computing methods. Work is under way to find the techniques for selecting the best model among the existing models for an individual use. Generally, the users prefer to pick which model they should be using before they start. However, that is a challenging task. A huge concern for the software developers in the recent decades is to produce highly reliable software by using a precise, managed, and designed software development process. The technique of reliability prediction plays an important role in the repair of reliability during the programme’s design process. The prediction of reliability is a method of predicting reliability for a target subsystem and components. There is a need to develop a solution which considers most of reliability prediction attributes in assessment for finding an accurate model for reliability prediction.
Precise evaluation focuses on the attributes they engage in [3–5]. These attributes play an important role in the programme’s reliability evaluation. This evaluation is also an issue of multi-criteria decision-making (MCDM). The use of different methods will deal with MCDM problems. The methods used in the past by MCDM have been difficult. In 2019, Kumar et al. [8] proposed the aggregate method of index randomization. Then, in the early 1980s, Saaty [9] developed the Analytic Hierarchy Approach (AHP). Rezaei [10] proposed several criteria for the selection of the Best Worst Method in 2015. In the mid-1960’s, Roy [11] proposed the reduction and collection of communicating reality (ELECTRE). In the 1980s [12] the Preference Ranking Organization Method for Enrichment of Evaluations (PROMETHEE) was developed. In 2011, Serafim Opricovic founded the cycle Vise Kriterijumska Optimizacija I Kompromissno Resenje (VIKOR) [13]. Hwang et al. [14] developed a Technique for Order of Preference by Similarity to Ideal Solution (TOPSIS) in 1993. In addition, Wikipedia also enlists over 30 solutions to MCDM [15].
Among all these methods, AHP (Analytic Hierarchy Process) proves to be a popular and efficient method for choosing an attribute among several attributes [16,17]. Furthermore, AHP evaluation fully depends on decision maker’s choice and credits given by it. Hence, Fuzzy AHP is used as a hybrid method for clarifying the decisions of AHP. But the uncertainty that arises when a decision-maker in AHP can’t agree on a particular value and wants to go above or below the values can be solved by using hesitant fuzzy sets. Hesitant Fuzzy Sets assists in expressing hesitant desires of decision-makers. After it was put forward, the hesitant Fuzzy series has been attracting significant attention from scholars at home and outside.
This paper uses a hybrid approach of Hesitant Fuzzy-AHP-TOPSIS for choosing best reliability models. Fuzzy sets are used in mathematical terms to represent imprecision and vagueness of the linguistic data. In this paper different reliability models are considered as different attributes. While three datasets John Musa Bell Laboratories Dataset, MyLynn Dataset and Apache Lucene Server dataset are considered as different alternatives [3,18]. Multi-criteria approaches have important implications when used for Fuzzy Sets. Hesitant Fuzzy Sets (HFS) is used to deal with situations where multiple standards can be obtained from a single attribute [19]. Decision makers usually prefer to assign intervals for the evaluation of requirements in multiple decision-making criteria, as the pair-wise comparisons between characteristics are not based on observable elements. The benefit of Hesitant Fuzzy-AHP-TOPSIS over conventional fuzzy function is that by using pair-wise comparison matrices and constant fuzzy sets, it fits the attribute, and measures criteria weights. Alternatively, the TOPSIS-based Hesitant Fuzzy Sets (HFS) measures alternatives using discrete fuzzy sets and allows the creation of possible parameters for alternatives and different perspectives.
2 Software Reliability Prediction Models
Musa et al. [3] states that Software Reliability is concerned with the degree to which the software meets the customer’s requirements, again in the same manner as IEEE standard defined software reliability as [2], ‘The probability that software does not cause a program to malfunction for a given time under defined conditions.’ These definitions of software reliability focus on the rate of failure which signifies failure as a proven factor of software reliability. Multiple software reliability growth models have been developed on basis of failure prediction. Still there seems to be some key missing to achieve the reliability in the software.
As per the report published by AV Comparatives for March 2020, no antivirus mechanism ensures full reliability to the user that it will secure the system from malicious attacks [20]. A recent example of failure of reliability happened in February 2020 when more than hundred flights to and from London airport were disrupted due to system’s crash and technical issues [21]. Hence, the researchers are consistently working on different methods to achieve reliability. SRGMs are used at the testing phase of development. Different software reliability prediction methods have been used in past since late 90s. Musa [22] was the first to propose a model to predict software reliability in year 1990. Since then there is list of software reliability prediction models such as Goel–Okumoto, Yamada S Shaped, Musa model, etc., in different fields of engineering. In the month of July, 2019, Facebook, Instagram and Whatsapp shut down for some time and Mark Zuckerberg released statement about some routine maintenance issue. However users were unsatisfied and the failure of three important social platforms shook the digital world [23].
Software reliability prediction models are used to predict the reliability of software at the time of development. This makes the software more reliable besides providing quality to the end user. Hence, choosing the appropriate model for reliability prediction is a significant problem and due to involvement of multiple attributes into it, it becomes a multi criteria decision making problem. Due to the presence of multiple models, the developers often get confused about choosing the right model to use and with which dataset. In this context, the present study proposes a novel approach to prioritize different methods of software reliability prediction to choose the best among them. For achieving this objective, hybrid method of Fuzzy AHP TOPSIS has been used. We employed this methodology because fuzzy is eligible in handling vagueness of data, and the analytic hierarchy process is capable of handling loads of data by dividing it into a hierarchy. In addition, TOPSIS is used here to select the best alternative among all models.
In AHP, the data is taken from experts in the form of fuzzy linguistic form. However in some contexts, the experts are confused about providing the accurate data due to restricted scale of fuzzy. Hesitant Fuzzy provides a solution to this problem and expands the scale as per the expert’s consideration. The concept of hesitant fuzzy sets was proposed by Torra [24] in 2010. The method of hesitant fuzzy AHP TOPSIS is explained in the methodology section. To assess the best method of prediction, we need to find the available methods of prediction of software reliability. In the next section, the methods of software reliability prediction have been explained in detail. To implement the method of Fuzzy AHP TOPSIS for this problem, software reliability models are identified and settled as a hierarchy because AHP works on hierarchical problem. Fig. 1 shows the hierarchy of software reliability models. These models have been explained briefly after that.

Figure 1: Tree structure of reliability prediction models
To assess and prioritize different software reliability models, authors have classified software reliability prediction into two broad areas.
The set of multiple concepts and techniques aimed at addressing the challenges being faced in the real-world problems are soft computing techniques. It solves problems that appear to be imprecise, ambiguous and difficult to categorize [3]. As an effort to emulate natural organisms, we might see soft computing: Light, flexible, adaptive and clever plants, animals, human beings. In this context, soft computing is the name of a family of methods of problem solving that have an association with biological reasoning and problem-solving. Based on the thorough literature review, the commonly used soft computing methods are as follows:
MLP (Multi-Layer Perceptron): The classical type of neural network is Multilayer Perceptrons, or MLPs for short [4]. They are made up of one or more neuronal layers. Data is fed into the input layer, one or more hidden layers that provide abstraction levels, and predictions will be made on the output layer, also called the visible layer. MLPs are ideal for predictive classification problems where a class or label is assigned to inputs. These are also suitable for regression prediction problems where, given a set of inputs, a real evaluated quantity is predicted.
ANN (Artificial Neural Network): An artificial neural network (ANN) is a computer system designed to replicate the way information is analyzed and processed by the human brain. It is based on artificial intelligence (AI) and solves problems that, by human or mathematical standards, would prove impossible or difficult [5]. ANNs have self-learning skills that allow them to achieve better outcomes as more knowledge becomes available.
Neuro-Fuzzy Model: Apart from the fuzzy neural modeling of software reliability, neuro fuzzy modeling first train the model by using any algorithm of neural network, after which, fuzzification and defuzzification of factors happens [6]. In most of the cases researchers take neuro-fuzzy modeling same as fuzzy neural modeling but both are different in sequencing of algorithms and provides different results.
Fuzzy-Neural Model: Hybrid method of Fuzzy-Neural is regarded as the best approach among the hybrid approaches of soft computing [7]. Due to high degree of nonlinearity between influencing factors and the reliability of the system, it is difficult to describe such highly non-linear relationship through a mathematical model.
Mamdani Fuzzy Inference System: One of the fuzzy models is known as FIS, i.e., fuzzy inference system. The FIS model was applied on a broad variety of industrial and management problems. This method is a time varying approach that applies fuzzy. One of the first fuzzy systems to apply is a set of fuzzy rules to regulate a combination of steam engine and boiler supplied by experienced human operators was Sahu [17]. This method has been widely implemented in a number of industrial issues.
Statistical processes for software release assessments are usually based on a loss function that normally takes into consideration the tradeoff between incremental expense of testing and undetected cost of error. Statistical models of software reliability consider the probability on which the reliability of software will never fail for specified period of time. There are various techniques on which software reliability models are being developed for many years. We have chosen the most worked upon statistical methods in our research study. These have been explained in detail below:
Non-Homogeneous Poisson Process (NHPP) Model: Non Homogeneous Poisson Process (NHPP) systems have been extensively used in analyzing hardware reliability issues. They are particularly useful for describing the processes of failure that possess certain trends such as growth in reliability and deterioration. Therefore an application of NHPP models can be easily implemented for software reliability analysis.
Weibull Software Reliability Model: Due to its flexibility, the Weibull distribution is commonly used in the study of reliability and life data. The Weibull distribution can be used to model a number of life behaviours, depending on the values of the parameters. Yamada et al. [25] in 1993 used Weibull modeling for reliability prediction by statistical methods.
Logarithmic Poisson Execution Time Model: This model incorporates both execution time and calendar time components, for software reliability prediction, each of which is derived. This model was proposed by Musa et al. [3] in 1984 at bell laboratories. Since then multiple extended models of Musa–Okumoto model or Logarithmic Poisson execution time model have come in years.
Bayesian Software Reliability Growth Model: Littlewood et al. [26] was the first to propose Bayesian modeling of software reliability in 1973. After this, he also modified the Jelinski–Moranda model using Bayesian approach.
Hidden Markov Chain Model: A hidden Markov (HMM) model is a probabilistic sequence of associated probabilistic states, where an observation is generated by each state. One can only see the conclusions, and the aim is to infer the secret state sequence. Durand et al. [27] used the hidden markov model for reliability assessment in 2005.
The next section of this study describes the methodology of Hesitant Fuzzy AHP TOPSIS for the assessment and prioritization of different software reliability models listed above by using the hierarchy shown in Fig. 1. Furthermore, the alternatives chosen for assessment are three datasets which are John Musa Bell Laboratories, MyLynn Dataset and Apache Lucene Dataset [3,18].
3 Hesitant-Fuzzy-AHP-TOPSIS Method
MCDM is the appropriate technique for solving many real-world challenges and making the right choices. In MCDM operations, AHP is considered to be a well-organized method because it offers an efficient solution for decision-makers. The pair-wise comparison matrix is normally utilized, and the accuracy of the system is validated. When there are many alternatives available, these pair-wise comparisons are seriously influenced by the decisions of practitioners.
This research presents an effective method consisting of AHP to evaluate the decision requirements and TOPSIS to select the most suitable function to solve the problem of selecting the appropriate software reliability prediction method. To obtain more precise results, this study also uses the hesitant fuzzy strategy. MCDM has some complex methods, but because of its simple calculation, TOPSIS arrives at the end. The measures are summarized as follows to measure the weights of the selected main and sub-methods:
Step 1: First step is the construction of the hierarchical model for the various problem levels.
Step 2: Through the assistance of linguistic terms [16], pair-wise comparisons for AHP between the problem characteristics are accomplished. For more reliable outcomes, experts are given a much larger scale than the ordinary AHP scale.
Step 3: Third step is using fuzzy wrappers [16] for converting evaluations. Assume that L0 is the lowest prominence and Lg is the highest prominence in the linguistic scale, and the valuations are between Li and Lj such that  ; symbol ordered weighted averaging (OrWA) of constraint n as shown in Eq. (1).

Here, 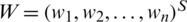 is the associated balancing vector satisfying the rule
  and Bj takes an importance corresponding to the principal of
  . After this calculation the fuzzy constraints of the trapezoidal numbers
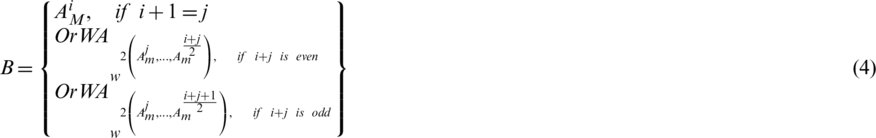
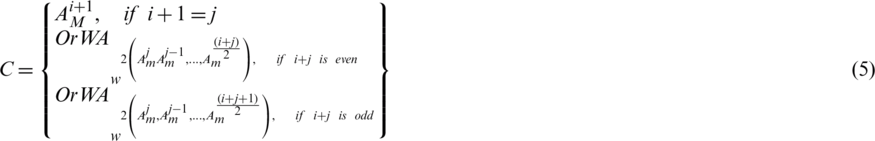
  as in Eqs. (2)–(5).


The step continues with identifying first and second type of weights using  , (which is a number contained by the unit interval [0, 1]) through the assistance of Eqs. (6)–(7) individually, first type weights (W
 ):
):

Second type weights (W ):
):

Again with the help of the equation  s, and
  where r is the number of the highest rank in assessments (where r is equal to 10), and i and j are the ranks of the lowest and highest assessments, correspondingly.
Step 4: Forth step is to complete the pair-wise comparison matrix ( ) as in Eqs. (8)–(9).


Step 5: Through the assistance of Eq. (10), defuzzification of a trapezoidal fuzzy number as  is done, which delivers a crisp number

Calculate the standard Consistency Ratio (CR) using Eqs. (11) and (12) [16,19].


In Eq. (11) consistency index represents as CI,  max represents the largest eigenvector of the matrix, n represents the number of criteria within the current calculation, and RI is a randomly deliberated ready-to-use index (the random index) that varies for altered n values. The idea here is to proceed calculations if the value of CR is lower than 0.1 otherwise go to step 2nd and start over the calculations.
Step 6: Next step is to assess the geometric mean for every row using Eq. (13).

Step 7: Next step is to assess the prediction weights for every highest method using Eq. (14).

Step 8: Using the Eq. (15) defuzzification of fuzzy numbers is calculated.

Step 9: Normalize weights are estimated from defuzzified weights using the help of Eq. (16).

With HF-TOPSIS, the next move is to find the best option. TOPSIS assists experts in choosing the truly outstanding alternative for real-world issues as a commonly used MADM method [16]. TOPSIS was used by Sahu [19]. It is based on the view that the best alternative is the most suitable norm for all prediction methods, while the negative variant is the one with the worst form of prediction. TOPSIS solution is the farthest from the negative ideal and the closest to the positive alternative. The HF-TOPSIS approach is adopted in this proposed reliability evaluation report by prioritizing parameters that describe the mechanism [19]. The method is based on the use of envelopes to calculate, for example, the distance between G1s and G2s. When the envelopes are given,  and
and 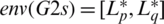 , the distance is defined as:

The method can be defined as:
Step 10: The initial steps for this,
Let’s assume that
• The choice under concern has Q alternatives  and n criteria or characteristics
• The practitioners or experts are specified with ex and the number of decision-makers is K
•  is a fuzzy decision matrix in which
  is the estimation score for alternative i(Ci) against criteria j(aj) specified by practitioners ex.
• The scale for methodology HF-TOPSIS is detailed as:
Let  be an uttered or linguistic term set and CH is the context-free grammar for producing its comparative linguistic terms. Also, let’s take two experts as e1 and e2 to provide their rank for two characteristics or criteria R1 and R2,
The fuzzy envelope for respective comparative linguistic expression is calculated as the succeeding [19]:
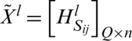
Step 11: Next step is to aggregate the individual calculations of experts or practitioners 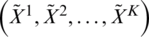 and build an aggregated decision matrix
  where xij denotes the assessments core of Ci against aj and precisely shown as
 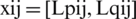 as in Eq. (18),


Step 12: For next step let  b signify assistance characteristic or criteria where greater values in aj mean better preference and
  c signifies cost criteria where inferior values in aj indicate more preference.
Let’s assume that the Hesitant Fuzzy Linguistic Term Set (HFLTS) positive ideal solution is signified with  and mathematically denoted as
  where
where  and the HFLTS negative ideal solution is signified as
  and arithmetically denoted as
  where
where 
Further define  ,
,  ,
,  and
and  for cost and benefit criteria such that


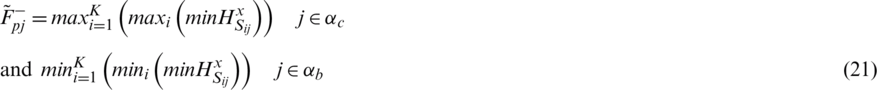

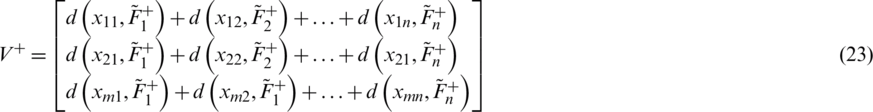
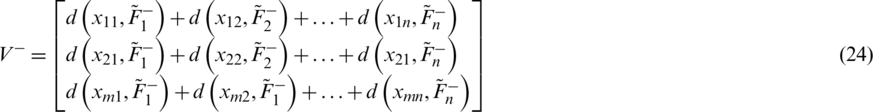
Step 13: Further using the assistance of Eqs. (22)–(23), construct the positive and negative ideal separation matrixes (V+ and V−), respectively.
Step 14: Compute the relative closeness score for each alternative under consideration through Eq. (24).

where

Step 15: Order the alternatives based on corresponding relative closeness scores.
Data analysis and results through HF-AHP-TOPSIS is implemented in the next section.
It is a daunting job for practitioners to select a perfect software reliability prediction model. This issue can be addressed with the aid of quantitative evaluation. But, during software development, practitioners are often puzzled due to the growing frequency of faults and device crashes. Such uncertainty can be the cause for losing out on the cost, time and, eventually, the users’ trust. Thus, it is a decision-making issue to choose the ideal software reliability prediction and evaluation model. To quantitatively evaluate and solve this dilemma, there are so many decision-making procedures [16,19]. The authors of this paper have followed a hesitant fuzzy-based decision analysis approach, i.e., Hesitant-Fuzzy-AHP-TOPSIS (HF-AHP-TOPSIS) to test the weights of various software reliability models.
First of all, opinions were taken from twenty-five academicians and industry professionals for each collection of methods of prediction and data. For this, in a virtual meeting setting, the practitioners were invited and told about the methods of prediction in relation to different groups and defined the linguistic values through the scale. The authors accumulated pair-wise comparison matrixes to determine the weights of various software reliability models with the aid of the collected data. Two methods at level 1 of the hierarchy are seen, according to Fig. 1. In the conference, practitioners were given a joint decision. The fuzzy envelopes (consistent) are therefore shown in Tabs. 1–3 for models at level 1 and level 2, respectively.
Table 1: Fuzzy envelopes for models at level 1

Table 2: Trapezoidal fuzzy pair-wise comparison matrix at level 2

Table 3: Trapezoidal fuzzy pair-wise comparison matrix at level 2

The accuracy of any evaluation was checked through Step 5 and Eqs. (10)–(12) after obtaining the score. The accuracy was found to be less than 0.1 for all classes of prediction models of the hierarchy. The authors evaluated the results from Eqs. (1)–(12) of the level 1 and level 2 prediction model as follows:
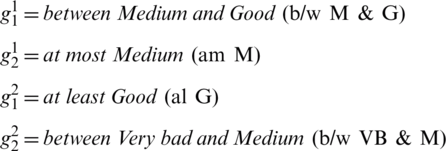
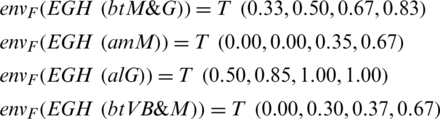
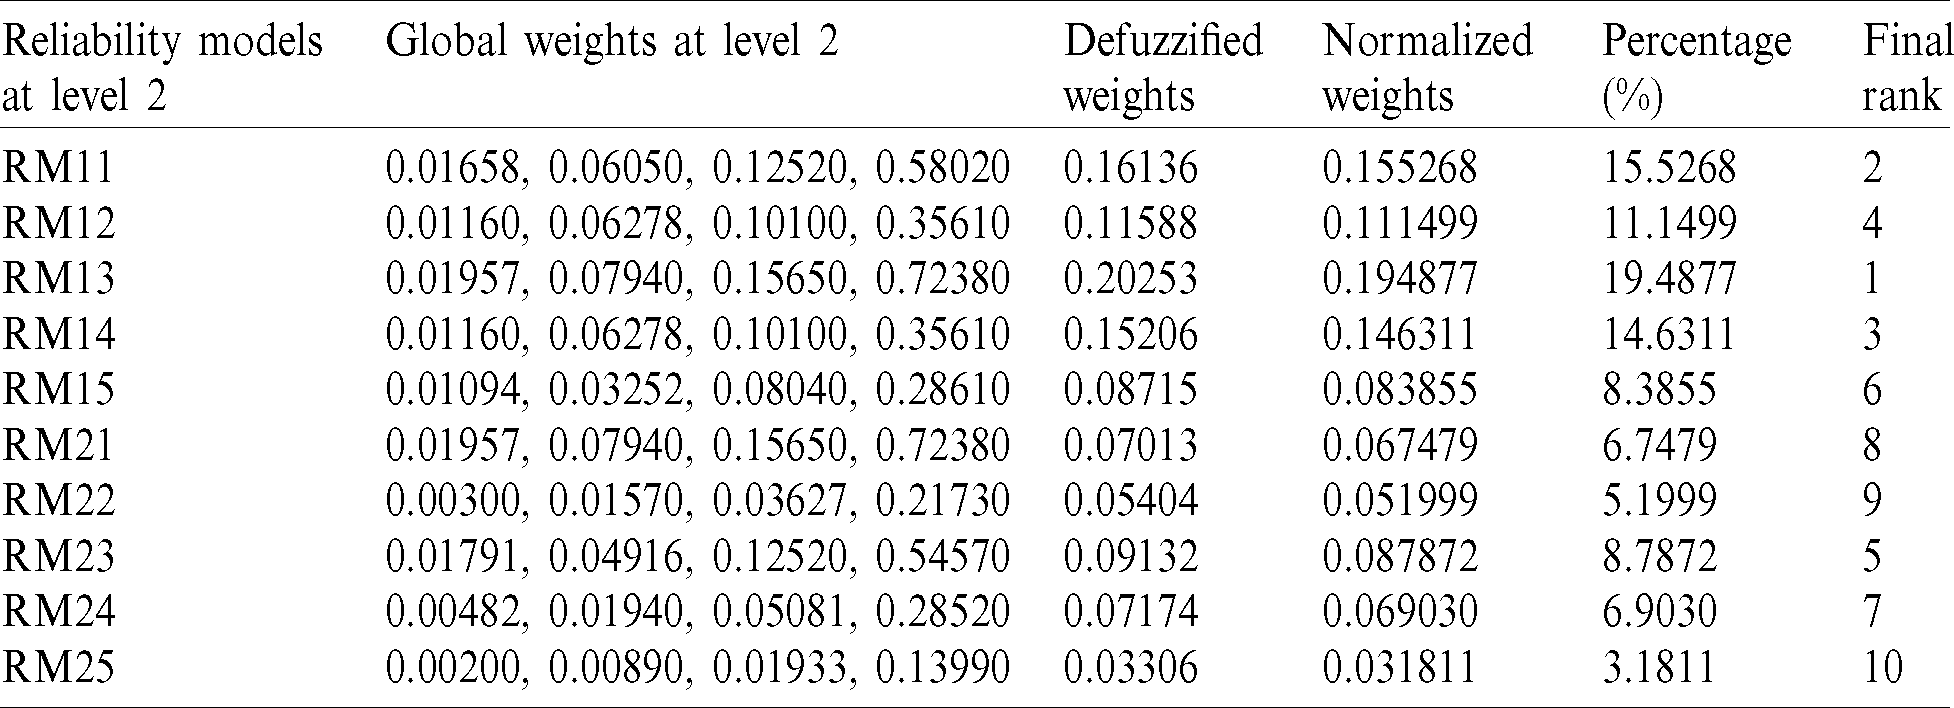
The “B/W VHI and ESHI” fuzzy envelope (US12) was named. (3.0, 5.0, 7.0) and (5.0, 7.0, 9.0) are the Triangular Fuzzy Numbers (TFN) associated with the linguistic values specified. The trapezoidal fuzzy  representing the linguistic meaning are calculated from Eqs. (1)–(5). In the end, it was determined that the fuzzy trapezoidal set of this envelop is (3.0, 5.0, 7.0, 9.0). From Eqs. (13) and (14), calculating the fuzzy weights of models and the weight of respective model can be evaluated through Eq. (14). From Eq. (15), defuzzified value of respective model is estimated. Thereafter, normalize the weights through Eq. (16). The computed outcomes of prediction models of reliability at level 1 are presented in Tab. 4. The same approach is used for testing fuzzy local weights, as shown in Tab. 4, for software reliability prediction models at level 2. Local or based weights of prediction models were evaluated as shown in Tabs. 5 and 6 with the aid of local weights or free weights of prediction models at level 2 and the hierarchy of Fig. 1. Finally, in Tab. 7, level wise weights of prediction models are presented with their effect on reliability. Additionally, the global based weights of prediction models through the hierarchy are provided in Tabs. 8 and 9.
Table 4: Trapezoidal fuzzy pair-wise comparison matrix at level 1
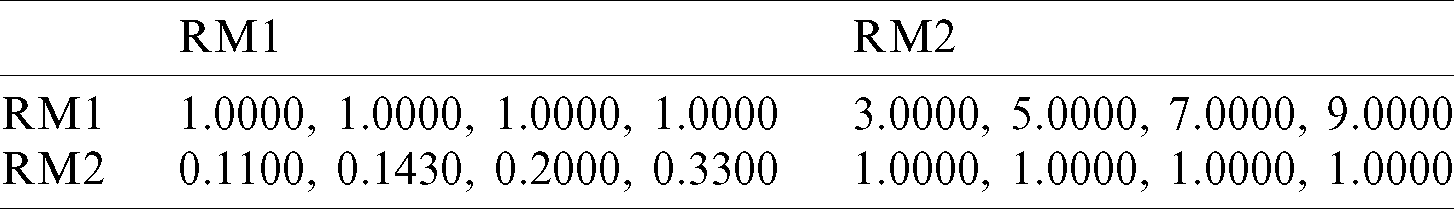
Table 5: Trapezoidal fuzzy pair-wise comparison matrix at level 2
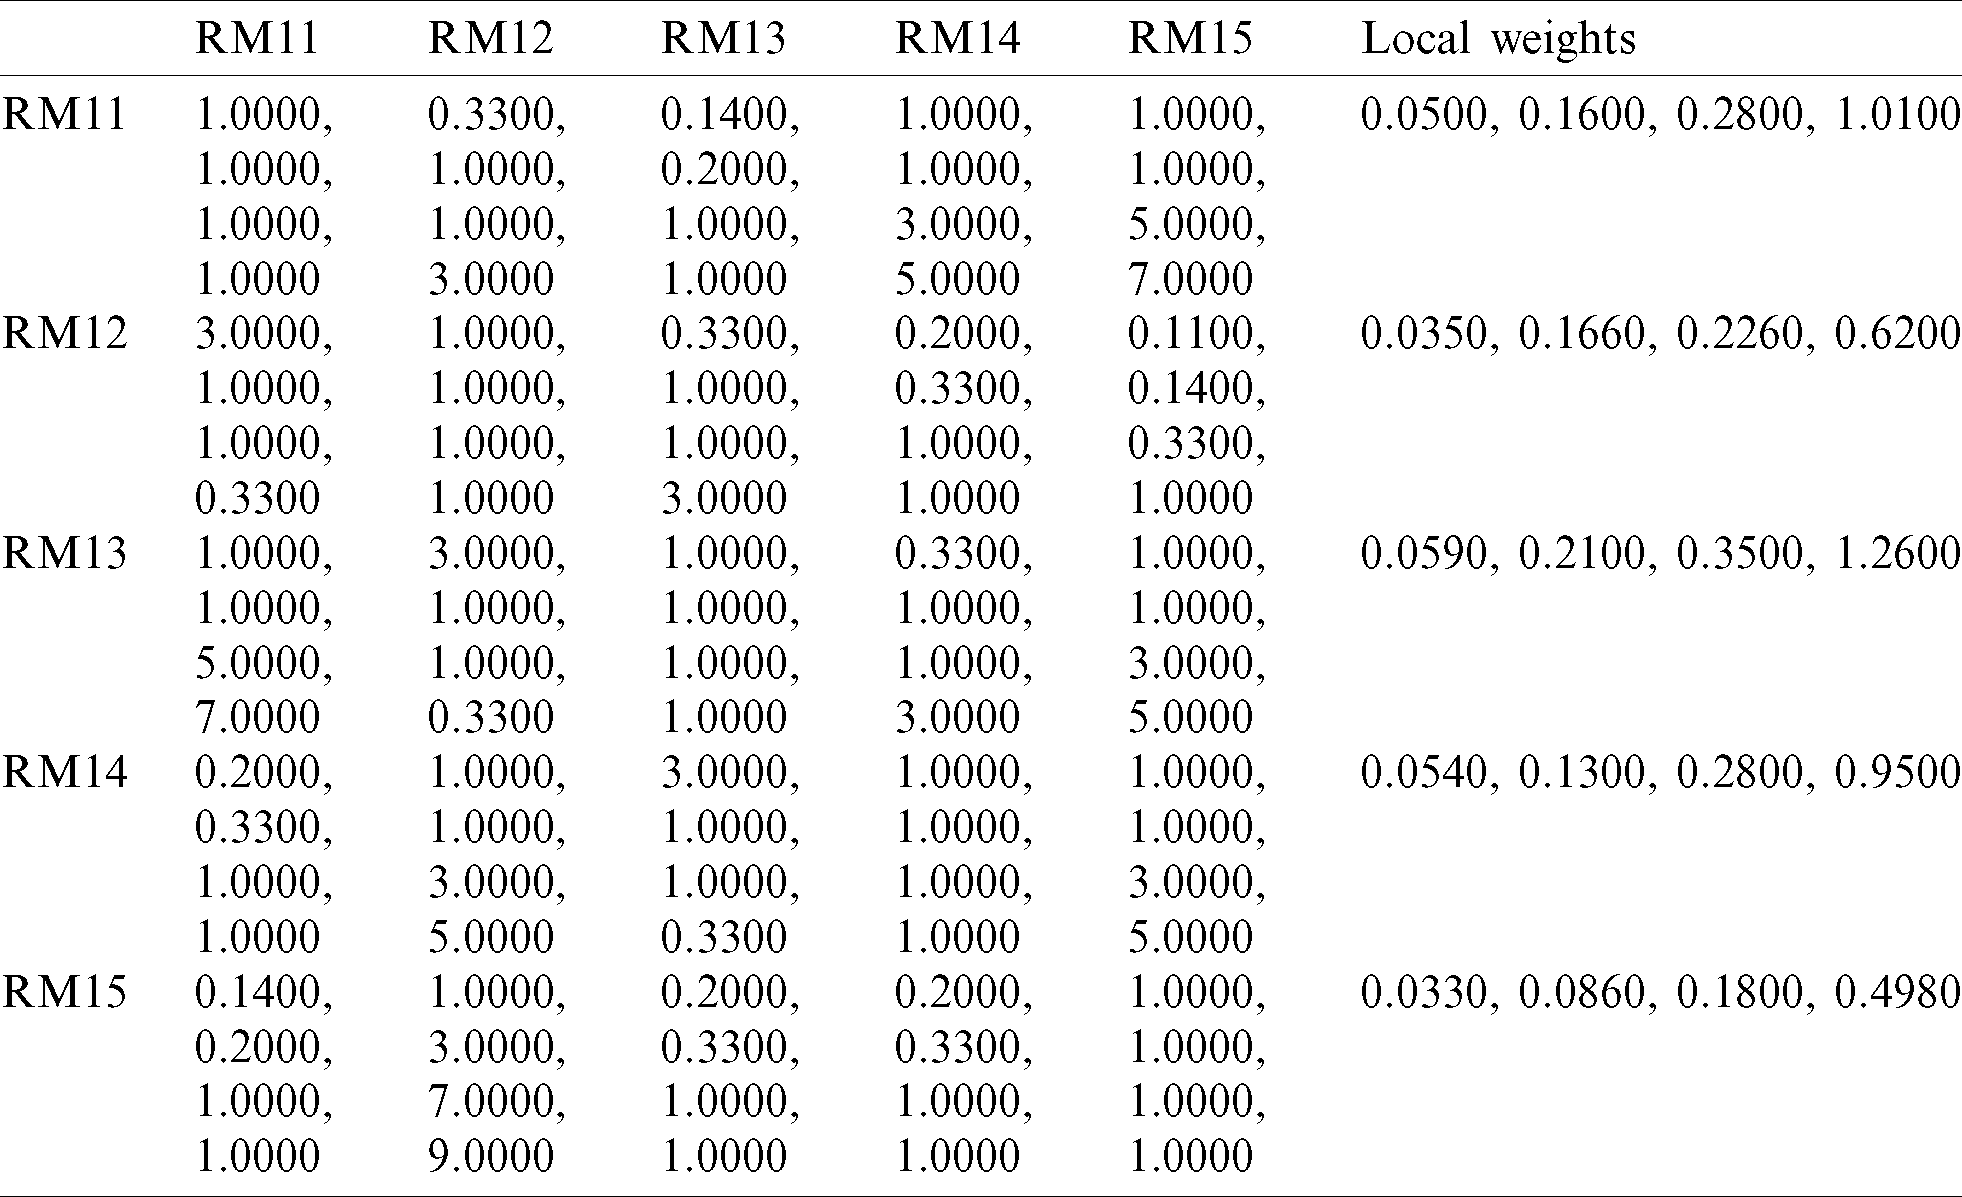
Table 6: Trapezoidal fuzzy pair-wise comparison matrix at level 2
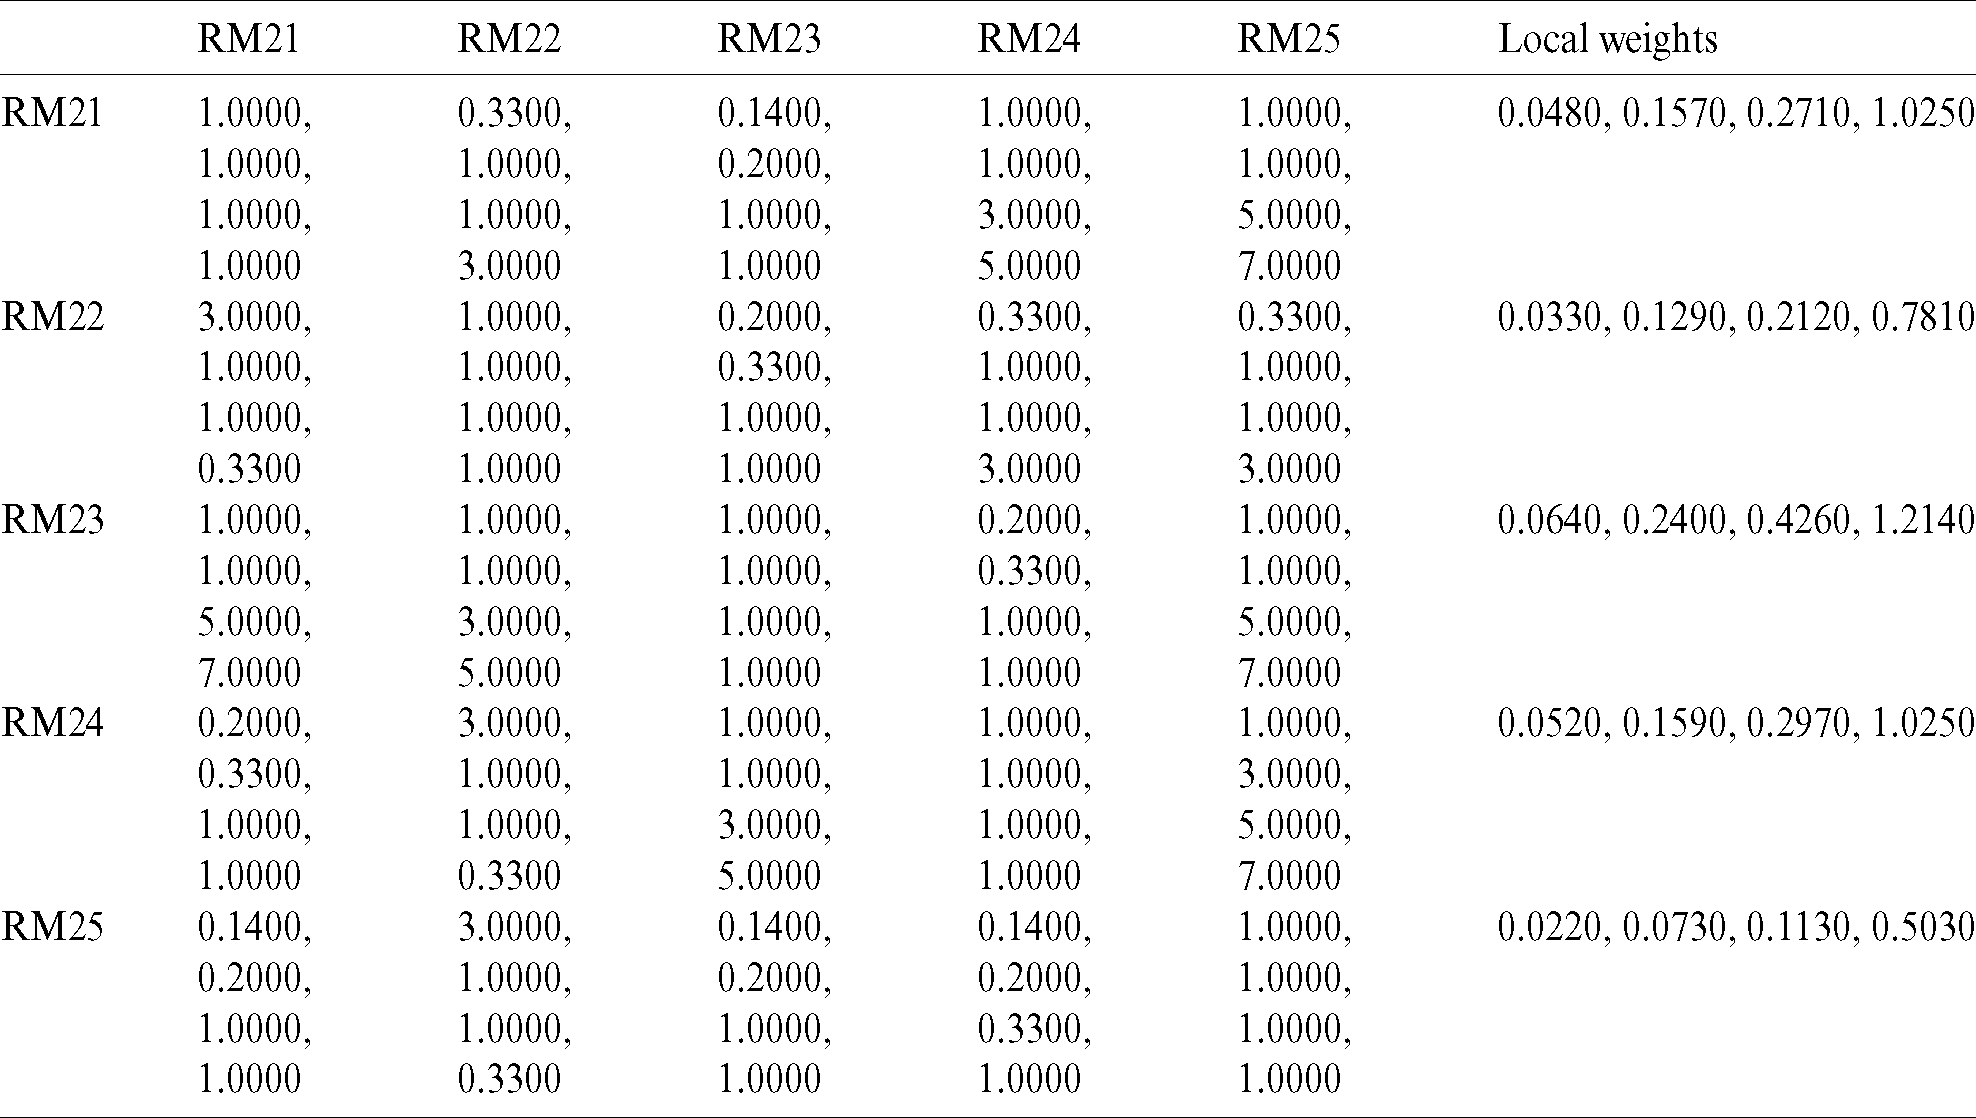
Table 7: Global weights through the hierarchy
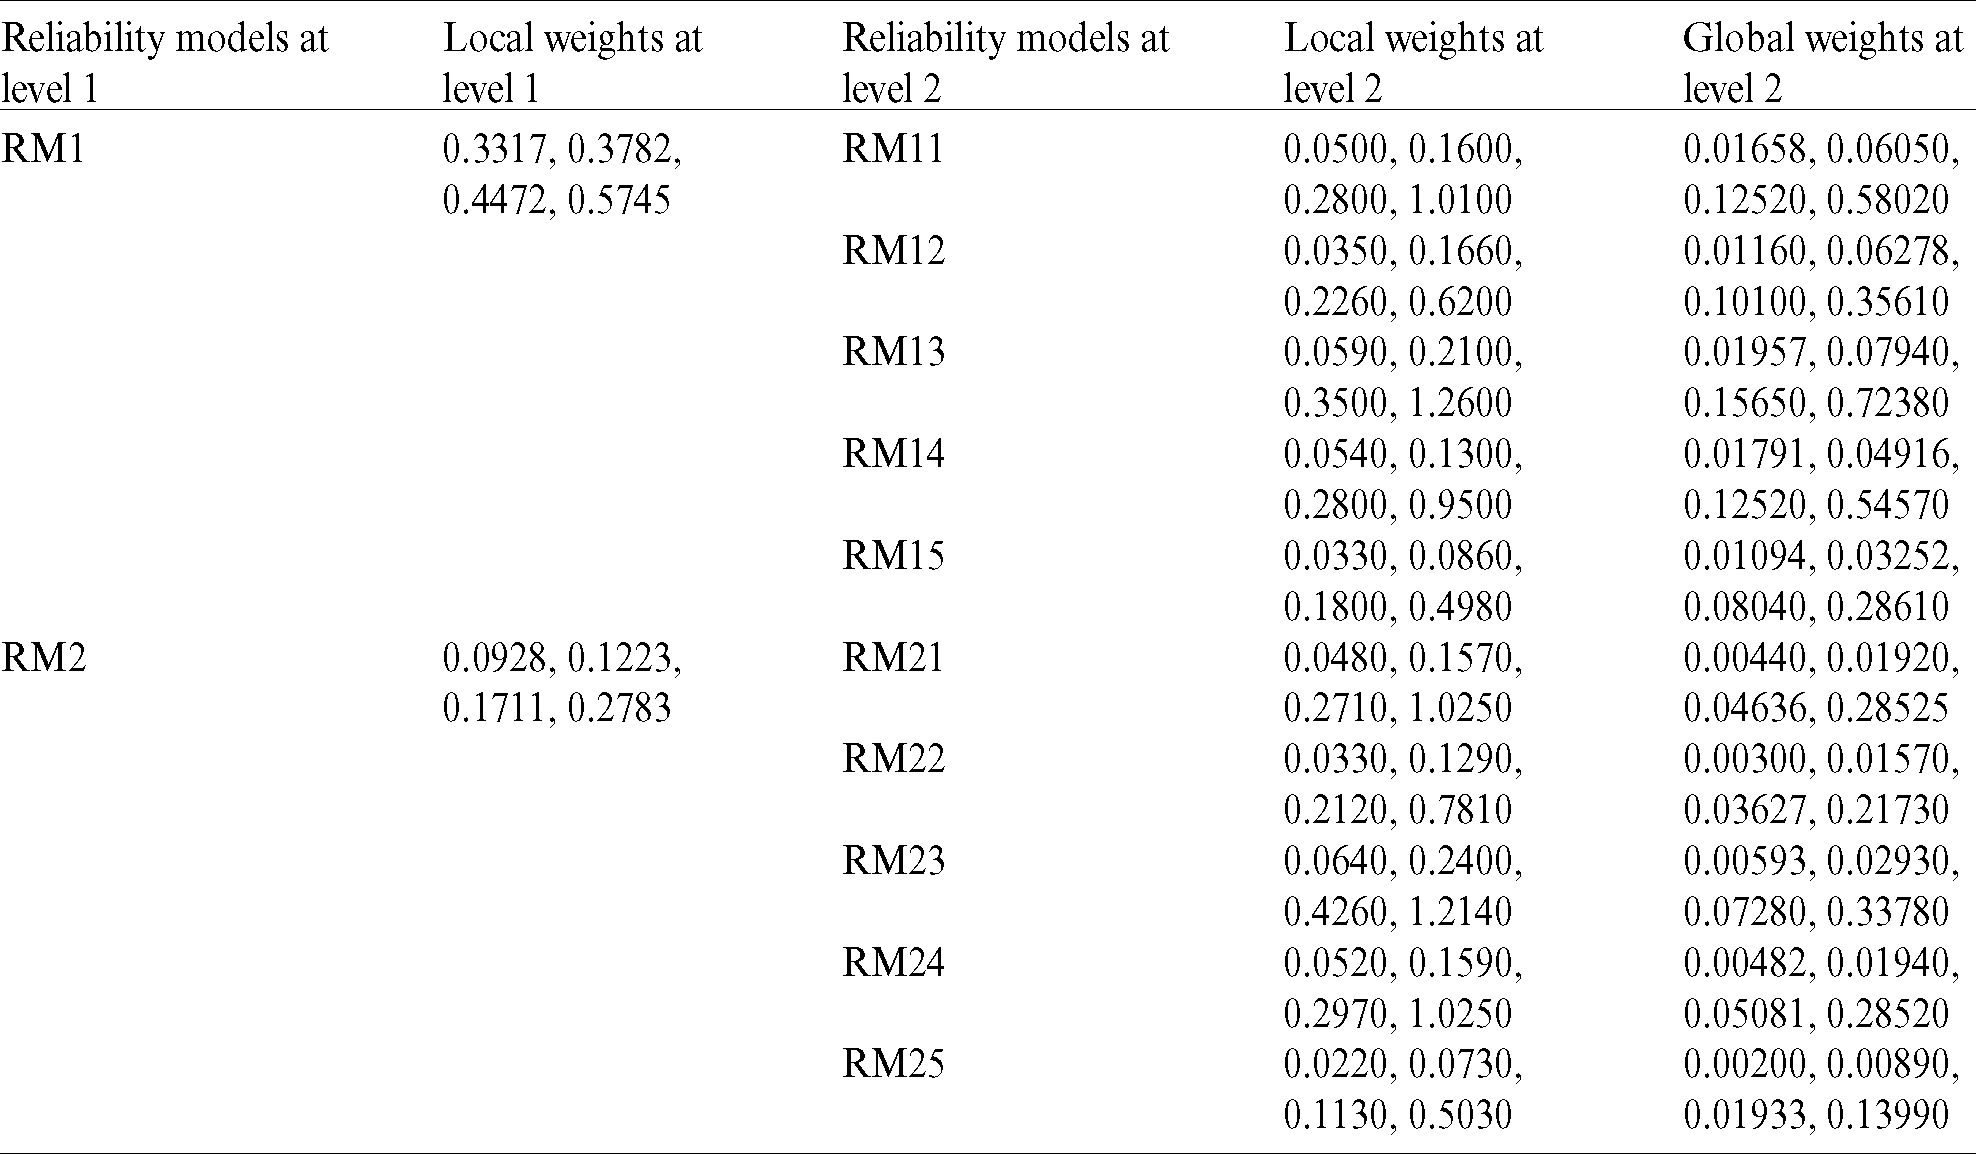
Table 8: Final weights of reliability methods of prediction at level 1
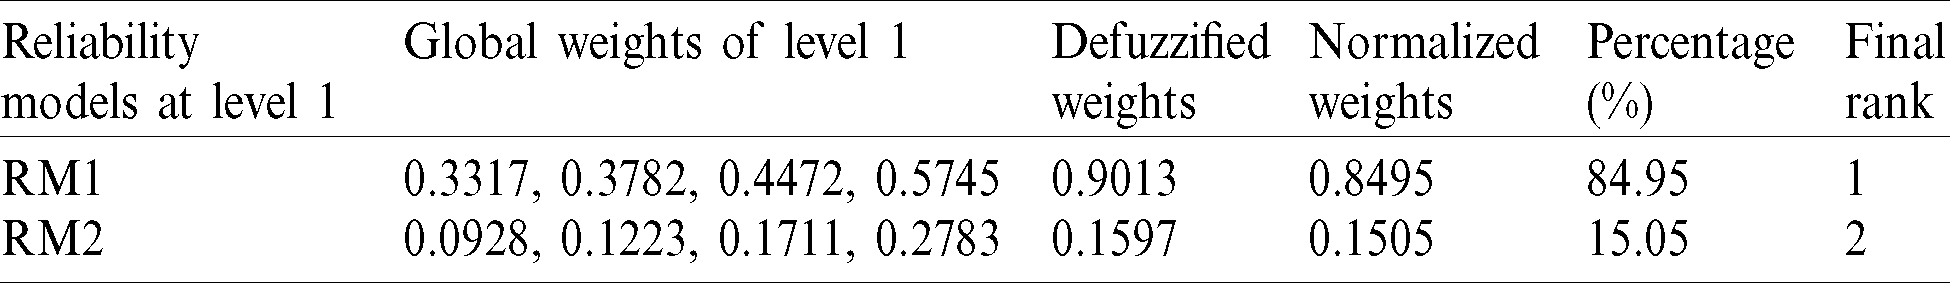
Table 9: Final weights of reliability methods of prediction at level 2
The alternatives A1, A2 and A3 here are chosen as different datasets from three different fields. A1 is John Musa Bell Laboratories failure dataset, A2 is MyLynn application bug report from Java software, A3 is Apache Lucene server failure dataset [3,18]. These three datasets are from different fields, hence the evaluation and assessment effect can be shown for different fields. In different alternatives, authors calculated the effect of reliability models after obtaining the final or dependent weights of prediction methods of reliability. Using Eqs. (1)–(5) and Step 10, the contributors to this research work, as shown in Tabs. 10 and 11, obtained inputs from the technical data of the three projects. From the Eqs. (16)–(18), the contributors derived the normalised fuzzy decision matrix and weighted the normalised fuzzy decision matrix, as shown in Tab. 12. From the Eqs. (19)–(26), the authors determined the relative closeness, as shown in Tab. 13.
Table 10: Subjective cognition outcomes of evaluators in linguistic terms
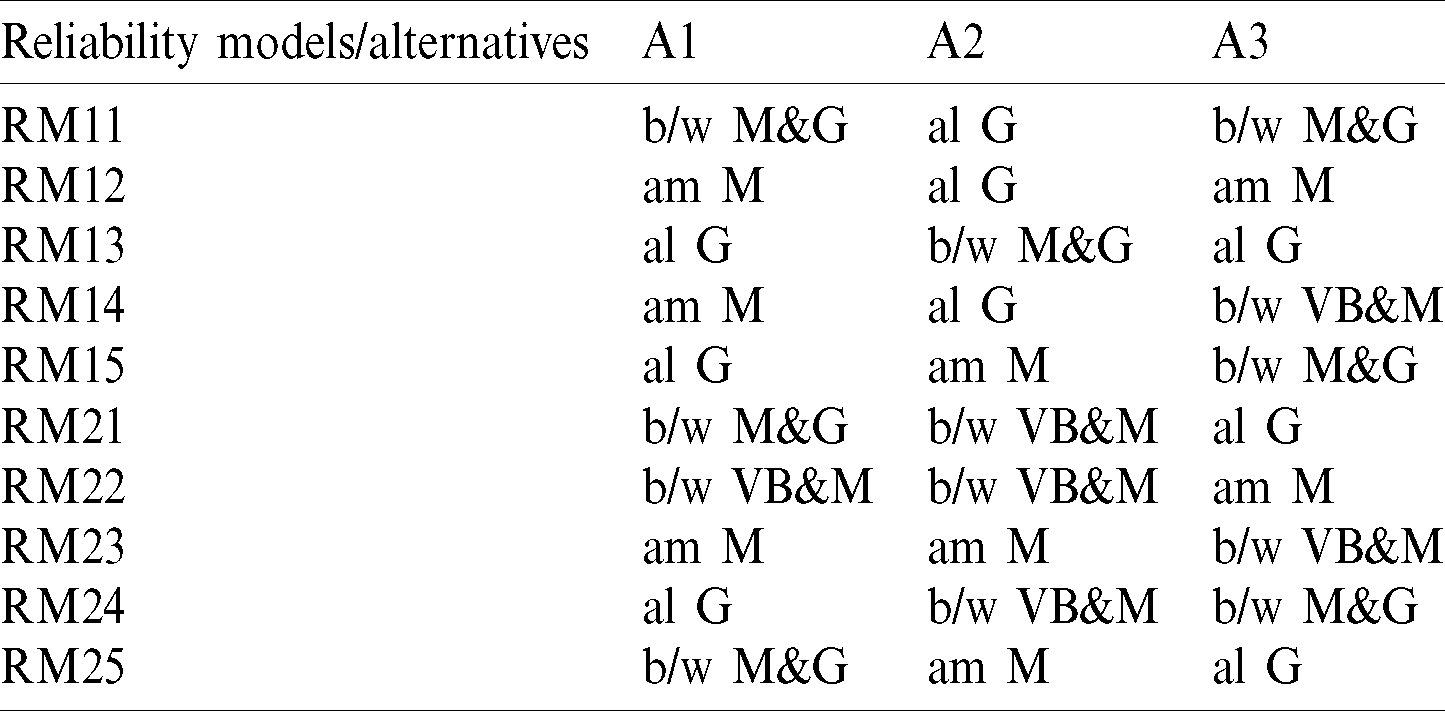
Table 11: Subjective cognition outcomes of evaluators in linguistic terms
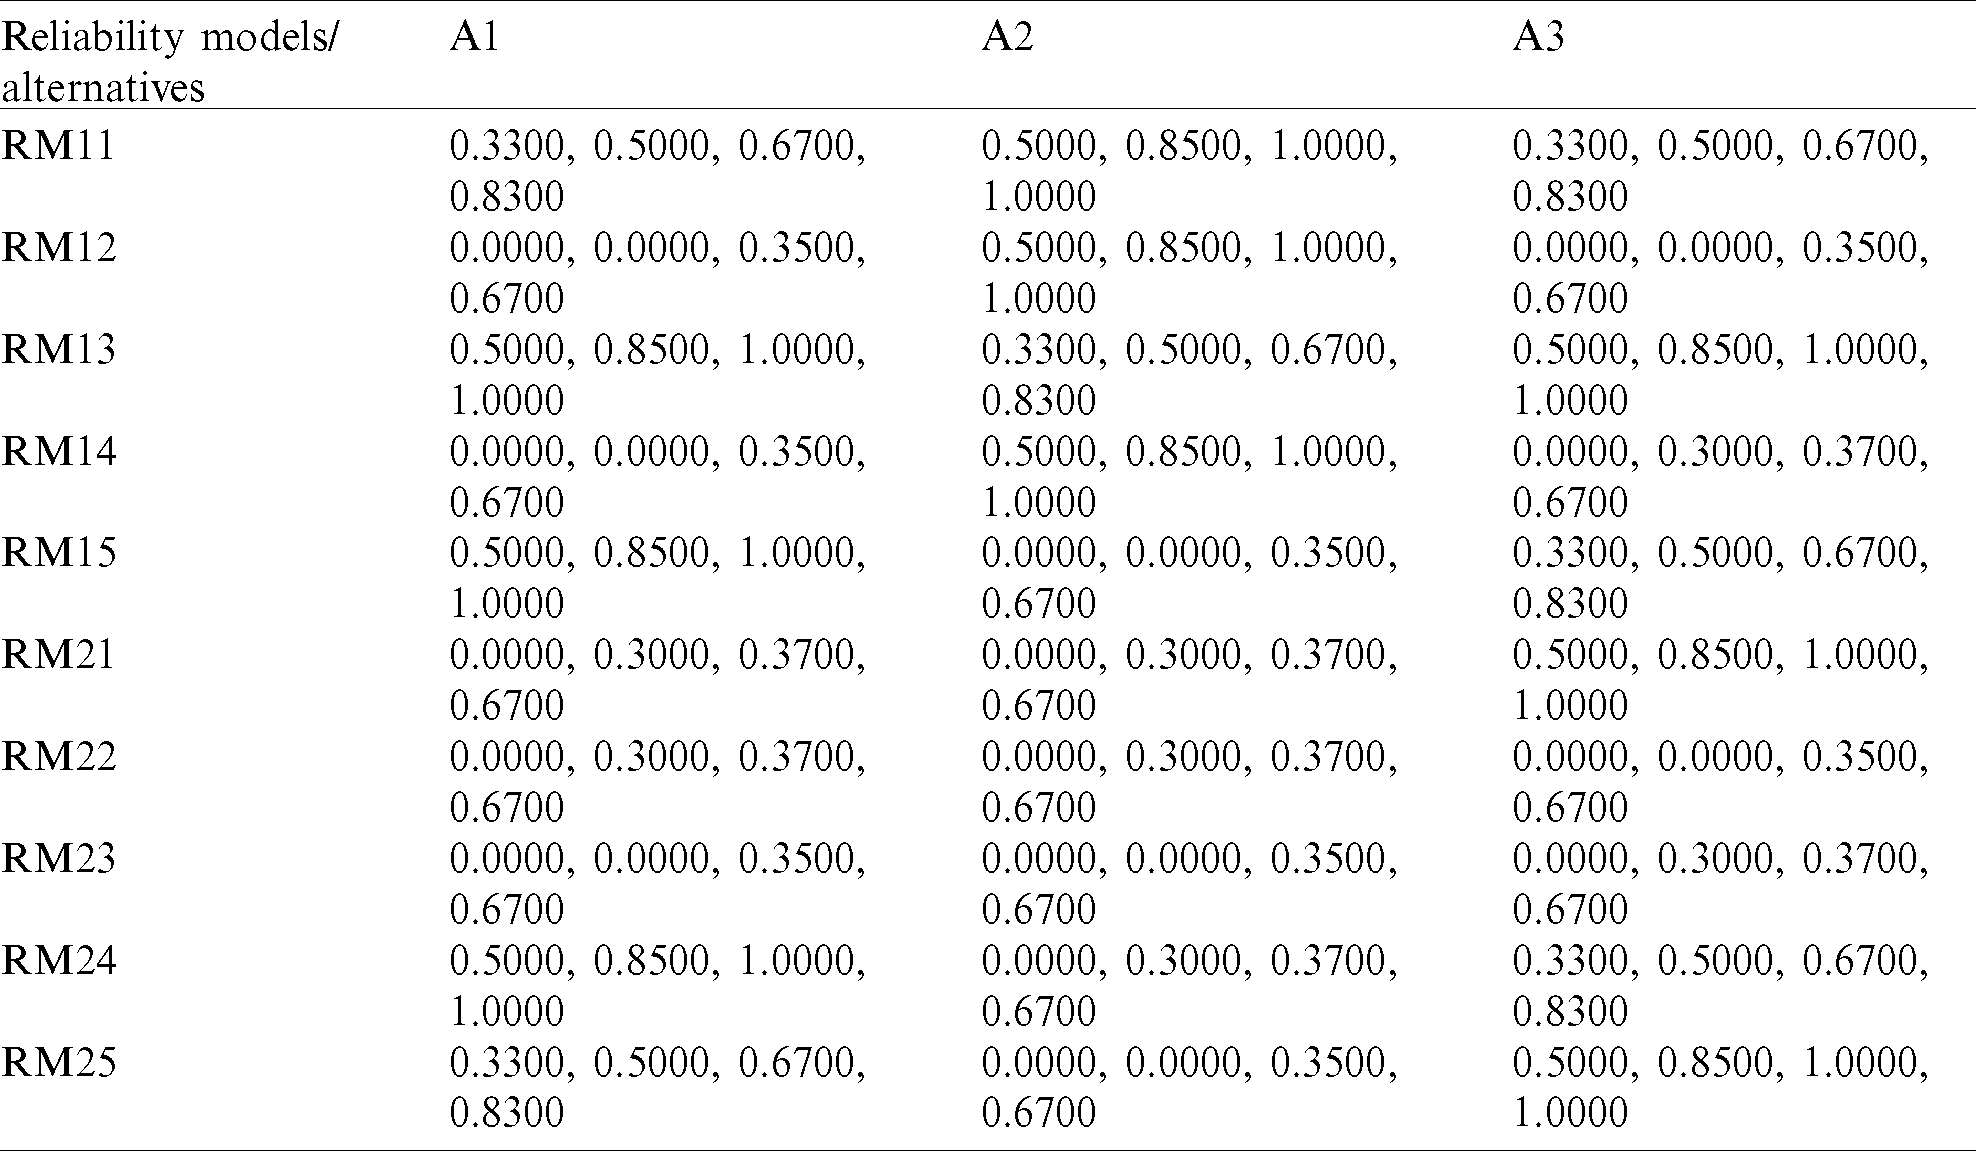
Table 12: The weighted normalized fuzzy-decision matrix
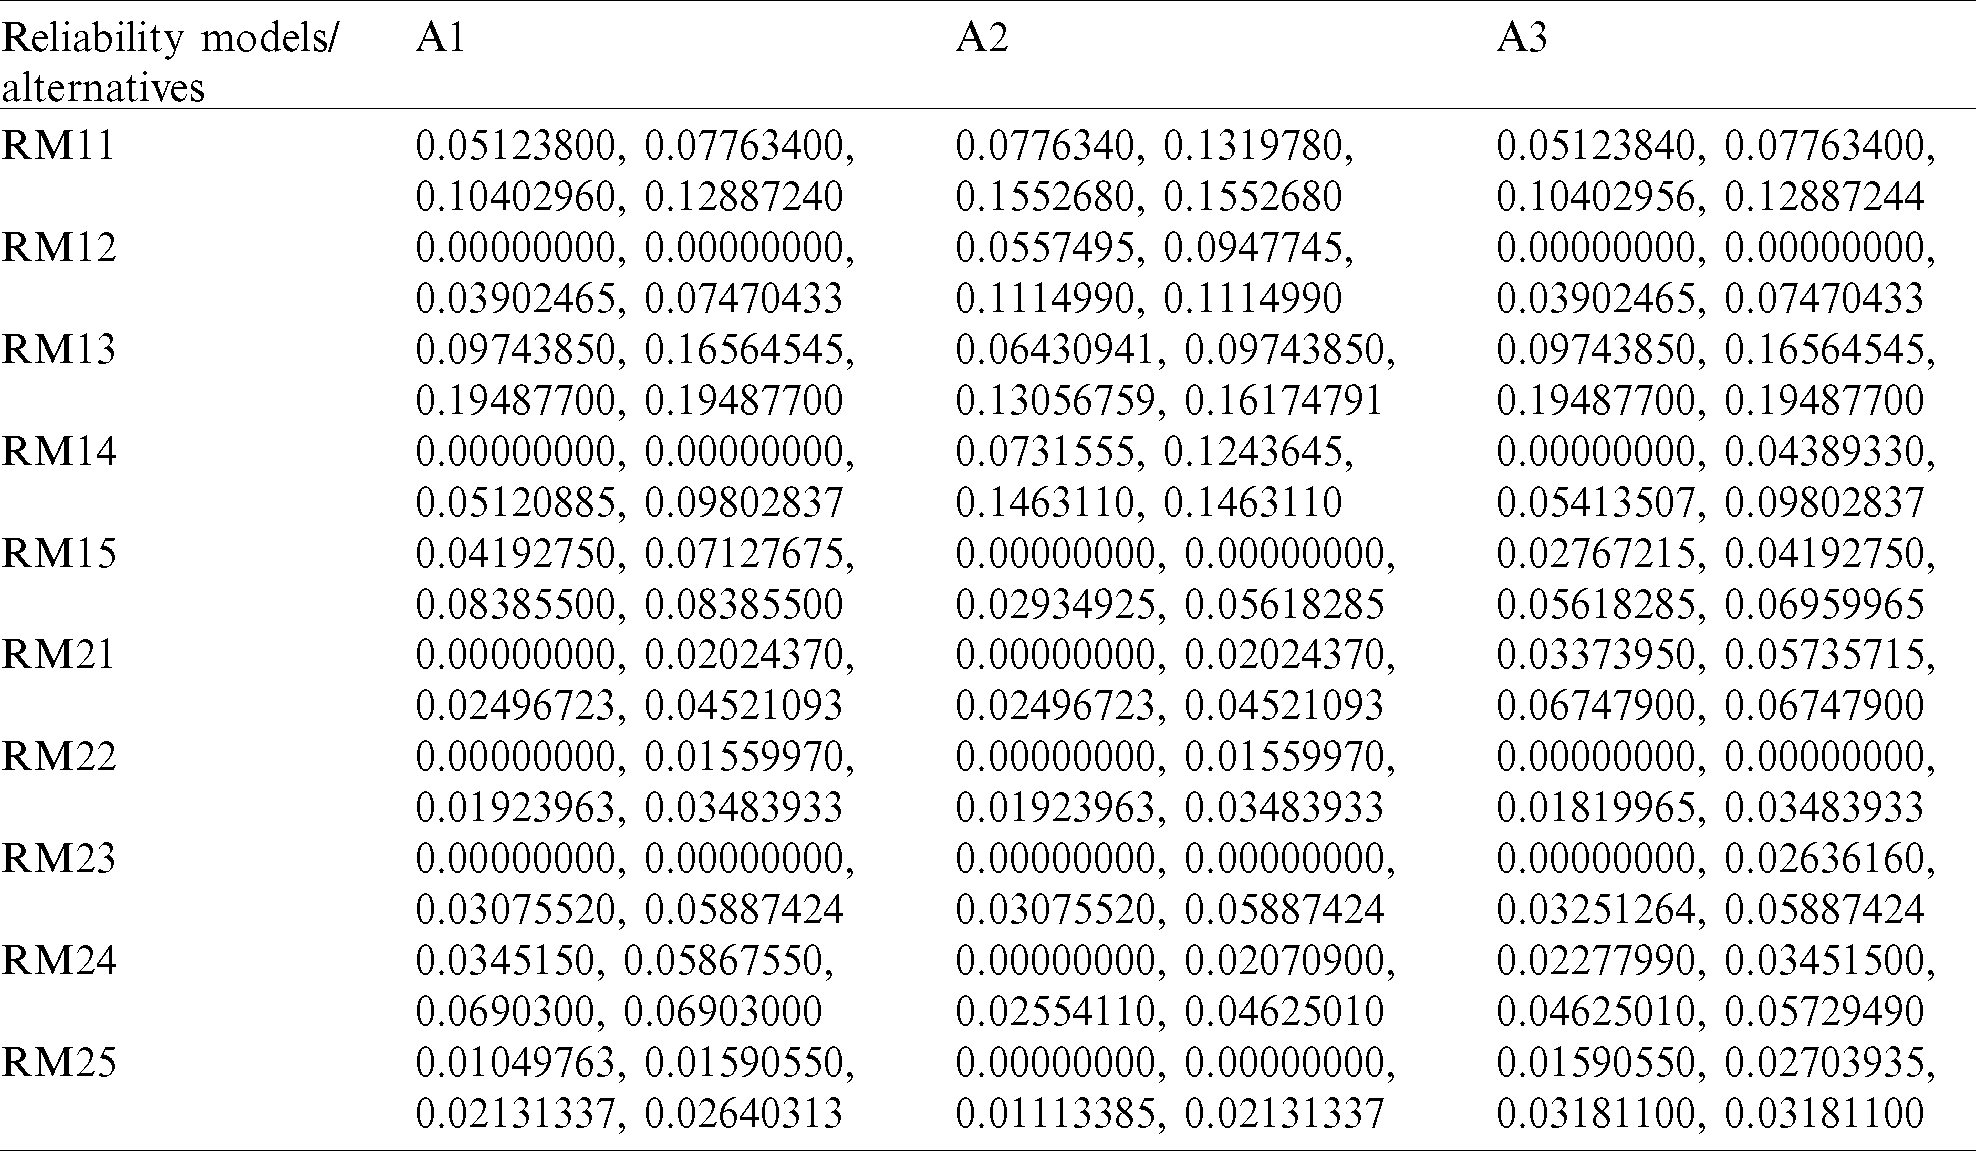
Table 13: Closeness coefficients to the aspired level among the different alternatives
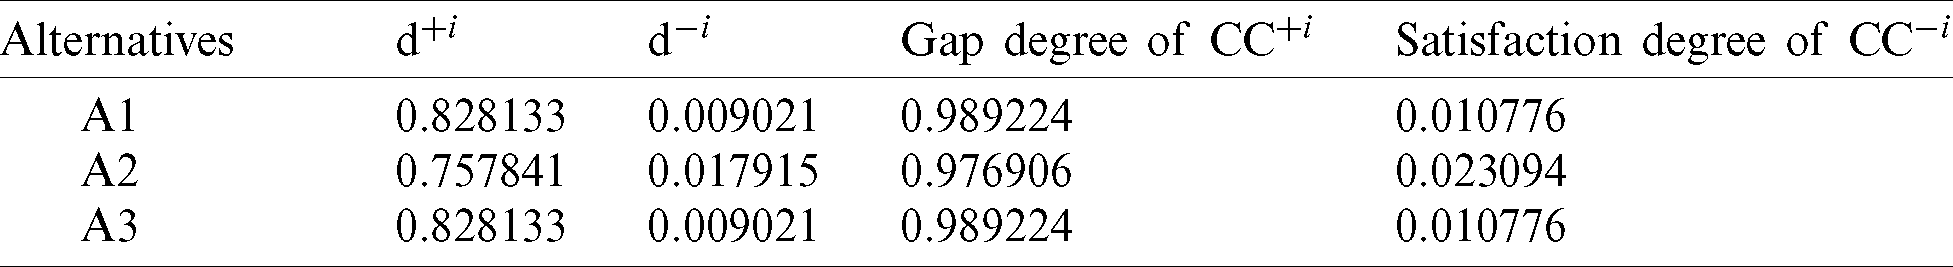
Alternatives are comparatively closer to one another, according to Tab. 13. The reliability of various alternatives is, therefore, in good shape, according to the case study. As per the values in Tab. 13, the alternative A1 performs extremely poorly in software reliability, while alternative A2 scores exceptionally well in software reliability. Therefore, the best alternative among the three alternatives is Alternative A2.
As observed by the experts, sufficient consistency is intertwined with acceptable reliability. Thus this partnership has made reliability the primary priority of the practitioners who are working on inventing mechanisms to achieve the desired target in this context. With the help of simple-to-use solutions that are uncomplicated, organizations can achieve acceptable efficiency. In this league, most of the technology firms embrace innovations that boost efficiency and reliability at the same time.
The main objective of this empirical analysis was to test the prediction models of software development for software reliability. The evaluation section of the paper integrates all the models of software reliability for evaluation in order to achieve the objective. In addition, the dataset alternatives showed the effect of the analysis on various datasets. For programmers, the results obtained will be useful in meeting the requirements of software reliability. In order to boost performance and users’ satisfaction during software development, this study will help in the easy and effective use of reliability management techniques. The excellent features of this research also include the following:
• The quality experts deserve a more concerted emphasis on reliability prediction models. This study proposes a direction for practitioners to gain insight into the trustworthiness model.
• The only way to achieve a successful outcome is numerical evaluation and assessment of different prediction models of reliability. The findings of the study establish that Neuro-fuzzy computing model is the most prioritized model for reliability prediction.
• Furthermore, this prioritization table can be a conclusive reference for achieving high reliability. The authors have assessed ten reliability prediction models in this study that can be used during the production of software.
In this paper, we took three alternatives from various databases of different scenarios and gathered the opinions of practitioners about the prediction models of software reliability. Data obtained from practitioners were compiled by Fuzzy AHP-TOPSIS. The conclusion and limitations of this work can be summarized as:
• Hesitant fuzzy sets are used at one location to minimize the hesitation of decision-makers and allow them to make reasonable decisions. The use of hesitant fuzzy sets in decision-making, on the other hand, makes computation complex. This can impact the end results as well.
• The data gathered in this study may be restricted to existing tools, which may be broadened according to the environment.
• There might be other software reliability prediction models that may have been ignored during this analysis.
• Fuzzy-AHP has been found to yield well-organized results instead of AHP. It thus emerges as a highly accurate procedure for estimating the prediction models for software reliability.
As a first landmark, this contribution portrays an evaluation outline to estimate the priority of reliability prediction models by using Hesitant-Fuzzy AHP-TOPSIS methodology. The most prioritized software reliability prediction model found across the framework and presented hierarchy is the Neuro-fuzzy computing model. Therefore, the findings clearly indicate that the developers should prioritize Neuro-fuzzy computing model to achieve stable and quality software.
Acknowledgement: The work is funded by Grant No. 12-INF2970-10 from the National Science, Technology and Innovation Plan (MAARIFAH), the King Abdul-Aziz City for Science and Technology (KACST), Kingdom of Saudi Arabia. We thank the Science and Technology Unit at Umm Al-Qura University for their continued logistics support.
Funding Statement: King Abdul-Aziz City for Science and Technology (KACST), Kingdom of Saudi Arabia.
Conflicts of Interest: The authors declare that they have no conflicts of interest to report regarding the present study.
1. K. Sahu and R. K. Srivastava. (2018). “Soft computing approach for prediction of software reliability,” ICIC Express Letter, vol. 12, no. 12, pp. 1213–1222. [Google Scholar]
2. A. L. Goel and A. L. Okumoto. (1979). “Time-dependent error-detection rate model for software reliability and other performance measures,” IEEE Transactions on Reliability, vol. 28, no. 3, pp. 206–211. [Google Scholar]
3. J. D. Musa and K. Okumoto. (1984). “A logarithmic Poisson execution time model for software reliability measurement,” in Proc. of the 7th Int. Conf. on Software Engineering, vol. 125, pp. 230–238. [Google Scholar]
4. S. Yamada, M. Kimura, H. Tanaka and S. Osaki. (1994). “Software reliability measurement and assessment with stochastic differential equations,” IEICE Transactions on Fundamentals of Electronics, Communications and Computer Sciences, vol. 77, no. 1, pp. 109–116. [Google Scholar]
5. X. Zhang and H. Pham. (2000). “An analysis of factors affecting software reliability,” Journal of Systems and Software, vol. 50, no. 1, pp. 43–56. [Google Scholar]
6. S. Aljahdali. (2011). “Development of software reliability growth models for industrial applications using fuzzy logic,” Journal of Computer Science, vol. 7, no. 10, pp. 1574–1580. [Google Scholar]
7. M. Bisi and N. K. Goyal. (2012). “Software reliability prediction using neural network with encoded input,” International Journal of Computer Applications, vol. 47, no. 22, pp. 975–8887. [Google Scholar]
8. R. Kumar, M. Zarour, M. Alenezi, A. Agrawal and R. A. Khan. (2019). “Measuring security durability of software through fuzzy-based decision-making process,” International Journal of Computational Intelligence Systems, vol. 12, no. 2, pp. 627–642. [Google Scholar]
9. T. L. Saaty. (2008). “Decision making with the analytic hierarchy process,” International Journal of Services Sciences, vol. 1, no. 1, pp. 83–98. [Google Scholar]
10. J. Rezaei. (2015). “Best-worst multi-criteria decision-making method,” Omega, vol. 53, no. 5, pp. 49–57. [Google Scholar]
11. B. Roy. (1968). “Classementetchoixenprésence de points de vue multiples (la méthode ELECTRE),” La Revue d’Informatique Et De Recherche Opérationelle, vol. 8, no. 16, pp. 57–75. [Google Scholar]
12. J. P. Brans and P. Vincke. (1985). “A preference ranking organisation method: The PROMETHEE method for MCDM,” Management Science, vol. 31, no. 6, pp. 647–784. [Google Scholar]
13. S. Opricovic. (2011). “Fuzzy VIKOR with an application to water resources planning,” Expert Systems with Applications, vol. 38, no. 11, pp. 12983–12990. [Google Scholar]
14. C. L. Hwang, Y. J. Lai and Y. T. Liu. (1993). “A new approach for multiple objective decision making,” Computers and Operational Research, vol. 20, no. 8, pp. 889–899. [Google Scholar]
15. Wikipedia Team, Multiple Criteria Decision Analysis, San Francisco, USA: Wikipedia-The Free Encyclopedia, . [Online]. Available: https://en.wikipedia.org/wiki/Multiple-criteria_decision_analysis, last visit Dec 17, 2020. [Google Scholar]
16. A. Agrawal, M. Alenezi, R. Kumar and R. A. Khan. (2020). “A unified fuzzy-based symmetrical multi-criteria decision-making method for evaluating sustainable-security of web applications,” Symmetry, vol. 12, no. 3, pp. 448–465. [Google Scholar]
17. K. Sahu and R. K. Srivastava. (2019). “Revisiting software reliability,” in Data Management, Analytics and Innovation, vol. 801. Singapore: Analytics and Innovation, Springer, pp. 221–235. [Google Scholar]
18. M. D’Ambros, M. Lanza and R. Robbes. (2010). “An extensive comparison of bug prediction approaches,” in 2010 7th IEEE Working Conf. on Mining Software Repositories, IEEE, Cape Town, South Africa, pp. 31–41, . [Online]. https://flosshub.org/sites/flosshub.org/files/31dambrosLanzaRobbes31.pdf. [Google Scholar]
19. K. Sahu, F. A. Alzahrani, R. K. Srivastava and R. Kumar. (2020). “Hesitant fuzzy sets based symmetrical model of decision-making for estimating the durability of web application,” Symmetry, vol. 12, no. 6, pp. 1770–1792. [Google Scholar]
20. Survey Team, IT Security Survey-2020. Grabenweg, Austria: AV-Comparatives, . [Online]. Available: https://www.av-comparatives.org/surveys/it-security-survey-2020/. [Google Scholar]
21. Computerworld UK Staff, Top Software Failures in Recent History, London, England: Computer World, . [Online]. Available: https://www.computerworld.com/article/3412197/top-software-failures-in-recent-history.html. [Google Scholar]
22. J. D. Musa. (2004). Software Reliability Engineering: More Reliable Software, Faster and Cheaper. New York, USA: Tata McGraw-Hill Education, . [Online]. Available: https://www.amazon.in/Software-Reliability-Measurement-Application-McGraw-Hill/dp/007044093X/ref=pd_sim_1?pd_rd_w=QYNHQ&pf_rd_p=def9013b-b86e-414f-aa85-3cd0c0e9d6df&pf_rd_r=F1207Y6MGR7102QQJRTZ&pd_rd_r=2d01a563-c8e0-4e5f-a5a2-e839710238a7&pd_rd_wg=R0mw8&pd_rd_i=007044093X&psc=1. [Google Scholar]
23. J. C. Wong. (2019). The Cambridge Analytica Scandal Changed the World but It didn’t Change Facebook, San Francisco, USA: The Guardian, . [Online]. https://www.theguardian.com/technology/2019/mar/17/the-cambridge-analytica-scandalchanged-the-world-but-it-didnt-change-facebook. [Google Scholar]
24. V. Torra. (2010). “Hesitant fuzzy sets,” International Journal of Intelligent Systems, vol. 25, no. 6, pp. 529–539. [Google Scholar]
25. S. Yamada, J. Hishitani and S. Osaki. (1993). “Software-reliability growth with a Weibull test-effort: A model and application,” IEEE Transactions on Reliability, vol. 42, no. 1, pp. 100–106. [Google Scholar]
26. B. Littlewood and J. L. Verrall. (1973). “A Bayesian reliability growth model for computer software,” Journal of the Royal Statistical Society: Series C (Applied Statistics), vol. 22, no. 3, pp. 332–346. [Google Scholar]
27. J. B. Durand and O. Gaudoin. (2005). “Software reliability modelling and prediction with hidden Markov chains,” Statistical Modelling, vol. 5, no. 1, pp. 75–93. [Google Scholar]
 | This work is licensed under a Creative Commons Attribution 4.0 International License, which permits unrestricted use, distribution, and reproduction in any medium, provided the original work is properly cited. |