DOI:10.32604/cmc.2021.014943
| Computers, Materials & Continua DOI:10.32604/cmc.2021.014943 | |
| Review |
A Comprehensive Review on Medical Diagnosis Using Machine Learning
1Lovely Professional University, Jalandhar, 144411, India
2College of Technical Innovation, Zayed University, Dubai, United Arab Emirates
3Department of Computer Science, King Saud University, Saudi Arabia
4Department of Computing and Mathematics, Manchester Metropolitan University, Manchester, M15 6BH, UK
5School of Computer Science and Engineering, Lovely Professional University, Jalandhar, 144411, India
*Corresponding Author: Jimmy Singla. Email: jimmy.21733@lpu.co.in
Received: 28 October 2020; Accepted: 14 December 2020
Abstract: The unavailability of sufficient information for proper diagnosis, incomplete or miscommunication between patient and the clinician, or among the healthcare professionals, delay or incorrect diagnosis, the fatigue of clinician, or even the high diagnostic complexity in limited time can lead to diagnostic errors. Diagnostic errors have adverse effects on the treatment of a patient. Unnecessary treatments increase the medical bills and deteriorate the health of a patient. Such diagnostic errors that harm the patient in various ways could be minimized using machine learning. Machine learning algorithms could be used to diagnose various diseases with high accuracy. The use of machine learning could assist the doctors in making decisions on time, and could also be used as a second opinion or supporting tool. This study aims to provide a comprehensive review of research articles published from the year 2015 to mid of the year 2020 that have used machine learning for diagnosis of various diseases. We present the various machine learning algorithms used over the years to diagnose various diseases. The results of this study show the distribution of machine learning methods by medical disciplines. Based on our review, we present future research directions that could be used to conduct further research.
Keywords: Diagnostic system; machine learning; medical diagnosis; healthcare applications
The outcome of a treatment could be affected due to mistakes made by clinicians in the diagnosis of a patient [1]. In a scenario of a diagnostic error, inappropriate treatment could be given where the patient would be deprived of the necessary care. Often the doctors are distracted by the features that seem important at the time, and thus make diagnostic errors [2]. The surrounding environment, and the tools used for diagnosis, can also lead to diagnostic errors [3]. All these mentioned factors could contribute to a significant adverse effect on the patient’s health, increase the overall medical expenditures, and cause psychological discomfort [4].
To enhance healthcare services, including minimization in diagnostic errors and providing patients with proper treatments, machine learning (ML) methods are being used to assist the clinicians in making decisions. Moreover, a vast increase in the availability of medical data and technological advancements to store and process the data is another reason that has led to the adoption of ML in healthcare. ML allows computer systems to learn from past experiences, and thus improves the overall efficiency of the programs [5]. The Mathematical model uses past experience for the optimization of the parameters that infers from the representative data [6]. This use of past data is different from conventional approaches in which a programmer explicitly programs the entire model using rules. Precisely, in ML, the model is fed with training data consisting of both the predictors (i.e., the input features) and target (i.e., the output). The model then learns the mapping from predictors to the target and generalizes it to perform even on unobserved data. This process of disease diagnosis using ML is represented in Fig. 1.

Figure 1: The process of applying machine learning in disease
ML is used in the treatment of patients [7], as well as prognosis and diagnosis [8]. It is used in various tasks in the medical disciplines such as drug discovery [9], assisting surgeons in complex surgeries [10], to interpret medical images with high efficiency [11], and even providing an alternate opinion using electronic health records (EHR) for predictions [12]. Although ML can provide results with high accuracy in performing various medical tasks, including medical diagnosis, and assisting clinicians in making informed decisions, however, it cannot replace a human clinician or a doctor.
The significant contribution of this paper includes a comprehensive review of the use of ML in medical diagnosis. Various ML algorithms used in medical diagnosis are described. The results of this study provide trends in diagnosis of various diseases using machine learning, and challenges, and future research directions.
This paper is organized as follows. Section 2 provides a review of ML used in diagnosis and an overview of various ML methods. In Section 3, discussion and future research directions are provided. The conclusion is presented in the final section.
2 Machine Learning in Medical Diagnosis
Various ML methods have been used for diagnosis of various diseases. The following section summarizes articles with respect to ML methods.
2.1 Artificial Neural Network (ANN)
ANN is inspired by the human brain structure that uses neurons for processing [13,14]. The simple structure of ANN is represented in Fig. 2. ANN can be used to solve the complex mathematical task, a large signal processing, or even parallel computations [15,16].
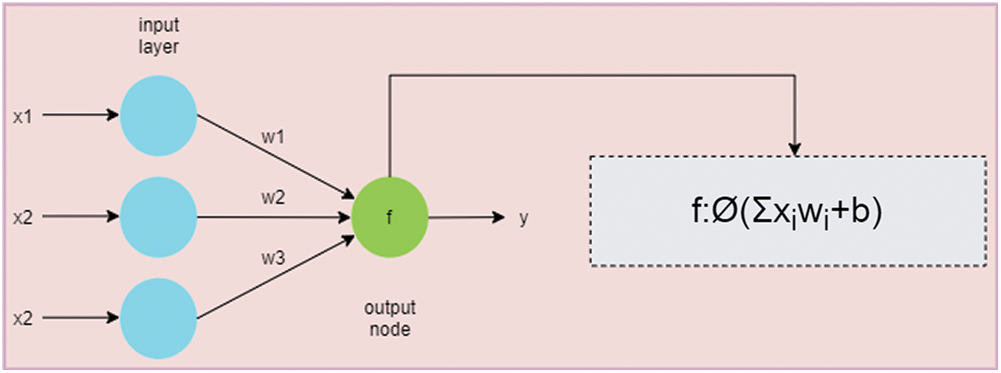
Figure 2: An overview of a simple artificial neural network. The green node is the output node that calculates the summation of products of weights (i.e., w1, w2, and w3) and inputs (i.e., x1, x2, and x3). The activation function is then applied to produce the output
Due to the complexity in identifying symptoms of urinary tract infection (UTI), Ozkan et al. [17] developed a model using ANN to improve the diagnostic performance of UTI. This system could classify between cystitis and urethritis using clinically available data. Moreover, they reported that invasive and costly methods can be avoided using ML methods.
Diagnosing pediatric traumatic brain (TBI) injury is challenging. Therefore, Chong et al. [18] attempted to study the feasibility of using ML for moderate to severe prediction of TBI. According to their study, head injury mechanism and clinical data can be used as input to develop a feasible ML model for diagnosis of TBI injury.
Diarrhea is one of the leading causes of death worldwide, Abubakar et al. [19] presented a model to predict the incidence of diarrhea. The proposed method is based on ANN and it can be helpful in prevention of diarrhea. This system has achieved an accuracy of 95.63%.
2.2 Deep Artificial Neural Network (Deep ANN)
Deep ANN model is represented in Fig. 3. This model learns through multiple levels of representation to find complex relationships among data [20,21]. ‘Deep,’ in deep ANN, stands for consecutive layers of representation [22]. Asaoka et al. [23] compared various ML methods to classify between healthy and unhealthy glaucoma patient. This study suggested that early detection of glaucoma is possible using deep feed forward neural network (FNN) with the area under curve (AUC) value of 92.6%.
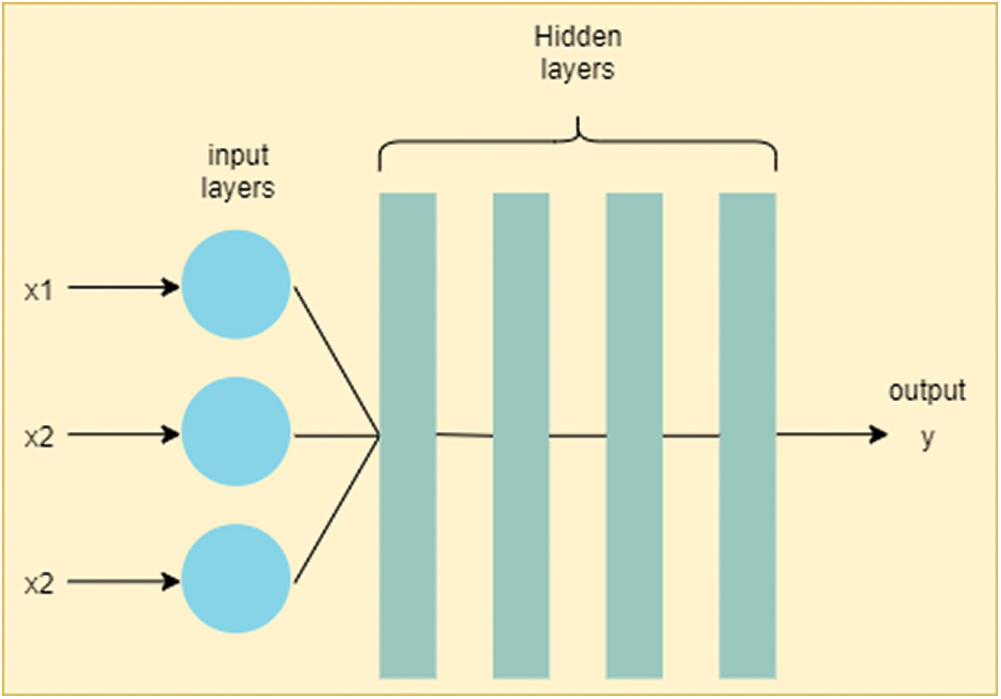
Figure 3: Deep artificial neural network (deep ANN). The difference between ANN and deep ANN is in the number of hidden layers. As deep ANN has a greater number of hidden layers, it is more generalizable comparative to simple ANN
It is essential to prioritize between critically ill and stable patients for emergency departments. Raita et al. [24] developed a deep learning (DL) based model to predict the critical care outcome. The model uses clinical and demographic data for better optimization of resource utilization. This model has achieved better performance as compared to the traditional emergency severity index used for prioritization of patients.
Wang et al. [25] provided a model to predict renal dysfunction. The proposed model can minimize the chances of adverse consequences with early prediction of renal dysfunction.
BC uses probabilistic modeling techniques for representation of variables and conditional dependencies among them [26]. Tree Augmented Naïve Bayes [27] and Naïve Bayes (NB) [28,29] are two important types of BC.
The diagnosis of any disease affecting the cardiovascular system is a complex task. In this context, Elsayad et al. [30] designed a system to assist physicians in reducing errors in the diagnosis of the cardiovascular diseases. This system is based on BC and it is more effective as compared to SVM.
2.4 Classification and Regression Tree (CART)
CART algorithm can handle raw data that can process continuous and nominal attributes as targets [31]. It can be used to avoid overfitting [32] and handle multivariate datasets [33]. It can also improve classification accuracy [34].
Maghooli et al. [35] studied the use of the CART algorithm to classify between different classes of Erythmato-Squamous Diseases (ESD). The results of the study were compared with other state-of-the-art methods and showed significant accuracy using CART.
Aljaaf et al. [36] examined various ML models for the early prediction of chronic kidney diseases. The authors coupled ML with predictive analytics to determine useful predictors. From their study, out of the 24 predictors, they found that 30% of them useful. Hence, they concluded that predictive analytics could be beneficial in diagnosis along with ML.
2.5 Convolution Neural Network (CNN)
CNN is a DL model [22]. It is specially designed to work with images [37]. It can recognize handwriting [38], handle small datasets as well as overfitting [39], or can even deal with noisy images [40], etc. An overview of a CNN structure is represented in Fig. 4.

Figure 4: An overview of a typical convolution neural network (CNN). It consists of two parts: Feature learning and Classification. Feature learning consists of multiple layers of convolution and pooling (also called subsampling layer) layers. The Classification consists of flatten layer, and one or more layers of a fully connected neural network. The last layer is the output layer in multiclass classification, in which the green circle is the output predicted by the algorithm
Pneumonia is one of the leading causes of death among children. Nahid et al. [41] proposed a model that uses image processing methods and CNN on X-rays to detect pneumonia. This model achieved 97.92% accuracy. In another study, Stephen et al. [42] proposed the diagnosis of pneumonia by designing CNN model. They used data augmentation methods instead of transfer learning to obtain a large amount of training data. They claimed that the resulting method achieved noteworthy accuracy.
Diagnosing esophageal cancer at an early stage is necessary as its prognosis is complex. Therefore, Horie et al. [43] exhibited the ability of CNN in diagnosing it. As an input to the model, they made use of endoscopic images and achieved 98% accuracy in diagnosing cancer at an early stage.
Islam et al. [44] designed a CNN based model to diagnose alzheimer’s disease. The proposed model could perform the multi-class classification of alzheimer’s disease. The authors stated that this model could help in the early diagnosis of alzheimer’s disease and it could also prevent damage of brain tissue in patients.
Kong et al. [45] proposed a model for early detection of acromegaly disease. The proposed model uses CNN approach and it has achieved remarkable results with high sensitivity and high specificity. In the literature, it is reported that the identification of nail diseases is challenging. Therefore, Nijhawan et al. [46] proposed a CNN based model that could diagnose nail diseases with 84.58% accuracy rate. The proposed model could differentiate between thirteen different nail diseases using nail images.
COVID-19 has been declared as an epidemic disease of the year 2020. As of when this paper is being written, no vaccine has been found to cure it. Therefore, early identification of COVID-19 becomes necessary. In this regard, Elaziz et al. [47] proposed a CNN based method to detect COVID-19 using chest x-ray images. The proposed method could help in its early diagnosis with comparatively less cost.
2.6 Deep Convolution Neural Network (Deep CNN)
With a deeper network, at each layer, the network learns new patterns of the input images. Thus, it increases its applicability in medical imaging [48,49].
Periodontitis is a common dental disease arising due to poor dental hygiene. Krois et al. [50] applied deep CNN on dental radiographs to detect periodontal bone loss. Due to the high complexity in detection of periodontitis, the authors conclude that ML-based models could minimize the efforts.
Murakami et al. [51] developed a novel method to identify bone erosion in rheumatoid arthritis patients. The method-using deep CNN was able to detect even fine lesion changes; thereby it may assist radiologists in finding changes in radiographs.
The decision tree is represented in Fig. 5a. It is a predictive technique that derives conclusions (in leaves) from observations (in branches) [52,53]. Although DT cannot handle missing, inappropriate features, or even uncertainties in its conventional form but it could still overcome using certain extensions to it [54].
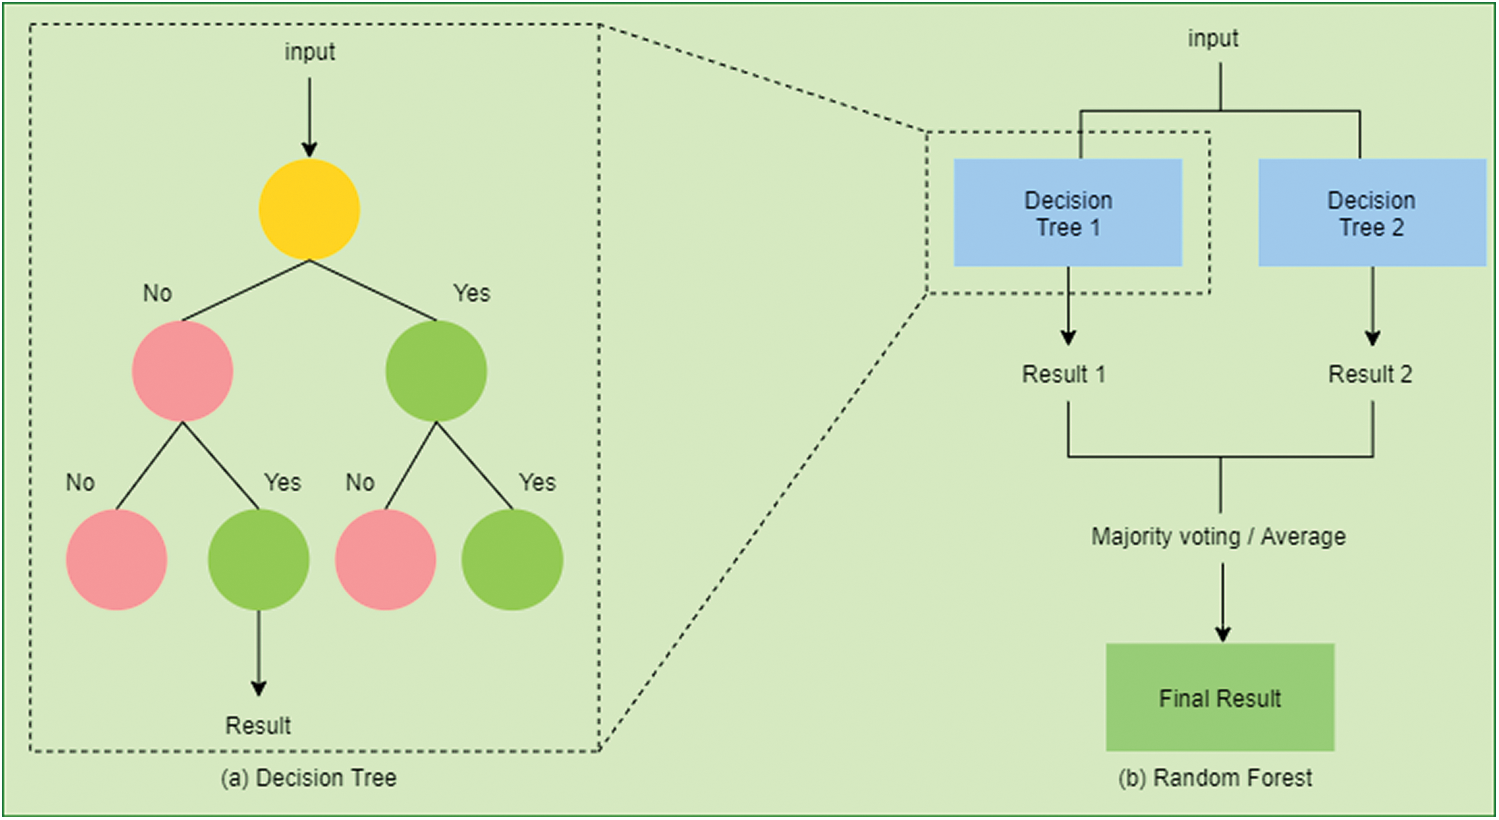
Figure 5: (a) An example of a decision tree (DT). To predict a class label in DT we start from the root of the tree. On the basis of the comparison with the root node, we follow the branch corresponding to the outcome from the comparison. Similarly, we navigate through the entire tree until we reach the leaf node that predicts the outcome. (b) An example of a random forest (RF). It consists of many decision trees constructed on the data sample. It gets the result from all the decision trees and then selects the one based on majority voting
It is a well-known fact that the treatment of the thyroid is a long term process. Ionita et al. [55] analyzed the efficiency of ML methods to diagnose and classify the thyroid. DT provided an accuracy of 97.35% on clinical data. The authors compared the results with other ML methods and found DT to be the most efficient method.
GB is a predictive modeling method formed with an ensemble of weak predictors [56]. It uses the idea of converting weak learners into good ones [57].
Than et al. [58] improved the diagnosis of myocardial infarction using a proprietary algorithm that incorporates GB. They reported that variations in concentrations of cardiac troponin based on age, sex, and time could improve the risk assessment for patients.
2.9 eXtreme Gradient Boosting (XGBoost)
XGBoost is based on gradient boosted DT [56]. It is based on an ensemble learning technique. They are currently dominating most of the other ML algorithms due to their ability to scale efficiently using minimum resources [59–61].
Taylor et al. [62] developed a model to predict the urinary tract infection (UTI). Conventional methods take more than 24 hours to give a complete report. Thus, ML based models are required for automated diagnosis of UTI. This work uses XGBoost to accurately diagnose UTI.
Tian et al. [63] proposed a method using XGBoost for Hepatitis B surface antigen (HBsAg) seroclearance prediction. Clinical and demographic data are used in this model. This work has achieved better performance as compared to other ML methods.
With increasing mortality among patients with COVID-19 as of mid-2020, it becomes significant to diagnose patients at high risk. Yan et al. [64] proposed an XGBoost based method to predict a high-risk patient. The proposed method could predict mortality 10 days in advance with more than a 90% accuracy rate.
RF uses the ensemble method. It constructs multiple DT and then outputs the result using a majority voting technique in case of classification or takes the average of all DT in case of regression [65]. Fig. 5b presents a random RF. It can avoid overfitting and achieve a higher accuracy rate due to its randomness [66].
Ganggayah et al. [67] proposed a method using RF to identify various factors for breast cancer survival rate. The method could identify various factors such as the stage of cancer and the size of the tumor. This work has achieved 82.7% accuracy and it is better as compared to the conventional methods.
Zou et al. [68] studied and compared various ML methods for prediction of diabetes. Diabetes might cause several complications in patients. Thus, the study used principal component analysis (PCA), minimum redundancy, and maximum relevance (mRMR) for feature reduction and RF method for classification. The method achieved the best accuracy rate as compared with other ML methods. An attempt was made by Samant et al. [69] to diagnose diabetes using retinal images. Their proposed novel model achieved a significant accuracy rate.
Wu et al. [70] developed a model to predict and classify fatty liver disease (FLD). The developed model could assist physicians in classifying and managing high-risk patients of FLD. This model used RF for classification and prediction with minimum inputs.
Leha et al. [71] studied the effectiveness of using ML methods for prediction of pulmonary hypertension (PH). This is an effective method for prediction of PH. The authors stated that the use of ML could require minimum clinical and echocardiographic parameters as compared to conventional methods for prediction.
2.11 Support Vector Machine (SVM)
SVM is represented in Fig. 6. As many hyperplanes are available, the main aim of SVM is to find a hyperplane that has a maximum distance between the features of the present classes [72–74]. Although SVM is a supervised algorithm but in the case of unlabeled data, Support Vector Clustering could be used [75].

Figure 6: Support Vector Machine (SVM): (a) shows a random number of hyperplanes (b) SVM chooses optimal hyperplane with a maximum distance between features of both the classes
Thangaraj et al. [76] designed a classifier for predicting the presence or absence of glaucoma. The classifier uses PCA for feature extraction from retinal images and SVM for classification. The authors concluded that the proposed classifier could achieve better accuracy as compared to other state-of-the-art methods for glaucoma detection.
Due to the complexity of bone structures, Singh et al. [77] proposed a diagnostic system to automatically detect osteoporosis. Based on SVM, this system could be inexpensive and this kind of system is largely available than conventional methods. As the time complexity of this system is reported as low, it could be used in real-time applications as well.
Kidney disease in later stages could result in its failure gradually. In this regard, Ahmad et al. [78] developed a system that could help in the early diagnosis of kidney disease. The system is built using SVM and it could improve the decision making process of determining the chronic condition of kidney disease.
Sady et al. [79] introduced a technique that uses the SVM method with RBF kernel to predict mortality in patients having chagas disease. Their study finds that use of features extracted from time-frequency and symbolic series of heart rate variability along with clinical data are good predictors of death.
Hsu et al. [80] proposed a ML-based model to identify stenosis of the extracranial and intracranial arteries. The proposed SVM model achieved better accuracy and sensitivity, as compared to conventional methods.
Influenza incurs high spending because of the high rate of false positives of the tests. To minimize the high expenses, Marquez et al. [81] proposed the first model for prediction of influenza. The proposed model uses the SVM model and achieves an accuracy rate of more than 90%.
Hameed et al. [82] developed a system to automatically classify skin lesions. The developed system used quadratic SVM that could classify between six classes of skin lesions. Additionally, the proposed model achieved an accuracy rate of 83%.
As the chances of mortality can increase due to cardiovascular diseases, it becomes necessary to diagnose it in early stages. Louridi et al. [83] proposed a method for improving the accuracy of heart disease prediction. The authors conclude that using mean values in place of missing values improves the overall performance of the model. In another article, written by Ali et al. [84], a novel method was introduced to predict heart failure. This novel method uses stacked SVMs and achieved 3.3% of higher accuracy as compared to traditional SVM.
Metabolic syndrome poses a high chance of prevalence of diabetes mellitus and heart diseases. Therefore, Alavijeh et al. [85] proposed a method for prediction of the metabolic syndrome. The proposed method is the first one that uses SVM to achieve better results as compared to DT.
Augmenting two or more machine learning algorithms is called a hybrid algorithm. They can solve problems that the individual algorithm cannot do and these hybrid models can achieve remarkable results [86]. Other ML algorithms like GB [56,57], latent dirichlet allocation (LDA) [87], long short-term memory (LSTM) [88], recurrent neural networks (RNN) [89], NB [90], genetic algorithm (GA) [91], particle swarm algorithm (PSA) [92], and logistic regression (LR) [93] can also provide better results. We urge our readers to go through these algorithms in the case they have no idea about them.
Aphasia affects one’s ability to read or write and, thus, is a resource-intensive condition. To improve the diagnostic process for aphasic speech evaluation, Kohlschein et al. [94] designed a system for automatically detection and evaluation of aphasic speech. This system uses LSTM-RNN and its performance is very good.
Bhattacharya et al. [95] described that the ML methods effectively identify hypertrophic cardiomyopathy patients with ventricular arrhythmias and thus this identification mechanism reduces the risk of cardiac death. They proposed an ensemble-based model using LR and NB, which addressed the imbalanced data effectively. They conclude their model has achieved considerable better performance as compared to conventional methods.
Dhahri et al. [96] optimized a learning algorithm to classify the stages of breast tumors. According to the authors, the GA could be applied successfully for optimization and identification of best classifier.
Senthikumar et al. [97] developed a novel method for prediction of cardiovascular diseases. Based on clinical data, the model uses a hybrid model comprising RF and a linear model. With an 88.7% accuracy rate, the performance of the model was observed to be improved as compared to other models based on ML and soft learning.
Due to the difficulty in recognition of blast cells, Boldu et al. [98] developed a LDA based system that could differentiate blast cells with high precision. The authors concluded that the proposed system could help in diagnosis of leukemia.
Dengue fever has similar symptoms as those of other types of fever, and thus it becomes necessary to diagnose it in early stages. Gambhir et al. [99] developed a PSO-ANN based model for early prediction of dengue fever. The efficiency of the proposed model was higher than the other state-of-the-art ML methods.
3 Discussion and Future Research Directions
This study is done to access the influence of ML in medical diagnosis. A comprehensive review of research papers in this study provides an overview of the way ML is being used to diagnose various diseases. The articles considered for review in this study are from the year 2015 to the year 2020.
To understand the impact of ML in medical diagnosis over the years, Different diseases are distributed by year and this distribution is presented in Tab. 1. From Tab. 1, it can be seen that ML has been applied to various diseases from the year 2015 to 2020. Out of 44 articles, we observe that 4 articles, i.e., 0.09%, were published on cardiovascular diseases. Moreover, 2 out of 44 eligible articles, i.e., 4.55%, were published on breast cancer, COVID-19, diabetes, glaucoma, pneumonia, and urinary tract infection. From the rest of the articles, every article concentrated on one disease each. Tab. 2 shows the distribution of ML methods based on medical disciplines. The distribution of diseases based on ML methods is shown in Tab. 3.
Table 1: The distribution of diseases by year

Table 2: The distribution of machine learning methods by medical disciplines

Table 3: The distribution of diseases by machine learning methods

Moreover, we observe certain limitations in building ML models for disease diagnosis. The problems are like finding the best ML model, the use of nonstandard datasets etc. The findings of this study show that the researchers tend to concentrate on combining related diseases in a single system. For example, separate studies were conducted for diagnosis of COVID-19 [47] and pneumonia [41,42]. However, there is a relation between these two diseases [100], So ML methods could be used to develop a single model that could diagnose both the diseases, i.e., COVID-19 and pneumonia. This could largely benefit patients suffering from both the diseases simultaneously.
One of the important parts of any ML method is the data. Currently, due to non-uniformity in data collection and storage across geography, the developed models could give varying accuracies on data collected from different sources. It is also observed that the most of the researchers point out that their developed model needs further validation on unbiased datasets. This issue could be addressed through data standardization and data normalization processes [101].
DL models such as CNN [22,37–40] have outperformed traditional ML models [102] and shallow neural networks on unstructured data (e.g., on image data in reference [41,44]). But, when it comes to structured tabular data, they have been outperformed by both, i.e., traditional ML models and shallow neural networks. However, recent studies have shown that the DL achieved comparable or better results to that of boosting methods [103,104] and they can also synthesize tabular data [105,106]. Arik et al. [107] have proposed a DL method for tabular learning called TabNet. With the number of benefits posed by DL, one of the crucial research areas is to use it on tabular data for disease diagnosis.
ML is used in medical diagnosis for reduction in the overall cost of medical expenditure, and as a ‘second’ opinion for doctors. The use of mathematical models could be used to make decisions. The primary aim of using ML in medical diagnosis is to improve the accuracy with which a disease is detected. This comprehensive study stresses the use of ML for effective medical diagnosis. It is observed that over the years the use of ML in medical diagnosis has increased substantially. The limitation of this study is that only articles applying machine learning in medical diagnosis are considered. Articles of artificial intelligence domain that are using techniques other than ML, such as fuzzy logic are not considered. Another limitation is that only articles from the year 2015 to mid of 2020 are considered.
Funding Statement: This work was supported in part by Zayed University, office of research under Grant No. R17089.
Conflicts of Interest: The authors declare that they have no conflicts of interest to report regarding the present study.
1. E. S. Berner and M. L. Graber. (2008). “Overconfidence as a cause of diagnostic error in medicine,” American Journal of Medicine, vol. 121, no. 5, pp. S2–S23. [Google Scholar]
2. S. Mamede, T. A. W. Splinter, T. Van Gog, R. M. J. P. Rikers and H. G. Schmidt. (2012). “Exploring the role of salient distracting clinical features in the emergence of diagnostic errors and the mechanisms through which reflection counteracts mistakes,” BMJ Quality & Safety, vol. 21, no. 4, pp. 295–300. [Google Scholar]
3. L. T. Kohn, J. M. Corrigan and M. S. Donaldson. (2000). “Why do errors happen? in To Err is Human: Building a Safer Health System, Washington, DC, USA: The National Academies Press, pp. 49–68, . [Online]. Available: https://www.nap.edu/catalog/9728/to-err-is-human-building-a-safer-health-system. [Google Scholar]
4. E. P. Balogh, B. T. Miller and J. R. Ball. (2016). “Introduction,” in Improving Diagnosis in Health Care, Washington, DC, USA: The National Academies Press, pp. 19–20, . [Online]. Available: https://www.nap.edu/catalog/21794/improving-diagnosis-in-health-care. [Google Scholar]
5. D. Michie. (1968). “Memo’ functions and machine learning,” Nature, vol. 218, no. 5136, pp. 19–22. [Google Scholar]
6. E. Alpaydin. (2004). “Introduction,” in Introduction to Machine Learning, 2 ed. Cambridge, Massachusetts, USA: MIT Press, pp. 1–20, . [Online]. Available: https://mitpress.mit.edu/books/introduction-machine-learning. [Google Scholar]
7. K. J. McConnell and S. Lindner. (2019). “Estimating treatment effects with machine learning,” Health Services Research, vol. 54, no. 6, pp. 1273–1282. [Google Scholar]
8. N. G. Maity and S. Das. (2017). “Machine learning for improved diagnosis and prognosis in healthcare,” in IEEE Aerospace Conf. Proc., Big Sky, MT, USA, pp. 1–9. [Google Scholar]
9. J. Vamathevan, D. Clark, P. Czodrowski, I. Dunham, E. Ferran et al. (2019). , “Applications of machine learning in drug discovery and development,” Nature Reviews Drug Discovery, vol. 18, no. 6, pp. 463–477. [Google Scholar]
10. D. A. Hashimoto, G. Rosman, D. Rus and O. R. Meireles. (2018). “Artificial intelligence in surgery: Promises and perils,” Annals of Surgery, vol. 268, no. 1, pp. 70–76. [Google Scholar]
11. G. Currie, K. E. Hawk, E. Rohren, A. Vial and R. Klein. (2019). “Machine learning and deep learning in medical imaging: Intelligent imaging,” Journal of Medical Imaging and Radiation Sciences, vol. 50, no. 4, pp. 477–487. [Google Scholar]
12. D. E. Adkins. (2017). “Machine learning and electronic health records: A paradigm shift,” American Journal of Psychiatry, vol. 174, no. 2, pp. 93–94. [Google Scholar]
13. S. E. Dreyfus. (1990). “Artificial neural networks, back propagation, and the kelley-bryson gradient procedure,” Journal of Guidance, Control and Dynamics, vol. 13, no. 5, pp. 926–928. [Google Scholar]
14. F. Rosenblatt. (1958). “The perceptron: A probabilistic model for information storage and organization in the brain,” Psychological Review, vol. 65, no. 6, pp. 386–408. [Google Scholar]
15. J. Zurada. (1992). Artificial Neural Systems: Preliminaries, in Introduction to Artificial Neural Systems. 1 ed. Minnesota, USA: Saint Paul, pp. 1–24. [Google Scholar]
16. S. Mangrulkar. (1990). “Artificial neural systems,” ISA Transaction, vol. 29, no. 1, pp. 5–7. [Google Scholar]
17. I. A. Ozkan, M. Koklu and I. U. Sert. (2018). “Diagnosis of urinary tract infection based on artificial intelligence methods,” Computer Methods and Programs in Biomedicine, vol. 166, pp. 51–59. [Google Scholar]
18. S. L. Chong, N. Liu, S. Barbier and M. E. H. Ong. (2015). “Predictive modeling in pediatric traumatic brain injury using machine learning data analysis, statistics and modeling,” BMC Medical Research Methodology, vol. 15, no. 1, pp. 1–9. [Google Scholar]
19. I. R. Abubakar and S. O. Olatunji. (2020). “Computational intelligence-based model for diarrhea prediction using demographic and health survey data,” Soft Computing, vol. 24, no. 7, pp. 5357–5366. [Google Scholar]
20. J. Schmidhuber. (2015). “Deep learning in neural networks: An overview,” Neural Networks, vol. 61, pp. 85–117. [Google Scholar]
21. L. Deng and D. Yu. (2014). “Deep learning: Methods and applications,” Foundations and Trends in Signal Processing, vol. 7, no. 3–4, pp. 197–387. [Google Scholar]
22. F. Chollet. (2017). “What is deep learning?,” in Deep Learning with Python, 1 ed. Manning Publications, pp. 3–24, . [Online]. Available: https://manning.com/books/deep-learning-with-python. [Google Scholar]
23. R. Asaoka, H. Murata, A. Iwase and M. Araie. (2016). “Detecting preperimetric glaucoma with standard automated perimetry using a deep learning classifier,” Ophthalmology, vol. 123, no. 9, pp. 1974–1980. [Google Scholar]
24. Y. Raita, T. Goto, M. K. Faridi, D. F. M. Brown, C. A. Camargo et al. (2019). , “Emergency department triage prediction of clinical outcomes using machine learning models,” Critical Care, vol. 23, no. 1, pp. 1–13. [Google Scholar]
25. B. Wang, Y. Bai, Z. Yao, J. Li, W. Dong et al. (2019). , “A multi-task neural network architecture for renal dysfunction prediction in heart failure patients with electronic health records,” IEEE Access, vol. 7, pp. 178392–178400. [Google Scholar]
26. J. Cheng and R. Greiner. (1999). “Comparing bayesian network classifiers,” in Proc. of the Fifteenth Conf. on Uncertainty in Artificial Intelligence (UAI-99San Francisco, CA, USA: Morgan Kaufmann Publishers Inc, pp. 101–108. [Google Scholar]
27. N. Freidman, D. Geiger and M. Goldsmidt. (1997). “Bayesian network classifiers,” Machine Learning, vol. 29, pp. 139–163. [Google Scholar]
28. H. Zhang. (2004). “The optimality of naive bayes,” in Proc. of the Seventeenth Int. Florida Artificial Intelligence Research Society Conf., Menlo Park, California, USA, vol. 2, pp. 562–567. [Google Scholar]
29. I. Rish. (2001). “An empirical study of the naive bayes classifier,” in Workshop on Empirical Methods in Artificial Intelligence, New York, USA, vol. 3, pp. 41–46. [Google Scholar]
30. A. Elsayad and M. Fakhr. (2015). “Diagnosis of cardiovascular diseases with bayesian classifiers,” Journal of Computer Science, vol. 11, no. 2, pp. 274–282. [Google Scholar]
31. X. Wu, V. Kumar, J. R. Quinlan, J. Ghosh, Q. Yang et al. (2007). , “Top 10 algorithms in data mining,” Knowledge and Information Systems, vol. 14, no. 1, pp. 27–33. [Google Scholar]
32. S. L. Crawford. (1989). “Extensions to the CART algorithm,” International Journal of Man-Machine Studies, vol. 31, no. 2, pp. 197–217. [Google Scholar]
33. S. Soni. (2010). “Implementation of multivariate data set by CART algorithm,” International Journal of Information Technology and Knowledge Management, vol. 2, no. 2, pp. 455–459. [Google Scholar]
34. F. Zhu, M. Tang, L. Xie and H. Zhu. (2018). “A classification algorithm of cart decision tree based on mapreduce attribute weights,” International Journal of Performability Engineering, vol. 14, no. 1, pp. 17–25. [Google Scholar]
35. K. Maghooli, M. Langarizadeh, L. Shahmoradi, M. Habibikoolaee, M. Jebraeily et al. (2016). , “Differential diagnosis of erythmato-squamous diseases using classification and regression tree,” Acta Informatica Medica, vol. 24, no. 5, pp. 338–342. [Google Scholar]
36. A. J. Aljaaf, D. Al-Jumeily, H. M. Haglan, M. Alloghani, T. Baker et al. (2018). , “Early prediction of chronic kidney disease using machine learning supported by predictive analytics,” in 2018 IEEE Congress on Evolutionary Computation, Rio de Janeiro, Brazil, pp. 1–9. [Google Scholar]
37. J. Wu. (2017). Introduction to Convolutional Neural Networks. China: National Key Lab for Novel Software Technology, Nanjing University. [Google Scholar]
38. D. Suryani, P. Doetsch and H. Ney. (2016). “On the benefits of convolutional neural network combinations in offline handwriting recognition,” in Proc. of Int. Conf. on Frontiers in Handwriting Recognition, pp. 193–198. [Google Scholar]
39. R. Yamashita, M. Nishio, R. K. G. Do and K. Togashi. (2018). “Convolutional neural networks: An overview and application in radiology,” Insights Imaging, vol. 9, no. 4, pp. 611–629. [Google Scholar]
40. M. Koziarski and B. Cyganek. (2017). “Image recognition with deep neural networks in presence of noise-dealing with and taking advantage of distortions,” Integrated Computer Aided Engineering, vol. 24, no. 4, pp. 337–349. [Google Scholar]
41. A. A. Nahid, N. Sikder, A. K. Bairagi, M. A. Razzaque, M. Masud et al. (2020). , “A novel method to identify pneumonia through analyzing chest radiographs employing a multichannel convolutional neural network,” Sensors, vol. 20, no. 12, pp. 1–18. [Google Scholar]
42. O. Stephen, M. Sain, U. J. Maduh and D. U. Jeong. (2019). “An efficient deep learning approach to pneumonia classification in healthcare,” Journal of Healthcare Engineering, vol. 2019, pp. 1–7. [Google Scholar]
43. Y. Horie, T. Yoshio, K. Aoyama, S. Yoshimizu, Y. Horiuchi et al. (2019). , “Diagnostic outcomes of esophageal cancer by artificial intelligence using convolutional neural networks,” Gastrointestinal Endoscopy, vol. 89, no. 1, pp. 25–32. [Google Scholar]
44. J. Islam and Y. Zhang. (2018). “Brain MRI analysis for alzheimer’s disease diagnosis using an ensemble system of deep convolutional neural networks, vol. 5, no. 2, pp. 1–15. [Google Scholar]
45. X. Kong, S. Gong, L. Su, N. Howard and Y. Kong. (2018). “Automatic detection of acromegaly from facial photographs using machine learning methods,” EBioMedicine, vol. 27, pp. 94–102. [Google Scholar]
46. R. Nijhawan, R. Verma, S. Ayushi, S. Bhushan, R. Dua et al. (2018). , “An integrated deep learning framework approach for nail disease identification,” in 13th Int. Conf. on Signal-Image Technology & Internet-Based Systems, Jaipur, Rajasthan, pp. 197–202. [Google Scholar]
47. M. A. Elaziz, K. M. Hosny, A. Salah, M. M. Darwish, S. Lu et al. (2020). , “New machine learning method for image based diagnosis of COVID-19,” PLoS One, vol. 15, no. 6, pp. 1–18. [Google Scholar]
48. S. K. Zhou, H. Greenspan and D. Shen. (2017). Deep Learning for Medical Image Analysis. 1 ed., Cambridge, Massachusetts, USA: Academic Press, . [Online]. Available: https://Sciencedirect.com/book/9780128104088/deep-learning-for-medical-image-analysis.html. [Google Scholar]
49. A. Krizhevsky, I. Sutskever and G. Hinton. (2012). “ImageNet classification with deep convolutional neural networks,” in Proc. of the 25th Int. Conf. on Neural Information Processing Systems, Lake Tanhoe, Nevada, pp. 1097–1105. [Google Scholar]
50. J. Krois, T. Ekart, L. Meinhold, T. Golla, B. Kharbot et al. (2019). , “Deep learning for the radiographic detection of periodontal bone loss,” Scientific Reports, vol. 9, no. 1, pp. 1–6. [Google Scholar]
51. S. Murakami, K. Hatano, J. Tan, H. Kim and T. Aoki. (2018). “Automatic identification of bone erosions in rheumatoid arthritis from hand radiographs based on deep convolutional neural network,” Multimedia Tools and Applications, vol. 77, no. 9, pp. 10921–10937. [Google Scholar]
52. Y. Y. Song and Y. Lu. (2015). “Decision tree methods: Applications for classification and prediction,” Shanghai Archives of Psychiatry, vol. 27, no. 2, pp. 130–135. [Google Scholar]
53. T. J. Hastie, R. J. Tibshirani and J. H. Friedman. (2009). “Boosting and additive trees,” in The Elements of Statistical Learning: Data Mining, Inference and Prediction, 2 ed. New York, USA: Springer-Verlag, pp. 337–388, . [Online]. Available: https://www.springer.com/gp/book/9780387848570. [Google Scholar]
54. J. R. Quinlan. (1987). “Decision trees as probabilistic classifiers,” in Proc. of the Fourth Int. Workshop on Machine Learning, Irvine, USA: University of California, pp. 31–37. [Google Scholar]
55. I. Ionita and L. Ionita. (2016). “Prediction of thyroid disease using data mining techniques,” Broad Research in Artificial Intelligence and Neuroscience, vol. 7, pp. 115–124. [Google Scholar]
56. J. H. Friedman. (2000). “Greedy function approximation: A gradient boosting machine,” The Annals of Statistics, vol. 29, no. 5, pp. 1189–1232. [Google Scholar]
57. M. Kearns. (1988). “Thoughts on hypothesis boosting,” Unpublished Manuscript, vol. 45, pp. 105. [Google Scholar]
58. M. P. Than, J. W. Pickering, Y. Sandoval, A. S. V. Shah, A. Tsanas et al. (2019). , “Machine learning to predict the likelihood of acute myocardial infarction,” Circulation, vol. 140, no. 11, pp. 899–909. [Google Scholar]
59. T. Chen and C. Guestrin. (2016). “XGBoost: A scalable tree boosting system,” in Proc. of the 22nd ACM SIGKDD Int. Conf. on Knowledge Discovery and Data Mining, San Francisco, CA, USA. [Google Scholar]
60. J. H. Friedman, R. Tibshirani and T. Hastie. (2000). “Additive logistic regression: A statistical view of boosting (with discussion and a rejoinder by the authors),” Annals of Statistics, vol. 28, no. 2, pp. 337–407. [Google Scholar]
61. T. Chen and T. He. (2020). “XGBoost: Extreme gradient boosting. Package Version: 1.2.0.1. [Google Scholar]
62. R. A. Taylor, C. L. Moore, K. H. Cheung and C. Brandt. (2018). “Predicting urinary tract infections in the emergency department with machine learning,” PLoS One, vol. 13, no. 3, pp. 1–15. [Google Scholar]
63. X. Tian, Y. Chong, Y. Huang, P. Guo, M. Li et al. (2019). , “Using machine learning algorithms to predict hepatitis B surface antigen seroclearance,” Computational and Mathematical Methods in Medicine, vol. 2019, pp. 1–7. [Google Scholar]
64. L. Yan, H. T. Zhang, J. Goncalves, Y. Xiao, M. Wang et al. (2020). , “An interpretable mortality prediction model for COVID-19 patients,” Nature Machine Intelligence, vol. 2, no. 5, pp. 283–288. [Google Scholar]
65. T. K. Ho. (1995). “Random decision forests,” in Proc. of the Int. Conf. Document Analysis Recognition, vol. 1, pp. 278–282. [Google Scholar]
66. L. Breiman. (2001). “Random forests,” Machine Learning, vol. 45, pp. 5–32. [Google Scholar]
67. M. D. Ganggayah, N. A. Taib, Y. C. Har, P. Lio and S. K. Dhillon. (2019). “Predicting factors for survival of breast cancer patients using machine learning techniques,” BMC Medical Informatics and Decision Making, vol. 19, no. 1, pp. 1–17. [Google Scholar]
68. Q. Zou, K. Qu, Y. Luo, D. Yin, Y. Ju et al. (2018). , “Predicting diabetes mellitus with machine learning techniques,” Frontiers in Genetics, vol. 9, pp. 1–10. [Google Scholar]
69. P. Samant and R. Agarwal. (2018). “Machine learning techniques for medical diagnosis of diabetes using iris images,” Computer Methods and Programs in Biomedicine, vol. 157, pp. 121–128. [Google Scholar]
70. C. C. Wu, M. M. Islam, T. Nasrin, P. A. Nguyen, H. C. Yang et al. (2019). , “Prediction of fatty liver disease using machine learning algorithms,” Computer Methods and Programs in Biomedicine, vol. 170, pp. 23–29. [Google Scholar]
71. A. Leha, K. Hellenkamp, B. Unsold, S. M. Blake, A. M. Shah et al. (2019). , “A machine learning approach for the prediction of pulmonary hypertension,” PLoS One, vol. 14, no. 10, pp. 1–16. [Google Scholar]
72. C. Cortes and V. Vapnik. (1995). “Support-vector networks,” Machine Learning, vol. 20, pp. 273–297. [Google Scholar]
73. N. Cristianini and J. Shawe-Taylor. (2000). Support vector machines. An Introduction to Support Vector Machines and Other Kernel-based Learning Methods. Cambridge, UK: Cambridge University Press, 94–124. [Google Scholar]
74. K. P. Bennett and C. Campbell. (2000). “Support vector machines: Hype or hallelujah?,” ACM SIGKDD Explorations Newsletter, vol. 2, no. 2, pp. 1–13. [Google Scholar]
75. A. B. Hur, D. Horn, H. T. Siegelmann and V. Vapnik. (2002). “Support vector clustering,” The Journal of Machine Learning Research, vol. 2, pp. 125–137. [Google Scholar]
76. V. Thangaraj and V. Natarajan. (2017). “Glaucoma diagnosis using support vector machine,” in Proc. of 2017 Int. Conf. on Intelligent Computing and Control Systems, Madurai, pp. 394–399. [Google Scholar]
77. A. Singh, M. K. Dutta, R. Jennane and E. Lespessailles. (2017). “Classification of the trabecular bone structure of osteoporotic patients using machine vision,” Computers in Biology and Medicine, vol. 91, pp. 148–158. [Google Scholar]
78. M. Ahmad, V. Tundjungsari, D. Widianti, P. Amalia and U. A. Rachmawati. (2018). “Diagnostic decision support system of chronic kidney disease using support vector machine,” in Proc. of 2nd Int. Conf. on Informatics and Computing, pp. 1–4. [Google Scholar]
79. C. Sady and A. L. P. Ribeiro. (2016). “Symbolic features and classification via support vector machine for predicting death in patients with chagas disease,” Computers in Biology and Medicine, vol. 70, pp. 220–227. [Google Scholar]
80. K. C. Hsu, C. H. Lin, K. R. Johnson, C. H. Liu, T. Y. Chang et al. (2020). , “Autodetect extracranial and intracranial artery stenosis by machine learning using ultrasound,” Computers in Biology and Medicine, vol. 116, 103569. [Google Scholar]
81. E. Marquez and V. Barron. (2019). “Artificial intelligence system to support the clinical decision for influenza,” in IEEE Int. Autumn Meeting on Power, Electronics and Computing (ROPECIxtapa, Mexico, pp. 1–5. [Google Scholar]
82. N. Hameed, A. Shabut and M. A. Hossain. (2019). “A computer-aided diagnosis system for classifying prominent skin lesions using machine learning,” in 10th Computer Science and Electronic Engineering Conf., Colchester, UK, pp. 186–191. [Google Scholar]
83. N. Louridi, M. Amar and B. El Ouahidi. (2019). “Identification of cardiovascular diseases using machine learning,” in 7th Mediterranian Cong. Telecommunications, Fes, Morocco, pp. 1–6. [Google Scholar]
84. L. Ali, A. Niamat, J. A. Khan, N. A. Golilarz, X. Xingzhong et al. (2019). , “An optimized stacked support vector machines based expert system for the effective prediction of heart failure,” IEEE Access, vol. 7, pp. 54007–54014. [Google Scholar]
85. F. Karimi-Alavijeh, S. Jalili and M. Sadeghi. (2016). “Predicting metabolic syndrome using decision tree and support vector machine methods,” ARYA Atheroscler, vol. 12, no. 3, pp. 146–152. [Google Scholar]
86. M. Abdelrahim, C. Merlos and T. Wang. (2016). “Hybrid machine learning approaches: A method to improve expected output of semi-structured sequential data,” in IEEE 10th Int. Conf. on Semantic Computing, Laguna Hills, CA, USA, pp. 342–345. [Google Scholar]
87. D. M. Blei, A. Y. Ng and M. I. Jordan. (2003). “Latent dirichlet allocation,” Journal of Machine Learning Research, vol. 3, pp. 993–1022. [Google Scholar]
88. S. Hochreiter and J. Schmidhuber. (1997). “Long short-term memory,” Neural Computation, vol. 9, no. 8, pp. 1735–1780. [Google Scholar]
89. D. P. Mandic and J. A. Chambers. (2001). “Recurrent Neural Networks for Prediction: Learning Algorithms, Architectures and Stability. 1 ed. NY, USA: Wiley, . [Online]. Available: https://www.wiley.com/en-us/Recurrent+Neural+Networks+for+Prediction%3A+Learning+Algorithms%2C+Architectures+and+Stability-p-9780471495178. [Google Scholar]
90. H. Zhang. (2004). “The optimality of naive bayes,” in Proc. of Seventeenth Int. Florida Artificial Intelligence Research Society Conf., Miami Beach, Florida, pp. 562–567. [Google Scholar]
91. M. Mitchell. (1996). An Introduction to Genetic Algorithms. Cambridge, MA: MIT Press. [Google Scholar]
92. J. Kennedy and R. Eberhart. (1995). “Particle swarm optimization,” in Proc. Int. Conf. on Neural Networks, Perth, WA, Australia, vol. 4, pp. 1942–1948. [Google Scholar]
93. J. Peng, K. Lee and G. Ingersoll. (2002). “An introduction to logistic regression analysis and reporting,” Journal of Educational Research, vol. 96, no. 1, pp. 3–14. [Google Scholar]
94. C. Kohlschein, M. Schmitt, B. Schuller, S. Jeschke and C. J. Werner. (2017). “A machine learning based system for the automatic evaluation of aphasia speech,” in IEEE 19th Int. Conf. on e-Health Networking, Applications and Services (HealthcomDalian, pp. 1–6. [Google Scholar]
95. M. Bhattacharya, D. Y. Lu, S. M. Kudchadkar, G. V. Greenland, P. Lingamaneni et al. (2019). , “Identifying ventricular arrhythmias and their predictors by applying machine learning methods to electronic health records in patients with hypertrophic cardiomyopathy (HCM-VAr-risk model),” American Journal of Cardiology, vol. 123, no. 10, pp. 1681–1689. [Google Scholar]
96. H. Dhahri, E. Al Maghayreh, A. Mahmood, W. Elkilani, M. Faisal Nagi et al. (2019). , “Automated breast cancer diagnosis based on machine learning algorithms,” Journal of Healthcare Engineering, vol. 2019, pp. 1–11. [Google Scholar]
97. S. Mohan, C. Thirumalai and G. Srivastava. (2019). “Effective heart disease prediction using hybrid machine learning techniques,” IEEE Access, vol. 7, pp. 81542–81554. [Google Scholar]
98. L. Boldú, A. Merino, S. Alférez, A. Molina, A. Acevedo et al. (2019). , “Automatic recognition of different types of acute leukemia in peripheral blood by image analysis,” Journal of Clinical Pathology, vol. 72, no. 11, pp. 755–761. [Google Scholar]
99. S. Gambhir, S. K. Malik and Y. Kumar. (2017). “PSO-ANN based diagnostic model for the early detection of dengue disease,” New Horizons in Translational Medicine, vol. 4, pp. 1–8. [Google Scholar]
100. W. Zhao, Z. Zhong, X. Xie, Q. Yu and J. Liu. (2020). “Relation between chest CT findings and clinical conditions of coronavirus disease (COVID-19) pneumonia: A multicenter study,” American Journal of Roentgenology, vol. 214, no. 5, pp. 1072–1077. [Google Scholar]
101. J. Kukačka, V. Golkov and D. Cremers. (2017). “Regularization for deep learning: A taxonomy,” ArXiv Preprint, vol. abs/1710.10686. [Google Scholar]
102. S. Mullainathan and J. Spiess. (2017). “Machine learning: An applied econometric approach,” Journal of Economics Perspectives, vol. 31, no. 2, pp. 87–106. [Google Scholar]
103. I. Shavitt and E. Segal. (2018). “Regularization learning networks: Deep learning for tabular datasets,” in Proc. of the 32nd Conf. on Neural Information Processing Systems, Montreal, Canada, pp. 1379–1389. [Google Scholar]
104. S. Popov, S. Morozov and A. Babenko. (2020). “Neural oblivious decision ensembles for deep learning on tabular data,” in Eighth Int. Conf. on Learning Representations (Virtual Only), pp. 1–12. [Google Scholar]
105. L. Xu and K. Veeramachaneni. (2018). “Synthesizing tabular data using generative adversarial networks,” Computing Research Repository, pp. 1–12. [Google Scholar]
106. L. Xu, M. Skoularidou, A. Cuesta-Infante and K. Veeramachaneni. (2019). “Modeling tabular data using conditional GAN,” in 33rd Conf. on Neural Information Processing Systems, Vancouver, Canada, pp. 1–15. [Google Scholar]
107. S. O. Arik and T. Pfister. (2019). “TabNet: Attentive interpretable tabular learning,” Computing Research Repository, pp. 1–27. [Google Scholar]
 | This work is licensed under a Creative Commons Attribution 4.0 International License, which permits unrestricted use, distribution, and reproduction in any medium, provided the original work is properly cited. |