DOI:10.32604/cmc.2021.015116
| Computers, Materials & Continua DOI:10.32604/cmc.2021.015116 | |
| Article |
Computational Microfluidic Channel for Separation of Escherichia coli from Blood-Cells
1Department of Electronics and Instrumentation Engineering, SRM Institute of Science and Technology, Kattankulathur, 603203, India
2Department of Electronics and Communication Engineering, SRM Institute of Science and Technology, Kattankulathur, 603203, India
3College of Computer Science and Information Technology, University of Anbar, Anbar, Iraq
4Department of Mechanical Engineering, Karunya Institute of Technology and Sciences, Coimbatore, 641114, India
*Corresponding Author: Chinnapalli Likith Kumar. Email: likithkc@srmist.edu.in
Received: 07 November 2020; Accepted: 30 November 2020
Abstract: Microfluidic channels play a vital role in separation of analytes of interest such as bacteria and platelet cells, etc., in various biochemical diagnosis procedures including urinary tract infections (UTI) and bloodstream infections. This paper presents the multi physics computational model specifically designed to study the effects of design parameters of a microfluidics channel for the separation of Escherichia coli (E. coli) from various blood constituents including red blood cells (RBC) and platelets. A standard two inlet and a two outlet microchannel of length 805 m with a channel width of 40 m is simulated. The effect of electrode potentials and the effect of electrode placement along the channel length and also the levitation of electrodes from the channel wall are studied to optimize the selective particle separation throughput. Simulated results show the efficient separation of E-coli with a mean diameter 0.68 m is achieved at low voltages (less than 20 V) when electrodes placed near to the micro channel and also noticed that the applied electric potential is inversely proportional to the number of electrodes placed along the microfluidic channel. The computer aided multi physics simulations with multiple governing parameters could be advantage in design optimization of microfluidics channels and support precise bioparticle separation for better diagnosis.
Keywords: Microfluidics; dielectrophoresis; cell separation; electro kinetic force; platelets; E. coli
Rapid detection of real-time bacterial count or drop in platelet population, etc., is however essential for quick assessment of disease condition in urinary tract infections (UTI) and bloodstream infections. But the detection of bacteria poses critical challenges including latency in separation and identification from an unprocessed blood or serum sample. Advances in microfluidic systems [1,2] such as Lab-on-chip [3],  TAS [4] and Point-of-Care [5] devices evolved potentially to overcome the above limitations in comparison with that of their traditional counterparts (time-consuming off-line procedures). Many passive separation techniques such as Pinched Flow Fractionation [6,7], Inertial [8], Hydrodynamics [9–11], Hydrophoresis [12], Deterministic Lateral Displacement [13] (DLD), centrifugal [14] and Porous based Filtration [15] techniques rely heavily on either mass or geometrical aspects of the molecules instead considering their specific other physical properties.
On the other-hand active microfluidic particle separation techniques explored based on Electric [16], Magnetic [17], Acoustic [18] and Optical [19] properties of molecules were widely spread in medical diagnostic application due to their enhanced sensitivity, selectivity, high separation throughput and most importantly the reduced sampling time. Among the above mentioned active separation techniques, Dielectrophoresis [20–22] has gained critical attention due to the strategic usage of electrokinetic forces over a hydrodynamic flow which enables the selective separation of molecules based on their size and polarizability. Pommer et al. [23] demonstrated the high voltage (100 V) Dielectrophoresis method using a double-stage miniaturized system for platelet ( –3
–3  m) separation from a whole blood sample, Piacentini et al. [24] Separated platelets from other blood constituents (RBC, WBC) using Dielectrophoresis field-flow-fractionation (DEP-FFF) method by a single stage low voltage system operating at 10 V successfully. However, the above techniques exploit size-dependent electrokinetic force which otherwise requires significantly large voltages to separate dot-like particles (
 –2
–2  m) such as micro-bacteria. As it is a fact that the amount of power density found to be high near the electrodes when operated at high voltages. Operating at higher voltages could lead to localized joule heating [25,26]. Therefore it may induce changes in conductivity and permittivity of the particles near to the electrodes and also it may create turbulence due to electro thermal fluid flow. On the other hand, PDMS and PMMA like deformable substrates used for microchannel manufacturing may get affected by these induced heating at high voltages. To overcome such electro thermal problems, optimization of electrode placement and operating voltages need to be studied when looking forward to separate small particles.
As it is noticed from the Dielectrophoretic force equation the time average of applied force is not just proportional to the cell volume but also to the applied electrical field. Hence the amount of force experience by the particle near to the electrode is higher than that of the particle away from the electrode. In addition to the advantage, proposed by Piacentini et al. [24] Where the buffer solution focus the particles bound to the sample solution, decreasing the physical distance of the electrodes to the sample solution could offer unprecedented benefits in terms of enhanced electrokinetic force for separation of particles at a lower voltages.
The proposed system has near field electrodes which are placed close to the sample solution and induces enhanced electro kinetic force. As the particles in the sample drive close to the vicinity of the electrodes, they experience large repulsion force even at lower voltages. Using this principle, the particles that experience the force come out of sample streamline and enter into the buffer streamline and further carried to particle collection outlets. In addition to the above study, the effect of the longitudinal electric field is discussed in detail from the design perspective of electrode placement and their impact on particle separation with various operating voltages. A separate 3D model also studied to understand the particle transport mechanism through the micro channel.
Posing the practical limitation of physical experiments and computational intense simulations for optimization problems in the multi parameter environment, the use of efficient algorithms such as Fuzzy-logic [27], Neural Network [28–30], Machine learning and Artificial Intelligence [31–33] could help in dynamic selection of statistical significant parameters in many research fields. As a future scope of this work, adopting the above mentioned techniques for optimization studies in the field of microfluidic could be advantageous in finding significant design parameters including the channel length, number of electrodes and the physical variable including flow velocity, range of operating electrical potential and frequency which control the selected particle separation throughput.
Dielectrophoresis is a well-known phenomenon in which the particle of interest suspended in a hydrodynamic solvent flowing through a microfluidic channel gain momentum in the direction of electrokinetic force when it exposed to a non-uniform otherwise inhomogeneous electric field applied on the microfluidic channel [34]. Dielectrophoretic force experience by a particle is a key factor in dynamic separation of particles which depends on the polarizability (induced dipole moment) of the particle when subjected to a non-uniform electric field. Irrespective of nature of net electric charge possess by the particle and the polarity of the applied electric field in both DC [35] and AC [36] Dielectrophoresis. The Dielectrophoresis relies on the net surface charges induced on to the particle depending on the dielectric properties of both the particle and its surrounding medium. Hence, either Direct or Alternating Current sources can be employed to create a non-uniform electric field. Since the magnitude of the induced dipole moment is a factor of size and shape of the particle, critical observation is required in case of micro-sized particles. Hence, the net force experienced by the microparticle (FDEP) in a non-uniform electric field is proportional to the volume of the particle and the time average of the applied electrical field. The force FDEP is given by [37,38]

where, Erms is an applied Electric Field vector, R is the radius of the particle,  is the permittivity of free space,
  is the relative permittivity of the medium, Re [K(
 )] is a frequency depended on real part of Clausius–Mossotti function which is given by

From the above, the real part of K( ) is defined as

Here,  are the permittivities and
  are conductivities of the medium and particle, respectively.
  is Maxwell–Wagner relaxation time for the particle and the product of the time constant and frequency influence the characteristics of Re [K] concerning the operating frequency. Since the real part Re [K] is frequency-dependent, the sign and magnitude of FDEP are the functions of electric field frequency (
 ). The Re [K] could be calculated based on the product of
  , which is given by


From the above relation Eq. (5), it is observed that if the Clausius–Mossotti factor K is greater than zero indicates positive Dielectrophoresis and vice-versa indicate negative Dielectrophoresis. Since the Dielectrophoresis is frequency-dependent concept, the particles experience negative DEP (attracted to minimum electric field intensity) at low frequencies and to positive DEP (attracted to maximum electric field intensity) at high frequencies when  and
and  . This frequency-dependent behaviour reverses if
  and
and  . Fig. 1, shows the relation between the Re [K] versus operating frequency (1 kHz to 1 GHz) when considering various bioparticles such as RBC, Platelets and E. coli suspended in the medium. It is observed from the Fig. 1, all the particles experience negative DEP for the range of frequencies below 2 MHz and above 50 MHz. Positive DEP was observed only for the particles RBC and Platelets from 2 to 50 MHz range. However, E. coli experience Negative DEP throughout all the frequencies starting from 1 kHz to 1 GHz.
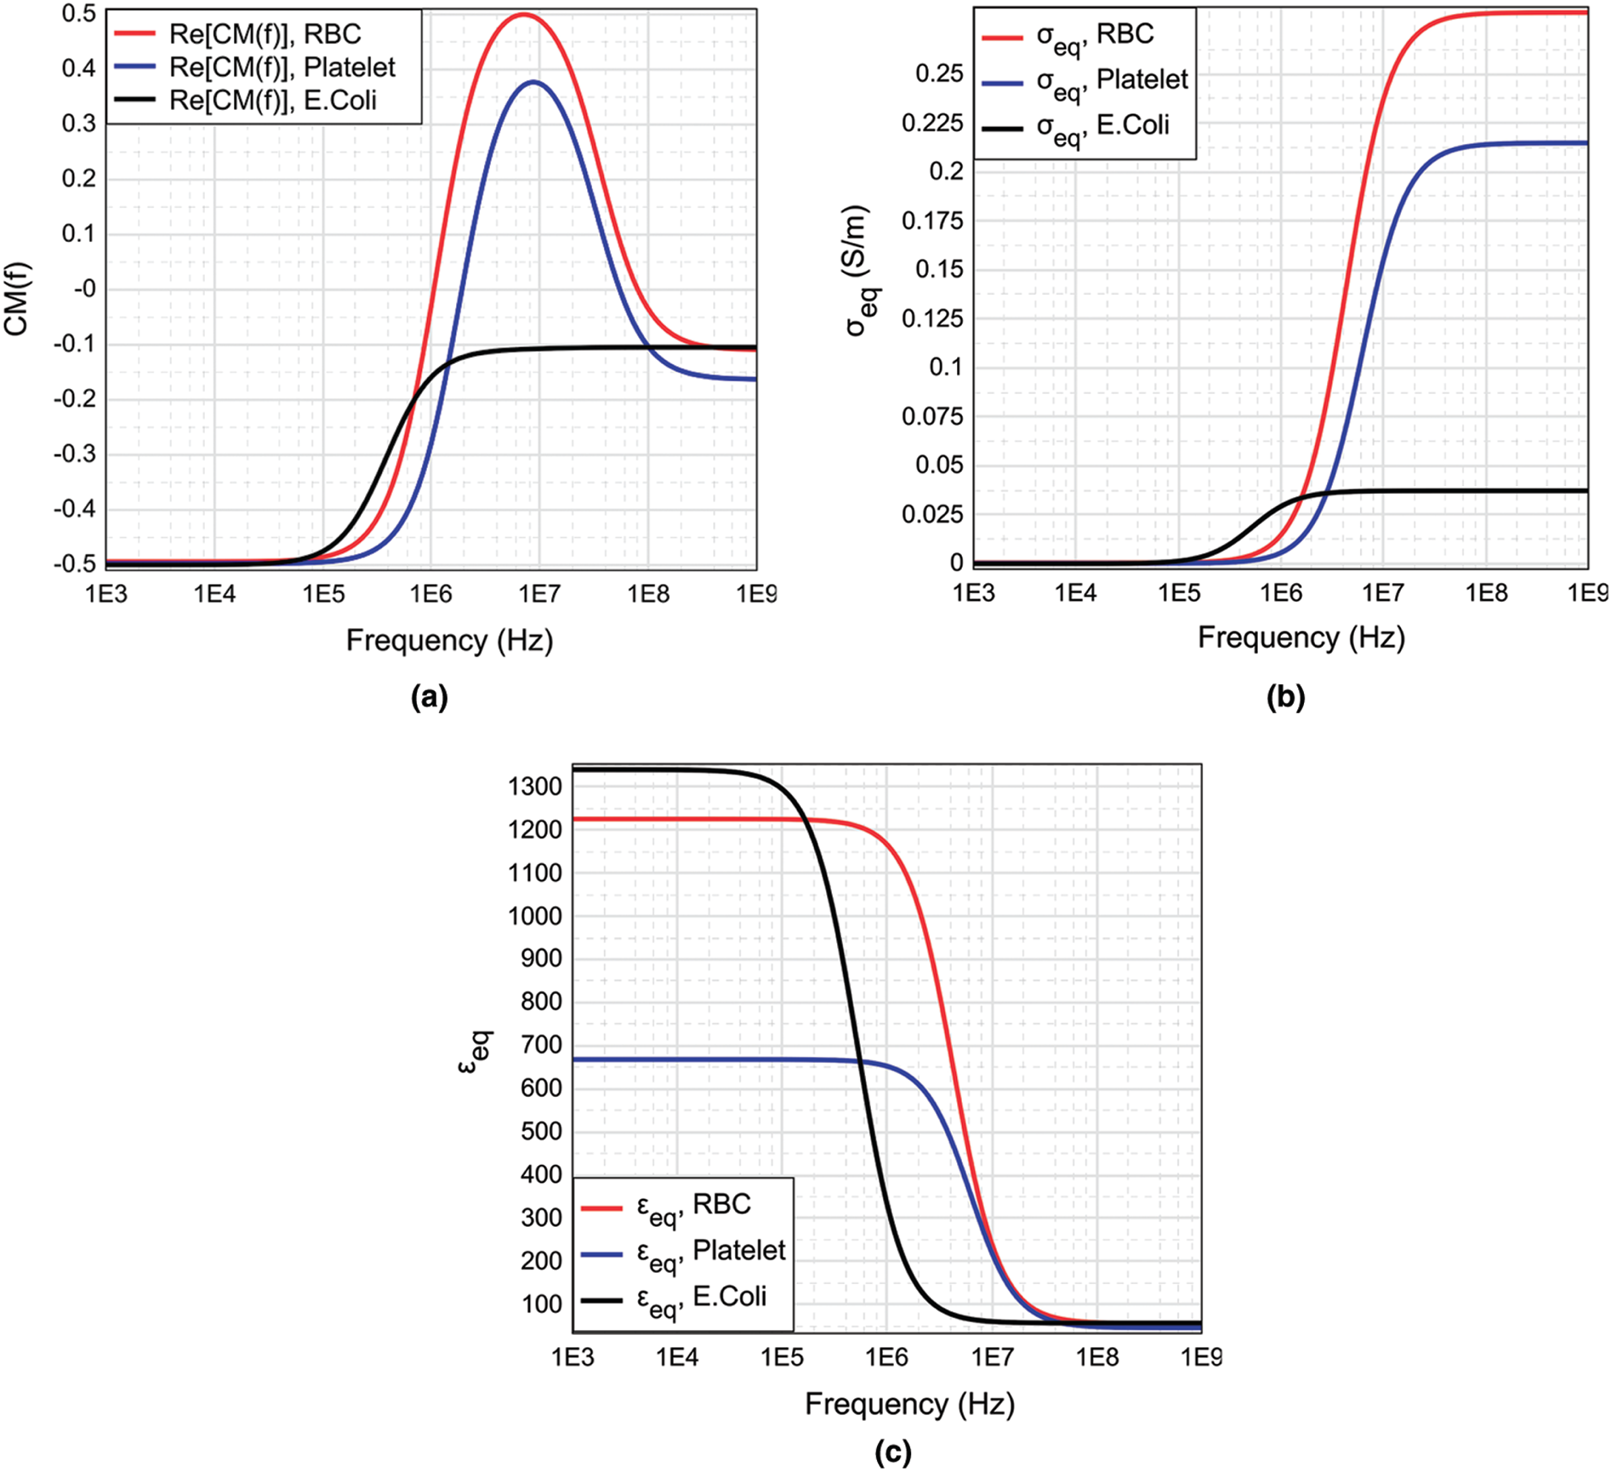
Figure 1: (a) The real part of CM factor, (b) equivalent electrical conductivity, (c) equivalent relative permitivity for RBC, Platelets and E. coli suspended in a medium obtained by using MyDEP [39] software. The CM factor for E. coli show a sigmoidal relation over the broad range of frequency 1 KHz to 1 GHz
Fluid dynamics play a major role in particle transportation, specifically in microfluidics where surface forces are dominant in controlling several attributes of the fluid, including flow velocity, turbulence etc. The fluid flow in a microchannel is generally characterized by its Reynolds number [38,40], which is a function of fluid viscosity, density and the average velocity of the fluid.

where Re is the Reynolds number,  is the fluid density, V is the velocity, D is the diameter and
  is the dynamic viscosity.
Due to ultralow footprints, the flow in microchannels observed to be laminar for low Reynolds number. Laminar flow provides a relatively predictable molecular transportation to respective outlets. In this study, a high viscous fluid was considered, which flows through a microchannel at very low velocities observed to have a Reynolds number less than one. For fluids having high viscosity and low Reynolds number where inertial forces are negligible, a simplified Naiver-Stokes (creeping flow) equations were taken for this study. The governing equation for creeping flow condition and the drag force on the particle is given as [38,40]


where FD is the drag force,  is the viscosity, V is the velocity of the fluid and D is the diameter of the particle.
COMSOL Multiphysics (electric current, creeping flow and particle tracing for fluid flow module) software is used for the numerical simulation. In this study, a two-dimensional finite element analysis is carried out to calculate various physical quantities such as the Electric field distribution, flow characteristics (particle velocity, Dielectrophoresis force and drag force acting on the particles, etc.) in the microfluidic channel given in the Fig. 2, under the non-uniform field.
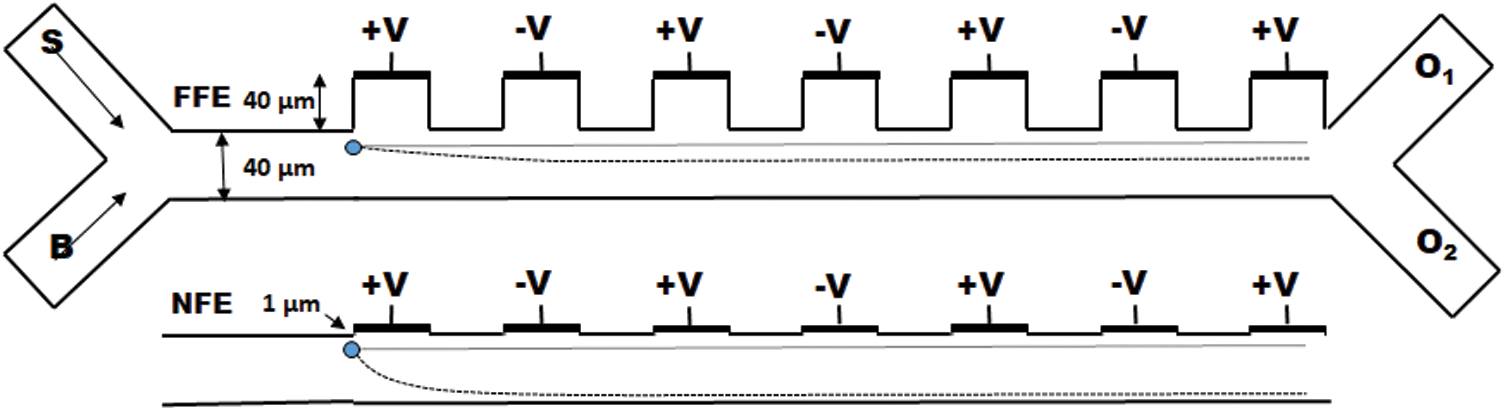
Figure 2: Schematic of the microfluidic channel represent placement of electrode for far filed (away from the channel) and near field (near to the channel) configurations and also exhibit the effect of electrode placement on distinct deflection (represented by the curved dotted line) of the particle from its streamline when operated at a fixed voltage
The design of microfluidic channel is similar to the design described by Piacentini et al., whereas slight modifications were introduced in terms of electrode placement and the channel lengths, etc. A 40  m width microfluidic channel is designed to have two inlets [41] at the entrance to inject sample and buffer solution separately and merged into a long (805
  m) particle separation channel. Since the placement of electrode [42,43] plays a crucial role, here a total of seven electrodes (each 40
  m width) were placed at two distinct heights (40
  m and 1
  m) from the upper boundary of the channel at a distance of 310
  m from the inlet merging point to create far and near field effects respectively as shown in Fig. 2. Two separate outlets were designed at the end of the channel to collect selectively separated particles.
3.2 Design Considerations of Fluid Flow and Its Electrical Parameters
The upper part of the inlet (S) shown in Fig. 2, is considered for sample injection and the lower part of inlet (B) is considered for the buffer injection. Using COMSOL creeping flow module, creeping flow conditions were imposed on both the inlets of the channel at a flow velocity of 134  m/s and 853
  m/s for the sample and the buffer solution respectively. Despite considering small channel widths, the creeping flow conditions avoid diffusion of sample solution into the buffer solution. The Reynolds numbers of both the fluid flows are less than one and the high velocity of the buffer solution drives the particles (RBC, Platelets and E. coli) suspended in the sample medium remain in the sample solution (upper portion of the channel) where the inertial and gravitational forces were considered negligible.
Since this study is only focused on the movement of particles in a fluid flow, all the particles suspended in the fluid medium are considered as non-elastic spherical-shells with various electrical and geometric parameters such as conductivity, dielectric coefficient, mean diameter and thickness etc. Tab. 1, shows the parameters taken from elsewhere in the literature [24,37,44–46] were imposed in this study using particle tracing for fluid flow module in COMSOL. The mixture of particles of various diameter released continuously into the microfluidic channel were guided by the sample flow towards the electric field region to gain momentum in the transverse direction of the fluid flow. These particles further joined with various buffer streamlines based on different electrokinetic force experienced by the particle and collected at respective outlets. The electrode dimensions, including the width and the distance between the electrodes, were fixed to 40  m throughout the study to validate the results with the literature [24]. Various studies, including the effective placement of electrodes in terms of the number of electrodes to be placed and the effect of the particular location, were carried out separately to optimize the impact of electrokinetic forces to separate particles. The COMSOL electric current module was used to assign various electrical potentials to the electrode and the frequency domain analysis was carried out to pursue the electrical field distribution and its effect on particle separation since it is a fact that the CM-factor places a major role.
Table 1: Flow and electrical properties of elements of simulation

Selective particle separation was simulated with Dielectrophoresis based microfluidic channel using COMSOL Multiphysics software by slightly modifying DEP-FFF geometry. Modified electrode placement was introduced as shown in Fig. 4, to create enhanced dielectrophoretic force on particles using near-field electrode concept. As discussed in Section 3.1, 40  m width microfluidic channel was simulated and placed seven electrodes near to the tail region of the microchannel.
4.1 Effect of Electrode Placement on Design Parameters and Validation of Simulation Protocol
Primarily, the simulation was tested to confirm the validity of the design parameters with far-field electrodes with three different particles such as RBC, Platelets and E. coli. RBC particles were separated to a specifically designed outlet (O2) at an applied voltage of 10 V which strongly support the design parameters were undoubtedly able to reproduce the results which were published by Piacentin et al. Fig. 3a show the portion of simulation output at the tail region confirms the separation of RBC starts at 7.5 V onwards to 20.5 V where after 20.5 V platelets were pushed into outlet 2.
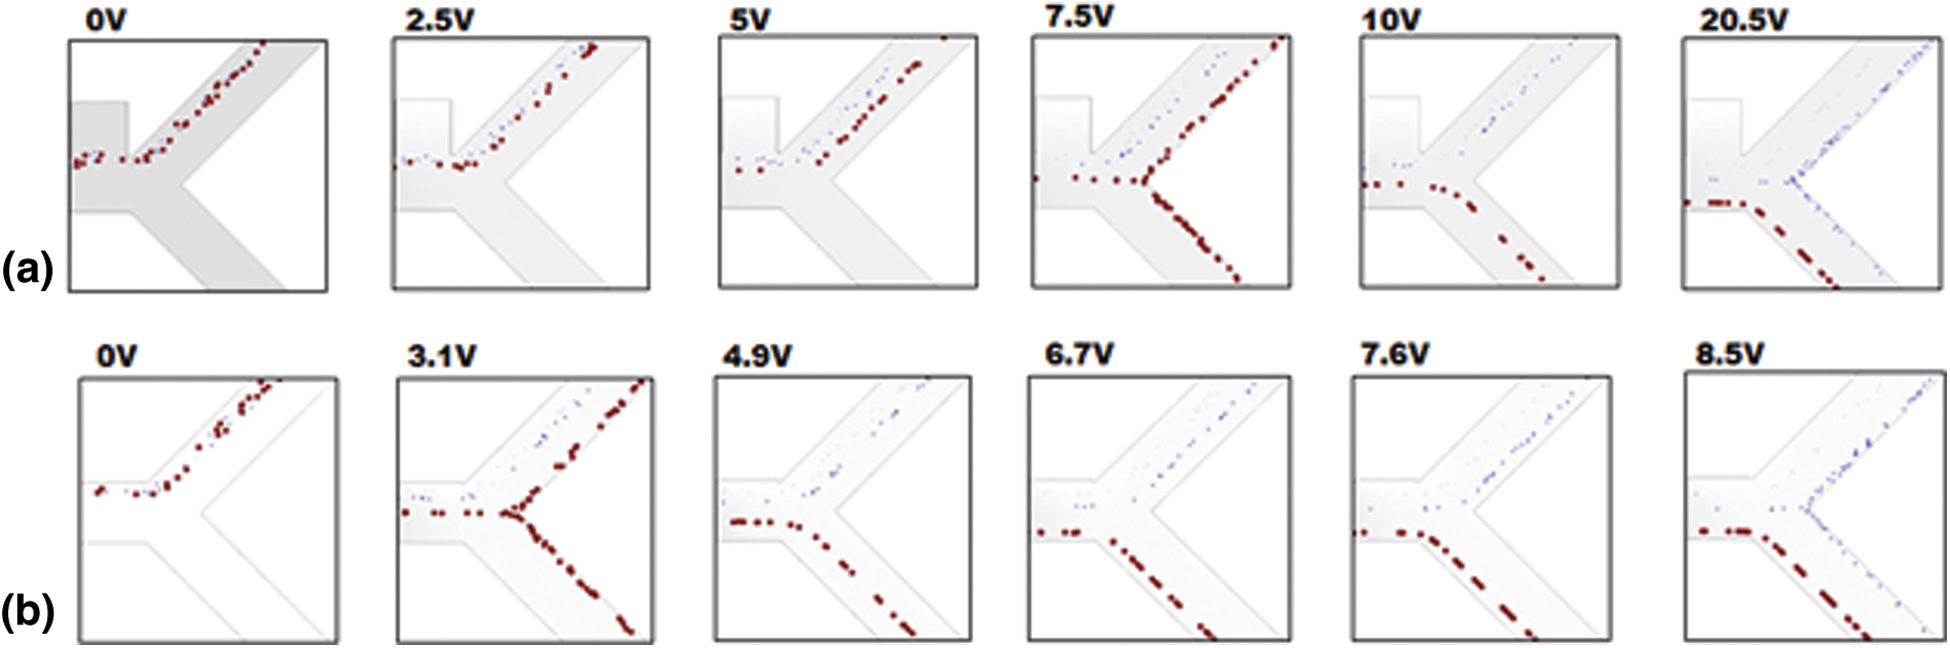
Figure 3: Simulation output for the selective separation of RBC (red) from Platelet and E. coli (blue) when applied far-field and near-field electrodes validate the simulation design parameters. Critical separation of RBC achieved at 7.5 V for far-field electrode position (first column) and the same for near-field electrode placement achieved at 3.1 V
However, for the near-field simulation, the same effect was observed, as shown in Fig. 3b where the operating voltages have come down drastically by nearly 40–60%. RBC was entered in to outlet 2 at a minimum voltage of 3.1 V to a maximum voltage of 8.5 V where after 8.5 V platelets were entered in to outlet 2. The reduction in operating voltage was studied from the viewpoint of electric field distribution for the far-filed electrodes and the near-field electrodes.
Fig. 4a shows the electric field distribution profile for far-field and near-field across the channel when excited at 10 V (100 kHz). The simulation response for electrical field distribution when operated at 10 V (100 kHz) is shown in Fig. S1 (Supplementary Material). It is evident that the field strength of  V/m and
  V/m were observed at the upper boundary of the channel for far-field and near-field respectively. As it is a fact that that the dielectrophoretic force is proportional to the applied electrical field given in Eq. (1), with an enhanced electric field for near-field electrode the particles may experience enhanced electrokinetic force. It is also observed from the viewpoint of a flow-velocity profile when electrodes placed far and near to the channel show a significant difference in the velocity about 0.6 mm/s for the far-field condition at the upper boundary as shown in Fig. 4b. Hence it is observed that (i). The particle velocity in the near-field condition is relatively lesser than the far-field condition due to no-slip condition in creeping flow and (ii). The absence of dead-space prevents the particle oscillations in near-field condition as shown in Fig. 5. The velocity distribution is shown in Fig. 5a, and the particle movement for both far field (upper portion of the Fig. 5b) the and near field (lower portion of the Fig. 5b) electrode placement.
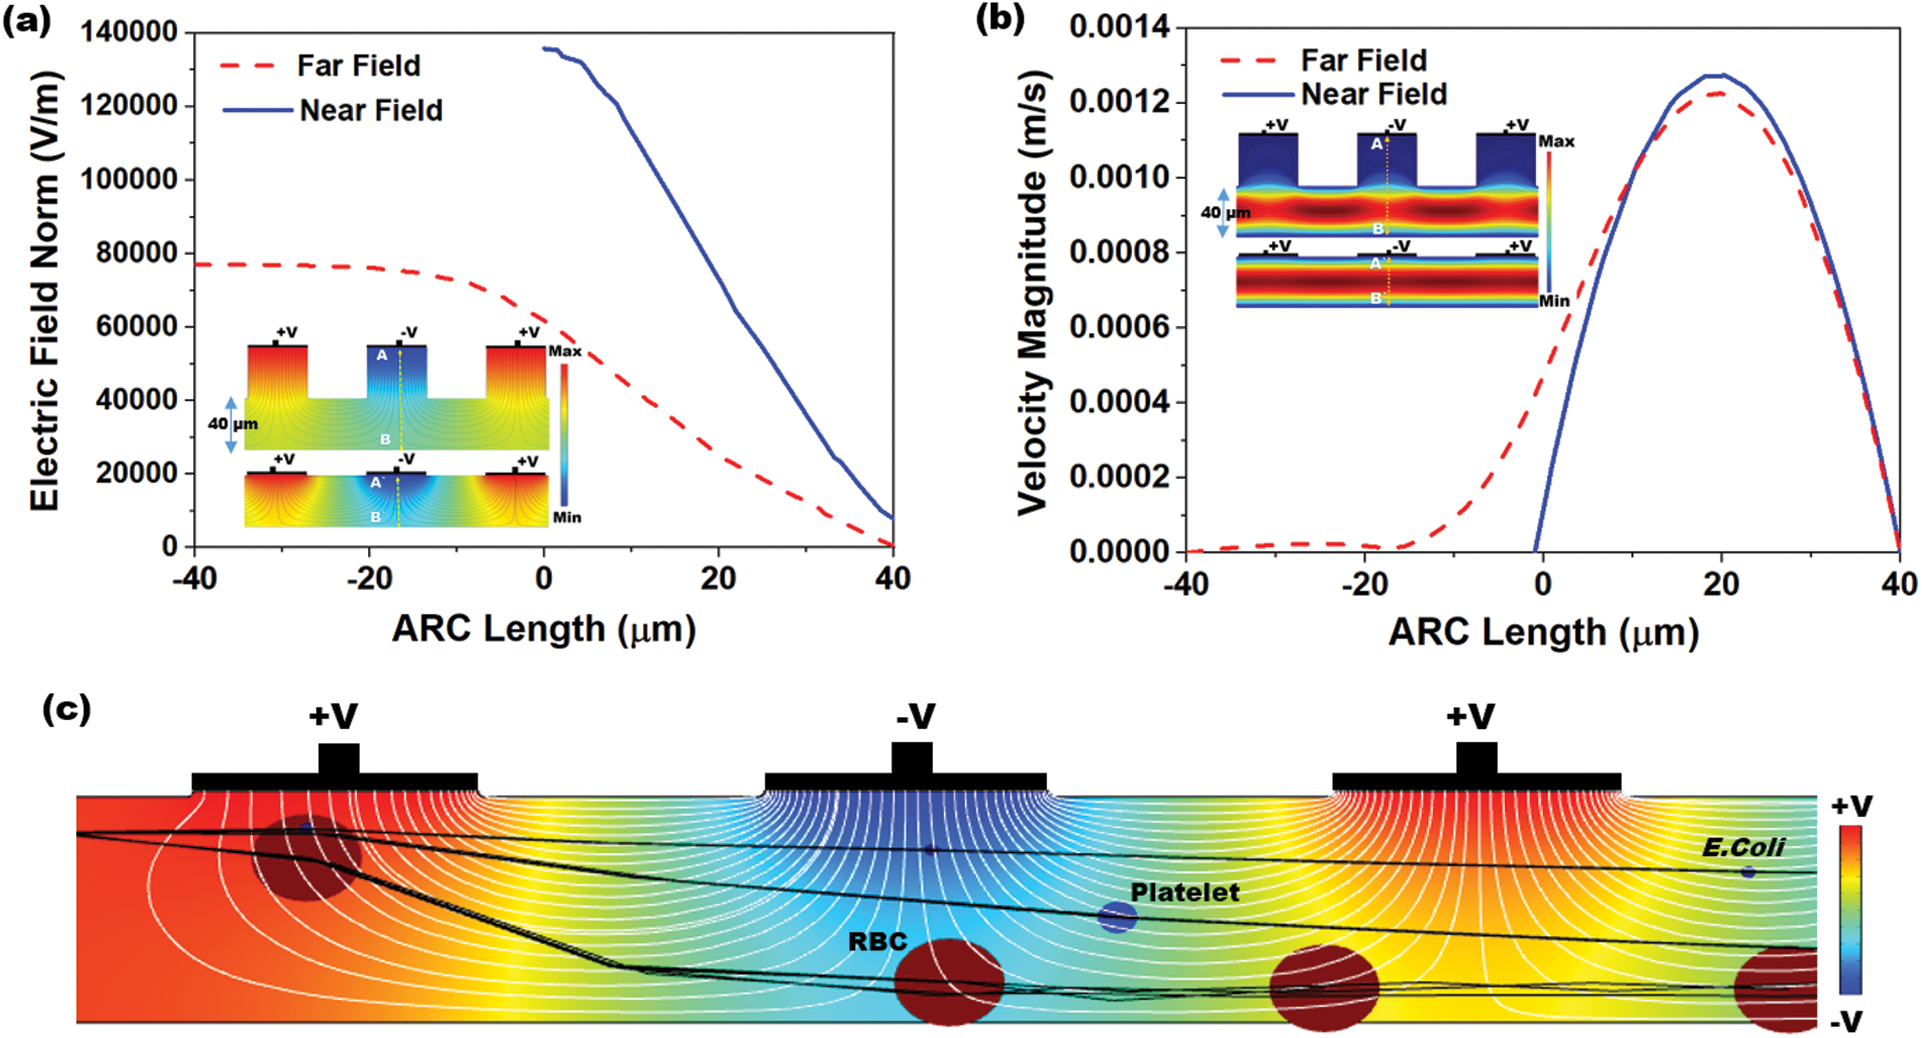
Figure 4: Simulation response obtained for: (a) Distribution of electric field profile for both far (doted-red) and near field (blue) position of electrodes (inset: Colour map of electric field distribution inside the microchannel); (b) Velocity magnitude profile for far-field position of electrodes show an asymmetric velocity profile (doted-red) within the channel width (40  m) due to dead-space whereas for near field position of electrode show a symmetric distribution (inset: Colour map of velocity magnitude profile); (c) Different streamline path for three different particles (RBC, platelet and E. coli) under near field dielectrophoretic force when operated at a differential voltage of 10 V
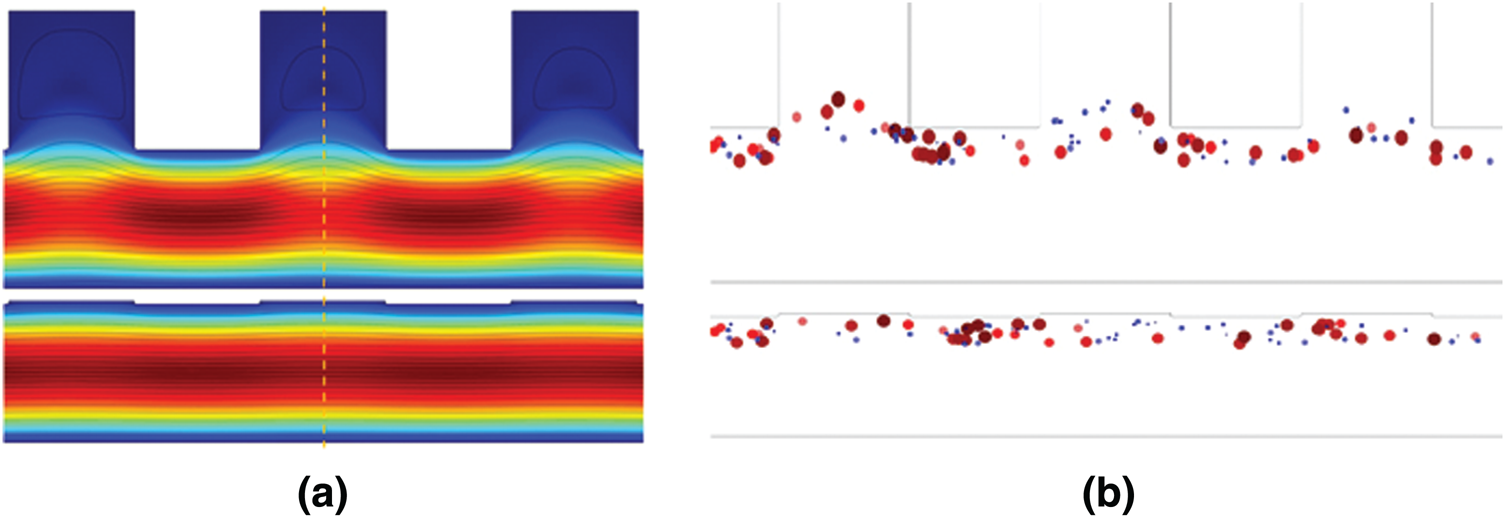
Figure 5: (a) The velocity distribution in the channel (b) particle movement for both far field and near field electrode placement
The above two effects were effectively controlled the particle moment since the particle remains in the electrical field for a relatively long time in near field condition than that of far-field condition. Fig. 4c shows the moment of different particles (RBC, Platelet and E. coli) into different streamlines when entered into the active electric field region. Initially, all the particles released at the entrance had appeared as single streamline in the channel before it entered into the electrical filed region. However, these particles were, separated and transferred to various streamlines based on their size, electric properties and the applied field strength at the active electric field region. The large particles (RBC) were displaced to a larger extent from the initial streamline. Similarly, the other particles were also displaced proportionally to their sizes.
4.2 Effect of Applied Voltage and the Number of Electrodes on Particle Displacement
In both the far-field and near field conditions, simulations were tested for various applied voltages ranging from 0 to 130 V to pursue the effect of voltage on particle displacement at a constant frequency (100 kHz). Fig. 6 was obtained by subjecting all the particles separately into the far-field micro channel operated between 0 to 54.5 V and near field micro channels operated between 0 to 23 V respectively.
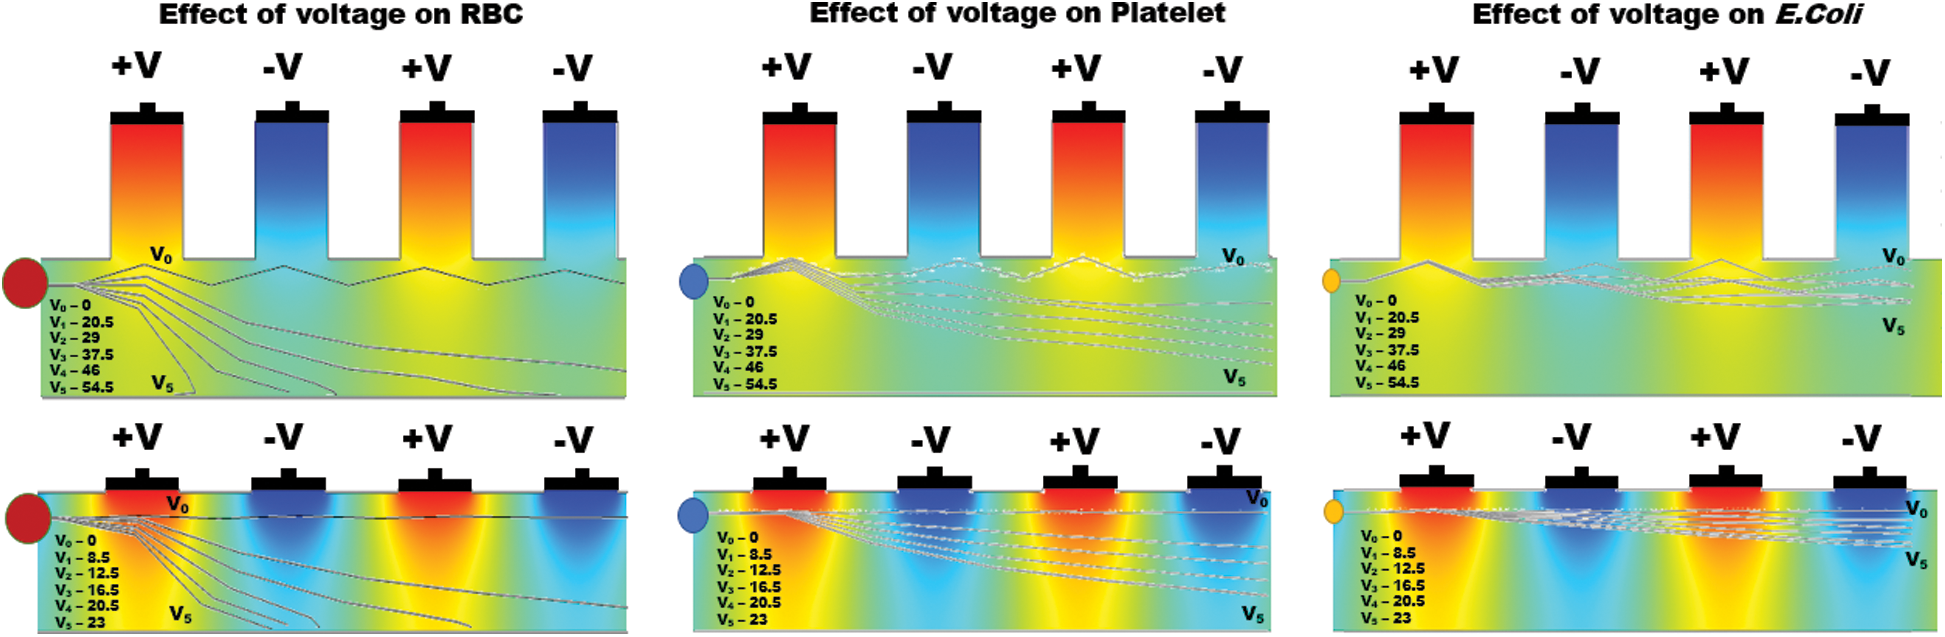
Figure 6: Simulation results show the effect of differential operating voltage from 0 to 55 V for far-field and 0 to 23 V for near field electrode placement applied on various particles (RBC, Platelets and E. coli) and the individual particle trajectories inside the active electric field region of the microchannel
The results showed a merely similar response in the displacement of particles by the near field electrodes at a half reduced operating voltage in comparison with the far-field condition as shown in Fig. 7.
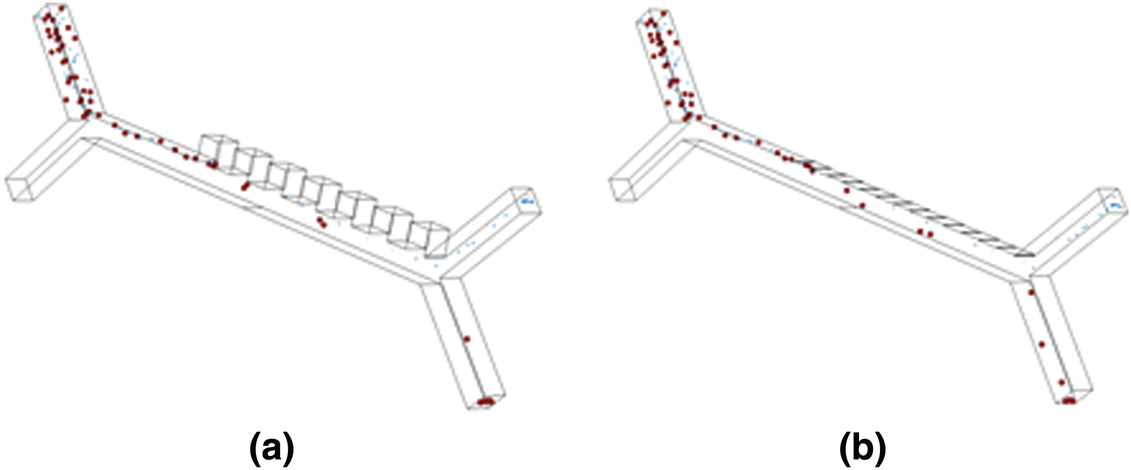
Figure 7: 3D model simulated using COMSOL Multiphysics show the separation of particles (RBC, Platelets and E. coli) when subjected to a non-uniform electrical field at an electrical potential of 12.5 V and 7.5 V in (a) Farfield electrode setup and (b) Nearfield electrode setup respectively
Similar to the RBC and Platelets, E. coli also slightly displaced but the electrokinetic force generated on E. coli was insignificant at lower voltages, however, become significant upon increasing voltage in both far and near field electrode placement. It is also observed that the particle displacement strongly depends on both the operating voltage and the number of electrodes used for a given voltage. From Fig. 6, it is evident that the RBC was displaced strongly to the boundary with the first two differential electrodes when operated at 54.5 V and 23 V for far and near field condition respectively. Whereas, the same RBC was displaced to the boundary with four differential electrodes operated at 29 V and 12.5 V for far and near field respectively. Hence it is understandable that the number of electrodes used and the operating voltage was inversely proportional and optional for user perspective. Despite the advantage of the reduction in operating voltage, increase in a number of electrodes will directly affect the channel footprint (length of the channel) so that it is advisable to use an optimum number of electrodes. In this simulation, the use of near field electrodes advantageous in terms of reduction in operating voltage without changing the channel length as mentioned in far-field condition. Tab. 2 shows the minimum voltage required when the change in a number of electrode pairs from 1 to 5 for both far-field and near field for selective separation of RBC, Platelets and E. coli individually at outlet 2. It is observed that the operating voltage increased with reduced particle size; however, the decrease for all the particles when increased number electrodes. It is also evident that using a minimum voltage of 19.5 V (for N = 4) in case of near field electrode, E. coli (0.68  m) can be separated from plasma whereas this voltage is merely sufficient to separate larger particle-like platelets (mean dia. 1.8
  m) form a plasma in Far-field condition.
Table 2: Minimum voltage dependence for change in the number of electrodes for both far-field and near field perceived from the simulation for selective separation of RBC, Platelets and E. coli individually at outlet 2

4.3 Separation of Platelet and E. coli from the Medium Using Near Field Electrode Micro-Channel
It is important to notice that the above simulations show that the E. coli remained in outlet one along with platelets within the above operating ranges for far and near field conditions. Hence, further simulations were pursued to know the operating range for Platelet separation from E. coli particles using near-field electrodes. As it is observed from Fig. 1, CM factor for all the particles observed negative hence negative DEP applied on all the particles when operated with non-uniform electric field. All the particles, especially including E. coli experience negative DEP force which is clearly observed from Fig. 8, the E. coli, is also changing its streamlines with the increase in voltage finally it enters into outlet 2 (lower outlet in the Fig. 8) at 23 V whereas for the same voltage the platelets were still in the outlet 1 in case of the far-field condition. The operating conditions for Platelet separation were observed from 8.5 V to 22.5 V for near-field electrode condition.

Figure 8: Simulation output shows the selective separation of Platelets (red) from E. coli (blue) when applied near-field potential using near filed electrodes. 8.5 V to 22.5 V found to be a range of voltages for platelet separation. After 23 V the E. coli transferred to platelet outlet
4.4 Effect of Electric Field Frequency on Particle Displacement
A separate study was carried out to understand the effect of operating frequency on particle displacement using Platelet as a model molecule. This study considered a suitable frequency range from 1 Hz to 1 THz since the maximum velocity magnitude in the microchannel observed was 1.35 mm/s (from Fig. 4b). The dielectrophoretic force (negative DEP) acting on the particle is depending on the time of exposure to a non-uniform electric field. In case of low frequencies, less than 100 kHz the particle may not find the change in field direction; hence the particle experiences high electrokinetic force which will result in particle move in resultant force direction. However, in case of high frequencies, more than 1 GHz particle will experience low electrokinetic force due to both repulsive and attractive forces resulted from a change in polarity of electrodes. Hence there is a reduction of the resultant force acting on the particle due to reduced electrokinetic force. However, in such situations to match the particle tracking as in case of low frequencies, high voltages need to apply to compensate the reduced amount of electrokinetic force. Fig. 9, shows a clear transition in the applied voltage for both far and near field electrode placement channels to obtain the RBC to enter into the desired outlet 2. Surprisingly, the frequencies between 2 MHz–50 MHz the particles are attracted towards the electrode and adhere to the upper boundary of the channel as shown in Fig. S2 (Supplementary Material). This strange phenomenon was observed may be attributed to strong electrokinetic attraction force or resultant dipole moment of the particle may be suppressed. Even at large voltages above 500 V, the particles remain held at first pair of electrodes.
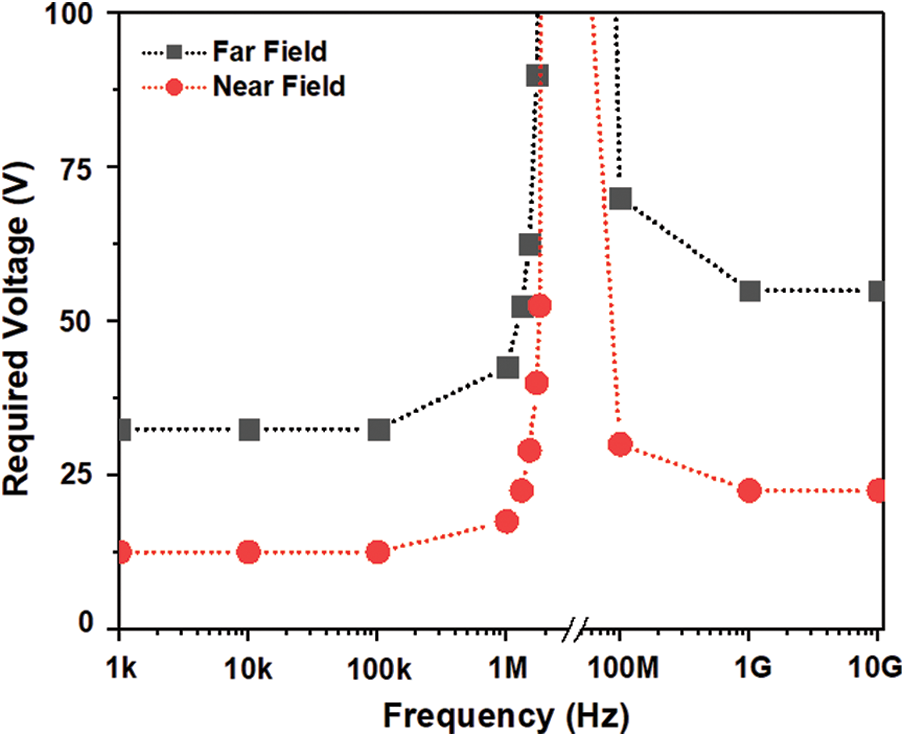
Figure 9: The simulation response obtained for an applied voltage for a change in operating frequency show a transition between 100 kHz to 1 GHz for a predefined particle trace
Dielectrophoresis based microfluidic system was simulated using COMSOL Multiphysics software. This study is focused on selective separation of Platelets and Bacteria from plasma in the viewpoint of effect of electric field geometry, electrode placement along the channel and operating voltage at various frequencies. A novel near field electrode placement concept was introduced to separate the particles at reduced operating voltages in comparison with far-field electrode placement. A minimum separation voltage for ( ) RBC, Platelet and E. coli bacteria in the near field found as 2.6, 7.2 and 19.5 V respectively. Whereas, it is 9, 25 and 67.5 V for a single electrode pair (
 ). This simulation study also describes the advantages of near field electrode placement in terms of confined flow velocity profile and enhanced electric field compared to its counterpart far-field electrode design. Interestingly, the change in operating frequency also show the effect on particle separation hence there observed a requirement in the increase in operating voltage with an increase in frequency for a range of frequencies between 1 kHz to 2 MHz. However inverse relationship found from the frequencies starting from 50 MHz onwards. Further, this study showed separation of small-sized particles like platelets and E. coli from given sample medium by the change in electrode position towards the channel was advantageous in terms of reduced operating voltages specifically for small particle separation. These 2D simulation results were further improved by considering actual geometries of particles and channel in 3D rather considering the average diameter of the particles and width of the channel alone.
Acknowledgement: Authors acknowledge Centre for MEMS, Department of Electronics and Instrumentation, SRM Institute of Science and Technology (SRM IST) for supporting the lab space and computational support. Authors also acknowledge COMSOL Multiphysics® team for their technical support.
Data Availability: The data used to support the findings of this study are included within the article and the supplementary information file(s).
Funding Statement: The author(s) received no specific funding for this study.
Conflicts of Interest: The authors declare that they have no conflicts of interest to report regarding the present study.
1. A. S. Chan, M. K. Danquah, D. Agyei, P. G. Hartley and Y. Zhu. (2014). “A simple microfluidic chip design for fundamental bioseparation,” Journal of Analytical Methods in Chemistry, vol. 2014, no. 1, pp. 1–6. [Google Scholar]
2. S. G. Dastider, S. Barizuddin, N. S. Yuksek, M. Dweik and M. F. Almasri. (2015). “Efficient and rapid detection of salmonella using microfluidic impedance based sensing,” Journal of Sensors, vol. 16, no. 1, pp. 8. [Google Scholar]
3. J. P. Lafleur, A. Jönsson, S. Senkbeil and J. P. Kutter. (2016). “Recent advances in lab-on-a-chip for biosensing applications,” Biosensors and Bioelectronics, vol. 76, pp. 213–233. [Google Scholar]
4. K. Huikko, R. Kostiainen and T. Kotiaho. (2003). “Introduction to micro-analytical systems: Bioanalytical and pharmaceutical applications,” European Journal of Pharmaceutical Sciences, vol. 20, no. 2, pp. 149–171. [Google Scholar]
5. F. A. Gomez. (2013). “The future of microfluidic point-of-care diagnostic devices,” Bioanalysis, vol. 5, no. 1, pp. 1–3. [Google Scholar]
6. M. Yamada, M. Nakashima and M. Seki. (2004). “Pinched flow fractionation: Continuous size separation of particles utilizing a laminar flow profile in a pinched microchannel,” Anayitical Chemistry, vol. 76, no. 18, pp. 5465–5471. [Google Scholar]
7. J. T. Ma, Y. Q. Xu and X. Y. Tang. (2016). “A numerical simulation of cell separation by simplified asymmetric pinched flow fractionation,” Computational and Mathematical Methods in Medicine, vol. 2016, pp. 8. [Google Scholar]
8. Y. Gou, Y. Jia, P. Wang and C. Sun. (2018). “Progress of inertial microfluidics in principle and application,” Sensors, vol. 18, no. 6, pp. 1762. [Google Scholar]
9. R. Ozawa, H. Iwadate, H. Toyoda, M. Yamada and M. Seki. (2019). “A numbering-up strategy of hydrodynamic microfluidic filters for continuous-flow high-throughput cell sorting,” Lab on a Chip, vol. 19, no. 10, pp. 1828–1837. [Google Scholar]
10. R. Wang. (2013). “Hydrodynamic trapping of particles in an expansion-contraction microfluidic device,” Abstract and Applied Analysis, vol. 2013, pp. 6. [Google Scholar]
11. B. Deng, X. F. Li, D. Y. Chen, L. D. You, J. B. Wang et al. (2014). , “Parameter screening in microfluidics based hydrodynamic single-cell trapping,” Scientific World Journal, vol. 2014, pp. 8. [Google Scholar]
12. S. Song and S. Choi. (2013). “Design rules for size-based cell sorting and sheathless cell focusing by hydrophoresis,” Journal of Chromatography A, vol. 1302, pp. 191–196. [Google Scholar]
13. T. Salafi, Y. Zhang and Y. Zhang. (2019). “A review on deterministic lateral displacement for particle separation and detection,” Nano-Micro Letters, vol. 11, pp. 77. [Google Scholar]
14. Y. Chang, S. Chen and C. Hsu. (2013). “Study on microchannel design and burst frequency detection for centrifugal microfluidic system,” Advances in Materials Science and Engineering, vol. 2013, pp. 9. [Google Scholar]
15. H. Wei, B. Chueh, H. Wu, E. Hall, C. W. Li et al. (2011). , “Particle sorting using a porous membrane in a microfluidic device,” Lab on a Chip, vol. 11, no. 2, pp. 238–245. [Google Scholar]
16. W. Lee, P. Tseng and D. D. Carlo. (2017). Microtechnology for cell manipulation and sorting, 1 ed., New York: Springer International Publishing, pp. 57–92. [Google Scholar]
17. B. D. Plouffe, S. K. Murthy and L. H. Lewis. (2015). “Fundamentals and application of magnetic particles in cell isolation and enrichment: A review,” Reports Progress in Physics, vol. 78, no. 1, pp. 16601. [Google Scholar]
18. M. Wu, A. Ozcelik, J. Rufo, Z. Wang, R. Fang et al. (2019). , “Acoustofluidic separation of cells and particles,” Microsystems & Nanoengineering, vol. 5. [Google Scholar]
19. A. Atajanov, A. Zhbanov and S. Yang. (2018). “Sorting and manipulation of biological cells and the prospects for using optical forces,” Micro and Nano Systems Letters, vol. 6. [Google Scholar]
20. M. Li, W. H. Li, J. Zhang, G. Alici and W. Wen. (2014). “A review of microfabrication techniques and dielectrophoretic microdevices for particle manipulation and separation,” Journal of Physics D: Applied Physics, vol. 47, no. 6, pp. 1–29. [Google Scholar]
21. R. Pethig. (2010). “Dielectrophoresis: Status of the theory, technology, and applications,” Biomicrofluidics, vol. 4, no. 2, pp. 1–35. [Google Scholar]
22. W. S. Low, N. A. Kadri and W. A. B. W. Abas. (2014). “Computational fluid dynamics modelling of microfluidic channel for dielectrophoretic biomems application,” Scientific World Journal, vol. 2014, no. 1, pp. 1–11. [Google Scholar]
23. M. S. Pommer, Y. Zhang, N. Keerthi, D. Chen, J. A. Thomson et al. (2008). , “Dielectrophoretic separation of platelets from diluted whole blood in microfluidic channels,” Electrophoresis, vol. 29, no. 6, pp. 1213–1218. [Google Scholar]
24. N. Piacentini, G. Mernier, R. Tornay and P. Renaud. (2011). “Separation of platelets from other blood cells in continuous-flow by dielectrophoresis field-flow-fractionation,” Biomicrofluidics, vol. 5, no. 3, 34122. [Google Scholar]
25. Q. Ren, Y. Wang, X. Lin and C. L. Chan. (2019). “AC electrokinetic induced non-Newtonian electrothermal blood flow in 3D microfluidic biosensor with ring electrodes for point-of-care diagnostics,” Journal of Applied Physics, vol. 126, no. 8, 84501. [Google Scholar]
26. A. Salari, M. Navi, T. Lijnse and C. Dalton. (2019). “AC electrothermal effect in microfluidics: A review,” Micromachines, vol. 10, no. 11, pp. 1–27. [Google Scholar]
27. I. Ertugrul and O. Ulkir. (2020). “Dielectrophoretic separation of platelet cells in a microfluidic channel and optimization with fuzzy logic,” Royal Society of Chemistry Advanced, vol. 10, pp. 33731–33738. [Google Scholar]
28. J. K. Sethi and M. Mittal. (2019). “A new feature selection method based on machine learning technique for air quality dataset,” Journal of Statics and Management Systems, vol. 22, no. 4, pp. 697–705. [Google Scholar]
29. J. Prasanna, M. S. P. Subathra, M. A. Mohammed, M. S. Maashi and B. G. Zapirain. (2020). “Detection of focal and non-focal electroencephalogram signals using fast walsh-hadamard transform and artificial neural network,” Sensors, vol. 20, pp. 20. [Google Scholar]
30. M. A. Mohammed, K. H. Abdulkareem, S. A. Mostafa, M. K. A. Ghani, M. S. Maashi et al. (2020). , “Voice pathology detection and classification using convolutional neural network model,” Applied Science, vol. 10, pp. 13. [Google Scholar]
31. M. K. A. Ghani, M. A. Mohammed, N. Arunkumar, S. A. Mostafa, D. A. Ibrahim et al. (2020). , “Decision-level fusion scheme for nasopharyngeal carcinoma identification using machine learning techniques,” Neural Computing and Applications, vol. 32, no. 3, pp. 625–638. [Google Scholar]
32. O. I. Obaid, M. A. Mohammed, M. K. A. Ghani, S. A. Mostafa and F. T. A. Dhief. (2018). “Evaluating the performance of machine learning techniques in the classification of Wisconsin breast cancer,” International Journal of Engineering & Technology, vol. 7, pp. 160–166. [Google Scholar]
33. M. Mittal, R. K. Sharma and V. P. Singh. (2015). “Modified single pass clustering with variable threshold approach,” International Journal of Innovative Computing, Information and Control, vol. 11, pp. 375–386. [Google Scholar]
34. N. A. Rahman, F. Ibrahim and B. Yafouz. (2017). “Dielectrophoresis for biomedical sciences applications: A review,” Sensors, vol. 17, no. 3, pp. 1–27. [Google Scholar]
35. D. Li. (2008). Encyclopedia of Microfluidics and Nanofluidics, 2 ed. Springer, pp. 402–411. [Google Scholar]
36. N. Lewpiriyawong and C. Yang. (2012). “AC-dielectrophoretic characterization and separation of submicron and micron particles using sidewall AgPDMS electrodes,” Biomicrofluidics, vol. 6, no. 1, pp. 6–15. [Google Scholar]
37. T. B. Jones. (2005). “Electro mechanics of particles,” 1 ed. Cambridge: Cambridge University Press, pp. 34–82. [Google Scholar]
38. R. R. Pethig. (2017). “Dielectrophoresis theory, methodology and biological applications,” 1 ed. Hoboken: John Wiley & Sons Ltd., pp. 31–141. [Google Scholar]
39. J. Cottet, O. Fabregue, C. Berger, F. Buret, P. Renaud et al. (2019). , “MyDEP: A new computational tool for dielectric modeling of particles and cells,” Biophysical Journal, vol. 116, no. 1, pp. 12–18. [Google Scholar]
40. Y. A. Cengel and J. M. Cimbala. (2017). “Fluid mechanics: Fundamentals and applications introduction and basic concepts,” 4 ed. New York: McGraw-Hill College, pp. 611–650. [Google Scholar]
41. T. Braschler, L. Metref, R. Z. Marabi, H. V. Lintel, N. Demierre et al. (2007). , “A simple pneumatic setup for driving microfluidics,” Lab on a Chip, vol. 7, no. 4, pp. 420–422. [Google Scholar]
42. N. Demierre, T. Braschler, P. Linderholm, U. Seger, H. V. Lintel et al. (2007). , “Characterization and optimization of liquid electrodes for lateral dielectrophoresis,” Lab on a Chip, vol. 7, no. 3, pp. 355–365. [Google Scholar]
43. Y. Huang and R. Pethig. (1991). “Electrode design for negative dielectrophoresis,” Measurement Science and Technology, vol. 2, no. 12, pp. 1142–1146. [Google Scholar]
44. M. Egger and E. Donath. (1995). “Electrorotation measurements of diamide-induced platelet activation changes,” Biophysical Journal, vol. 68, no. 1, pp. 364–372. [Google Scholar]
45. F. J. G. Diego, M. R. Chavarría, P. Beltrán and F. J. Espinós. (2019). “Characterization of simple and double yeast cells using dielectrophoretic force measurement,” Sensors, vol. 19, no. 17, pp. 28–31. [Google Scholar]
46. P. V. Jones, A. F. DeMichele, L. K. Kemp and M. A. Hayes. (2014). “Differentiation of Escherichia coli serotypes using DC gradient insulator dielectrophoresis,” Analytical and Bioanalytical Chemistry, vol. 406, no. 1, pp. 183–192. [Google Scholar]
Supplementary Figures
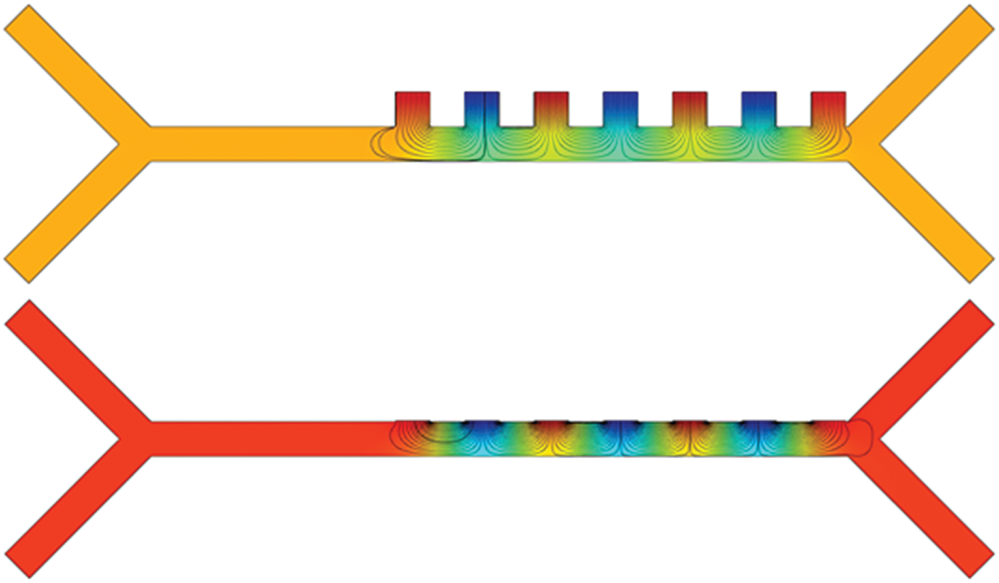
Figure S1: The simulation response for electrical field distribution when operated at 10 V (100 kHz)
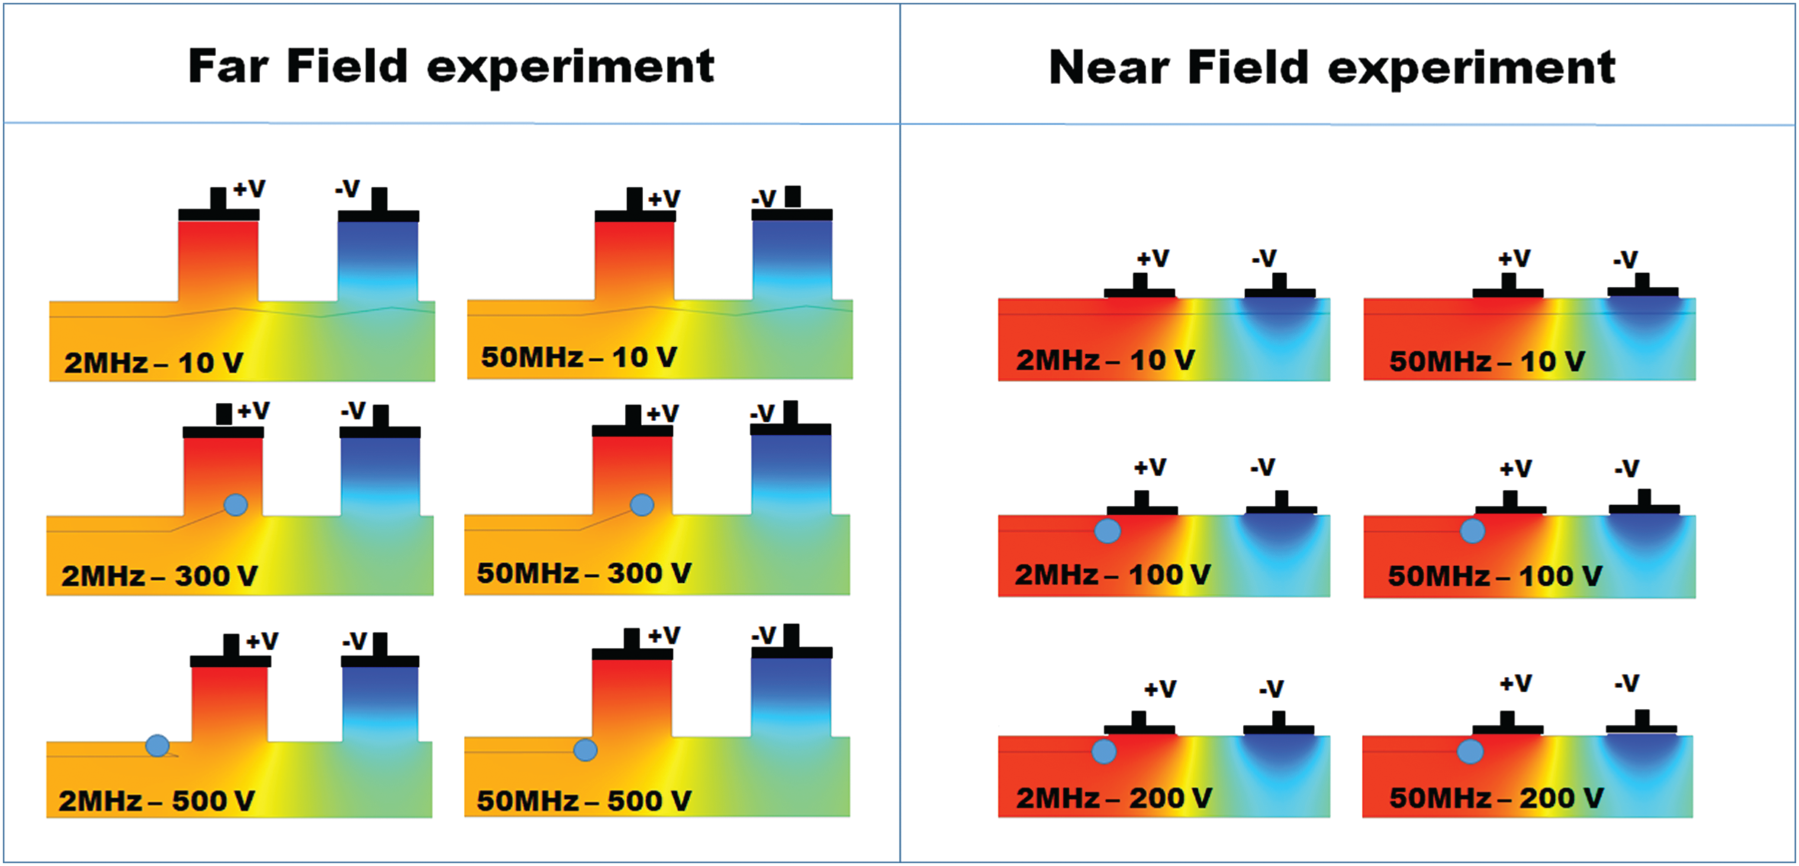
Figure S2: Particle trajectory when operated at above 2 MHz to 50 MHz show an adhering effect to the electrode when operated at high voltages whereas at low voltages particle flow through the its normal streamline
 | This work is licensed under a Creative Commons Attribution 4.0 International License, which permits unrestricted use, distribution, and reproduction in any medium, provided the original work is properly cited. |