DOI:10.32604/cmc.2021.015151
| Computers, Materials & Continua DOI:10.32604/cmc.2021.015151 | |
| Article |
Liver-Tumor Detection Using CNN ResUNet
1Department of Computer Science, Government College University Faisalabad, Faisalabad, 38000, Pakistan
2Department of IT and Computer Science, Pak-Austria Fachhochschule Institute of Applied Sciences and Technology, Haripur, 22620, Pakistan
3Department of Computer Science, Islamia College Peshawar, Peshawar, KP, Pakistan
4Institute of Computing, Kohat University of Science and Technology, Kohat, Pakistan
5Department of Industrial Engineering, College of Engineering, King Saud University, Riyadh, 11421, Saudi Arabia
6Department of Statistics and Operations Research, College of Science, King Saud University, Riyadh, 11421, Saudi Arabia
*Corresponding Author: Muhammad Arif Shah. Email: arif.websol@gmail.com
Received: 08 November 2020; Accepted: 05 December 2020
Abstract: Liver tumor is the fifth most occurring type of tumor in men and the ninth most occurring type of tumor in women according to recent reports of Global cancer statistics 2018. There are several imaging tests like Computed Tomography (CT), Magnetic Resonance Imaging (MRI), and ultrasound that can diagnose the liver tumor after taking the sample from the tissue of the liver. These tests are costly and time-consuming. This paper proposed that image processing through deep learning Convolutional Neural Network (CNNs) ResUNet model that can be helpful for the early diagnose of tumor instead of conventional methods. The existing studies have mainly used the two Cascaded CNNs for liver segmentation and evaluation of Region Of Interest (ROI). This study uses ResUNet, an updated version of U-Net and ResNet Models that utilize the service of Residential blocks. We apply over method on the 3D-IRCADb01 dataset that is based on CT slices of liver tumor affected patients. The results showed the True Value Accuracy around 99% and F1 score performance around 95%. This method will be helpful for early and accurate diagnose of the Liver tumor to save the lives of many patients in the field of Biotechnology.
Keywords: Liver; tumor; diagnose; ResUNet; CNNs; segmentation
The liver is the main organ of the body which plays an important role in food digestion and filtration of red blood cells along with the conserving of food into energy [1]. When the liver cells begin to grow from the normal level, they can transform into a tumor. Liver cancer is becoming a widely spread type of tumor that is affecting both men and women in different countries of the world [2]. According to the report, it is the fifth most common type of tumor in men and the ninth most common type of tumor in women since 2018 [3].
For the diagnose of the Liver tumor, ultrasound is the most commonly used method around the world. But it is not preferable for small stage liver cancers diagnoses and the results are mainly based on the expertise of ultrasound specialists [4]. Apart from it, Computed Tomography (CT) is another good option, but it also has some weaknesses in diagnosing the targeting cancer cells and their damages [5]. The interpretation techniques of CT scans are manually and subjective, Moreover, they have high chances of errors. On the other hand, MRI is available and it helps in diagnose by utilizing advanced surveillance, but it is highly expensive and has many associated side effects during the stage of the screening [6]. Moreover, for complex types of liver tumors, MRI is unable to diagnose [7].
Unlike the traditional type of screening, the convolution neural networks (CNNs) can provide support for deep learning about the liver tumor [4]. The performance of CNNs is outstanding even in some cases it has passed the expertise of humans in radiology. From the past many years, CNNs have been used widely in the medical imaging of different types of tumors [8]. But, for liver tumors, this technique was not utilized. Only a few laboratory experiments have been done to enhance the diagnostic capability of image processing [1]. There are many limitations in the past studies as they included the images from the enhanced version of MRI and CT scan. The dataset was limited and based on only 500 patients [2]. Moreover, few categories of the liver tumor were tested using the CNNs technique.
This study is designed to overcome the gap of previous studies and evaluate the outcomes of the deep-learning model of CNNs of a large dataset of tumors. A new approach is designed to identify different types of tumors along with improving results in image classification. The main target is to build a strong and robust CNNs model that can identify the Region of Interest (ROI) by accessing the features from neighboring areas. This model will be helpful to diagnose even the small-scale liver tumor in the human body. For increasing the readability of reader the abbreviations use din in this pare are listed in Tab. A1 in appendix.
The rest of the paper is organized as follows: In the second section, the basic terms of liver tumors and CNNs are presented. In section three, the literature review is discussed by evaluating the outcomes of research approaches related to liver tumors and CNNs. Apart from it, section four is related to methodology design that is based on experiments. On the other hand, section five is based on experimental results that are extracted from real testing. In the end, the conclusion and discussion are included in section six.
2 Liver Tumors and Convolutional Networks
The liver is the major part of the body which is composed of two lobs; the right lobe and the left lobe. These lobs work to generate Bile juice into the digestive system to help the absorption of nutrients and detoxification from toxic chemicals [9]. Fig. 1 shows the anatomy along with labeled lobes.
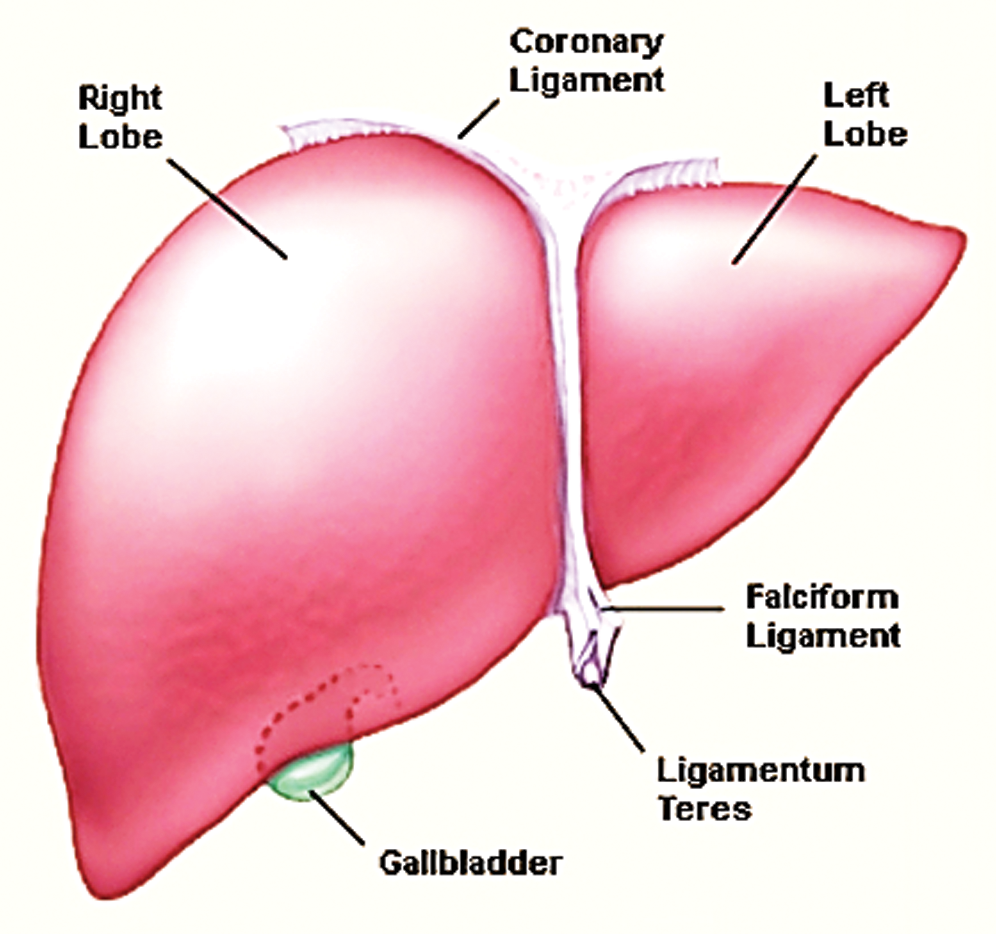
Figure 1: Liver anatomy adopted by study [11]
The liver tumor is based on different stages that requires different testing and treatment protocols based on the area of infection [1]. Among all the liver tumor types, hepatocellular carcinoma is one of the deadly forms of liver tumor which caused the death of many people around the world [10]. There are nearly 840,000 new liver tumor cases in 2018 in the world. Fig. 2 shows the situation of the infected liver tumor and its stages.
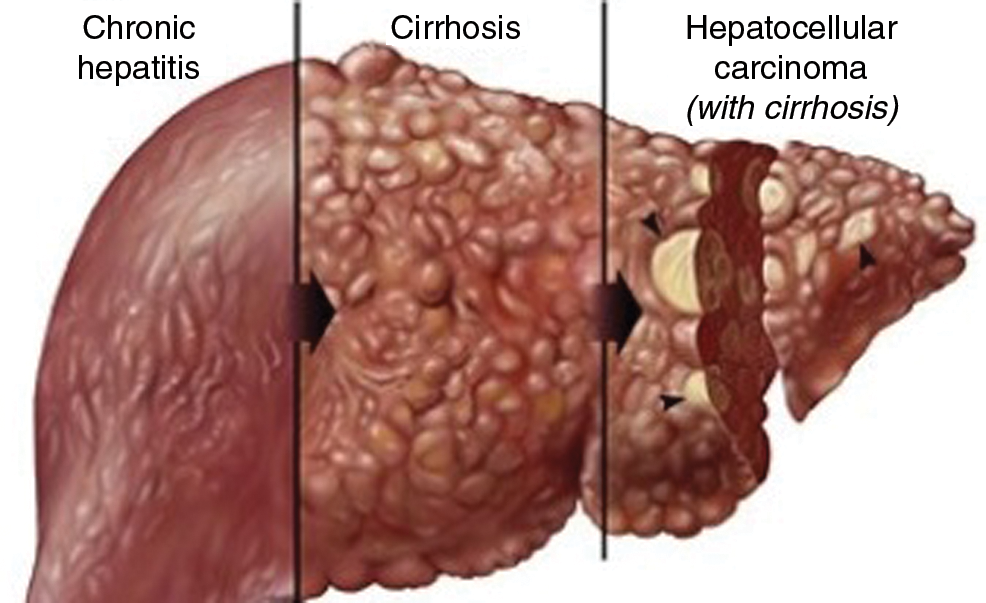
Figure 2: Hepatocellular carcinoma adopted by study [12]
CNNs mainly have one more convolutional, fully connected, and rectified linear units’ layers that help in deep learning. The accuracy of the results is based on the complexity of CNNs layers [8]. The researchers have been using CNNs for image classification in medical science [13]. They are working on feature extraction phenomena through convolution layers before the down sampling. The encoding and decoding stages are time taking and they consume memory for storage.
In the detection of tumors, 2D and 3D images either in 2D or 3D format for the extraction of features during the liver segmentation stage [5]. After that box sampling is helpful to divide the information of image into small sections. After that lesion segmentation can extract the affected area of the liver. CNNs can be considered programmed feature extractors from the given data. While in the event that utilize a calculation with pixel vector it lose a ton of spatial collaboration between pixels, a CNN successfully utilizes contiguous pixel data to viably down sample the images first by convolution and afterward utilizes a forecast layer toward the end. In this CNNs based diagnosis methodology, even the small size tumor is also detectable. Fig. 3 is helpful to analyze the working of CNNs through image segmentation and information sampling.
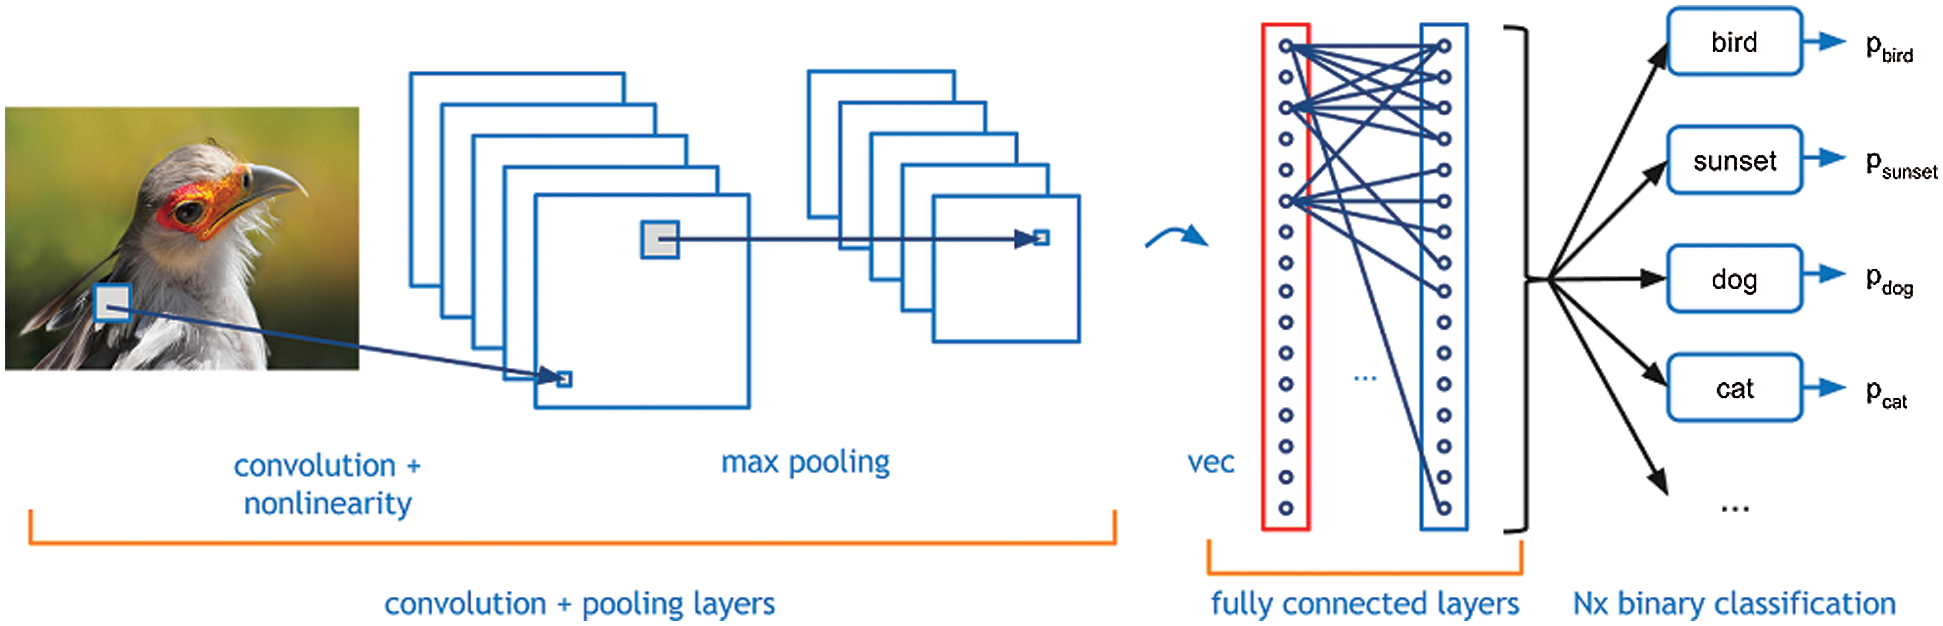
Figure 3: Convolutional neural networks on image adopted by [14]
Apart from it, ResNet is the modified Residential Blocks that work on Artificial Neural Networks terms [15]. The Skip Connections concept is used in Residential Blocks, which provides support in simplifying and accelerating the deep learning process in complex networks [16]. Moreover, Residential Blocks utilize the information from previous layers to identify the depth of the problem [16]. Fig. 4 shows the working structure of ResNet along with a description of layers.
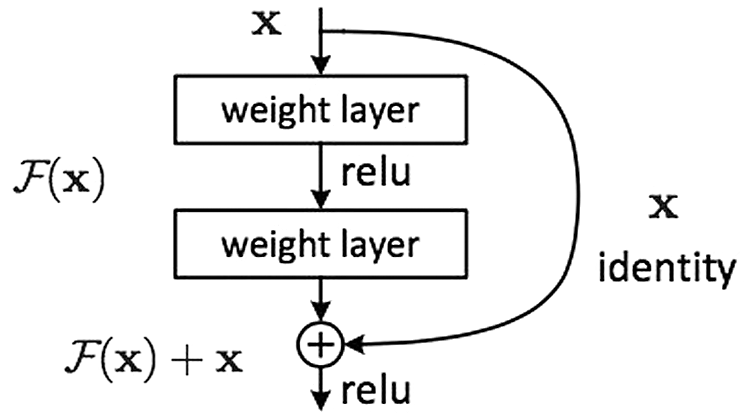
Figure 4: ResNet residential block adopted by [14]
On the other hand, ResUNet is a combination of U-Net and ResNet models that provides extensive replacement of convolution blocks with residential blocks [17]. ResUNet is one step ahead in creating ease for CNN along with utilizing the advantage of U-Net and ResNet [8]. Information degradation is eliminated through ResUNet that supports utilizing a few training parameters [2]. Residential blocks in reality are convolution blocks along with mapping identity that creates support in image segmentation. They are helpful for even a small-scale tumor detection through ResUNet mode.
The researchers included the ideas about the liver tumor diagnosis through Convolutional Neural Network. Reference [17] stated the concept of liver tissues. They differentiated between the normal and abnormal cells of the liver while presenting a dataset include 79 H&E stained liver tissue WSIs of HepatoCellular Carcinoma (HCC), where 48 was HCC tissue, and 31 was normal tissue [17]. They also argued that in the segmentation of normal and abnormal cells, CNNs could not only provide cell-level information but also could give the cell structure information. [17] proposed a technique of using high magnification and low magnification maps with cell level and structure level respectively to differential the general CNN. The findings suggested through CNNs 91% on Liver HCC tumor detection diagnoses are possible. Almost all the existing studies finding the exact location of tumor but accuracy and processing time is not promising as the need of pharmacist.
On the other hand, a study [18] in their research paper identified benign and malignant tumors. They have utilized dataset contrast-enhanced ultrasonography (CEUS) in the form of video that was divided into two subsets 80% training data set and 20% testing data set [17]. These data sets were handled by a 3D convolution neural network to extract the three dimensional and historical features. The authors used a 10-fold cross-validation technique to avoid sampling error. The results showed the 93.1% accuracy rate on the behalf of ten-fold cross-validation technique.
Apart from it, study [1] proposed the use of CNN to reduce the liver computed tomography images by lowering the time consumption and expenditure on maintenance. The researcher upgraded the model and generated the scope for a fused perceptual hash-based convolution neural network (F-PH-CNN) for differential diagnosis between benign and malignant. In the research methodology, 34 malign and 41 benign datasets were used [1]. During the main three stages of methodology, perceptual hashing, feature extraction, and differentiation between benign and malignant were done. The results declared the 98.2% accuracy of the F-PH-CNN technique with the simulation of ANN.
Rather than it, the study [4] used the deep learning technique along with CNN by adding five major categories; Cellular carcinomas, hepatic-tumors, indeterminate lesions, hemangiomas, and cysts, for sake of implementing computed tomography. The researchers used a training dataset of 55536 images set from the database of 2013 and did testing on 100 liver images from 2016 data [4]. The tests were repeated for five-time and the results provided 92% accuracy.
Similarly, a study [6] worked to compare different liver occurring tumors by using computed tomography images along with implementing the Convolutional neural network (CNN). The researchers used liver segmentation algorithms and deep convolution neural network to calculate the probability by segmenting of each pixel. They utilized the convolution layer to extract the useful feature and minimize the three-dimensional variations by pooling layers in the features and classifying the tumor base on a fully connected layer. On the contrary, [15] did liver lesion segmentation by deep convolutional neural network using 2.5D CT scans images with the simulation of ResNet and U-net. The researcher used the architecture of model work that was designed on 2.5D instead of 3D. The training and testing were continued for four consecutive days by using NIVIDIA Titan X GPU with 3584 cores and 12 GB memory. But, the researchers still obtained an average Dice Coefficient (F1 Score) of 67% on the evaluation of 70 test CT scans images.
Reference [2] proposed a cascade approach where initially segmentation of the liver was done and then its tumors using 200 Computer Tomography (CT) images. The researchers utilized 130 images for training and 70 images for testing by a densely connected fully convolutional network (DenseNet). Afterward, they tested the model on liver tumor images. The results proposed the average liver Dice Coefficient (F1 Score) of 93% on the 14 volume of the dataset. On the contrary, [8] stated the fully automated model for classification of the liver and unhealthy tissues using computed tomography CT images by DRIU is a Fully Convolutional Network (FCN). At the initial stage, the model learned from pixels of the liver to detect the actual area of the liver for accurate diagnoses of the normal or abnormal tissues [8]. The testing proposed that there were some limitations in the trials in adjusting the algorithm according to the complexity of samples.
There were also other problems as the research methodology of [8] was not able to examine the entire biological tissue. Apart from it, other approaches of researchers which discussed here have utilized only cell level information-based pattern on a single scale high magnification patch. There were not able to detect the tumor-based cells completely. The detection of the liver normal and abnormal cell was a difficult task that needed a detailed analysis of layers of 3-D images.
This paper tries to overcome the gap in previous studies. Existing studies utilized convolutional network architecture for facilitating in multi magnification input but also providing the cell structure information regarding low magnification patches. In the observation of previous studies and their lacking areas, the researchers in the present study are trying VGG and Inception V4 based on the convolution network to achieve the 91% mIOU on HCC tumors. The research methodology is designed to achieve more accuracy to meet the expectation in the liver tumor diagnosis.
In the wake of neglecting to accomplish the ideal outcomes with a U-Net model they accompanied another model that joins the upsides of a U-Net model with the benefits of the ResNet model and called it ResUNet. ResUNet uses remaining squares which use skip-associations rather than the customary convolutions utilized by the conventional U-Net in this manner bringing about quicker preparing with less information.
The methodology is based on the stages which we utilized to implement our research project of liver tumor diagnosis through CNNs and ResUNet model. The pre-processing is done to extract the 99% accuracy of results from testing as well as training data. This method is proposed to extract useful segments from liver tumor images with time and cost-efficiency. Fig. 5 shows a complete overview of the methodology section. The experiments are used as a research methodology to diagnose liver tumors through CNNs.
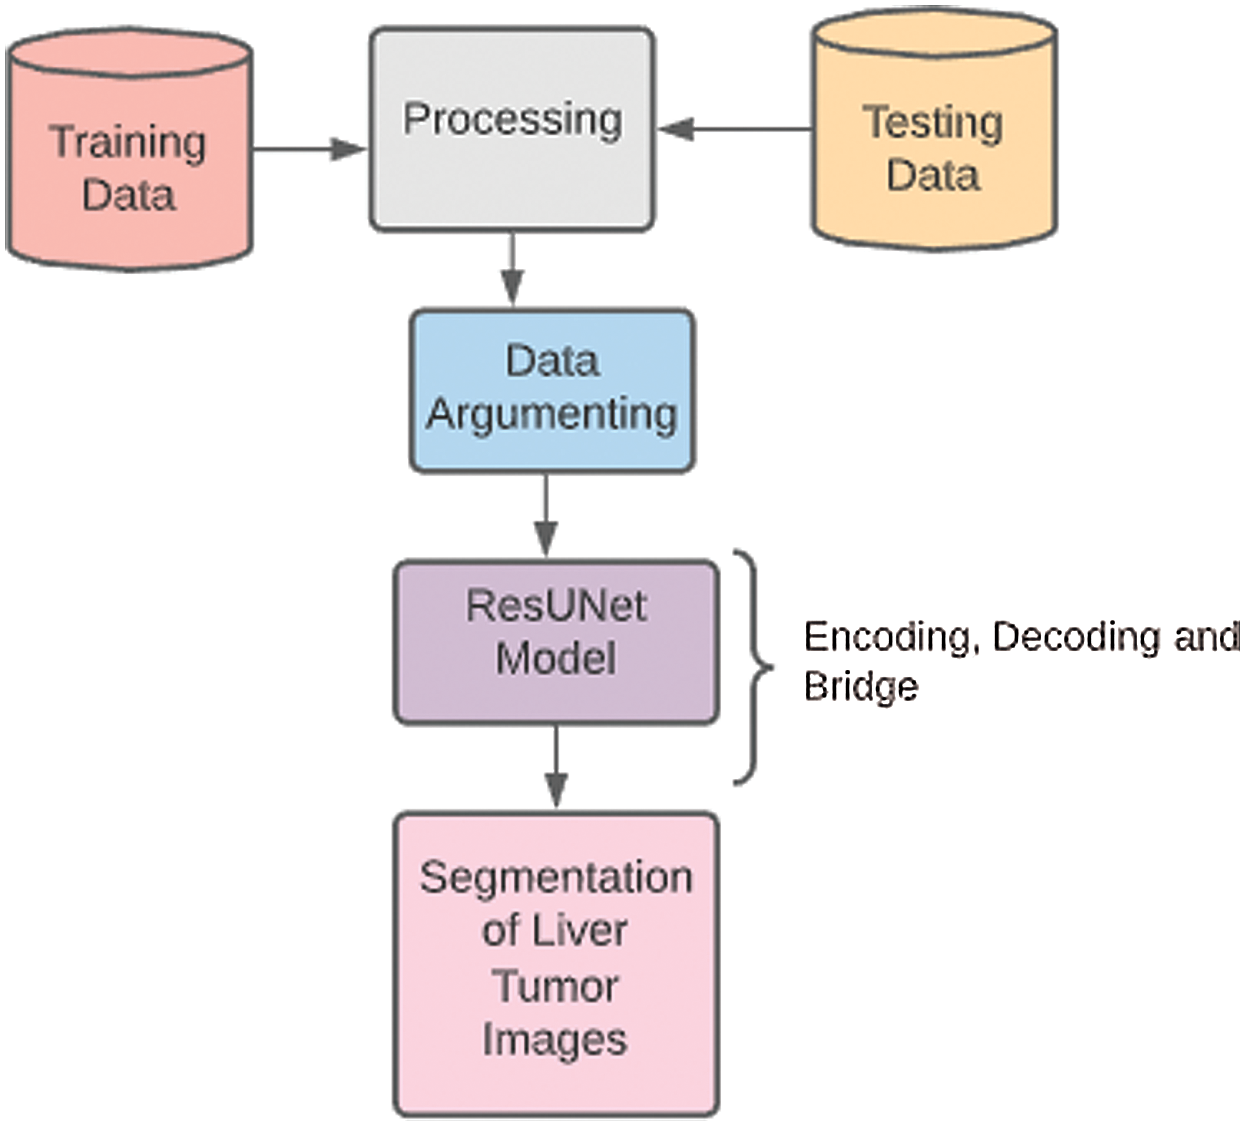
Figure 5: Methodology diagram
Data pre-processing, data augmentation and CNNs models are used to detect the liver and the tumor in the liver neighboring organs. At the initial stage, the study distinguished every slice of liver from its neighborhood organs. The Hounsfield Unit (HU) values allocated to all pixels are computed by conveying gray-scale concentration to all value; greater value means clear and brighter pixels. After slides are read in DICOM format, Hounsfield Windowing was applied to ranges [ −100, 400]. For more brightness and clearness, the researchers applied Histogram Equalization to increase the contrast between the liver and its neighboring organs. Apart from it, for the segmentation of the liver tumor, it was easier to find out with the help of Hounsfield windowing and Histogram Equalization showed the before and after CT image are shown in Fig. 6.

Figure 6: CT images of pre-processing
Our dataset (3Dircadb) has misbalancing classes of CT images pixels but we need the augmentation of the dataset that required more containing tumor pixels. For increasing the quality of data, the researchers used the machine learning tools to avoid the overfitting, under fitting, and fix the non-balancing class for dataset training. Each dataset of CT image slice has its own masks of the liver and tumor. All the various masks merged into 1 mask to enhancing the training and Data augmentation. On the other hand, for increasing the training quality of the dataset, the researchers used the reflection of both liver mask and tumor mask along with the y-axis also rotated every slice to increase the dataset in 90 .
.
4.2 Segmentation of Liver and Tumor
At the dataset, pruning used CNN (ResUNet) for segmentation of the liver. ResUNet trained on both CT scans and Liver masks to detect the Region of Interest (ROI) from the neighboring organs. For tumor segmentation of the liver used the ResUNet, after extracting the ROI and trained on CT scans of the Liver.
The ResUNet is a traditional hybrid between the ResNet and UNet models. ResUNet exchanges the convolutional chunks with residual blocks giving us the benefits of both models. Training of the CNN is ease to use with residual each block and avoids the connections between poor and high levels of the network also leads to minor training parameters each residual unit. Each Block of Residual contains the Two  convolution blocks which are Batch Normalization Layer, ReLU activation layer, and Convolutional layer with Identity mapping. Fig. 7 is showing the complete picture of CNNs implementation on liver tumor images.
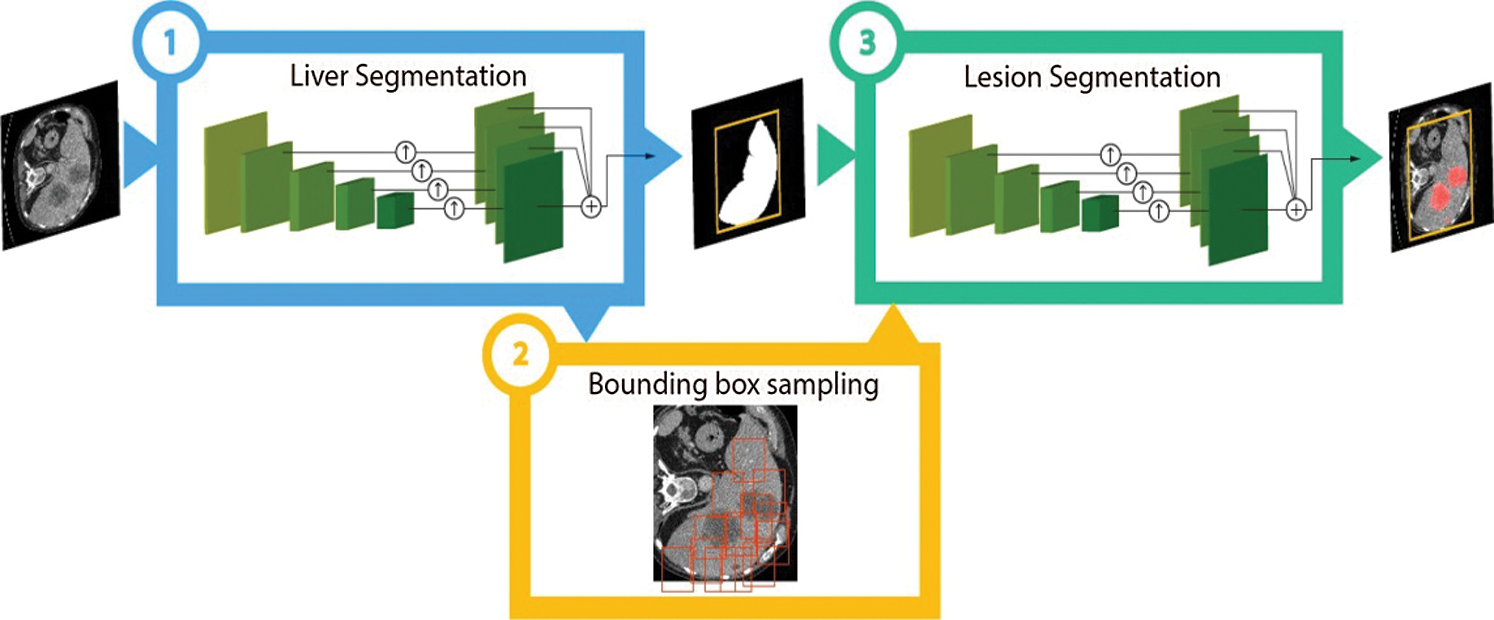
Figure 7: Implementation of CNNs on liver tumor images adopted by study [19]
The ResUNet is built from three paths.
• Encoding: Encode the input to a compact representation
• Decoding: Opposite the Encoding and categorizes the representation in a pixel-wise fashion
• Bridge: Connect the two paths together.
We used the (3Dircadb (http://www.ircad.fr/research/3dircadb)) dataset, which was well-ordered publicly available by the IRCAD Research Institute against digestive cancer, that is self-possessed of 3D CT-scans of 10 men and 10 women within 75% of the cases. The 3D CT-scans images in the DICOM format are divided into 2D-slices with an overall collection of about 2,800 slices in which each slice has a mask for the Liver, Tumors, Bones, Arteries, Kidneys, and Lungs. This dataset was suitable for the implementation of the CNNs model. It was a similar dataset which was proposed by [20] in their research study.
The proposed technique was trained on Google Colab GPU. The results showed the segments of tumor in defected liver images with accuracy and efficiency. CNNs provided efficient results in the detection of even the small size tumor through encoding and decoding small information from segments.
The examination was done on a pixel-to-pixel premise. To assess the outcomes, we applied the assessment measurements given, Tab. 1 shown to the binary class classification of confusion matrix.
Table 1: Dice coefficient (F1 score) results for training and validation data on the ResUNet model for liver segmentation

Accuracy: this shows to the level of accurately arranged pixels to the entirety number of pixels. This could be detailed see Eq. (1):

Recall (Re) or true positive rate (TPR): This shows to the ability of the framework to effectively recognize tumor pixels comparative with the all-out number of genuine tumor pixels, as planned in Eq. (2).

Specificity of the true negative rate (TNR): Shows the average of correctly perceived regular tissue, as describe in Eq. (3).

The overall accuracy percentage is considerably influenced by TNR. Therefore, some other measures are calculated for the tumor class.
Intersection over junction (IoU)—This is the proportion of correctly classified pixels relative to the junction. the expected and actual value of pixels for the same class Eq. (4). Formulated IoU as given in Eq. (4).

Precision (Pr): This procedure in the predicted progressive class, i.e., estimation of a cancer. see Eq. (5) as formulated:

Dice Coefficient (F1 Score): Harmonic mean of recall and accuracy, see Eq. (6) as formulated.

The researchers took the data and evaluated it on the model and the results one of the achieved an Accuracy of 99.8% and a Dice Coefficient (F1 Score) of 99.3%. Tab. 1 is providing the data of Dice Coefficient (F1 Score) and accuracy results on training data. By using the ResUNet model, accuracy of results is improved. From 89%, it has reached to 99.8% that is the successful outcomes of the experiment. The value of Dice Coefficient (F1 Score) also showed significant positive changes that are indication that the liver segmentation is done in a proper way.
One of the irregular examples (see Fig. 8). accomplished an Accuracy of 99.4% and a True Value Accuracy of 98.1%. We can see the Confusion Matrix (see Fig. 9).

Figure 8: CT slice of the first random sample before liver segmentation
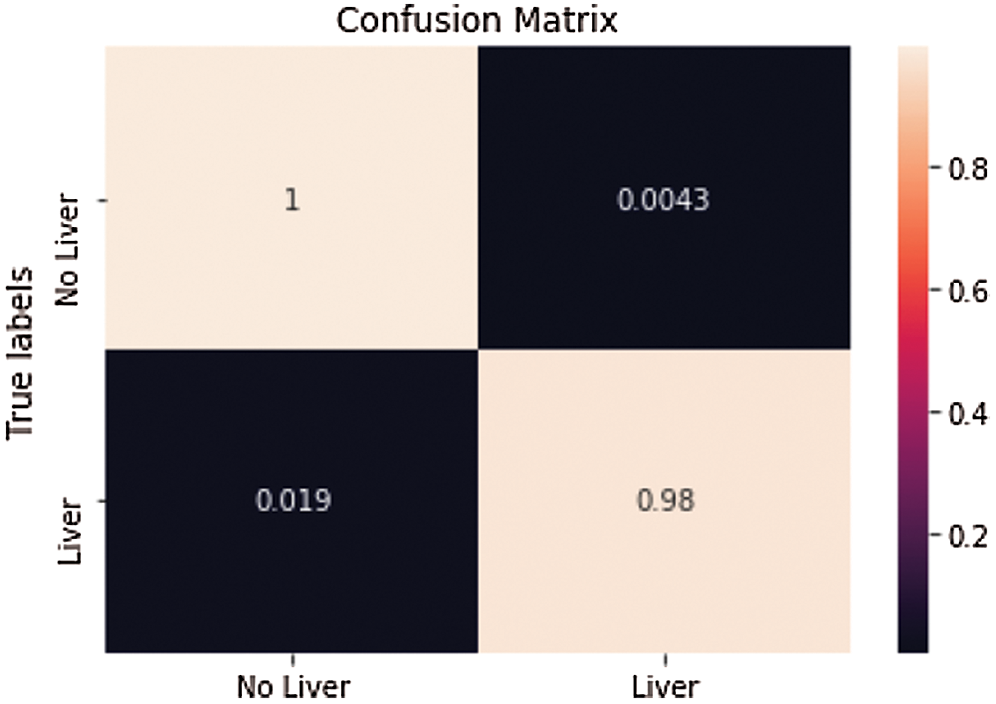
Figure 9: Confusion matrix from the predicted value of the first slice in Fig. 8 after
Consequence of liver segmentation on the first irregular cut (see Fig. 8). True mark on the left and anticipated on the right, white is pixels with liver and dark are pixels with no liver. Confusion matrix (see Fig. 8) from the predicted value of the first slide.
Another arbitrary sample (see Fig. 10) from the liver approval information accomplished an Accuracy of 99.6% and a True Value Accuracy of 97.6%. After the liver segmentation predicted value of the second slice in confusion matrix shown (see Fig. 11).
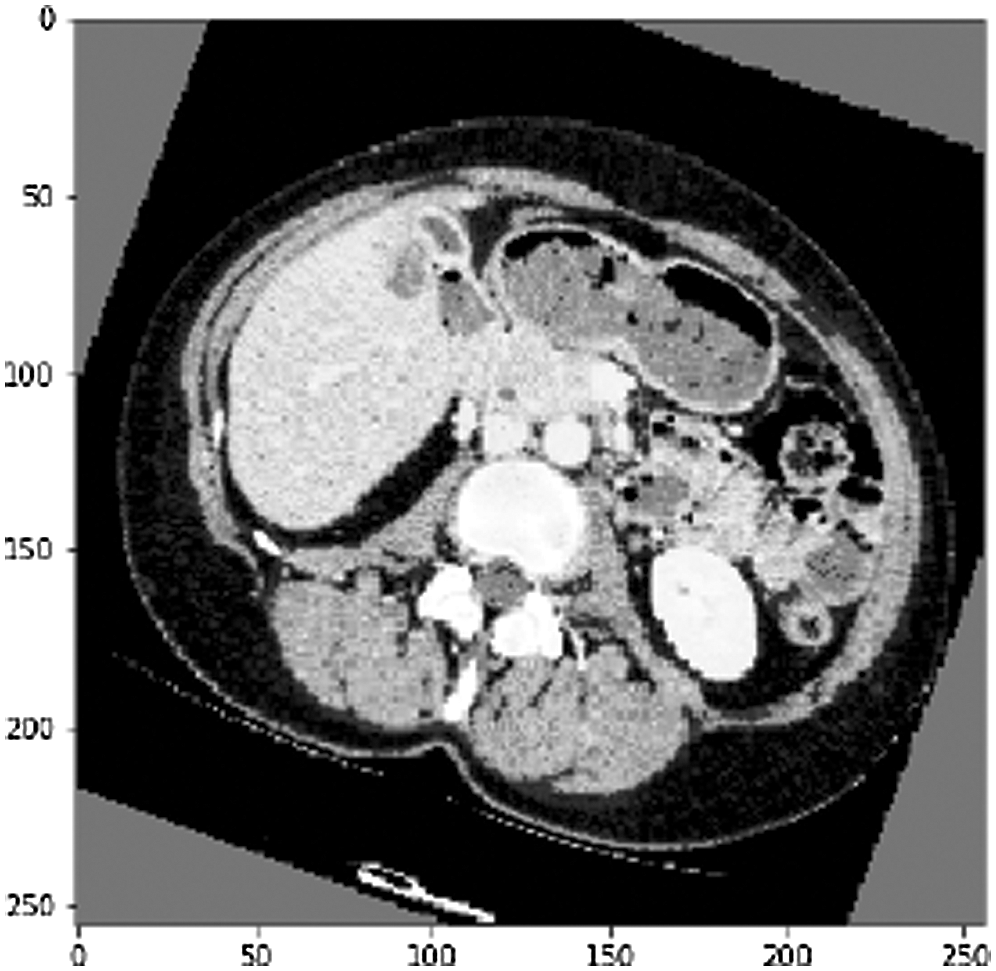
Figure 10: Another arbitrary example of a CT slice before liver division, as can observed the CT cut is increased by pivot alongside its cover
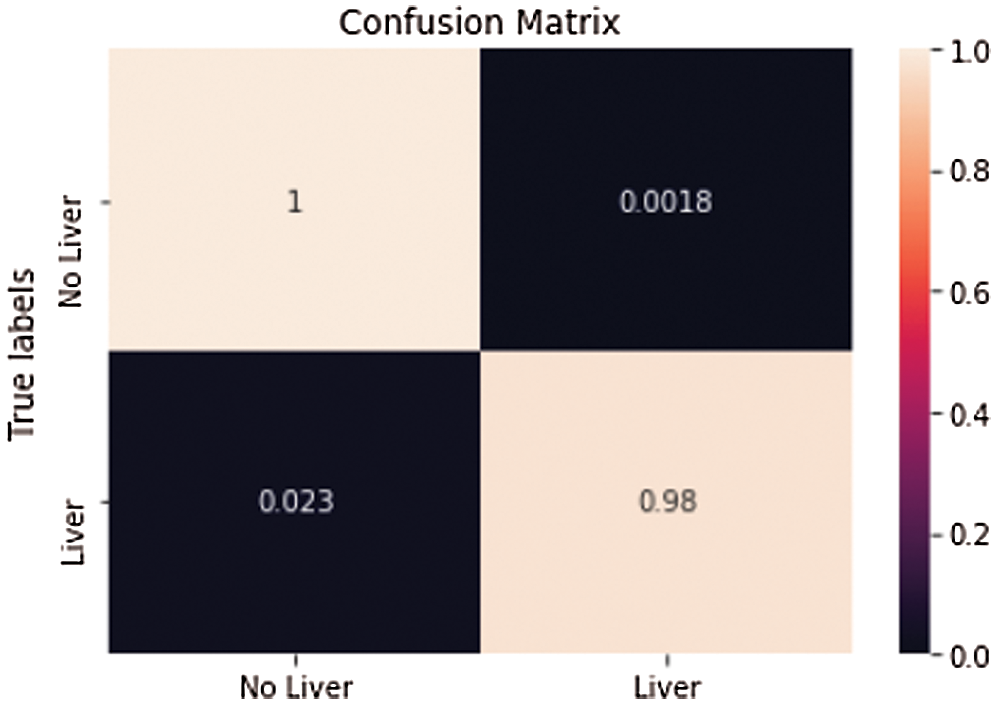
Figure 11: Predicted value of the second slice in confusion matrix after liver segmentation
The researchers achieved an Accuracy of 99.7% and a Dice Coefficient or (F1 Score) [21] of 99.2% in Liver tumors from the Liver. The experimental progress of training data is showing in Fig. 12. The differentiation between the valid data, loss of information, Dice Coefficient (F1 Score) and validation Dice Coefficient (F1 Score). The x-axis shows the epochs were applied on the data for finding the results of our techniques. Somehow after the 5 epochs Validation loss high and the Validation Dice coef is decreases due to the overfitting of the data.
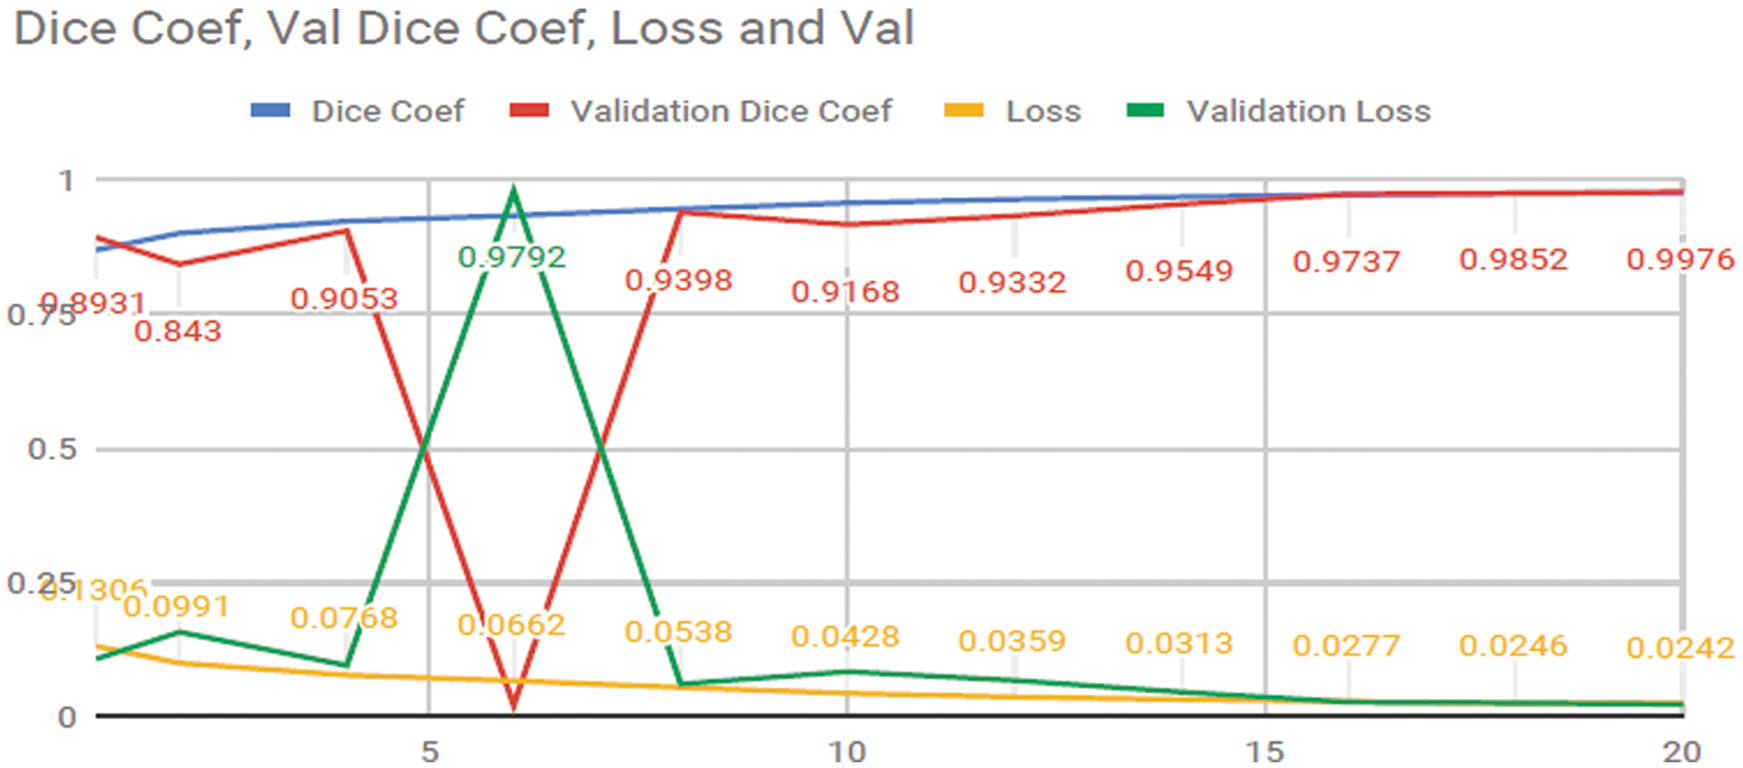
Figure 12: Progress of training the ResUNet model for liver segmentation on our dataset for 20 epochs
We took a random sample for liver tumor from the validation data and evaluated it on the ResUNet model.
This sample (see Fig. 12). achieved an accuracy 97.8% and Dice Coefficient (F1 Score) of 95.2%. A tumor infected image is given in Fig. 13. After applying tumor segmentation the resulted predicted tumor is shown in Fig. 14.

Figure 13: Before tumor segmentation, liver mask applied upon it
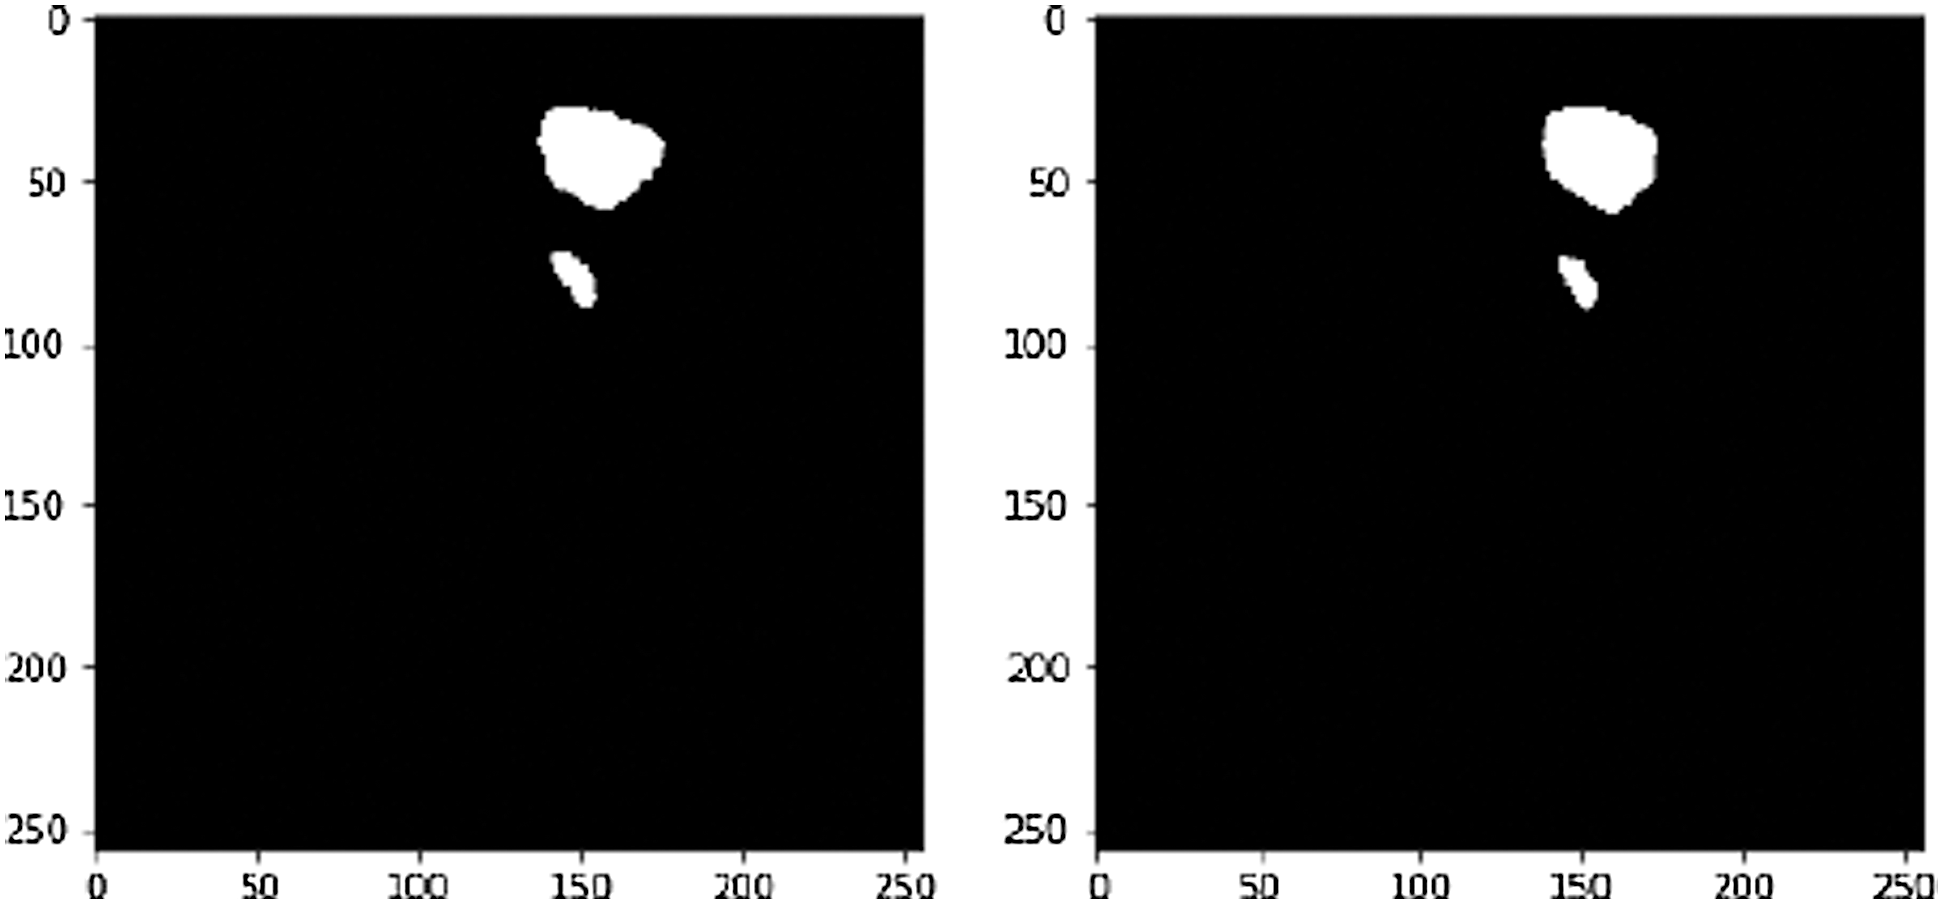
Figure 14: White is pixels shown liver tumor and black is pixels have no tumor, on the left True label and on the right predicted
In this work, they utilized the ResUNet model for pixel-wise programmed liver and liver tumors division utilizing CT scans images. After Tumor segmentation first slice of confusion matrix from the predicted value (see Fig. 15). CNNs helped them to accomplish their objectives and proved to be the best method that can be utilized in the division of liver tumors and ought to be attempted with unexpected tumors in comparison to liver tumors; along with it, the ResUNet indicated promising outcomes and compared with existing work as listed in Tab. 2.

Figure 15: After Tumor segmentation first slice of confusion matrix from the predicted value
Table 2: Comparison with existing study

This study used RestUNet model for liver tumor identification by utilizing the pixel-wise information of CT scans. The results showed that CNNs provided help in achieving accuracy and are the best method for diagnosing liver tumors through segmentation. This technique will be helpful for the diagnose of different types of tumors. RestUNet provided great results in diagnosing with efficiency and the least consumption of time. As we can see from the outcomes in Section 5, CNNs helped us accomplish our objectives and are perhaps the best method that can be utilized in the division of liver tumors and ought to be attempted with unexpected tumors in comparison to liver tumors, likewise the ResUNet demonstrated promising outcomes.
By using more datasets and different pre-processing techniques, the efficiency of ResUNet model can be improved. For the future, it can provide help to diagnose the small-scale liver tumor with 99.9% accuracy. The value of Validation of Dice Coefficient (F1 Score) also improved that is indicating that the experiment was done successfully and the model is ready to use for the detection of liver tumor.
In spite of the fact that the ResUNet demonstrated extremely encouraging outcomes there are a few restrictions as referenced in the limitation of ResUNET. We might have the option to defeat such restrictions via preparing for more epochs, utilizing more information, utilizing distinctive datasets or utilizing diverse preprocessing strategies.
Funding Statement: The authors extend their appreciation to the Deanship of Scientific Research at King Saud University for funding this work through research group No RG-1438-089.
Conflicts of Interest: The authors declare that they have no conflicts of interest to report regarding the present study.
1. M. P. Arakeri. (2011). “Recent advances and future potential of computer aided diagnosis of liver cancer on computed tomography images,” in Proc. of Int. Conf. on Information Processing, Bangalore, India, pp. 246–251. [Google Scholar]
2. K. C. Kaluva, M. Khened, A. Kori and G. Krishnamurthi. (2018). “2D-densely connected convolution neural networks for automatic liver and tumor segmentation,” Computer Vision and Pattern Recognition, Cornell University. arXiv preprint arXiv:1802.02182. [Google Scholar]
3. F. Bray, J. Ferlay, I. Soerjomataram, R. L. Siegel, L. A. Torre et al. (2018). , “Global cancer statistics 2018: GLOBOCAN estimates of incidence and mortality worldwide for 36 cancers in 185 countries,” CA: A Cancer Journal for Clinicians, vol. 68, no. 6, pp. 394–424. [Google Scholar]
4. K. Yasaka, H. Akai, O. Abe and S. Kiryu. (2018). “Deep learning with convolutional neural network for differentiation of liver masses at dynamic contrast-enhanced CT: A preliminary study,” Radiology, vol. 286, no. 3, pp. 887–896. [Google Scholar]
5. A. Gotra, I. Sivakumaran, G. Chartrand, K. N. Vu, F. Vandenbroucke-Menu et al. (2017). , “Liver segmentation: Indications, techniques and future directions,” Insights into Imaging, vol. 8, no. 4, pp. 377–392. [Google Scholar]
6. Y. Todoroki, X. H. Han, Y. Iwamoto, L. Lin, H. Hu et al. (2017). , “Detection of liver tumor candidates from CT images using deep convoluteonal neural networks,” in Proc. of Int. Conf. on Innovation in Medicine and Healthcare, Puerto de la Cruz, Spain, pp. 140–145. [Google Scholar]
7. M. H.Forouzanfar, A. Afshin, L. T. Alexander, H. R. Anderson, Z. A. Bhutta et al. (2016). , “Global, regional, and national comparative risk assessment of 79 behavioural, environmental and occupational, and metabolic risks or clusters of risks, 1990–2015: A systematic analysis for the global burden of disease study 2015,” Lancet, vol. 388, no. 10053, pp. 1659–1724. [Google Scholar]
8. M. Bellver, K. K. Maninis, J. Pont-Tuset, X. Giró-i-Nieto, J. Torres et al. (2017). , “Detection-aided liver lesion segmentation using deep learning,” Computer Vision and Pattern Recognition, Cornell University. arXiv preprint arXiv: 1711.11069. [Google Scholar]
9. F. X. Bosch, J. Ribes, M. Díaz and R. Cléries. (2004). “Primary liver cancer worldwide incidence and trends,” Gastroenterology, vol. 127, no. 5, pp. S5–S16. [Google Scholar]
10. K. K. Brock. (2011). “Imaging and image-guided radiation therapy in liver cancer,” in Seminars in Radiation Oncology. vol. 21, WB Saunders, pp. 247–255. [Google Scholar]
11. S. R. Abdel-Misih and M. Bloomston. (2010). “Liver anatomy,” Surgical Clinics, vol. 90, no. 4, pp. 643–653. [Google Scholar]
12. M. Ahmad, I. Albatish, M. J. Mosa and S. S. Abu-Naser. (2017). “Knowledge based system for long-term abdominal pain (stomach pain) diagnosis and treatment,” International Journal of Engineering and Information Systems, vol. 1, no. 4, pp. 71–88. [Google Scholar]
13. M. A. Frid, I. Diamant, E. Klang, M. Amitai, J. Goldberger et al. (2018). , “GAN-based synthetic medical image augmentation for increased CNN performance in liver lesion classification,” Neurocomputing, vol. 321, pp. 321–331. [Google Scholar]
14. T. Christian and E. Olsvik. (2018). “Biometric Fish Classification of Nordic Species Using Convolutional Neural Network with Squeeze-and-Excitation,” Master’s thesis, University of Agder, Universitetet i Agder. [Google Scholar]
15. X. Han. (2017). “Automatic liver lesion segmentation using a deep convolutional neural network method,” Computer Vision and Pattern Recognition, Cornell University. arXiv preprint arXiv:1704.072392017. [Google Scholar]
16. Y. LeCun, Y. Bengio and G. Hinton. (2015). “Deep learning,” Nature, vol. 521, no. 7553, pp. 436–444. [Google Scholar]
17. W. Li, F. Jia and Q. Hu. (2015). “Automatic segmentation of liver tumor in CT images with deep convolutional neural networks,” Journal of Computer and Communications, vol. 3, no. 11, pp. 146–150. [Google Scholar]
18. F. Pan, Q. Huang and X. Li. (2019). “Classification of liver tumors with CEUS based on 3D-CNN,” in Proc. 2019 IEEE 4th Int. Conf. on Advanced Robotics and Mechatronics, Toyonaka, Japan: IEEE, pp. 845–849. [Google Scholar]
19. B. Míriam, K. K. Maninis, J. P. Tuset, X. Giró-i-Nieto, J. Torres et al. (2017). , “Detection-aided liver lesion segmentation using deep learning,” Computer Vision and Pattern Recognition, Cornell University. arXiv preprint arXiv:1711.11069. [Google Scholar]
20. G. Chlebus, A. Schenk, J. H. Moltz, B. van Ginneken, H. K. Hahn et al. (2018). , “Automatic liver tumor segmentation in CT with fully convolutional neural networks and object-based postprocessing,” Scientific Reports, vol. 8, no. 1, pp. 1–7. [Google Scholar]
21. J. Son, S. J. Sang, J. Park and K. H. Jung. (2017). “Retinal vessel segmentation in fundoscopic images with generative adversarial networks,” Computer Vision and Pattern Recognition, Cornell University. arXiv preprint arXiv:1706.09318. [Google Scholar]
22. S. Almotairi, G. Kareem, M. Aouf, B. Almutairi and M. A. M. Salem. (2020). “Liver tumor segmentation in CT scans using modified signet,” Sensors, vol. 20, no. 5, pp. 1516. [Google Scholar]
Appendix A.
For increasing the readability of reader the abbreviations use din in this pare are listed in table below:
Table 3: Keywords and their definitions

 | This work is licensed under a Creative Commons Attribution 4.0 International License, which permits unrestricted use, distribution, and reproduction in any medium, provided the original work is properly cited. |