DOI:10.32604/cmc.2021.013589
| Computers, Materials & Continua DOI:10.32604/cmc.2021.013589 | |
| Article |
Electroencephalogram (EEG) Brain Signals to Detect Alcoholism Based on Deep Learning
Visual Computing Lab, Department of Computer Science, College of Computer and Information Sciences, King Saud University, Riyadh, 11543, Saudi Arabia
*Corresponding Authors: Muhammad Hussain. Email: mhussain@ksu.edu.sa
Received: 30 July 2020; Accepted: 13 September 2020
Abstract: The detection of alcoholism is of great importance due to its effects on individuals and society. Automatic alcoholism detection system (AADS) based on electroencephalogram (EEG) signals is effective, but the design of a robust AADS is a challenging problem. AADS’ current designs are based on conventional, hand-engineered methods and restricted performance. Driven by the excellent deep learning (DL) success in many recognition tasks, we implement an AAD system based on EEG signals using DL. A DL model requires huge number of learnable parameters and also needs a large dataset of EEG signals for training which is not easy to obtain for the AAD problem. In order to solve this problem, we propose a multi-channel Pyramidal neural convolutional (MP-CNN) network that requires a less number of learnable parameters. Using the deep CNN model, we build an AAD system to detect from EEG signal segments whether the subject is alcoholic or normal. We validate the robustness and effectiveness of proposed AADS using KDD, a benchmark dataset for alcoholism detection problem. In order to find the brain region that contributes significant role in AAD, we investigated the effects of selected 19 EEG channels (SC-19), those from the whole brain (ALL-61), and 05 brain regions, i.e., TEMP, OCCIP, CENT, FRONT, and PERI. The results show that SC-19 contributes significant role in AAD with the accuracy of 100%. The comparison reveals that the state-of-the-art systems are outperformed by the AADS. The proposed AADS will be useful in medical diagnosis research and health care systems.
Keywords: Electroencephalogram; convolutional neural network; deep learning; alcoholism
Alcoholism is a common neurological disorder caused by the mutual effect of environmental and genetic factors. It damages brain activity and leads to cognitive and mobility impairments [1]. Cancer, stroke, cardiomyopathy and high blood pressure are the most common harmful effects of alcohol on health [2]. The World Health Organization (WHO) [3] reported that alcohol abuse is the third highest risk factor for causing diseases. In the WHO study survey, approximately 2 billion people worldwide consume alcoholic drinks, of which 76.3 million have alcohol dependence syndrome. About 58.3 million people (i.e., 4.8% of the total) have an adjusted handicap and 1.8 million deaths (i.e., 3.2% of total deaths) have been caused by alcoholism [4].
Alcoholism affects a person’s brain functions badly. Due to the chaotic existence of the human brain, the cause-effect study of alcoholism on the human brain is challenging [5]. To distinguish alcoholics from normal subjects in a reliable way is helpful for reducing social problems and provides a quick and easy way for doctors in clinical settings. It is highly important to formulate an effective and reliable method to distinguish between alcoholic and non-alcoholic considering the nature of the alcoholic syndrome.
Brain neuronal activity could be recorded using PET, MRI, FMRI (Functional Magnetic Resonance Image) and EEG (Electro–encephalogram) techniques. EEG is more suited for the analysis of neuro-psychological signals because of intrinsic features such as the acquisition of real-time signal, the non-invasive and the excellent correlation of the complex dynamics of brain activities [6]. EEG is appropriate to distinguish between alcoholics and normal subjects. In recent research, EEG brain signals have been employed for classifying alcoholics vs. normal subjects. Most of the research work extracted hand-engineered features from EEG signals utilizing machine learning (ML) approaches [7–10] that are usually not robust and less discriminative. Different methods have been reported such as orthogonal wavelet filter bank, analytic wavelet transform, EEG rhythm feature, horizontal visibility graph entropy, spectral entropy, automatic computer-aided tool, functional connectivity and EMD [7–10]. The features extraction using hand-engineered techniques require manual parameter tuning which is a laborious process; their performance is based on the hyper-parameters selection and also the internal structure of the data is not learned by these methods. As such in various situations they do not generalize well and require laborious designs i.e., first features are extracted and then selected. In next phase, the selected features are given to a classifier, and all these steps include manual tuning of hyper-parameters which is time consuming and laborious process. Though the maximum reported accuracy is 99.6% on KDD database, a benchmark dataset for alcoholism detection [11], it has not been obtained using the whole database and the generalization on the whole database is not clear.
In order to build a stable, more efficient automatic alcohol detection system (AADS) using EEG brain signals, we have been motivated by the performance of deep learning (DL) in many recognition tasks. Convolutional neural network (CNN) is the most powerful and deep architecture [12,13]. Therefore, we proposed the AADS based on a multi-channel pyramidal CNN model (MP-CNN). As a CNN model includes many learnable parameters, its training requires a large dataset of EEG signals, which for AAD problems are difficult to obtain. To solve this issue, we are proposing a multi-channel MP-CNN, which contains a limited number of learnable parameters and does not suffer from the overfitting problem. There are a number of channels in an EEG signal, which form as an input to predict alcoholic vs. normal subjects.
Using the KDD dataset, a benchmark dataset for alcoholism detection problem, we validated the robustness and effectiveness of proposed AADS. In this study, our focus is on classification of alcoholic vs. normal subjects. We also investigated the effects of selected 19 EEG channels (SC-19), those from the whole brain (ALL-61), and five (05) brain regions, i.e., TEMP, OCCIP, FRONT, PERI, CENT to determine the brain region that plays important role in AAD. We also used five different deep MP-CNN models with different number of layers. The results indicate that SC-19 with model M5 plays dominant role in AAD with the accuracy of 100% that outperforms the other state-of-the-art methods. In this study, our main contributions are: (1) A multi-channel pyramidal CNN model (MP-CNN) for the AADS, (2) A robust and efficient AADS based on MP-CNN for the detection of alcoholics, (3) The investigation of different brain regions to determine the channels that has significant role in AAD, (4) Analysis of dominant frequency bands and brain regions that are involved in AAD, (5) A detailed evaluation of the proposed AADS on the KDD dataset that shows it can be used effectively for alcoholism detection.
The remaining paper is structured as follows: Section 2 presents the literature review. Section 3 describes the AAD system framework based on DL. Section 4 presents the experimental protocol and evaluation criteria. Section 5 presents the results and discussion and Section 6 concludes the paper.
In recent years, several EEG based automated systems for the detection of alcoholism have been developed using various techniques depend on hand-crafted approaches. It is a classification problem that requires feature extraction from EEG brain signals and then classification. We review the state-of-the-art methods in the following paragraphs.
Acharya et al. [14] proposed a method using non-linear features to classify the alcoholic and healthy subjects. The authors used the higher-order spectra (HOS), sample entropy (SampEn), approximate entropy (ApEn) and largest lyapunov exponent (LLE) as discriminative features and SVM as a classifier with Radial Basis Function (RBF), and 1st, 2nd, and 3rd order polynomials kernels. They achieved the accuracy of 91.7%. Patidar et al. [15] developed a technique to detect alcoholism using EEG signals. The authors used the tunable-Q Wavelet Transform (TQWT) to extract the centered correntropy (CC) features from EEG signals. They used the PCA to reduce the pairwise correlation. The authors used the LS-SVM as a classifier with 10-fold cross validation and the three kernels, i.e., RBF, mexican hat and morlet. They obtained the accuracy of 97.02%. Taran et al. [16] used the empirical mode decomposition (EMD) to extract the discriminative features from EEG Signals to classify alcoholic and normal subjects. They extracted five features from EEG signals, i.e., negentropy, entropy, coefficient of variation (COV), interquartile range (IQR) and mean absolute deviation (MAD). In this study, authors used the two classifiers, i.e., LS-SVM and extreme learning machine (ELM). They obtained the accuracy of 97.92%. Zhu et al. [9] extracted the horizontal visibility graph entropy features and used non-linear classifier SVM. The study reported the accuracy of 94.3%. Padma Shri et al. [10] extracted the entropy features for the classification of alcoholic vs. control subjects. The author performed the classification of EEG signals using KNN classifier and achieved the accuracy of 95.5%. Ong et al. [17] extracted the PSF features from EEG brain signals and used MLP NN as a classifier. The authors achieved the accuracy of 95.45%. Palaniappan et al. [18] obtained the accuracy of 90.10% by using gamma band power as a feature. The authors used the MLP as a classifier to classify alcoholic vs. control subjects. Bavkar et al. [2] extracted the absolute gamma band power from EEG signals as features and employed ensemble subspace KNN as a classifier. They obtained the accuracy of 95.10%. Shri et al. [19] extracted the approximate entropy features from EEG brain signals, and used BPNN and SVM as classifiers. They achieved the accuracy of 90%. Taran et al. [20] extracted various features from EEG signals such as mean absolute difference, inter quartile range, covariance and entropy and used ELM and LS SVM as classifiers. The authors obtained the accuracy of 93.75%. Anuragi et al. [7] extracted the centered correntropy features from EEG brain signals and used LS-SVM as a classifier to classify alcoholic vs. control subjects. They achieved the accuracy of 97.06%. Rodrigues et al. [21] used the wavelet transform to extract the features such as absolute mean, ratio of absolute mean, power value, standard deviation, mean, maximum and minimum. The authors achieved the accuracy of 99.06% with Naive Bayes classifier.
While some of the research studies analyzed in above literature review were shown high performance; but the results have not been obtained using the whole database and the generalization on the whole database is not clear. In addition, most of the research studies utilized hand-crafted techniques for features extraction. These techniques do not extract the discriminative information properly from EEG signals and their performance is based on the parameters tuning. The generalization of these techniques is also low because features extracted using the hand-crafted methods are not learned from the data and unable to encode their structural patterns. Therefore, DL can be used to increase the accuracy and generalization of an AAD system due to its excellent performance over hand-crafted methods.
3 AAD System Based on Deep Learning
In this study, inspired by the outstanding success of deep learning (DL) in many recognition tasks, we used DL to create a more effective and robust EEG based AAD system. DL is the cutting-edge technique of machine learning that learns the hierarchy of features automatically and classifies them in an end-to-end way [22]. The features derived by DL models are more robust and discriminatory than hand-engineered features [23], which are suited to the inherent structural patterns of data. A convolutional neural network (CNN) is the most powerful architecture of DL. In several fields such as text understanding, epilepsy detection, music generation and other time series data [12,13,24,25], there has been outstanding performance of numerous 3D and 2D variants of CNN models such as C3D, 3DCNN, VGG and AlexNet [26]. The DL being an end-to-end learning approach needs not the design of feature descriptors, the selection of most discriminative features and the adaptation of a suitable classifier [27]. The design of the proposed AADS is shown in Fig. 1; it is based on a multi-channel pyramidal CNN model (MP-CNN), its prototype architecture is shown in Fig. 2.
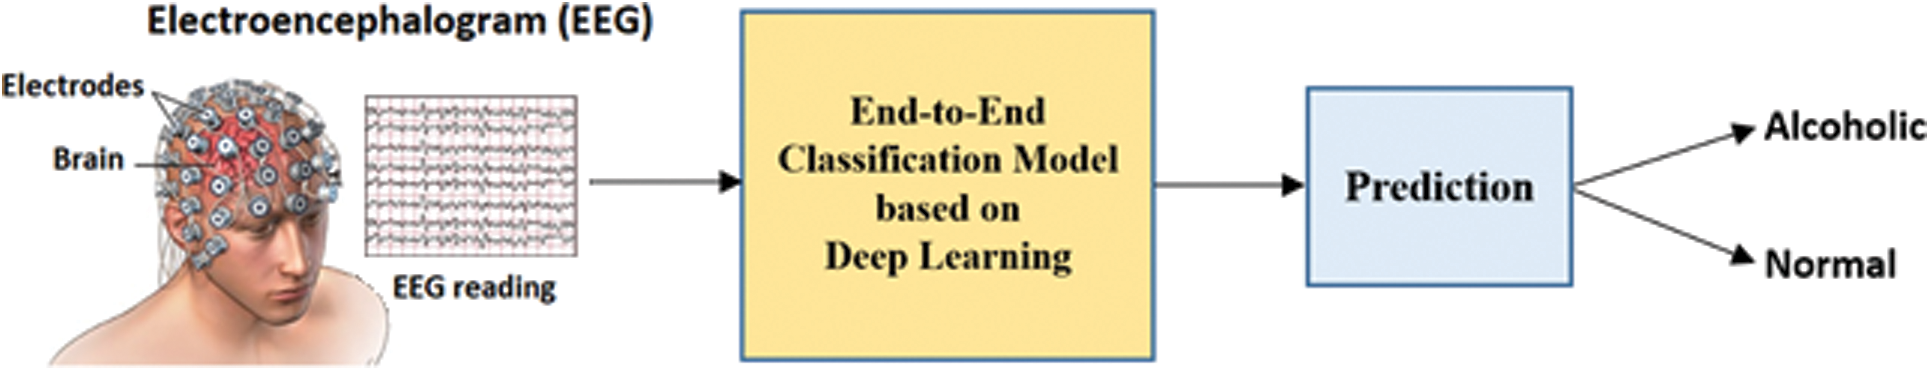
Figure 1: The proposed automatic alcoholism detection system (AADS)
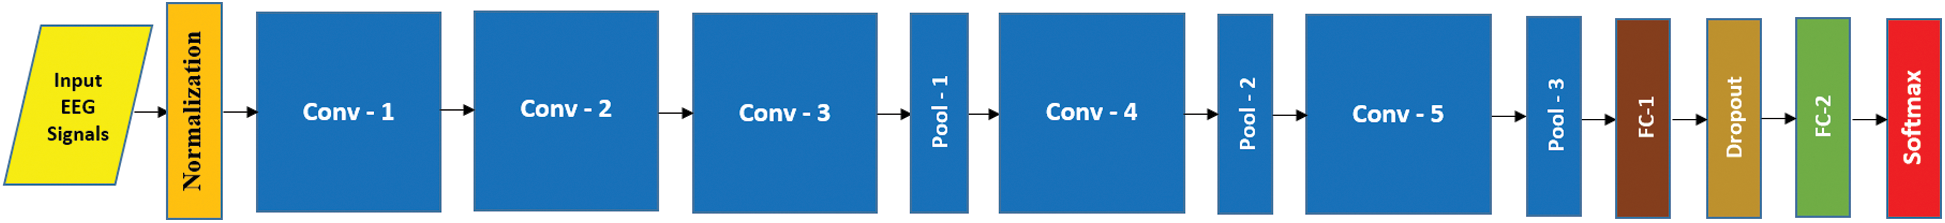
Figure 2: Proposed architecture AAD system with 05 CNN blocks
In this study, an EEG signal is represented by  captured with E electrodes over a time interval with T timestamps
  as a
as a  matrix,
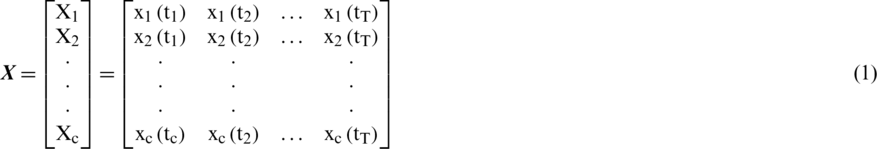
where  is the
  channel of
  captured from the
  electrode.
We designed the system to take the decision about the EEG signal  whether it belongs to alcoholic or normal subject. It takes the input signal
  consisting of E channels Xi inside a window of fixed temporal length Tw. It performs the classification of
  with an MP-CNN model Mi, i.e.,
  where O
  is the predicted class label of
  .
.
3.1 Multi-Channel Pyramidal CNN Model (MP-CNN)
We designed a multi-channel CNN model based on pyramid architecture [13] for developing the AAD system. Fig. 2 shows the prototype MP-CNN model with five CONV blocks. The structure of the model is based on an input layer, convolutional (CONV) blocks and fully connected (FC) layers. A multi-channel EEG signal segment is taken as an input by the input layer and passed through a number of CONV blocks that extract the discriminative features from the input EEG signal. Those extracted features are further passed into a first FC layer, under which the discriminative information is collected and then the final FC layer with the softmax layer predicts the input signal’s class label. The z-score normalization is utilized to normalize the input EEG brain signals to zero mean and unit variance. In this study, we designed five MP-CNN models based on different number of CONV blocks, as shown in Tab. 1.
Table 1: Specifications of five multi-channel pyramidal CNN models (MP-CNN) with Conv ( , /str, nic, noc) [
 means receptive field, str is stride, nic and noc means number of input and output channels (feature maps), respectively]

In different models, the normalized input is processed by different number of CONV blocks (i.e., 9, 7, 5, 4, 3). Each CONV block comprises of 3 layers: Conv layer, batch normalization layer (bN) and non-linear activation layer (elu). We achieved the best results with M5. In case of M5, there are 16 kernels in Conv-1 and each kernel size is  ; there are 12 kernels in Conv-2, the depth and size of each kernel is 16 and
  , respectively; there are 8 kernels in Conv-3, the depth and size of each kernel is 12 and
  , respectively. The redundant features are reduced by MaxPooling layers with strides of 2, 2 and 4 after CONV blocks, i.e., Conv-1, Conv-2 and Conv-3, respectively. The output of the Conv-3 is given to the
  that is followed by a
  layer. Then it is passed to another
  . We used different number of neurons in
  . We observed that the model M5 achieves the excellent results with 20 neurons in the
  layer. The box plot of 20 features for two-class problem (alcoholic vs. normal) using M5 is shown in Fig. 3.
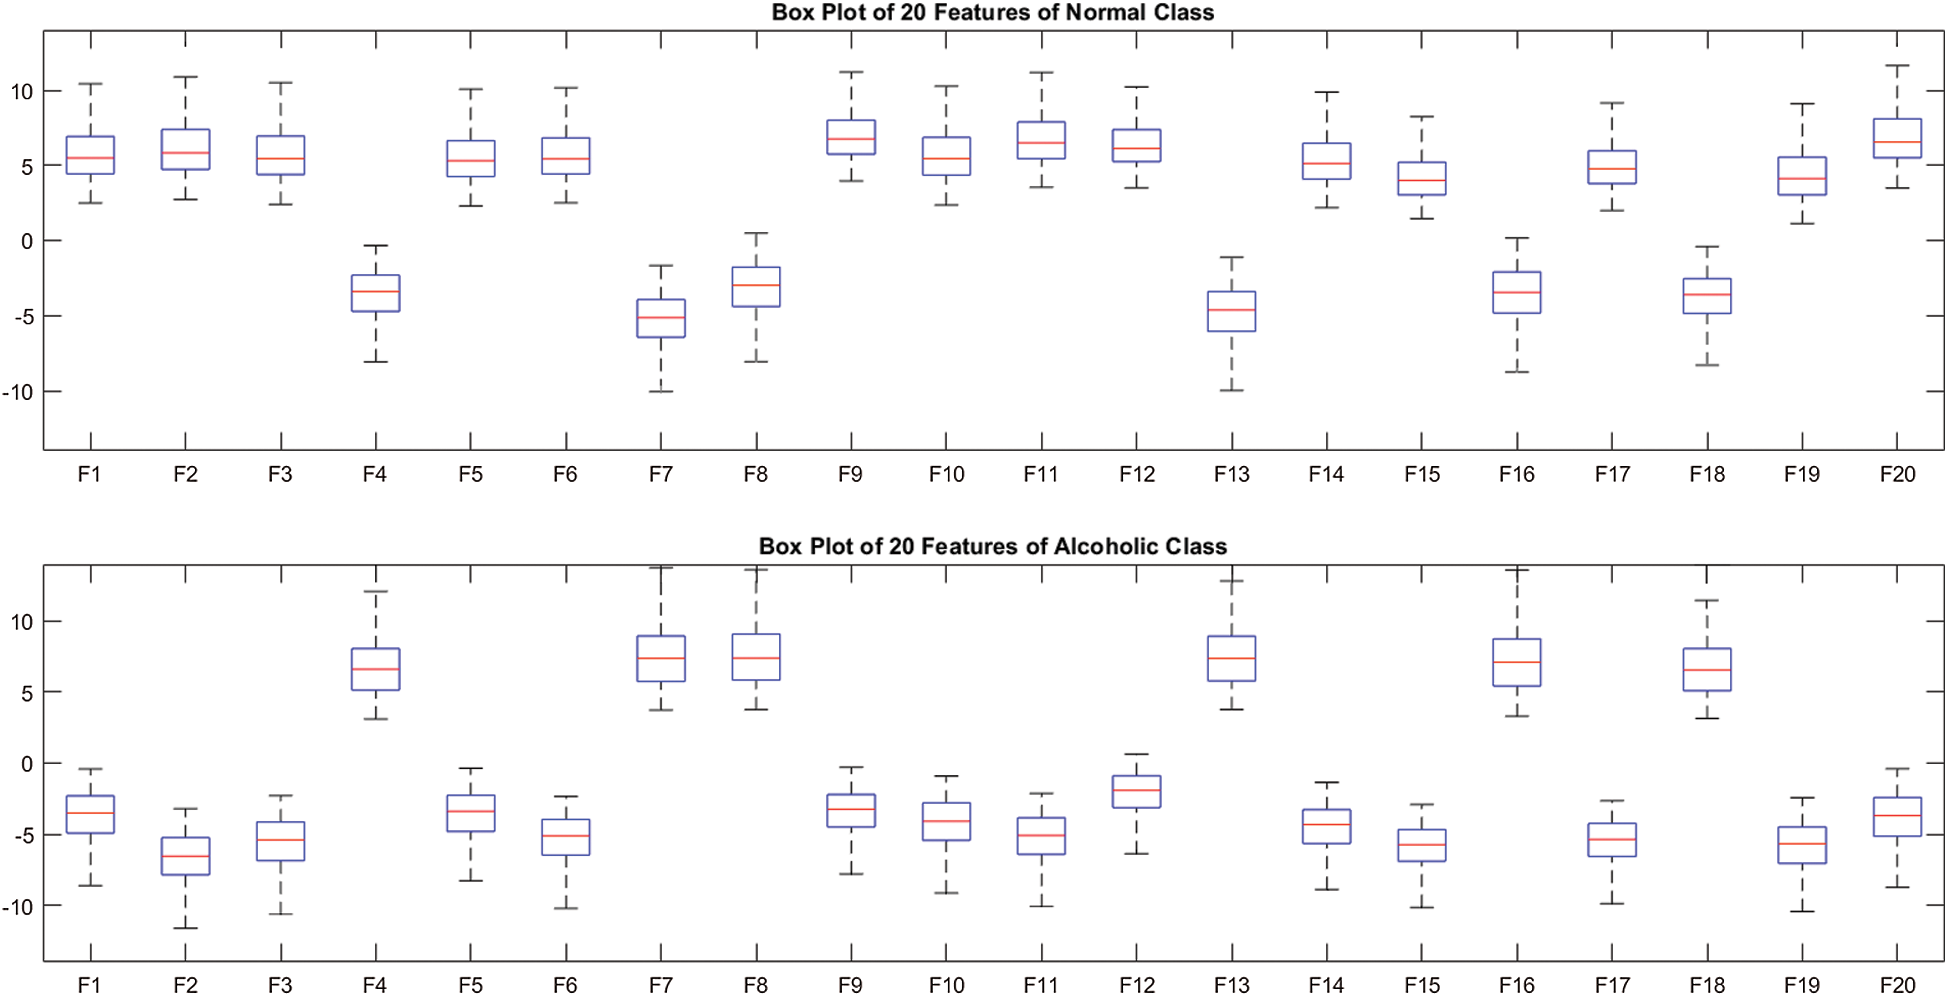
Figure 3: Box plot of 20 features over SC-19 with M5
The Fig. 3 also validates the clear discrimination between the features of two classes. Therefore, we used 20 neurons in  in all experiments. In order to prevent the overfitting, we used the Dropout after
  . Then, the softmax layer is used a classifier in which the output of
  is passed as an input and it predicts the input signal’s class label. The
  layer has two (02) neurons as the total number of classes in AADS is two (02). Tab. 1 shows the detail specifications of the MP-CNN model.
The MP-CNN model automatically learns the inherent structural patterns of EEG brain signals from the data and performs end-to-end classification. The method proposed is opposed to the conventional hand-engineered method in which firstly features are extracted, then discriminative features are selected and finally given to a classifier for classification purpose. In DL, the Conv layer is the core component of the CNN model. The detail related to Conv layers, elu, FC layers and batch normalization can be found in [13]. A signal is evaluated by the CNN model to learn a hierarchy of discriminatory information and then predicts its class. In hand-engineered techniques, the kernels are pre-defined such as wavelet transform, whereas in CNN, the kernels are learned from the data. Also CNN has less number of learnable parameters due to the concept of shared kernels.
Normally, a CNN model has small number of kernels in low-level layers and large number of kernels in high-level layers. However, the complexity is high in this type of structure due to huge number of learnable parameters. The size of weight matrix W of  depends on the number of neurons in the layer before
  layer; if the neurons in the Conv-3 block is large, then the size of W is big i.e., it will cause a drastic increase in the number of learnable weights and it will lead to the problem of overfitting. Instead, we used a pyramid architecture, where number of kernels are large in low-level layers and small in higher-level layers. This architecture helps to prevent the overfitting by significantly decreasing the number of learnable parameters. A large number of kernels are taken in a Conv1 layer, which are reduced by a constant number in the following Conv layers, e.g., model M1 to M5, shown in Tab. 1. In case of model M5; Conv1, Conv2 and Conv3 layers have 16, 12 and 8 kernels, respectively. The idea is that low-level layers extract a large number of microstructures that are composed by higher level layers into higher level features which are less in number but discriminative, i.e., it implicitly does the feature reduction and selection, which is an important part of most of the methods based on hand-engineered features. In this study, five models are developed using pyramid architecture to show that which one is more effective for the alcoholic detection problem. The specifications and number of learnable parameters of these models are shown in Tab. 1. Based on these models, we demonstrate how a correctly built model can produce higher efficiency and good performance, while the overfitting risk is small and the number of learnable parameters are also less. Tab. 1 also shows that the models using the pyramid design contains small number of learnable parameters.
The EEG dataset used for this study is Irvine Information Discovery (UCI-KDD) [11] from the University of California. This dataset was recorded with 64 electrodes and the EEG signals were recorded while showing the single stimuli to the subjects during the experiments. 120 trials with one second epoch were conducted for each subject. The sampling rate for EEG Signals was set at 256 Hz. The images for stimuli were used from the 1980 Snodgrass and Vander wart set. The artifacts and noise such as eye blinks and power line noise were removed from the EEG signals in baseline. The further details about EEG signals recording and experiments can be seen at [9]. A total of 122 subjects were involved in recording of EEG signals. The alcoholic and normal groups consists of 77 and 45 subjects, respectively. The age range for the subjects of alcoholic group was from 20 to 50 years and mean age was equal to 35.83 years, whereas, age range for the subjects of normal group was from 20 to 39 years and mean age was to 25.81 years. Sample EEG signals related to alcoholic and control subjects are shown in Fig. 4.

Figure 4: Sample EEG signals, captured from channel Fp1, related to (a) control subject and (b) alcoholic subject
3.3 Experimental Data Preparation
In this study, the problem is to predict the state of an EEG signal  whether it belongs to alcoholic or normal subject. The length of each signal is 1 s and sampling rate is 256 Hz. Using a window size Tw of one second, each signal
  of length 256 samples is treated one instance (pattern). In the KDD dataset, the number of trials performed by each subject is 120 and total number of subjects is 122 (
 ,
,  ), the total number of instances of EEG signals is 14640 (
 ). The instances are divided into two parts; 90% (i.e., 13176 EEG signals) of the instances are used for training process and 10% of the instances (i.e., 1464 EEG signals) are used for testing process.
The training data is used to train all the model Mi as detail is provided in Section 3.3. In the proposed system, the cross entropy loss function is used for training the models Mi, and back-propagation and stochastic gradient descent with Adam (SGDA) optimizer [28] are used for calculating the gradient. The learnable parameters,  are updated through SGDA utilizing the following equations:

where


and m, v, t and gt represents the 1st moment vector, 2nd moment vector, time-step, and gradient of the loss function, respectively. There are 4 hyper-parameters in this algorithm:  ,
,  , epsilon (
 ) and learning rate (
 ). In our experiments, we set
  ,
,  ,
,  and
and  . The parameters
  and
and  represent the exponential decay rates. It was noted that it helps the network to converge quickly and thereby increase the performance of the training phase. The dropout technique is used to the
  layer to prevent overfitting and increase the generalization power. A probability score of 0.5 is applied in dropout.
After training the model Mi, it is used to take the decision about the state of an unknown or test EEG signal  , the architecture of proposed model is shown in Fig. 2. The testing EEG signal
  is passed to the MP-CNN model Mi and it yields the predicted label, i.e.,
  where
where  is the predicted class label of the EEG Signal
  .
.
4 Experimental Protocol and Evaluation Criteria
We performed experiments (1) with different MP-CNN models to select the best model and (2) using EEG signals from the following brain regions, as shown in Fig. 5, to identify their role in alcoholism detection:
i) SC-19: Consists of 19 (out of 61) EEG channels from all brain regions. (In this case, we performed the experiment by selecting the channels one-by-one and finally choose those 19 EEG channels which performs with the best results overall.)
ii) FRONT: Frontal-left (FL) and frontal-right (FR) with 17 channels
iii) CENT: Central-left (CL) and central-right (CR) with 14 channels
iv) PERI: Parietal-left (PL)and parietal-right (PR) with 10 channels
v) OCCIP: Occipital-left (OL) and occipital-right (OR) with 8 channels
vi) TEMP: Temporal-left (TL)and temporal-right (TR) with 12 channels
vii) ALL-61: Use 61 EEG channels from all brain regions.

Figure 5: Brain regions used for the analysis [11]
A 10-fold cross-validation methodology was used to evaluate the proposed system. We divided the EEG signals of each class into ten folds. In each turn, nine folds (90% data) are used for training and one fold (10% data) is used for testing purpose. At the end, we computed the average of all ten folds. We used the following performance metrics in order to compute the system performance:


where TP stands for true positives that is the number of alcoholics recognized as alcoholics, FN stands for false negatives that is the number of alcoholics recognized as normal subjects, TN stands for true negatives that is the number of normal subjects recognized as normal subjects and FP stands for false positives that is the number of normal subjects recognized as alcoholics. In this study, we used Matlab (2018b) for the implementation of MP-CNN models. We trained the models on a server system with Intel (R) Xeon (R) CPU-E5-2670 v2 @2.5 GHz (20 CPUs) with 3 GB Nvidia Quadro K4000 Graphics Card and 32 GB RAM.
5 Experimental Results and Discussion
First, we discuss the obtained results with different MP-CNN models and then using the EEG signals from different brain regions.
To find the best model Mi, we considered five models Mi,  (see Tab. 1) and experiments are performed with SC-19, the detail of this set of channels is given in the next section. The average performance results are given in Tab. 2.
Table 2: Performance of five MP-CNN models over SC-19

From Tab. 5, it is noted that M5 gives the best mean accuracy in AADS out of 5 models, i.e., 100%; the mean sensitivity, specificity and F1-score are also 100%. Fig. 6 shows the mean testing and training accuracies of the all 5 models. From Tab. 2, the results show that: (i) Theperformance of M5 is better than all the other models in all cases as it uses less number of Conv blocks, (ii) Small difference between mean testing and training accuracies of all the models as there is no over-fitting problem, (iii) The deep pyramid structure of the CNN model enhances the performance of the system. We also performed the Wilcoxon significance test to show that the difference between M5 and other models (M1, M2, M3 and M4) is statistically significant with the alternate hypothesis that the median acc of M5 < median acc of Mi, where i = 1, 2, 3, 4. In all the four cases,  , this indicates the acceptance of the null hypothesis at the 5% significance level. On the basis of the results given in Fig. 6 and Tab. 2, it is noted that model M5 gives best results as compared to all other models with twenty neurons in the
  layer and three Conv blocks for AAD using EEG brain signals from the SC-19 region, i.e., 100%. Further the ROC curve for SC-19 with M5 is shown in Fig. 7. It can be noticed from the curve that AUC reaches a highest value of 1.0.

Figure 6: Accuracies with models M1 to M5 on SC-19
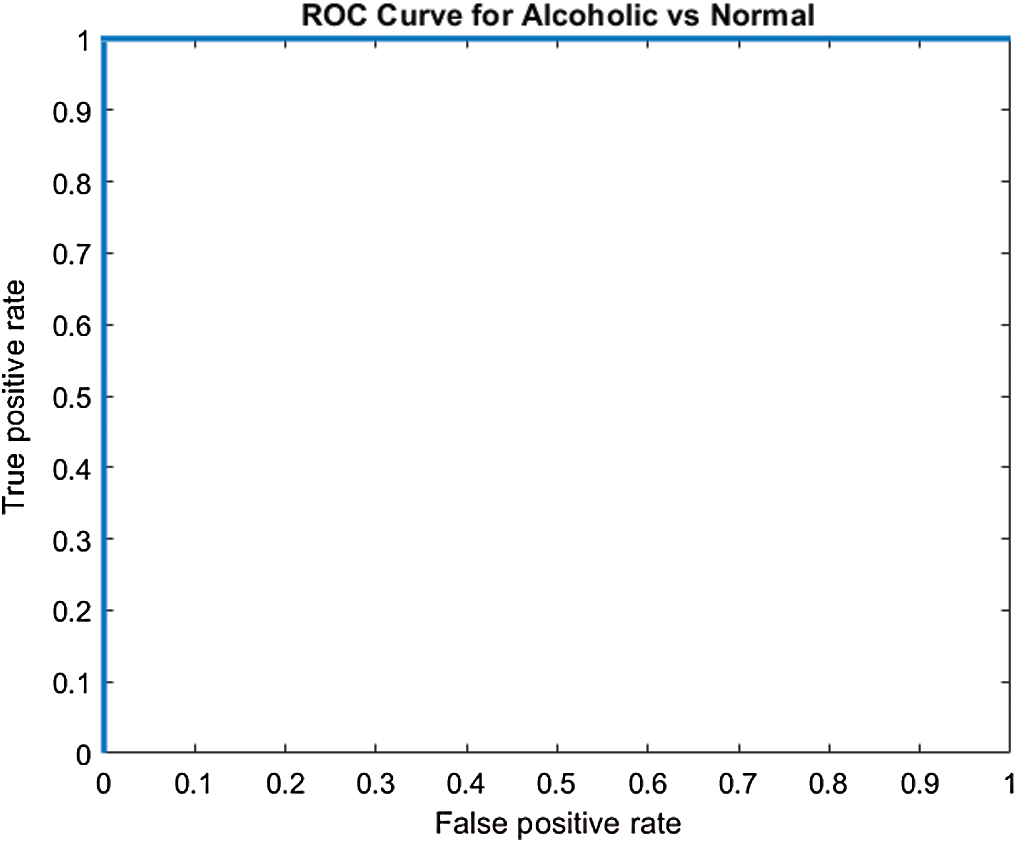
Figure 7: ROC curve over SC-19 using M5
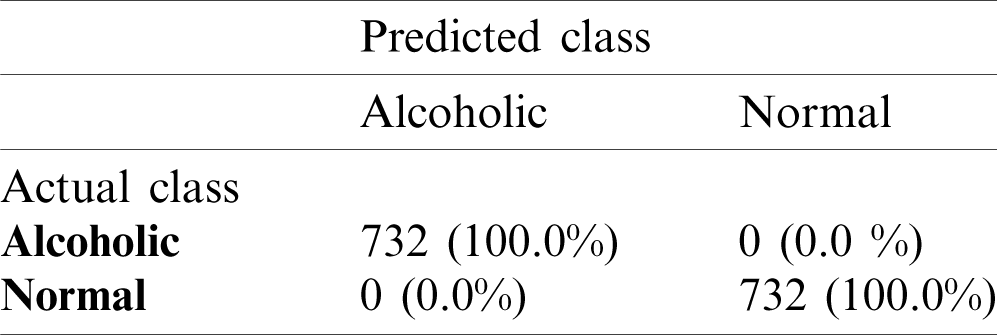
The model M5 has less complexity as it uses the small number of learnable parameters and it shows slightly higher or similar performance as compare to other models. The model M5 is used in all our further experiments due to its best performance. It is to be noted that M5 requires minimum memory space due to its pyramid design architecture that helps to use less number of learnable parameters, i.e., 14066. The model M5 has low complexity, better generalization and small memory overhead due to the involvement of less number of learnable parameters. It means that the proposed system for alcoholism detection has good generalization power and is more robust than other existing state-of-the-art methods due to its less dependency on data. The mean accuracy of AADS over SC-19 with model M5 is 100% that shows the strong generalization power of the proposed AADS. Tab. 3 shows the confusion matrix for alcoholic vs. normal subjects on the SC-19. The results of confusion matrix in Tab. 3 show that AAD system is perfectly classifying the test data w.r.t corresponding classes (alcoholic and normal).
Table 3: Confusion matrix on SC-19 with M5
In this study, seven experiments were performed on different regions of the brain, i.e., whole brain (ALL-61), SC-19, TEMP, OCCIP, CENT, FRONT, and PERI in order to examine which brain region is the most effective to detect alcoholism. The details of these experiments are as under:
5.2.1 Experiment-1: Selected 19 Channels (SC-19)
The selected 19 channels are: FP1, FP2, F8, AF7, AF8, F4, F3, FC6, FC5, FC2, T8, C3, C4, CP6, CP2, PZ, P7, PO2, PO1. Out of these 19 channels, 07 channels (FP1, FP2, F8, AF7, AF8, F4, F3) are from FRONT, 05 channels (FC6, FC5, FC2, C3, C4) are from CENT, 02 channels (CP2, PZ) are from PERI, 02 channels (PO2, PO1) are from OCCIP and 03 channels (T8, CP6, P7) are from TEMP. To select these channels, we performed signal-channel experiments with all 61 channels and choose the 19 channels which gave the best results. The results over this set with M5 is presented and discussed in the last section.
5.2.2 Experiment-2: FRONT Region
There are 17 channels Xi in EEG signal  captured from FRONT region as shown in Fig. 5. The accuracy achieved using model M5 is shown in Tab. 4. It is noted that AADS gives the mean accuracy, sensitivity, specificity and F1-score of 93.33%, 94.37%, 93.33% and 94.37%, respectively.
Table 4: Ten-fold cross validation results (%) on seven brain regions using model M5

5.2.3 Experiment-3: CENT Region
There are 14 channels Xi in EEG signal  captured from CENT region as shown in Fig. 5. The accuracy achieved using model M5 is shown in Tab. 4. It is noted that AADS gives the mean accuracy, sensitivity, specificity and F-score of 91.53%, 92.33%, 92.87% and 91.53%, respectively.
5.2.4 Experiment-4: PERI Region
There are 10 channels Xi in the EEG signal  captured from PERI region as shown in Fig. 5. The accuracy achieved using model M5 is shown in Tab. 4. It is noted that AADS gives the mean accuracy, sensitivity, specificity and F1-score of 90.40%, 92.33%, 91.53% and 90.40%, respectively.
5.2.5 Experiment-5: OCCIP Region
There are 8 channels Xi in the EEG signal  captured from OCCIP region as shown in Fig. 5. The accuracy achieved using model M5 is shown in Tab. 4. It is noted that AADS gives the mean accuracy, sensitivity, specificity and
  of 89.8%, 91.53%, 90.40% and 91.53%, respectively.
5.2.6 Experiment-6: TEMP Region
There are 12 channels Xi in the EEG signal  captured from TEMP region as shown in Fig. 5. The accuracy achieved using model M5 is shown in Tab. 4. It is noted that AADS gives the mean accuracy, sensitivity, specificity and
  of 92.87%, 94.37%, 93.33% and 92.87%, respectively.
There are 61 channels Xi in the EEG signal  captured from this region as shown in Fig. 5. The accuracy achieved using model M5 is shown in Tab. 4. It is noted that AADS gives the mean accuracy, sensitivity, specificity and
  of 94.37%, 95.93%, 94.37% and 95.93%, respectively. From above experiments, we observe that the performance of AADS in ALL-61 region is better than other regions (FRONT, CENT, PERI, OCCIP and TEMP) except SC-19. The reason is that in SC-19, we performed the experiment by selecting the channels one-by-one and finally choose those 19 EEG channels which performs with the best results overall. Whereas in ALL-61, we used all the 61 channels Xi in the EEG signal
  , in which some of the channels have not discriminative information and effects the performance of AADS.
To assess the effect of different regions on the performance of AADS, we conducted seven experiments on SC-19, five different brain regions and the whole region SC-61, as shown in Fig. 5. The number of channels Xi in the EEG signals recorded from ALL-61, TEMP, OCCIP, PERI, CENT, FRONT and SC-19 are 61, 12, 8, 10, 14, 17 and 19, respectively. Different results are obtained from 7 different brain regions as shown in Tab. 3; the AADS gives the best results on SC-19 with M5; the accuracies on all other regions are below 95%. The results show that the SC-19 has dominant role in alcoholism detection; it achieves the accuracy of 100%; the detailed results for the SC-19 with model M5 are shown in Tab. 4 and Fig. 6. It means that the SC-19 results in a robust AADS for alcoholism detection. From the selected 19 EEG channels (SC-19), it is also observed that maximum channels are from FRONT region, i.e., 07 as compared to other regions which play dominant role in AADS. The box plot of 20 features over SC-19 using M5 is shown in Fig. 3. From Fig. 3, we observe the clear discrimination between the features of two classes. Fig. 8 visualizes the tSNE plot of the features. In Fig. 8, we observe two separate clusters representing the alcoholic and normal subject’s. This plot shows the clear discrimination of features belonging to the two classes. The box plot and tSNE plot authenticates the dominance of SC-19 with M5 over the other regions.

Figure 8: tSNE plot for two-class problem (alcoholic vs. normal) for features visualization
5.3 Dominant Brain Region and Frequency Band
In this section, we perform the analysis to show from which brain regions or frequency bands, the MP-CNN model is extracting the information for decision making. Firstly, we compute the Pearson correlation between the probabilities (computed by CNN) and the bandpower of five frequency bands (delta, theta, alpha, beta and gamma) of EEG signals of each class. The probabilities here was computed based on the activations of SoftMax in the output layer. Using the correlation values, topomaps of 5 frequency bands (delta, theta, alpha, beta and gamma) of each class are then created as shown in Figs. 9 and 10. From Figs. 9 and 10, we observe that gamma and beta bands are dominant in AAD as compare to other bands. From Fig. 9, it is clear that gamma and beta bands have high correlation with alcoholism. However, there is less or no correlation with the other three bands, i.e., delta, theta and alpha. From Fig. 10, for normal, it is a relatively correlated with gamma and beta bands, and low correlated with delta and theta bands. The theta band has no correlation with normal. From Fig. 9, it is noted that almost complete brain region is covered by gamma and beta bands, which validates the findings of previous studies [14,29–31] in which researchers highlighted the dominance and association of gamma and beta rhythms in alcoholism detection.

Figure 9: Topomaps of alcoholic class (a) delta band (b) theta band (c) alpha band (d) beta band (e) gamma band (f) complete signal

Figure 10: Topomaps of normal class (a) delta band (b) theta band (c) alpha band (d) beta band (e) gamma band (f) complete signal
Secondly, to investigate that from which frequency bands, our method is extracting the information for decision; we compute the Pearson correlation between the extracted features (by CNN) and the bandpower of 5 frequency bands: delta, theta, alpha, beta and gamma of each class. The extracted features here are the activations of the first fully connected layer. As we discussed above, researchers highlighted the importance and association of gamma and beta bands in alcoholism detection [14,29,30]. Moreover, Palaniappan [31] proposes a method that uses gamma band of EEG signal to discriminate alcoholic EEG signals from non-alcoholic signals. This association has been discussed extensively in the neuroscience research. The mean channel wise correlation between frequency bands and features of each class is shown in Fig. 11. From Fig. 11, we observe the dominance of gamma and beta bands as compared to other bands for alcoholic and normal classes. Our findings validate the earlier research findings based on the contribution of gamma and beta in alcoholism detection [14,29–31]. From Figs. 11a and 11b, we noted that the power of gamma and beta bands in alcoholic and normal classes is greater than the power of other bands. From Fig. 11a, for alcoholic class, there is high correlation between gamma band and features, and moderately correlation between beta band and features but low correlation for the other three bands (delta, theta and alpha) and features of alcoholic class. From Fig. 11b, for normal class, there is high correlation between beta band and features, and moderately correlation between gamma band and features but low correlation for the other three bands (delta, theta and alpha) and features of normal class. Therefore, the gamma and beta rhythms are clearly dominating in alcoholism detection as compare to other rhythms. In view of above, gamma and beta are promising bands for investigating the changes in brain activities.

Figure 11: Mean channel wise correlation between bands and features of (a) alcoholic and (b) normal class
Therefore, we conclude that features extracted by the MP-CNN model are correlated with gamma and beta bands, which play important role in AAD as compare to other bands. It is also validated From Fig. 9 that almost complete brain region is covered by gamma and beta bands for alcoholic class.
In order to evaluate the efficiency and effectiveness of the AADS, we performed the comparison of our results with the experimental findings of previous research studies for EEG-based alcoholism detection. Tab. 5 shows the existing approaches based on hand-engineered features for alcoholic vs. normal subjects classification problem. It is evident from Tab. 5 that the proposed AADS demonstrates improved classification efficiency relative to other state-of-the-art methods. Although some of the works presented in Tab. 5 showed high performance metrics but the results have not been obtained using the whole database and the generalization on the whole database is not clear. There are two reasons why the proposed AADS performs better than the exiting approaches. Firstly, it is based on a DL methodology which has shown excellent success in comparison with hand-engineered features for several problems [22–24]. Secondly, it uses a pyramid architecture for CNN models design that is less complex and does not need huge volumes of data for learning.
Table 5: Performance comparison of the proposed AADS

In this study, we addressed the alcoholism detection problem using EEG brain signals and modelled it as a problem of binary classification, i.e., alcoholic vs. normal subject’s classification. For this problem, we developed an AADS based on MP-CNN model and used the KDD dataset for the validation. Most of the recent studies on alcoholism detection are focused on features extracted using the hand-engineered approaches. In contrast, we suggested an end-to-end MP-CNN model that consists of less number of learnable parameters. In this method, the proposed model extracts and selects the discriminative features implicitly and automatically from the EEG signals, and then classifies them. In this approach, all channels are scanned by MP-CNN to generate the prediction. We examined the EEG signals over different brain regions, i.e., ALL-61, SC-19, TEMP, OCCIP, PERI, CENT and FRONT in order to determine which region plays important role in AADS. The results indicate that the selected 19 EEG channels (SC-19) plays dominant role in AADS. The AADS achieved the accuracy of 100% for alcoholic vs. normal subject’s classification. The proposed system for alcoholism detection based on EEG signals outperforms existing techniques due to its significant improvements over the prior systems. Specifically, AADS demonstrates that the method of deep learning to classify brain signals is superior to conventional techniques. The findings reveal that the deep learning framework delivers improved classification efficiency than other state-of-the-art methods and suggests that it can successfully be extended to the development of other expert systems based on EEG signals. One of the future works based on this study is to design and develop the identification system for individual depressive disorders using EEG signals. The other future work for healthcare sector is the deployment of this AAD system in real time environments.
Acknowledgement: The authors extend their appreciation to the Deputyship for Research & Innovation, “Ministry of Education” in Saudi Arabia for funding this research work through the Project No. IFKSURG-1439-067.
Funding Statement: The authors received no specific funding for this study.
Conflicts of Interest: The authors declare that they have no conflicts of interest to report regarding the present study.
1. M. Oscar-Berman and K. Marinkovi. (2007). “Alcohol: Effects on neurobehavioral functions and the brain,” Neuropsychology Review, vol. 17, no. 3, pp. 239–257. [Google Scholar]
2. S. Bavkar, B. Iyer and S. Deosarkar. (2019). “Rapid screening of alcoholism: An EEG based optimal channel selection approach,” IEEE Access, vol. 7, pp. 99670–99682. [Google Scholar]
3. World Health Organization (WHO). (2011). “Alcohol fact sheet,” Geneva: WHO, . [Online]. Available: http://www.who.int/mediacentre/factsheets/fs349/en/index.html. [Google Scholar]
4. World Health Organization (WHO). (2011). Alcohol fact sheet number 349,” . [Online]. Available: http://www.who.int/mediacentre/factsheets/fs349/en/index.html. [Google Scholar]
5. P. Bernice and H. Begleiter. (2003). “Alcoholism and human electrophysiology,” Alcohol Research & Health, vol. 27, pp. 153–160. [Google Scholar]
6. M. Arns, J. Gunkelman, S. Olbrich, C. Sander, U. Heger et al. (2010). , “EEG vigilance and phenotypes in neuropsychiatry: Implications for intervention,” in Neuromodulator and Neurofeedback: Techniques and Applications. London UK: Academic, pp. 79–123. [Google Scholar]
7. A. Anuragi and D. S. Sisodia. (2019). “Alcohol use disorder detection using EEG signal features and flexible analytical wavelet transform,” Biomedical Signal Processing and Control, vol. 52, pp. 384–393. [Google Scholar]
8. A. Priya, P. Yadav, S. Jain and V. Bajaj. (2018). “Efficient method for classification of alcoholic and normal EEG signals using EMD,” Journal of Engineering, vol. 2018, no. 3, pp. 166–172. [Google Scholar]
9. G. Zhu, Y. Li, P. Wen and S. Wang. (2014). “Analysis of alcoholic EEG signals based on horizontal visibility graph entropy,” Brain Inform, vol. 1, pp. 1–4. [Google Scholar]
10. T. K. Padma Shri and N. Sriraam. (2017). “Pattern recognition of spectral entropy features for detection of alcoholic and control visual ERP’s in multichannel EEGs,” Brain Informatics, vol. 4, no. 2, pp. 147–158. [Google Scholar]
11. Henri Begleiter. (1999). “EEG database-UCI KDD archive,” Brooklyn, New York: Neurodynamics Laboratory, State University of New York Health Center, . [Online]. Available: http://kdd.ics.uci.edu/databases/eeg/eeg.data.html. [Google Scholar]
12. Y. Lecun, L. Bottou, Y. Bengio and P. Haffner. (1998). “Gradient-based learning applied to document recognition,” in Proc. of the IEEE 1998, vol. 86, no. 11, pp. 2278–2324. [Google Scholar]
13. I. Ullah, M. Hussain, Q. E. U. Haq and H. Aboalsamh. (2018). “An automated system for epilepsy detection using EEG brain signals based on deep learning approach,” Expert Systems With Applications, vol. 107, pp. 61–71. [Google Scholar]
14. U. R. Acharya, S. V. Sree, S. Chattopadhyay and J. S. Suri. (2012). “Automated diagnosis of normal and alcoholic EEG signals,” International Journal of Neural Systems, vol. 22, no. 3, 1250011. [Google Scholar]
15. S. Patidar, R. B. Pachori, A. Upadhyay and U. R. Acharya. (2017). “An integrated alcoholic index using tunable-q wavelet transform based features extracted from EEG signals for diagnosis of alcoholism,” Applied Soft Computing, vol. 50, pp. 71–78. [Google Scholar]
16. S. Taran and V. Bajaj. (2018). “Rhythm-based identification of alcohol EEG signals,” IET Science Measurement Technology, vol. 12, no. 3, pp. 343–349. [Google Scholar]
17. K. M. Ong, K. H. Thung, C. Y. Wee and R. Paramesran. (2005). “Selection of a subset of EEG channels using PCA to classify alcoholics and non-alcoholics,” in Proc. 27th Annual IEEE Conf. on Engineering in Medicine and Biology, Shanghai, China, pp. 4195–4198. [Google Scholar]
18. R. Palaniappan, P. Raveendran and S. Omatu. (2002). “VEP optimal channel selection using genetic algorithm for neural network classification of alcoholics,” IEEE Transactions on Neural Networks, vol. 13, no. 2, pp. 486–491. [Google Scholar]
19. T. K. P. Shri. (2014). “Characterization of EEG signals for identification of alcoholics using ANOVA ranked approximate entropy and classifiers,” in Proc. Int. Conf. on Circuits, Communication, Control and Computing, Bangalore, pp. 109–112. [Google Scholar]
20. S. Taran and V. Bajaj. (2018). “Rhythm-based identification of alcohol EEG signals,” IET Science Measurement Technology, vol. 12, no. 3, pp. 343–349. [Google Scholar]
21. J. D. C. Rodrigues, P. P. R. Filho, E. Peixoto, A. Kumar and V. H. Albuquerque. (2019). “Classification of EEG signals to detect alcoholism using machine learning techniques,” Pattern Recognition Letters, vol. 125, pp. 140–149. [Google Scholar]
22. E. Albilali, H. Aboalsamh and A. Al-Wabil. (2013). “Comparing brain-computer interaction and eye tracking as input modalities: An exploratory study,” in Proc. Int. Conf. on Current Trends in Information Technology, Dubai, UAE, pp. 232–236. [Google Scholar]
23. Y. LeCun and Y. Bengio. (1995). “Convolutional networks for images, speech, and time series,” in The Handbook of Brain Theory and Neural Networks. USA: MIT Press. [Google Scholar]
24. M. Z. Asghar, F. Subhan, M. Imran, F. M. Kundi, A. Khan et al. (2020). , “Performance evaluation of supervised machine learning techniques for efficient detection of emotions from online content,” Computers, Materials & Continua, vol. 63, no. 3, pp. 1093–1118. [Google Scholar]
25. N. S. Rani, M. Chandrajith, B. R. Pushpa and B. J. B. Nair. (2020). “A deep convolutional architectural framework for radiograph image processing at bit plane level for gender & age assessment,” Computers, Materials & Continua, vol. 62, no. 2, pp. 679–694. [Google Scholar]
26. A. Krizhevsky, I. Sutskever and G. E. Hinton. (2012). “Imagenet classification with deep convolutional neural networks,” in Proc. NIPS 2012, Nevada, USA, pp. 1097–1105. [Google Scholar]
27. T. Zhang, W. Chen and M. Li. (2017). “AR based quadratic feature extraction in the VMD domain for the automated seizure detection of EEG using random forest classifier,” Biomedical Signal Processing and Control, vol. 31, pp. 550–559. [Google Scholar]
28. D. P. Kingma and J. L. Ba. (2015). “ADAM: A method for stochastic optimization,” in Proc. 3rd Int. Conf. on Learning Representations, San Diego, USA, pp. 1–15. [Google Scholar]
29. D. Nguyen, D. Tran, W. Ma and Khoa Nguyen. (2017). “EEG-based random number generators,” in Proc. NSS 2017, LNCS 10394, Helsinki, Finland, pp. 248–256. [Google Scholar]
30. C. L. Ehlers, E. Phillips and M. A. Schuckit. (2004). “EEG alpha variants and alpha power in Hispanic American and white non-Hispanic American young adults with a family history of alcohol dependence,” Alcohol, vol. 33, no. 2, pp. 99–106. [Google Scholar]
31. R. Palaniappan. (2007). “Screening for chronic alcoholic subjects using multiple gamma band EEG, A pilot study,” Journal of Computer Science & Technology, vol. 7, no. 2, pp. 182–185. [Google Scholar]
 | This work is licensed under a Creative Commons Attribution 4.0 International License, which permits unrestricted use, distribution, and reproduction in any medium, provided the original work is properly cited. |