DOI:10.32604/cmc.2021.014752
| Computers, Materials & Continua DOI:10.32604/cmc.2021.014752 | |
| Article |
Windowing Techniques, the Welch Method for Improvement of Power Spectrum Estimation
1Department of Communications, Navigation and Control Engineering, National Taiwan Ocean University, Keelung, 202-24, Taiwan
2Innovative Navigation Technology Ltd., Kaohsiung, 801, Taiwan
*Corresponding Author: Dah-Jing Jwo. Email: djjwo@mail.ntou.edu.tw
Received: 01 October 2020; Accepted: 08 November 2020
Abstract: This paper revisits the characteristics of windowing techniques with various window functions involved, and successively investigates spectral leakage mitigation utilizing the Welch method. The discrete Fourier transform (DFT) is ubiquitous in digital signal processing (DSP) for the spectrum analysis and can be efficiently realized by the fast Fourier transform (FFT). The sampling signal will result in distortion and thus may cause unpredictable spectral leakage in discrete spectrum when the DFT is employed. Windowing is implemented by multiplying the input signal with a window function and windowing amplitude modulates the input signal so that the spectral leakage is evened out. Therefore, windowing processing reduces the amplitude of the samples at the beginning and end of the window. In addition to selecting appropriate window functions, a pretreatment method, such as the Welch method, is effective to mitigate the spectral leakage. Due to the noise caused by imperfect, finite data, the noise reduction from Welch’s method is a desired treatment. The nonparametric Welch method is an improvement on the periodogram spectrum estimation method where the signal-to-noise ratio (SNR) is high and mitigates noise in the estimated power spectra in exchange for frequency resolution reduction. The periodogram technique based on Welch method is capable of providing good resolution if data length samples are appropriately selected. The design of finite impulse response (FIR) digital filter using the window technique is firstly addressed. The influence of various window functions on the Fourier transform spectrum of the signals is discussed. Comparison on spectral resolution based on the traditional power spectrum estimation and various window-function-based Welch power spectrum estimations is presented.
Keywords: Window functions; Welch method; discrete Fourier transform; spectral leakage
The method of information extraction depends on the type of signal and the nature of the information being carried by the signal. A fundamental aspect of digital signal processing (DSP) is filtering, which is the process of transformation of input sequence to obtain desired output sequence. A digital filter is a system that performs mathematical operations on a sampled, discrete-time signal to reduce or enhance certain aspects of that signal. Digital filters are pervasive and play an important role in DSP, which is an important field in the present era of communication systems, digital computer technology, and consumer devices.
The input and output signals in a digital filter are discrete time sequence. Digital filters are linear time invariant (LTI) systems which are characterized by unit sample response. They are portable and highly flexible with minimum or negligible interference noise and other effects. Various methods for filter designs and analysis have been developed. Digital filters are categorized in two types: Finite impulse response (FIR) and infinite impulse response (IIR). Digital filters with infinite duration impulse response are referred to as IIR filters. The present output of FIR type filters depends on present input and past inputs. In comparison to IIR filters, the FIR filters are non-recursive and have greater flexibility to control the shape of their magnitude response. FIR digital filters are widely used than IIR ones since FIR filters are always stable, and have an exactly linear phase, and arbitrary amplitude-frequency characteristic, etc. Bandpass filtering plays an important role in DSP applications. It can be used to pass the signals according to the specified frequency passband and reject the frequency other than the passband specification.
Spectrum analysis [1–6] is a critical concern in many military and civilian applications, such as performance test of electric power systems and communication systems, and detection of mechanical vibration. Power spectrum estimation (PSE) is important in DSP. In applications of spectral analysis, a narrow main-lobe width of the window function in frequency domain is required for increasing the ability to distinguish two closely spaced frequency components. There are mainly two categories of PSE method: Parametric and nonparametric. The periodogram is an estimate of the power spectral density (PSD) of a signal in time series analysis for examining the amplitude versus frequency characteristics of FIR filters and window functions. It is a method of estimating the autocorrelation of finite length of a signal, and is easy to compute and possesses limited ability to produce accurate PSE. As a non-parametric estimator of the PSD of a random signal, the periodogram is not consistent due to the fact that its variance does not converge towards zero even when the length of the random signal is increased towards infinity.
Simple in operation, window function provides greater flexibility in DSP applications. In frequency resolution problems, a narrow main-lobe width of window function in frequency domain is usually required. Direct truncation is equivalent to the rectangular window shaping. A rectangular time window has narrow main lobe and wide side lobe with small main lobe to side lobe ratio, resulting in serious side lobe leakage. Effort has been made to mitigate the influence of spectral leakage of the Fourier transform spectrum by selecting appropriate window functions [7–14]. Some alternative windows with narrow side lobe, such as the triangular, Hanning, Hamming, Blackman, and Kaiser windows, respectively, are usually employed in engineering. Most window functions afford more influence to the data at the center of the set than to data at the edges, which represents a loss of information.
The spectral leakage suppression algorithms [15,16] for the discrete Fourier transform (DFT)-based spectrum analysis have been extensively studied to relieve the performance deterioration. The methods include digital filtering, high-order spectral analysis, leakage compensation in frequency domain and weighting the time samples by a suitable window function. Selection of suitable window function for different applications requires professional knowledge since the window functions are varied and have different characteristics. The window is optimized to minimize the maximum (nearest) side lobe. A good resolution in PSE may be achieved by using optimum size of data sample. Due to computer capacity and limitations on processing time, only limited time samples can actually be processed during spectrum analysis and data processing of signals. The original signals need to be cut off, which induces leakage errors.
In spread spectrum system, the individual data sets are commonly overlapped in time to mitigate the information loss. The frequency-domain interference suppression algorithms always use data windows to reduce the spectral leakage associated with truncation, and employ overlap to mitigate the signal-to-noise ratio (SNR) degradation due to windowing. Known as the method of averaged periodograms used for estimating power spectra, the Bartlett’s method provides a way to reduce the variance of the periodogram at the expense of a reduction in resolution. A final estimate of the spectrum at a given frequency is obtained by averaging the estimates from the periodograms derived from non-overlapping portions of the original series. Bartlett’s method provides a method to reduce the variance of the periodogram in exchange for a reduction of resolution in compared to standard ones. The variance of the periodogram is reduced by applying a window to the autocorrelation estimate to decrease the contribution of unreliable estimates to the periodogram. As a generalization of Barlett’s method using windowed overlapping segments, the nonparametric Welch’s method [17,18] is an approach for PSE based on the concept of using periodogram spectrum estimates and is usually employed to reduce the variance of the estimated PSD. It is an improvement on the periodogram spectrum estimation method where the SNR is high and reduces noise in the estimated power spectra.
The remainder of this paper is organized as follows. In Section 2, preliminary background on the Fourier transform is reviewed, including the discrete Fourier transform, and the fast Fourier transform. The spectrum leakage is introduced in Section 3. In Section 4, window functions for spectrum leakage suppression are discussed. The Welch method is introduced in Section 5. In Section 6, simulation experiments are carried out to evaluate the performance for various designs. Conclusions are given in Section 7.
The Fourier transform is employed to transform signals in time domain to frequency domain and to do the reverse and has been very important in a broad spectrum of expertise, such as the engineering, mathematics, and the physical sciences. The discrete counterpart of the Fourier transform is the DFT for implementation on digital hardware. DFT is can be efficiently realized by fast Fourier transform (FFT). Equivalent to the continuous Fourier transform, the DFT converts a finite sequence of equally-spaced samples of a function into a same-length sequence of equally-spaced samples of the discrete-time Fourier transform (DTFT), which is a complex-valued function of frequency.
The DTFT transform pair is symbolically denoted by


The DTFT is a continuous and periodic function of frequency, whereas the DFT provides discrete samples of one cycle. Operation on a finite N point sequence,  using the DFT is expressed as

The corresponding inverse DFT (IDFT) is

A more simplified formulation for DFT can be represented as

with the IDFT given by

where WN is the N root of unity:  , referred to as the Twiddle factor. The DFT and the DTFT are connected by the relationship

As the sampled Fourier transform, the DFT does not contain all frequencies forming an image, while only a set of samples which is large enough to fully describe the spatial domain image. If the original sequence is one cycle of a periodic function, the DFT provides all the non-zero values of one DTFT cycle.
Table 1: Comparison of number of complex multiplications required for DFT and FFT
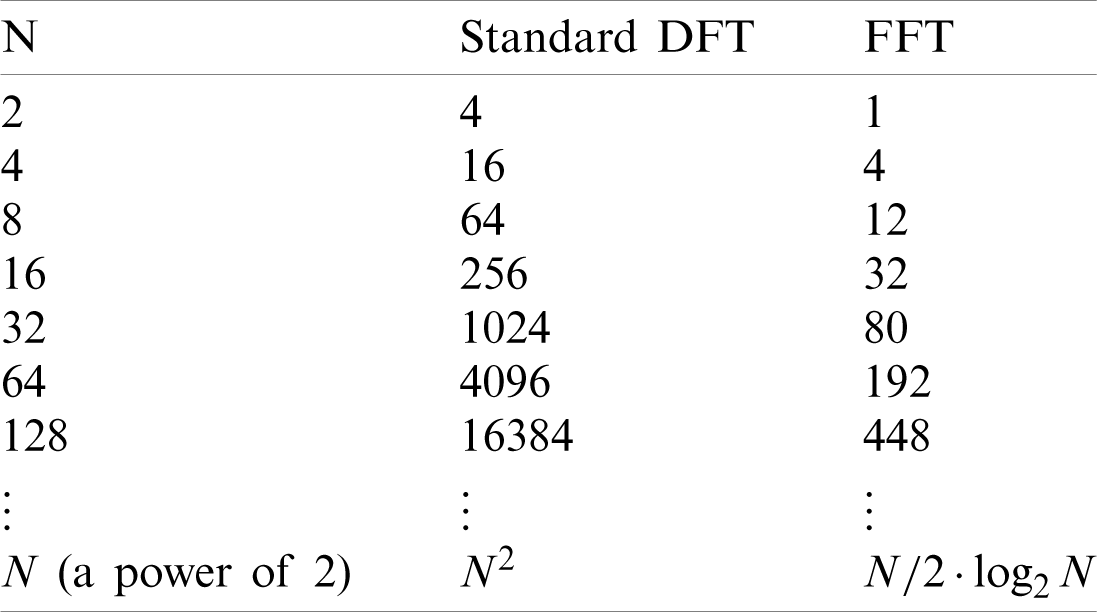
In 1965, Cooley and Tukey proposed an efficient calculation algorithm of DFT that reduces the computational complexity to  . Various FFT algorithms were developed such as radix-2, radix-4 and split radix algorithm. The implementations of DFT usually employ efficient FFT algorithms, so that the terms FFT and DFT are often used interchangeably. Tab. 1 provides comparison of workload for DFT (N2) and FFT, where comparison of number of complex multiplications required us given. The number of complex multiplications for the FFT is calculated through
 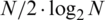 [1].
[1].
Signal truncated by time window results in spectral leakage, which causes the signal levels to be reduced and redistributed over a broad frequency range, and is important for implementing DSP properly. The flow chart of the DFT calculation with various processing techniques involved is shown as in Fig. 1. The rectangular window has narrow main lobe and wide side lobe with small main lobe to side lobe ratio, which results in serious side lobe leakage. Fig. 2 shows the discrete spectrum due to signal windowing truncation.
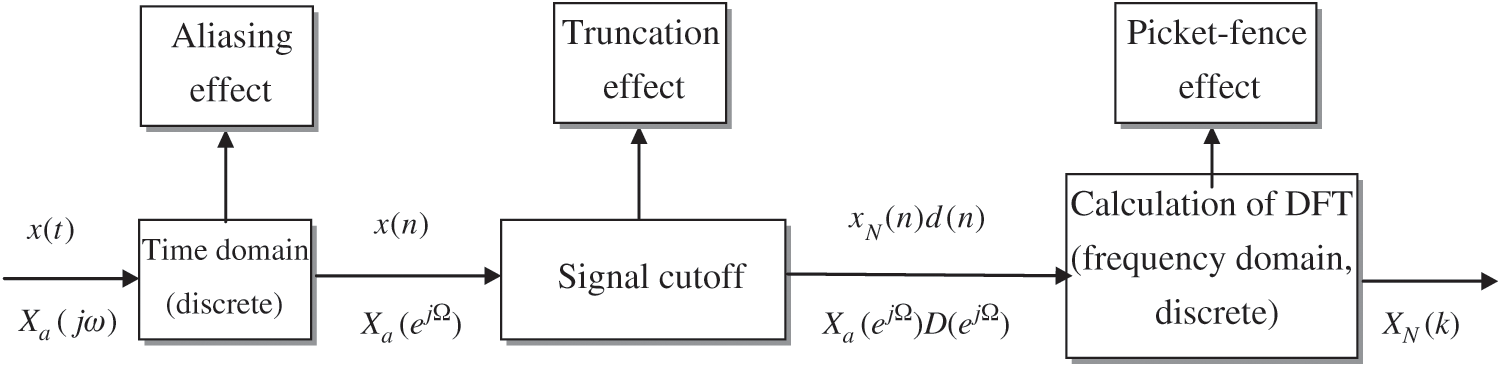
Figure 1: The discrete Fourier transform (DFT) calculation with various processing techniques involved
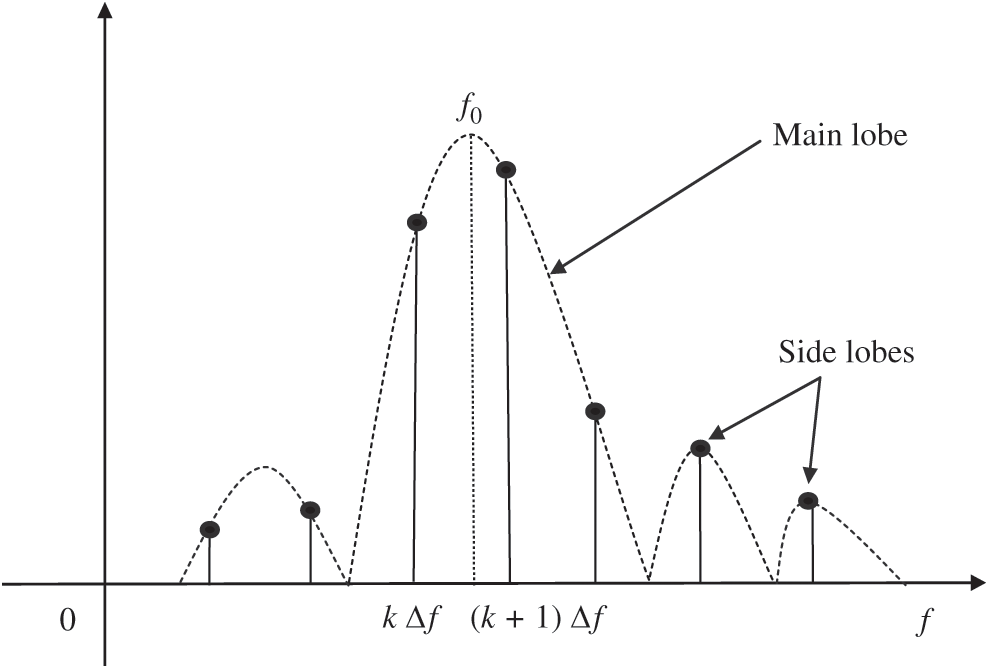
Figure 2: Discrete spectrum due to signal windowing truncation
3.1 Spectrum Leakage Mitigation-Periodic Truncation
The sampling signal length is not integer multiple of the signal period length. Through the DFT, the sampling signal will result in larger distortion and cause unpredictable spurious components and spectral leakage. Assume that the signal period is T0, the sampling period is Ts, and the sampling point is N. The relationship LT0/Ts = N is expected. The DFT algorithm takes the small amount of captured data and repeats it to perform the Fourier transform and produce the frequency spectrum. In the case that the signal is periodic the resulting frequency spectrum will have no leakage. Since most measured signals will possess non-periodic signals, the problem is to minimize leakage. Fig. 3 shows the magnitude (in dB) of the DFT spectrum using a periodic and a non-periodic truncation, respectively.
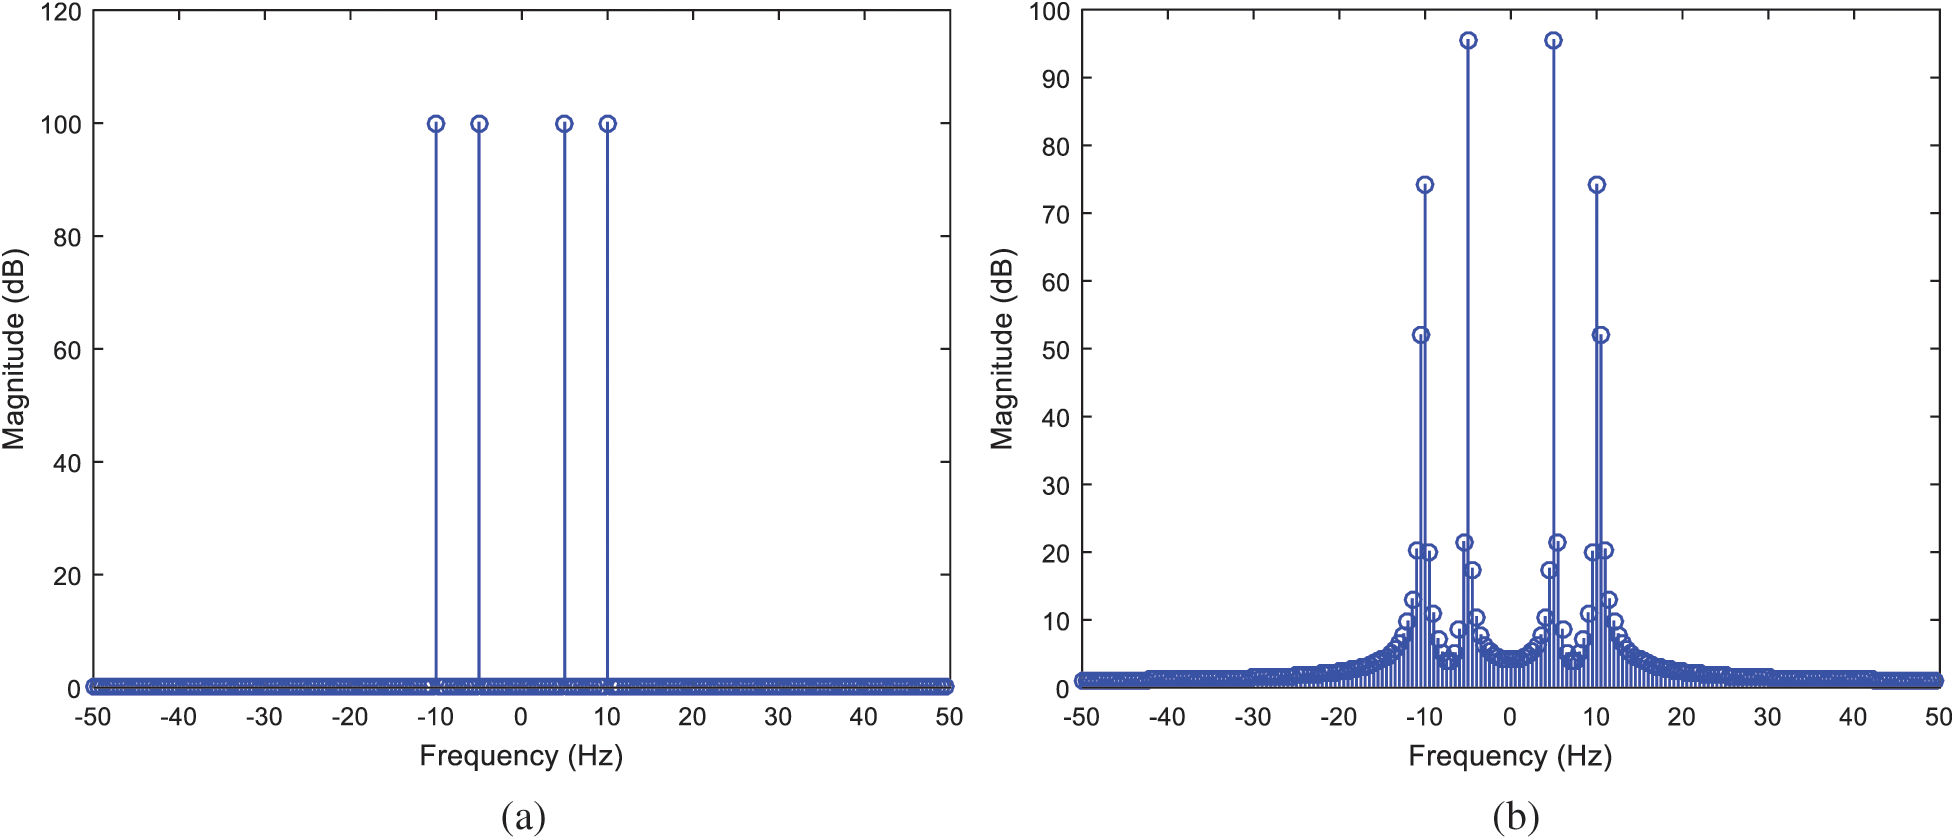
Figure 3: Magnitude of the DFT spectrum using a (a) periodic; (b) non-periodic truncation
3.2 Spectrum Leakage Suppression-Enlarging the Data Length in Window Function
Windowing is implemented by multiplying the input signal with a window function. Windowing amplitude modulates the input signal so that the spectral leakage is evened out. Thus, windowing reduces the amplitude of the samples at the beginning and end of the window. An input signal can be of any number of dimensions and can be complex.
As data length is increased, the rate of fluctuation in this is also increased. The variance of the periodogram is reduced by applying a window to the autocorrelation estimate to decrease the contribution of unreliable estimates to the periodogram. Increasing the width of window function is equivalent to enlarging the length of segment with large main-lobe-to-side-lobe ratio, which results in less side-lobe leakage. The spectrum resolution is improved since the main-lobe width becomes narrower as the length (N) of the data is increased. However, decreasing the main-lobe width also reduces the suppression capability on spectrum leakage since the energy on the side lobes is also increased.
4 Window Functions for Spectrum Leakage Suppression
The method of window functions has been very popular in DSP for inhibition of spectral leakage by cutting the signal when the period is delay and two-side is continuous. Many different window functions have been developed for truncating and shaping a length-N signal segment for spectral analysis. Frequency domain function in representation of window function is calculated through

A rectangular window is a function that is constant inside the interval and zero elsewhere, which provides information about every component of frequency within the range. The simple direct truncation window has a periodic sinc DTFT, which has the narrowest main-lobe width,  at the −3 dB level and
  between the two zeros surrounding the main lobe, of the common window functions, but also the largest side-lobe peak, at about −13 dB. The side-lobes also taper off relatively slowly. The truncation to a length N −1 is equivalent to multiplying the signal by a rectangular window, defined as

The corresponding frequency domain can be expressed as

Rectangular window has a narrow main lobe and wide side lobes with small main lobe to side lobe ratio, resulting in serious side lobe leakage. The minimum stopband attenuation is 21 dB.
Triangular windows in time domain are given by either of the followings:
or
which can be represented by the unified formulation

where L can be N, N + 1, or N + 2. All three definitions converge at large N. The corresponding transform is given by

The main-lobe width for the triangular window is  , which is twice of the rectangular one. The maximum side lobe for the triangular window is 25 dB lower than the main lobe, and the minimum stopband attenuation is 25 dB.
As a raised-cosine window, the Hanning window takes the form:

with the corresponding frequency domain defined as

It has a main-lobe width considerably larger than that of the rectangular window, but with much lower largest side-lobe peak, at about −31 dB. The side lobes also taper off much faster. For a given length, it is worse than the boxcar window at separating closely-spaced spectral components of similar magnitude, but better for identifying smaller-magnitude components at a greater distance from the larger components. It has a main-lobe width about  at the −3 dB level and
  between the two zeros surrounding the main lobe.
Like the Hanning window, the Hamming window also belongs to a kind of the raised cosine window, and thus exhibits similar characteristic to the Hanning window, but further suppresses the first side lobe. The Hamming window is defined as

which has the frequency domain

where  is the magnitude spectrum of the rectangular window. For the Hamming window, 99.96% of the energy is in the main lobe. The maximum side lobe is 41 dB lower than the main lobe, and the minimum stopband attenuation is 53 dB.
The Blackman method is used to reduce variance of the estimator, thus presents improvement in stopband attenuation. As compared to other windows, the Blackman window possesses good characteristics for audio processing, which has the time domain defined as

It has the frequency domain given as
The maximum side lobe for the Blackman window is 57 dB lower than the main lobe, which is three times as that of rectangular window, and the minimum stopband attenuation is 74 dB.
Discovered by James Kaiser, the Kaiser window is a simple approximation of the DPSS (digital prolate spheroidal sequence) window using Bessel functions. The Kaiser window function is given by
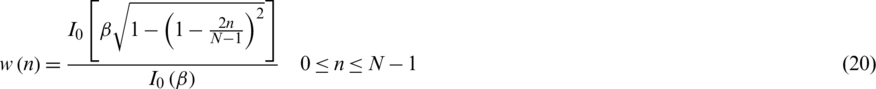
where  is the zeroth-order modified Bessel function of the first kind

As a kind of adjustable window function, the Kaiser window provides independent control of the main-lobe width and ripple ratio. The variable parameter  controls both width and tapping off, where
  is a non-negative real number that determines the shape of the window and therefore determines the tradeoff between main-lobe width and side lobe labels of the spectral leakage pattern. As
  increases, the main-lobe width becomes larger while the side lobe amplitudes becomes smaller. The main-lobe width, in between the nulls, is given by
  , in units of DFT bins, and a typical value of
  is 3. The other selection of variable parameter
  is
is

The zero-phase version of Kaiser Window function is given by
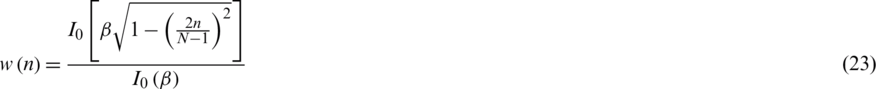
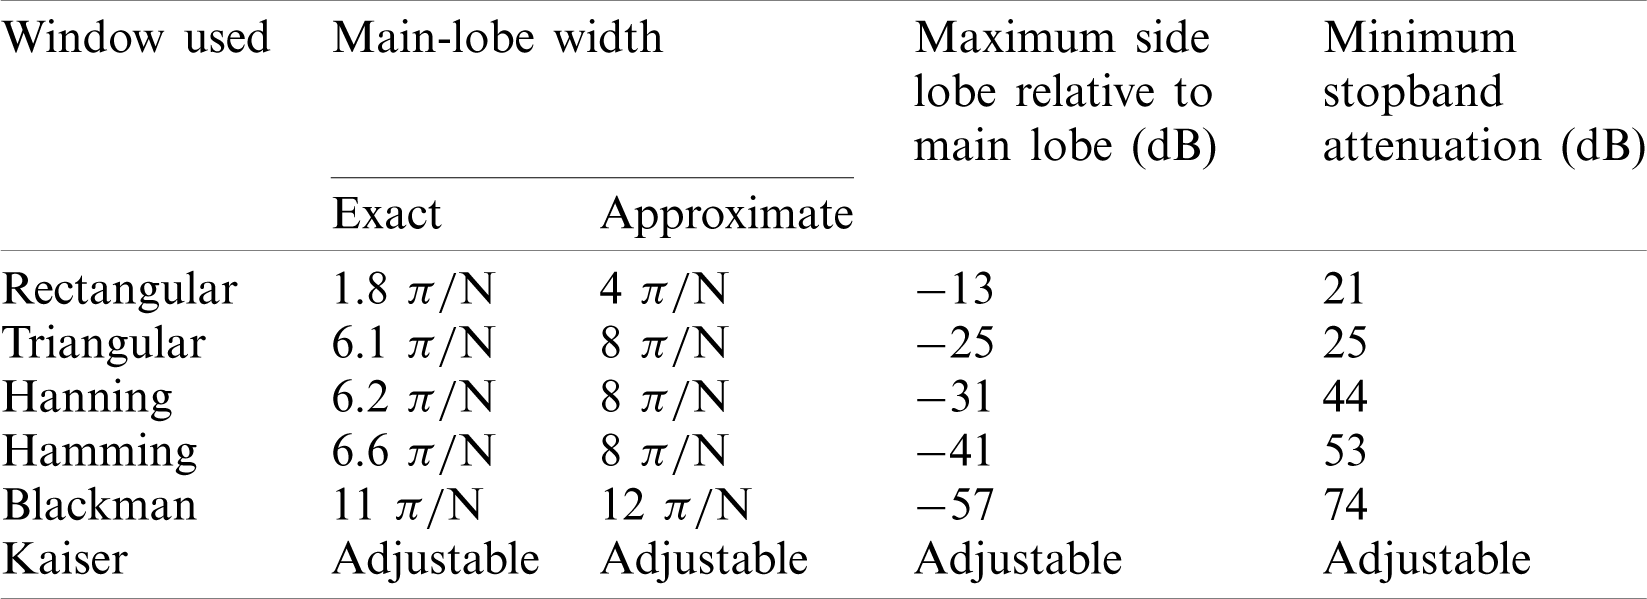
Fig. 4 presents the time domain amplitudes for various window functions; Fig. 5 shows the magnitude spectra for various window functions. Performance comparison for various window functions is summarized in Tab. 2. Higher computational complexity is required due to the use of Bessel functions. The side lobe of Blackman window outperforms the other windows except for the Kaiser window, which possesses adjustable parameters and thus provides flexibility.
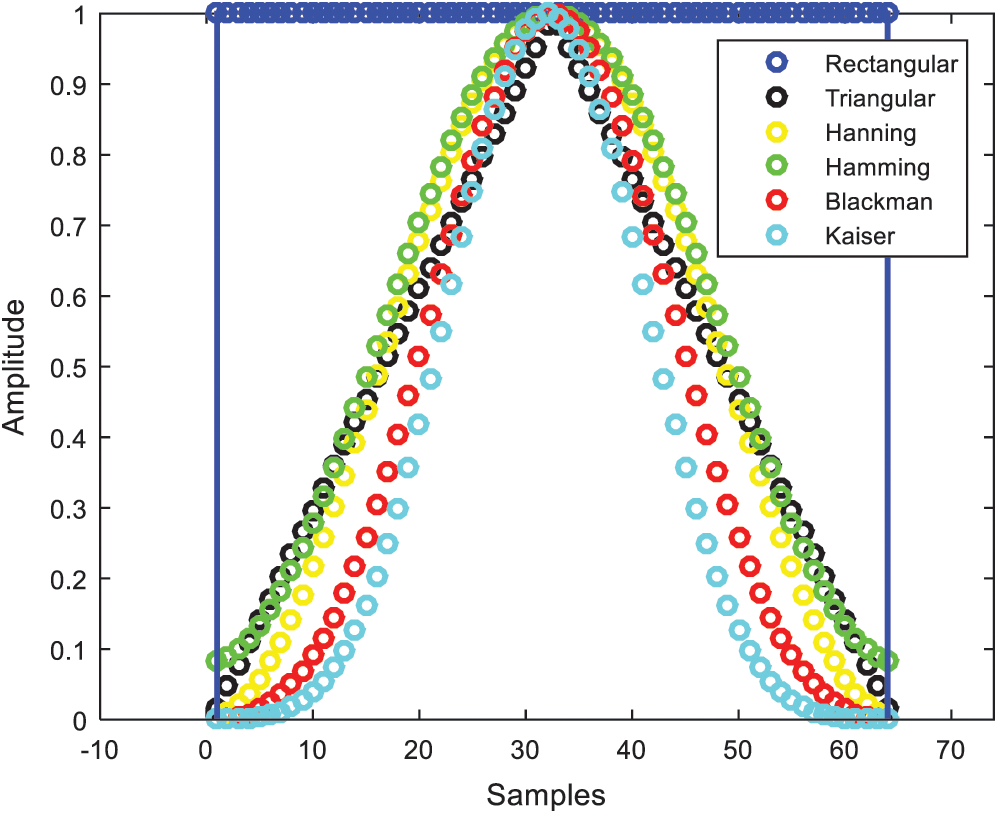
Figure 4: Time domain amplitude for various window functions
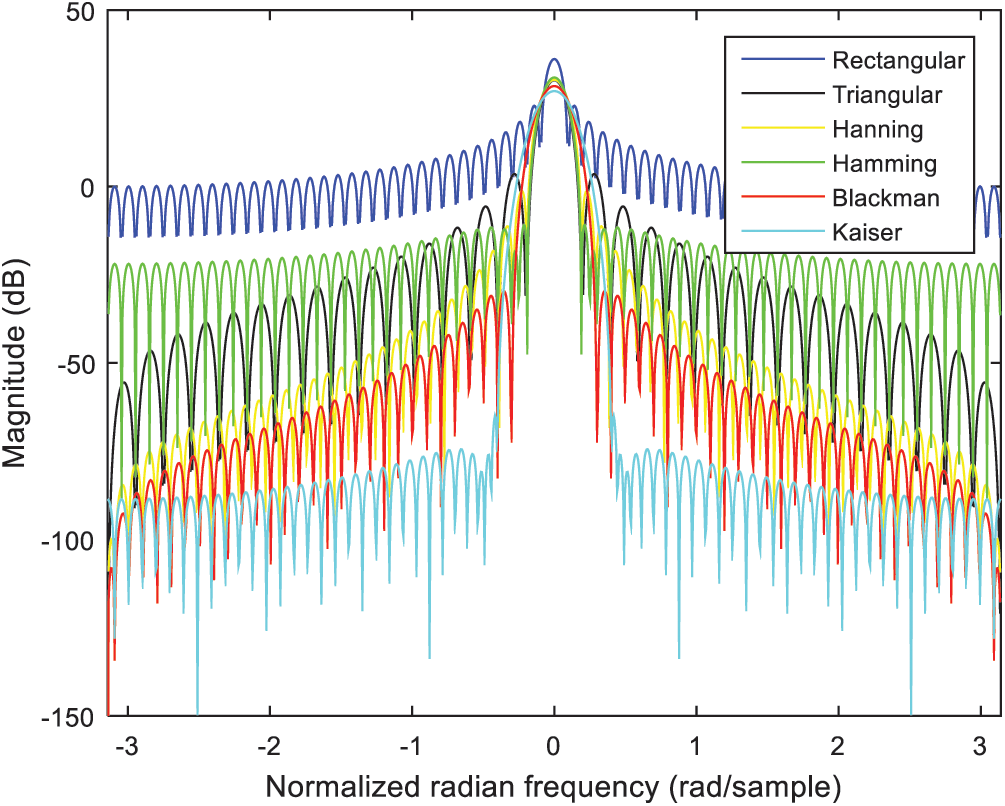
Figure 5: Magnitude spectrum for various window functions
Table 2: Performance comparison for various window functions
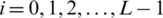
Shown in Fig. 6, a classical periodogram approach is an estimate of the spectral density of a signal, which can be of any number of dimensions and can be complex. The periodogram is obtained by performing the DFT calculation, followed by computing the squared magnitude of the result, as follows

where 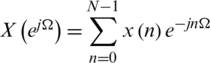 , therefore

where 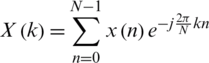 . The data segment can be expressed as
 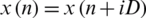 , where
 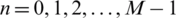 ;
;  , iD is the starting point for the i-th sequence. If D = M, the segment do not overlap and the L of data sequence is identical to the data segment of Bartlett method.
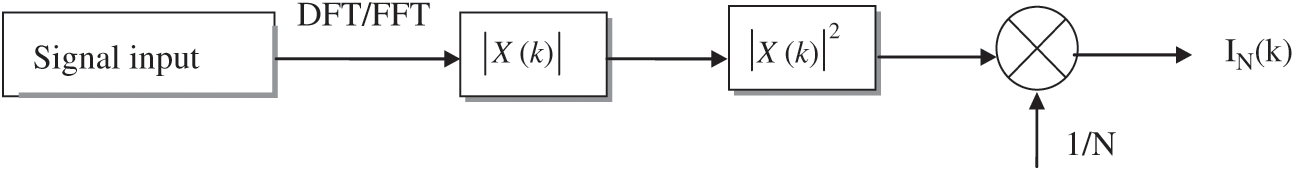
Figure 6: Flow chart of the classical periodogram approach
In Welch’s method, the original data segment is split up into several data segments where there might be overlapping points. A time domain window is applied to the individual data segments after the data is split up into overlapping segments. It is an improvement on the standard periodogram spectrum estimating method and on the Bartlett’s method, for which the following procedures are involved: (1) Split up the original data segment into several non-overlapping segments; (2) Estimate the PSD/Compute the periodogram by computing the DFT for each segment, and then compute the squared magnitude of the result, followed by dividing this by the length; (3) Average over these local estimates for the non-overlapping data segments. The Welch method is carried out by dividing the time signal into successive overlapping segments, forming the periodogram for each block, and averaging, which reduces the variance of the individual power measurements. Fig. 7 provides the flowchart of Welch method with windowing, where the modulo inside the dotted-line block indicates the area of interest in this research.
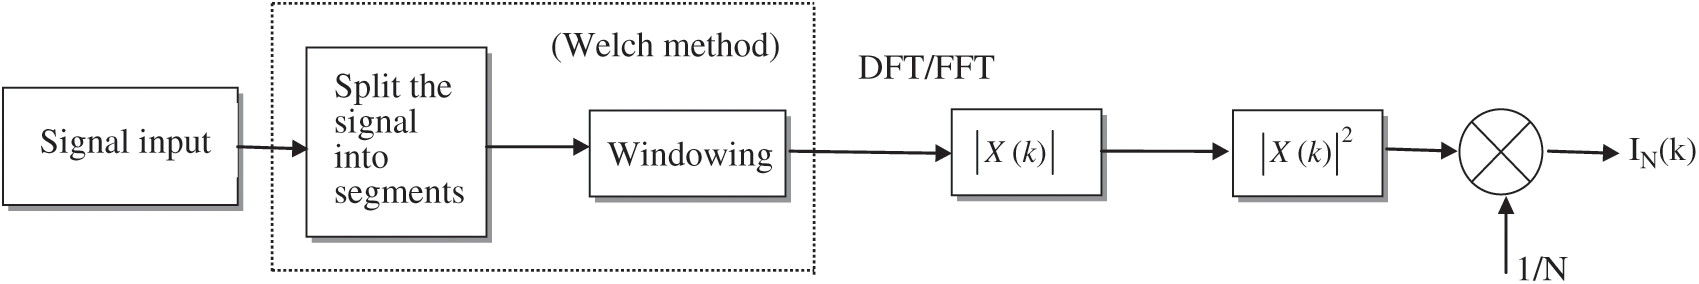
Figure 7: Flow chart of the Welch method with windowing
The Welch method is to window the data segments prior to compute the periodogram.

where  is the window used and
  is a normalization factor for the power

The Welch PSE is the average of modified periodogram

with the mean value given by

The resolution of PSE is determined by the spectral resolution of each segment which is of length L, which is window independent.

The windowing processing of the segments is what makes the Welch method a modified periodogram.
6 Performance Illustration and Discussion
To investigate the capability for inhibition of spectral leakage, the power spectra are illustrated using various window functions before and also after the Welch method is incorporated. Simulation experiments are conducted to evaluate the performance for various designs. Computer codes were developed using the Matlab® software for testing and verification of the PSE performance.
6.1 Spectra of a Sine Wave Due to Windowing
In the first example, the continuous signal  is employed, where two frequencies f = 10.4 Hz and f = 31.2 Hz, respectively are involved. The sampling frequency is fs = 100 Hz, truncated to data length
  . The rectangular window has good resolution characteristics for sinusoids of comparable strength. The original sinusoid signal in time domain and its magnitude spectrum are shown as in Fig. 8. Fig. 9 provides the time domain signal with various window functions with
  . For each of the subplots, the original and windowed signals are provided for better illustration. Fig. 10 provides comparison of magnitude spectra for various window functions, using
  , 32, 64 and 128, respectively. The graphs illustrate the variation based on various window functions. As the length is increased, the rate of fluctuation in this is also increased.
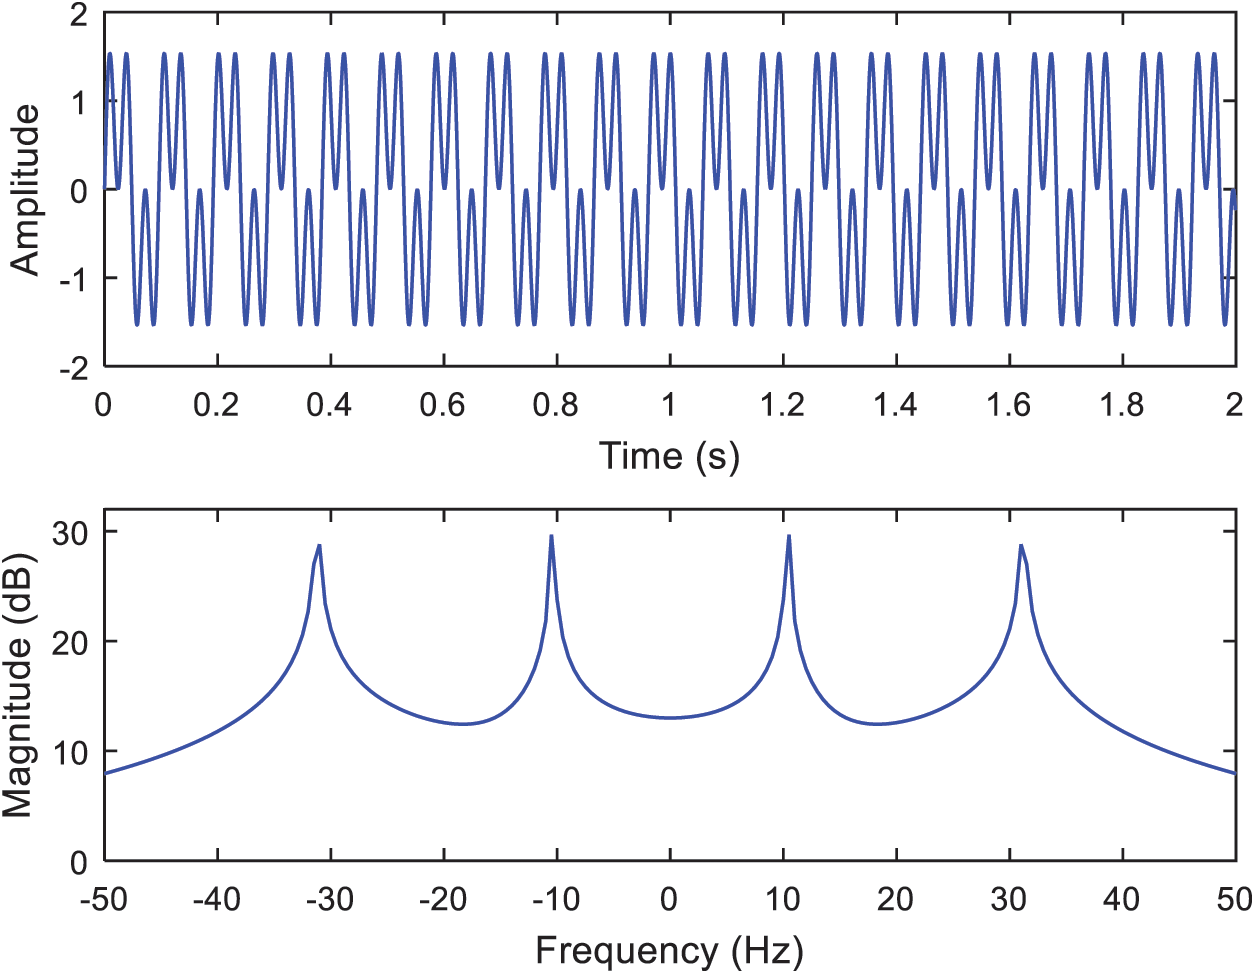
Figure 8: Original time domain sinusoidal signal and its magnitude spectrum
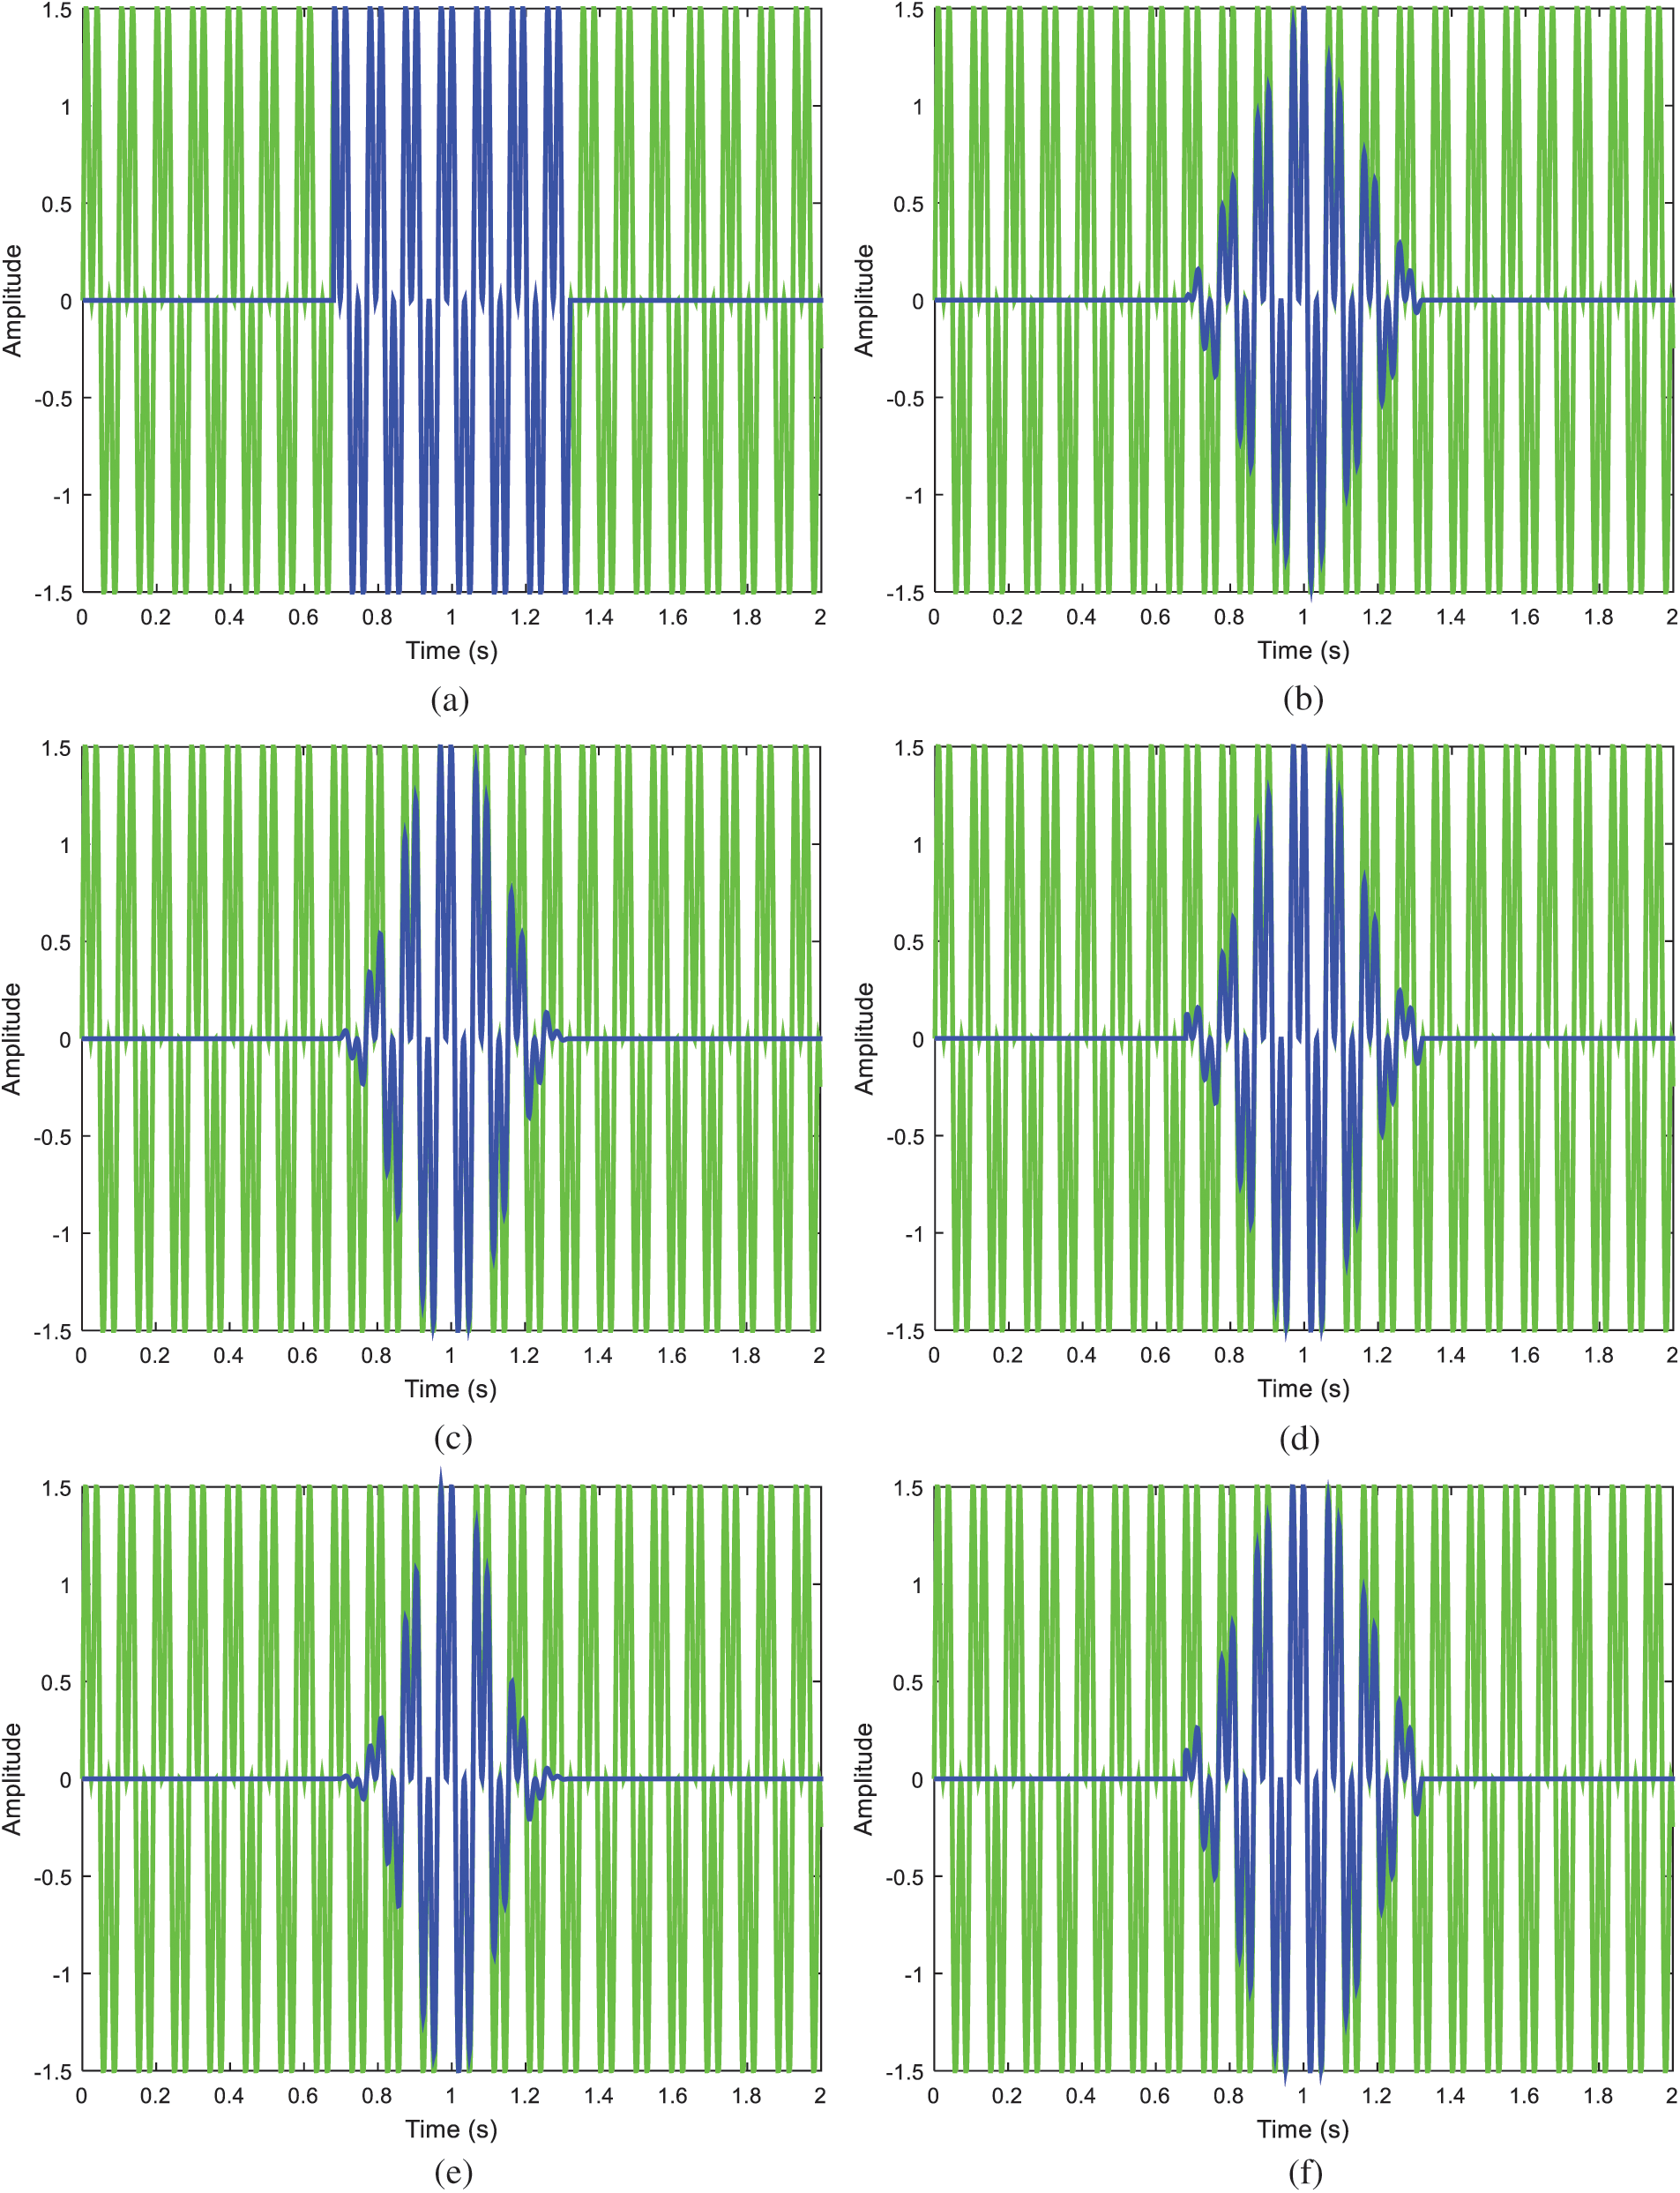
Figure 9: Time domain signals with various window functions (a) rectangular, (b) triangular, (c) Hanning, (d) Hamming, (e) Blackman, (f) Kaiser
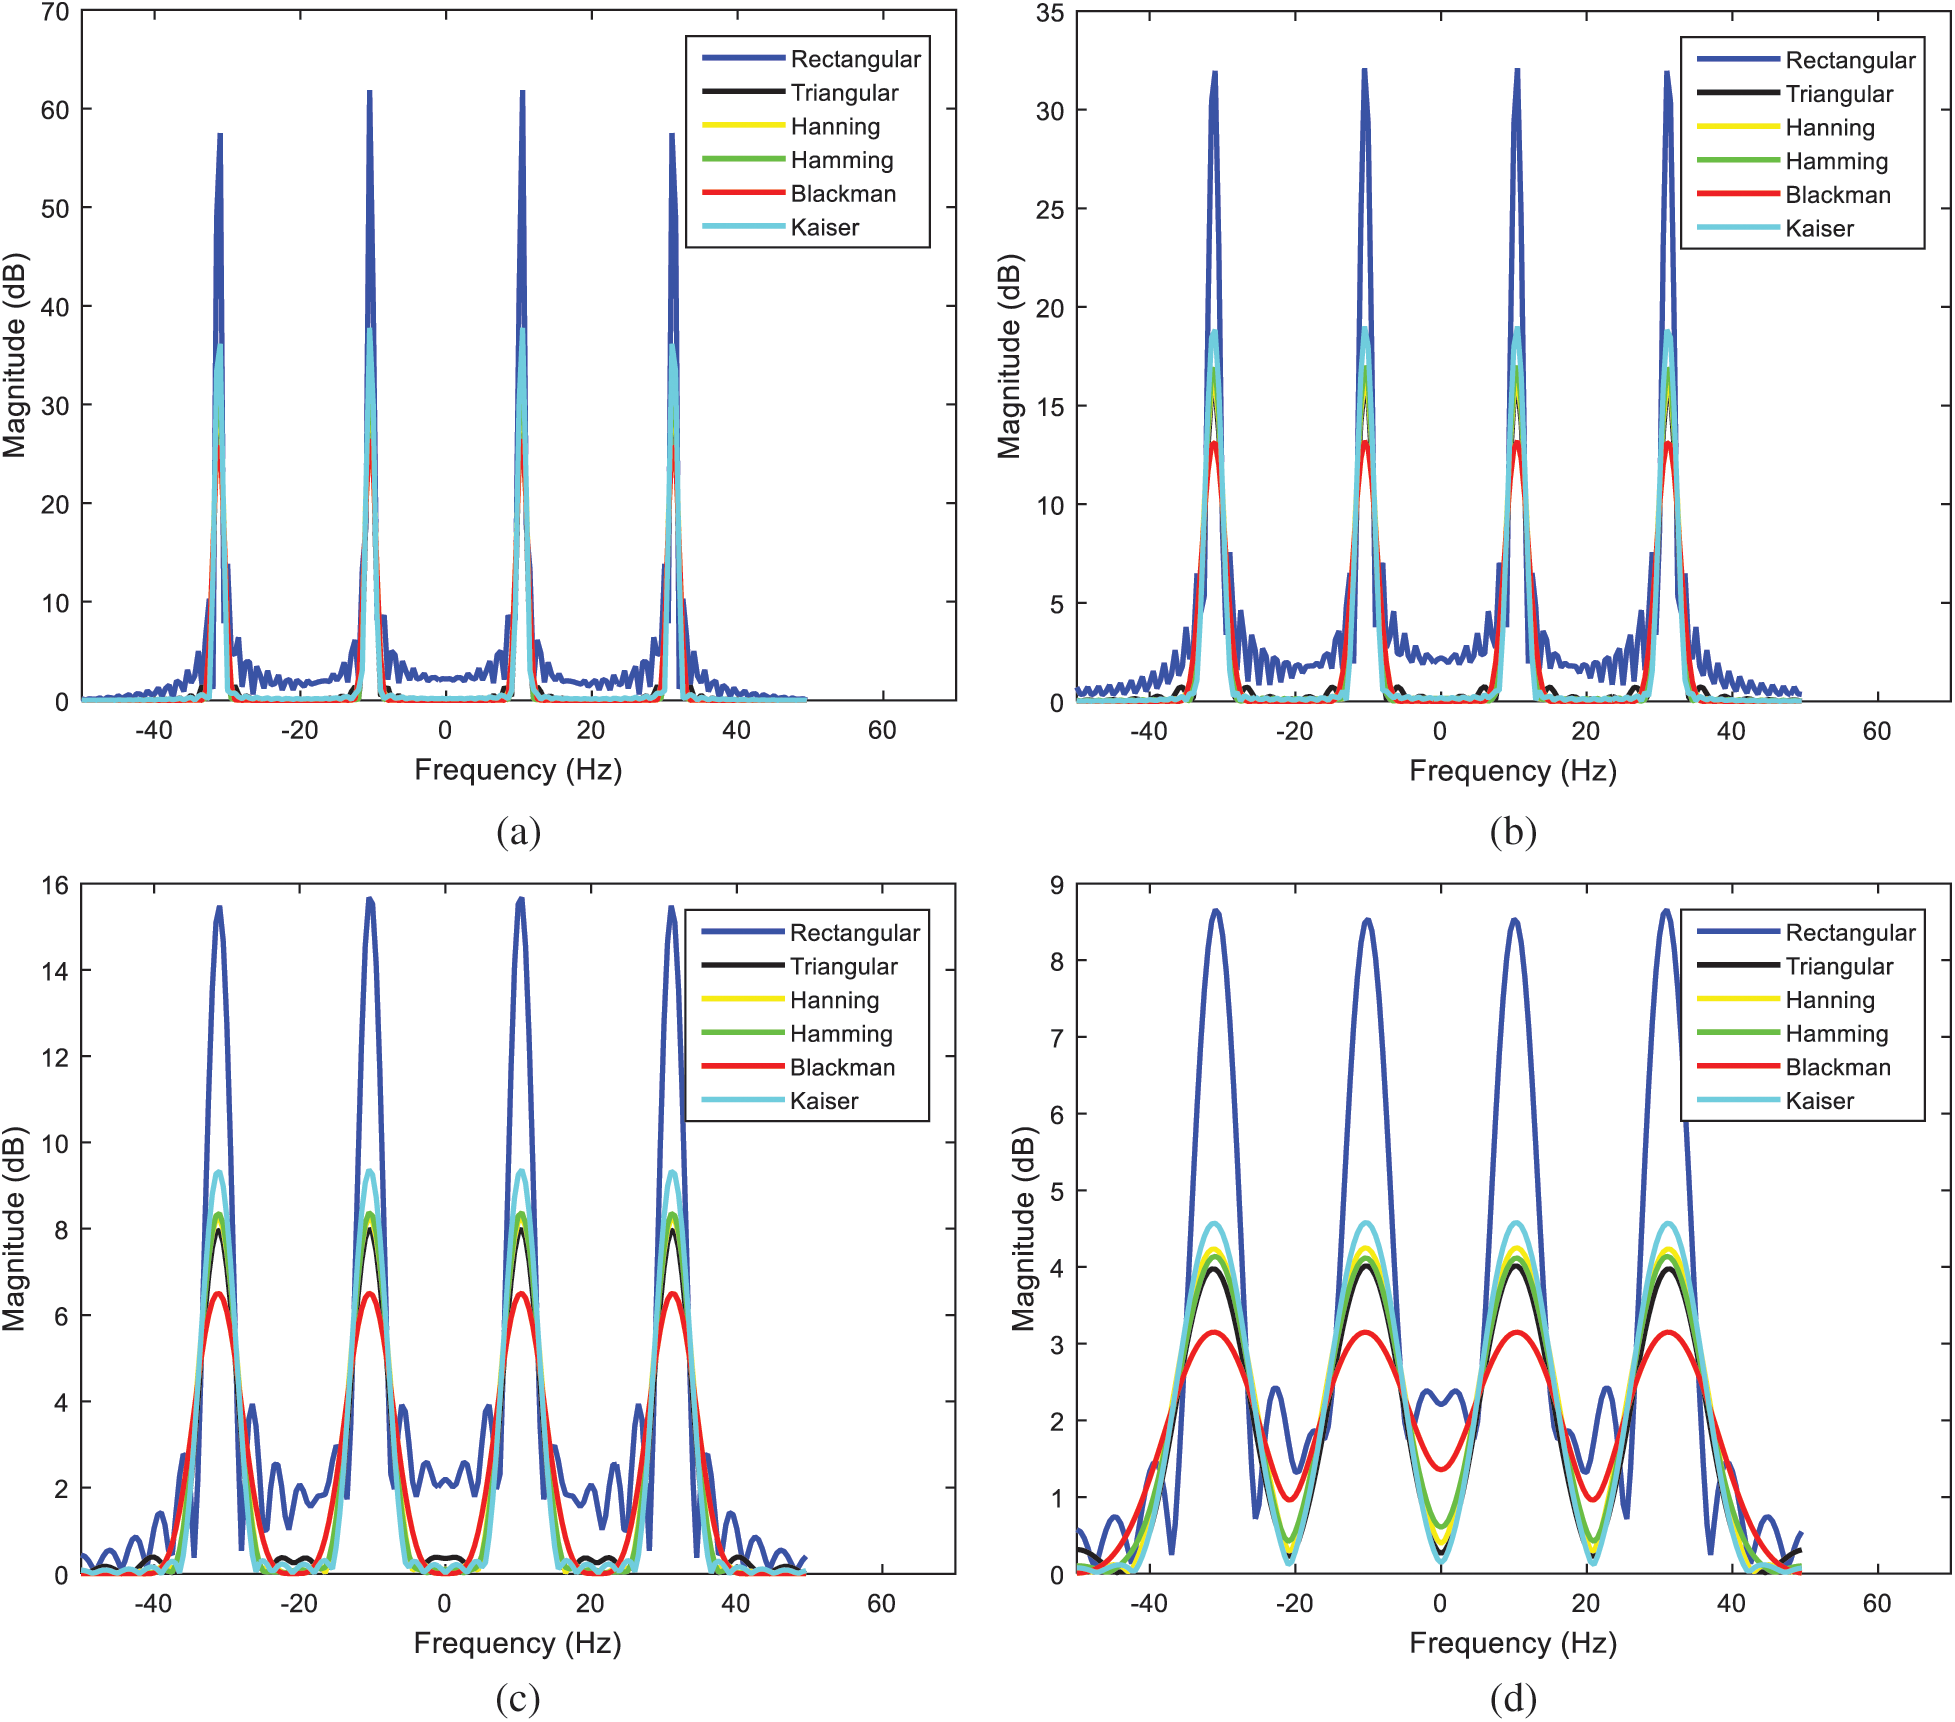
Figure 10: Comparison of magnitude spectra for various window functions (a)  , (b)
, (b)  , (c)
, (c)  , (d)
, (d) 
There are two requirements for the window functions: (1) The main-lobe width should be as narrow as possible for better resolution; (2) The side lobes should be as smaller as possible, so as to increase energy on the main lobe, and increase the stopband attenuation. Resolution represents the ability to discriminate spectral feature and is a key concept on the analysis of spectral estimator performance. Estimation with low spectrum resolution causes the signal easily disturbed by the noise, leading to the failure of detection.
It can be seen that, the rectangular window, with minimum stopband attenuation, has the clear peaks showing in the graph of the power spectrum estimation and has admirable resolution characteristics for sinusoids of comparable strength. Ripples in pass band are more in rectangular as compared to the other windows. Therefore, the rectangular window is generally not recommended due to high side lobes. Both the rectangular and Kaiser windows possess clear peaks showing in the graph of the PSE, and they have narrower main-lobe width in frequency domain. As can be seen, the spectral resolution based on the rectangular window and Kaiser windows is relatively higher, whereas the noise level near the fundamental frequency of the signal is higher. It is considered that both the rectangular and Kaiser windows are suitable for high precision spectrum estimation of signals with high SNR among others. As compared to the other ones the Kaiser window is known as the optimal window since it has maximum attenuation according to the given width of the main lobe.
The advantage of using Hanning window method is that it reduces the side lobes and possesses good frequency resolution over the rectangular window. The Hanning window possesses better suppression capability on spectrum leakage, while the frequency resolution is relatively lower, hence suitable for general frequency estimation of signals with low SNR. The Hamming window is a modification over Hanning window and both present similar characteristics. The difference between the two is that, at the edges the Hamming window does not get as close to zero as does Hanning window. The Hamming window is employed to minimize the maximum nearest side lobes, which possesses a form similar to the Hanning window but with slightly different constants. It has a similar main-lobe width, but with a much lower largest side-lobe peak. However, the side-lobes also taper off much more slowly than that with the Hanning window. For a given length, the Hamming window outperforms the Hanning at separating a small component relatively near to a large component, but worse than the Hanning for identifying very small components at considerable frequency separation.
Hamming and Blackman, and possibly Kaiser (with appropriate selection of adjustable parameters) have larger stopband attenuation. The PSE based on rectangular window has narrowest main-lobe width, meaning that it has best resolution. However, its side lobes are higher than those of others, with larger leakage induced. Additionally, it has larger deviation between side lobes and thus has largest variance. On the other hand, the other windows (such as the Hamming and Blackman, and Kaiser windows, etc.) have wider main-lobe widths, thus possess decreased resolution. However, they have smaller side lobes, with improved suppression capability on spectrum leakage. Comparing other methods, the Blackman has the smallest side lobes but the main-lobe width is the largest. The spectrum resolution of the estimate is improved as the length N of the data increases in exchange for a reduction of suppression capability. Influence of data length to the PSE resolution is shown in Fig. 11, where  , 32, 64, and 128, respectively, are illustrated.
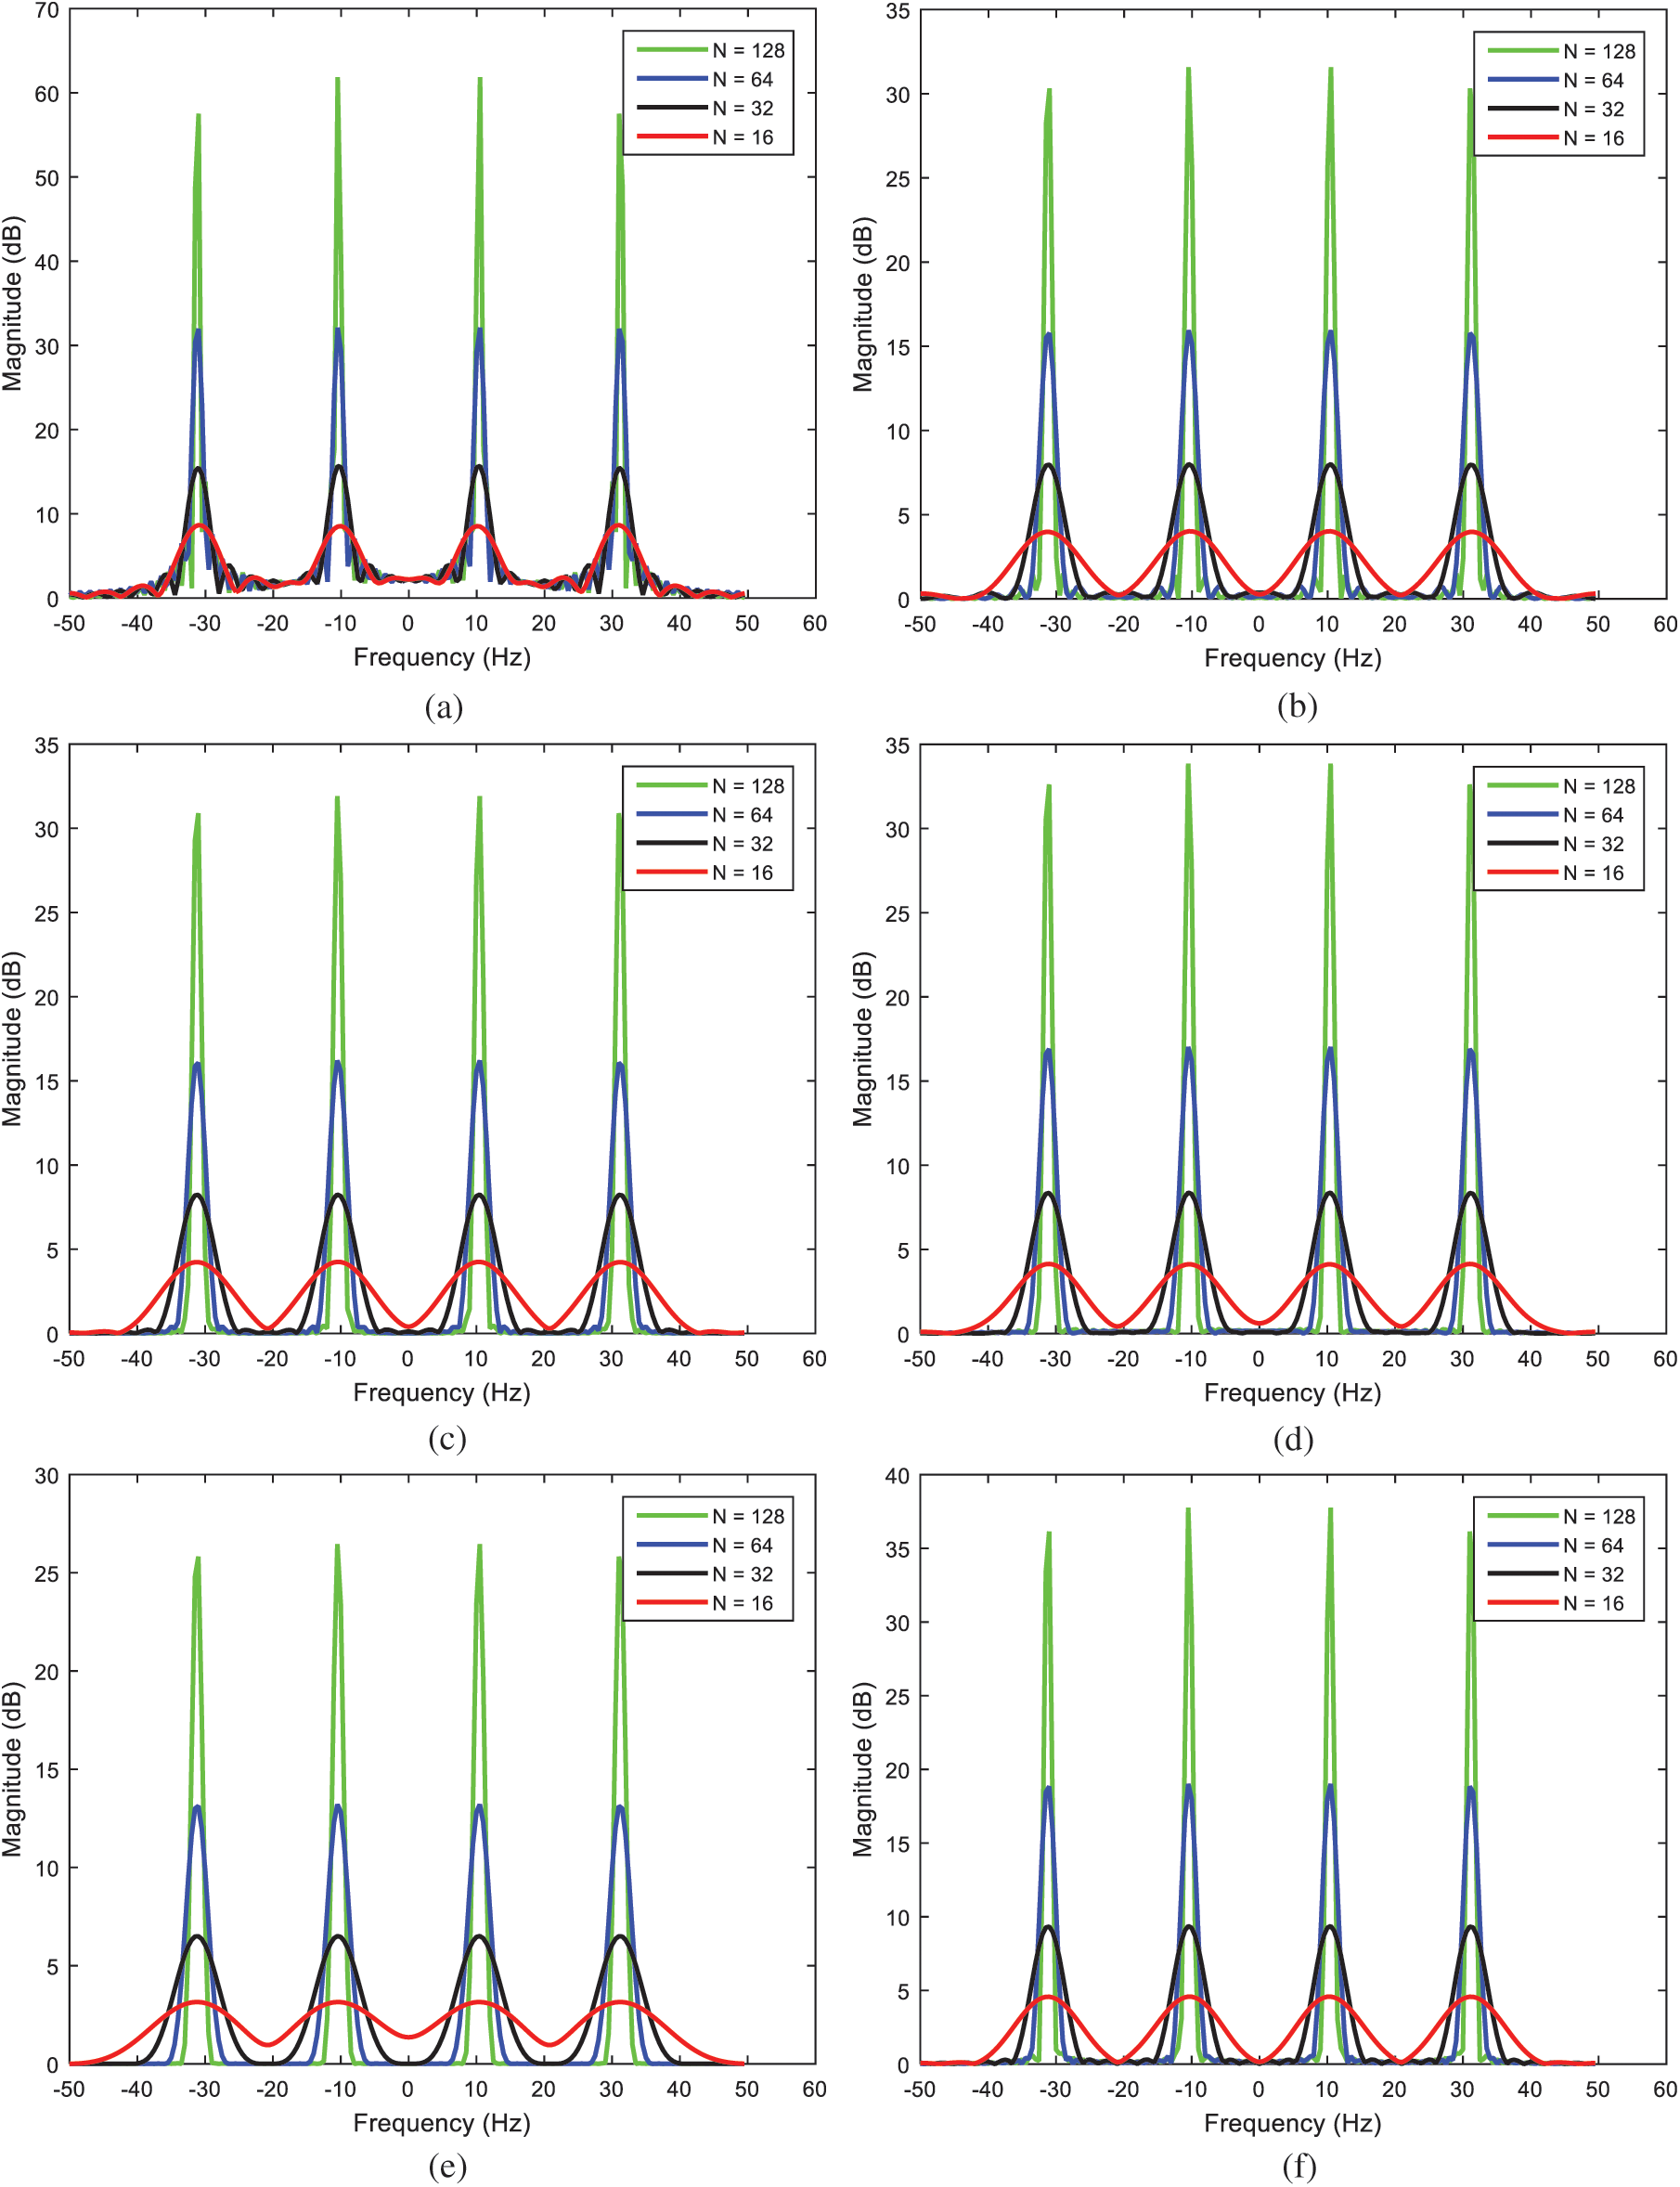
Figure 11: Influence of data length to the PSE resolution (a) rectangular, (b) triangular, (c) Hanning, (d) Hamming, (e) Blackman, (f) Kaiser
6.2 Power Spectrum Estimation Using Welch Method with Various Window Functions
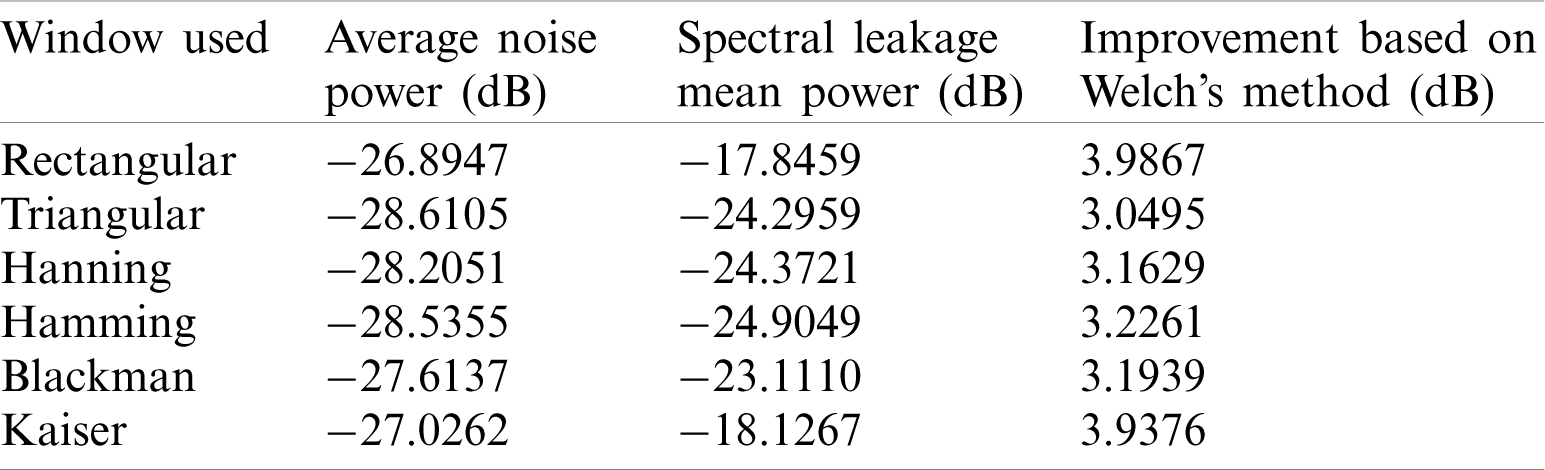
In this subsection, results on PSE utilizing the Welch method with various windows are presented. The simulation employed an input signal composed of three sine waves, with frequencies 250 Hz, 600 Hz, and 1000 Hz, respectively. A Gaussian-white sequence is added into the signal, which has the SNR 10 dB. The sampling frequency is 3000 Hz with the number of sampling points 3000. The data length of FFT is 512. The characteristics of window function are analyzed from spectrum resolution and noise level. Simulation based on the classical periodogram method was carried out and thereafter incorporation of the Welch method into various windows, all with length 512, was performed for PSE. Power spectrum estimation based on the classical periodogram approach is shown as in Fig. 12. Fig. 13 provides the power spectrum magnitude using the Welch method. Tab. 3 summarizes the performance comparison on PSE using various windowing approaches. It can be seen that the Welch’s method reduces noise in the estimated power spectra at the expense of frequency resolution reduction. The periodogram technique based on the Welch method is capable of providing good resolution if data length samples are appropriately selected.
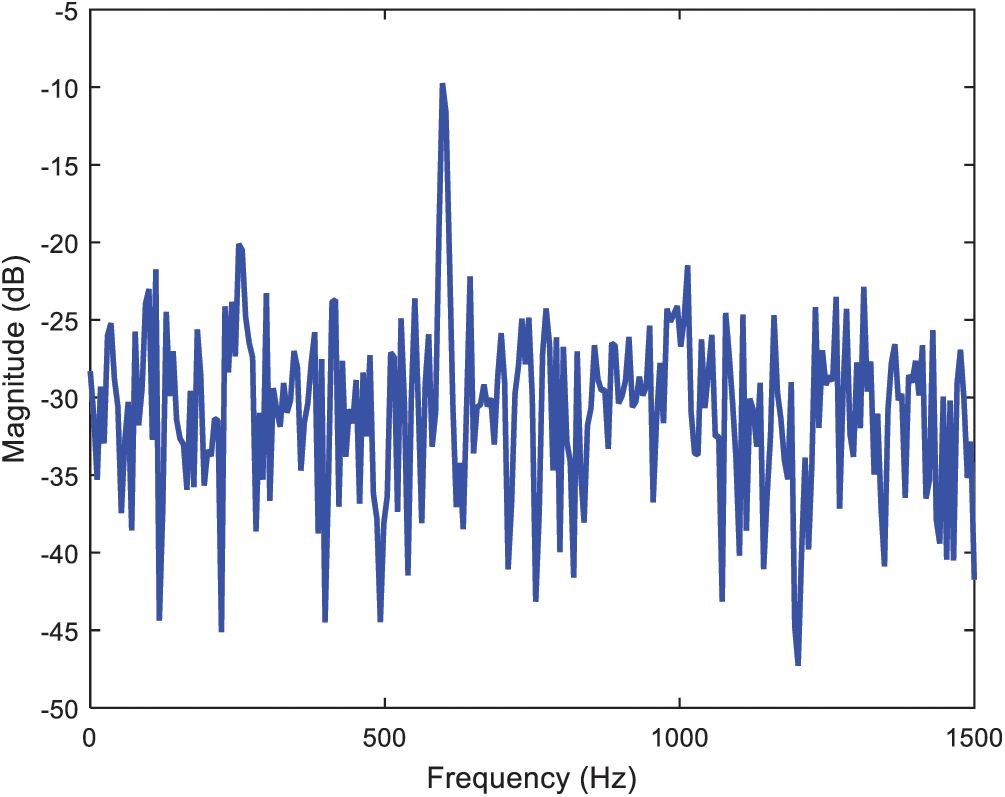
Figure 12: Power spectrum estimation based on the periodogram approach
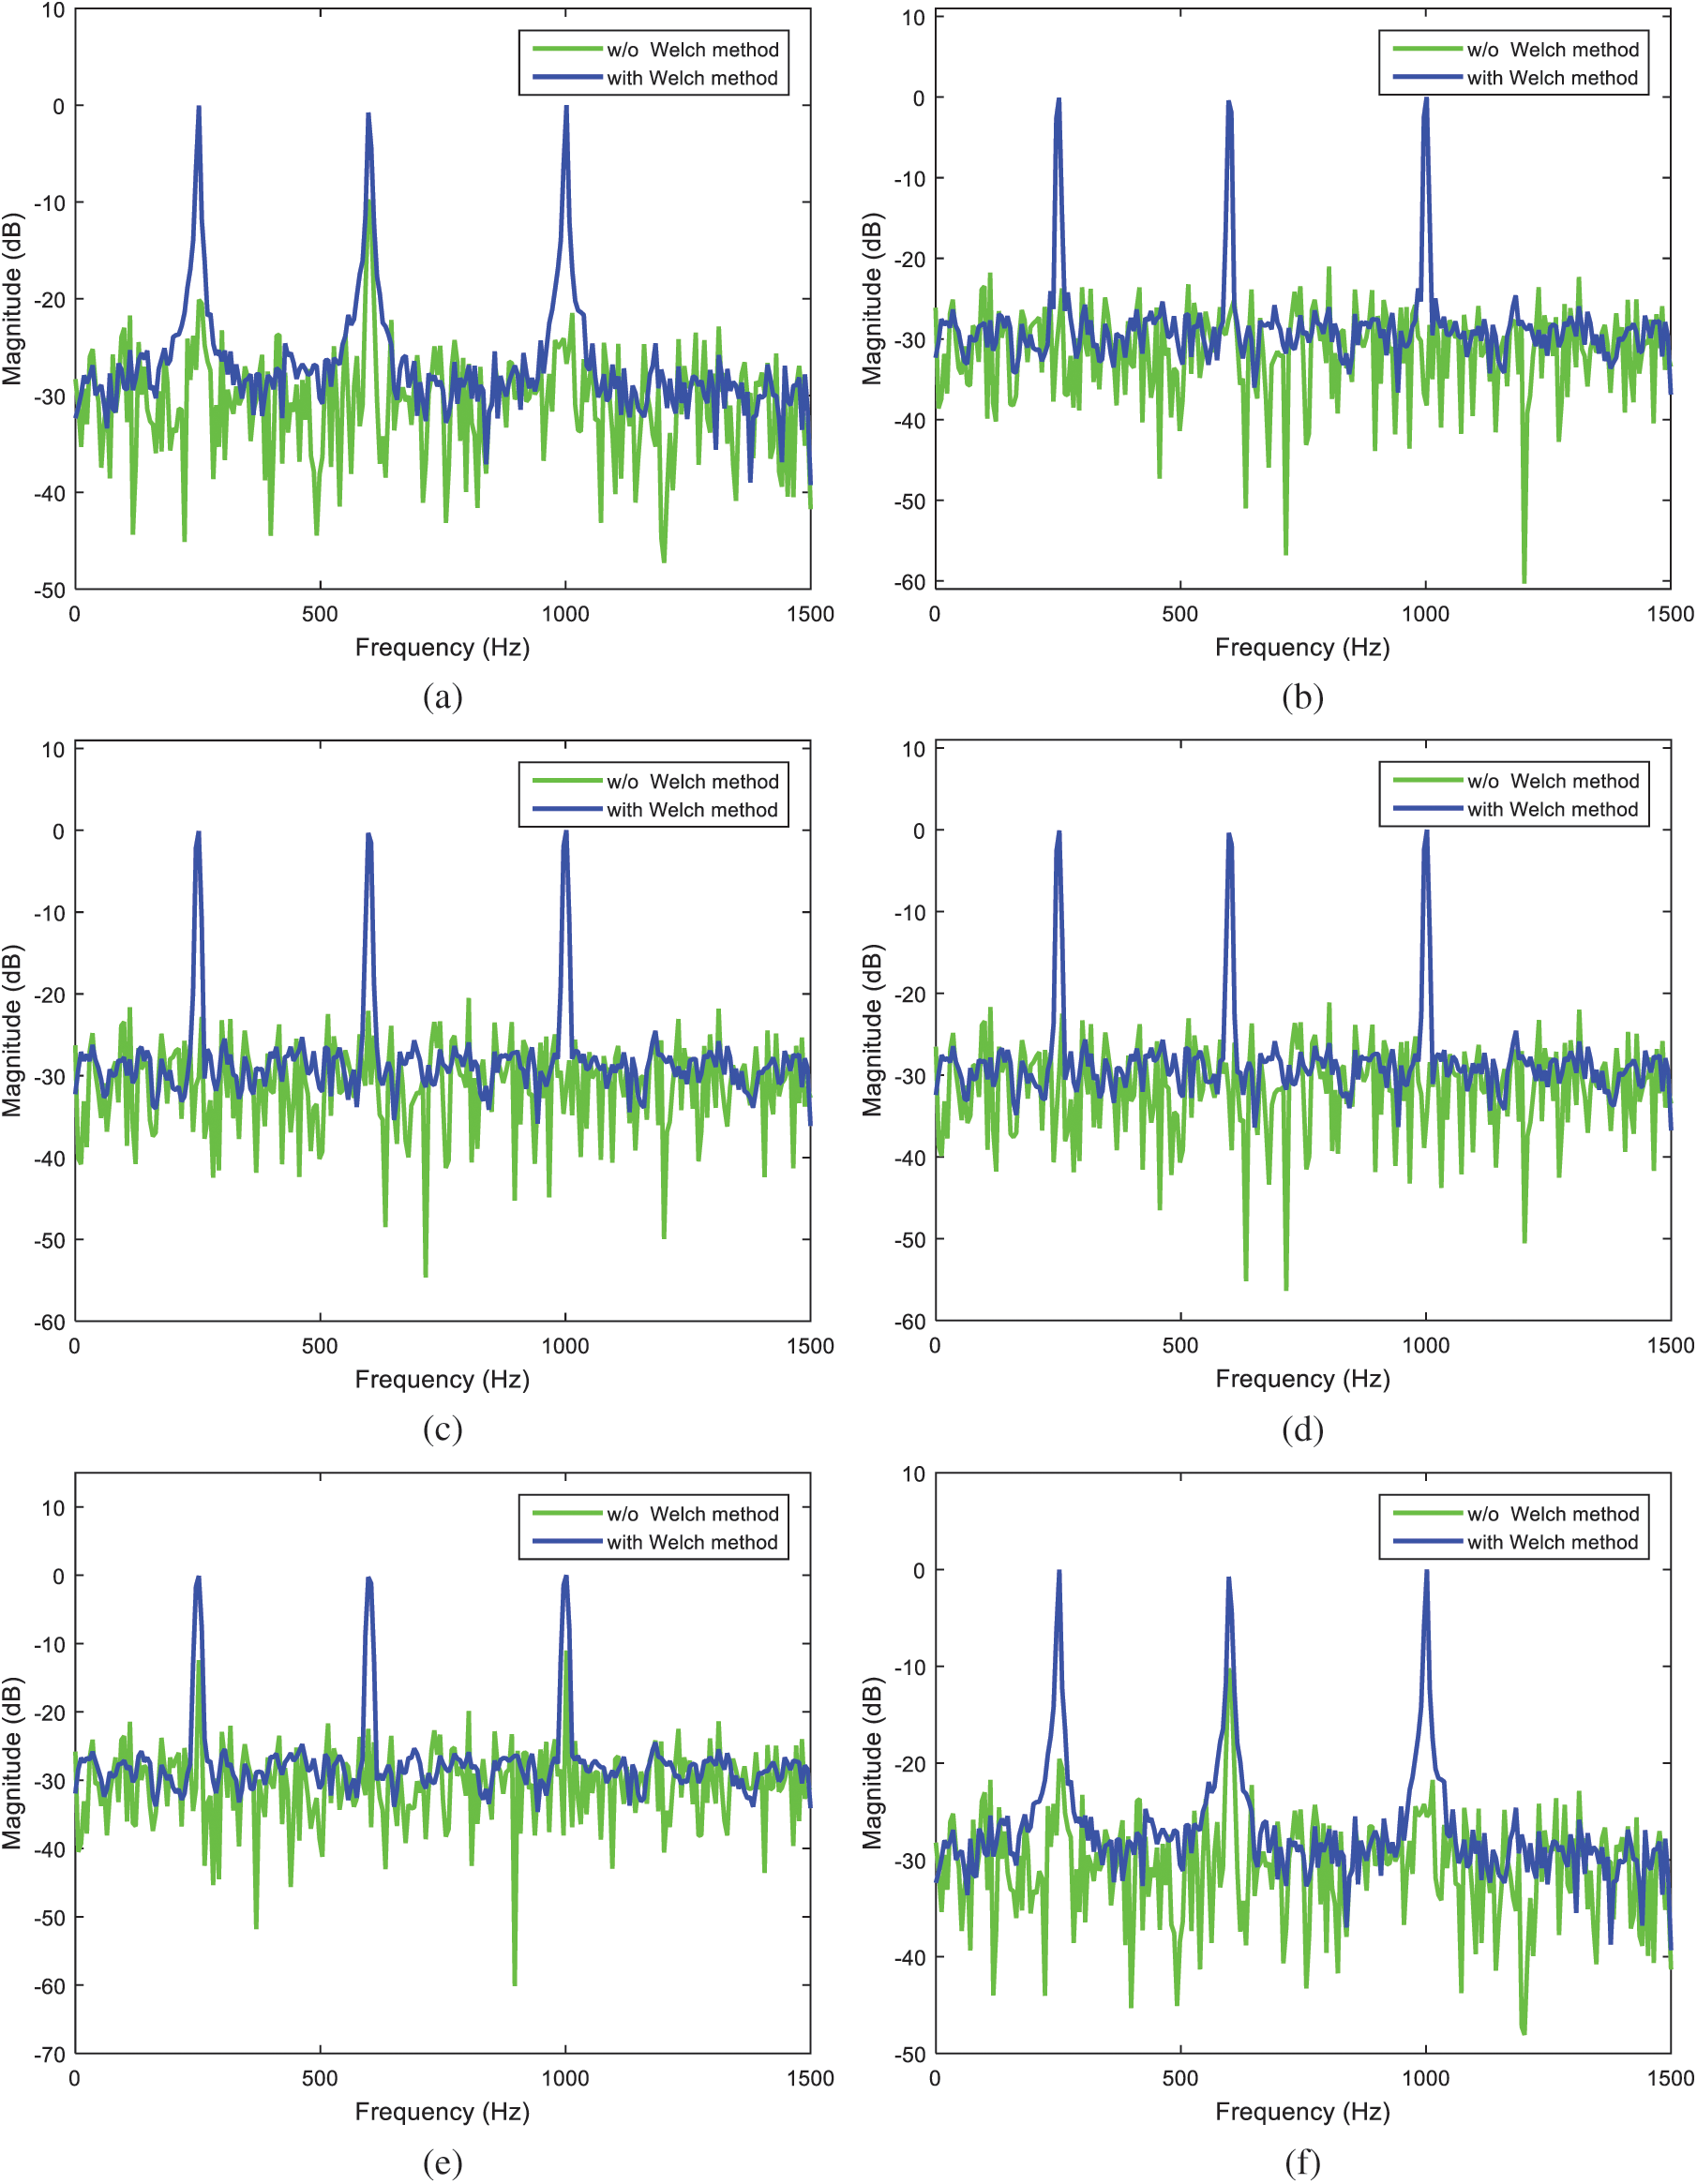
Figure 13: Power spectrum magnitude using Welch method with various window functions (a) rectangular, (b) triangular, (c) Hanning, (d) Hamming, (e) Blackman, (f) Kaiser
Table 3: Comparison of power spectral estimation using various windowing approaches
This paper deals with the design of FIR digital filter using various window techniques to extract the unwanted noise from the signal. Profound insight has been provided in the statistical properties of the Welch power spectrum estimator. The effect of data length on power spectral density by the assistant of Welch method in various window functions is shown. Different parameters can be adjusted to meet the specific engineering requirements in the FIR filter design process on the basis of the desired filter characteristics. According to the kind of signal being analyzed a specific window function should be selected. How the spectral leakage is reduced using various window techniques is also involved. The effect of leakage and the role of windowing techniques to show the frequency domain measurements are interpreted. The various windows involved aim at satisfying two conflicting requirements: simplicity of implementation, comparable to that of window-based design methods and accuracy in the fulfillment of design requirements. The ideal window is expected to minimize the maximum nearest side lobes. The quality of the estimate is increased as the length N of the data is increased. A good resolution in PSE may be achieved by using appropriate size of data sample. The rectangular window has the narrower main-lobe width in frequency domain. Various window techniques are employed in this paper, including the rectangular, triangular, Hanning, Hamming, Blackman and Kaiser windows. Each window has its own unique advantages and disadvantages.
Investigation of the spectrum leakage suppression had also been carried out. The performance of DFT method inherently suffers from the spectral leakage, which is caused by the non-coherent sampling in the practical acquisition system. Estimation of the power spectrum was performed using various window functions with the Welch method involved. The superiority on spectrum leakage suppression algorithm was verified by comparing with the traditional spectrum analysis based on the DFT with windowing processing. The Welch algorithm splits the random signal into segments before DFT to reduce the spectral leakage, which uses a modified version of Bartlett method in which the portion of the series contributing to each periodogram are allowed to overlap. The PSE has been performed for variable data length using various windows with the Welch method, which enhances the performance in terms of both resolution and variance. The Welch method is used to find the PSD of a signal with reducing the effect of noise where it can be seen that the clear peak shows in the graph of the PSE. The Welch method enables the performance enhancement on PSE of the power spectral density for signals with less distortion caused by noise.
Funding Statement: This work has been partially supported by the Ministry of Science and Technology, Taiwan [Grant Numbers MOST 104-2221-E-019-026-MY2 and MOST 108-2221-E-019-013].
Conflicts of Interest: The authors declare that they have no conflicts of interest to report regarding the present study.
1. C. L. Phillips, J. M. Parr and E. A. Riskin. (2014). Signals, Systems, and Transforms. Upper Saddle River, NJ, USA: Pearson Education Limited. [Google Scholar]
2. S. S. Soliman and M. D. Srinath. (1997). Continuous and Discrete Signals and Systems. Upper Saddle River, NJ, USA: Prentice Hall. [Google Scholar]
3. R. E. Ziemer, W. H. Tranter and S. R. Fannin. (1998). Signals and System, Continuous and Discrete. Upper Saddle River, NJ, USA: Prentice Hall. [Google Scholar]
4. J. G. Proakis and D. G. Manolakis. (1996). Digital Signal Processing: Principles, Algorithms and Applications. Upper Saddle River, NJ, USA: Prentice-Hall. [Google Scholar]
5. A. V. Oppenheim and R. W. Schafer. (1975). Digital signal processing. Englewood Cliffs, NJ, USA: Prentice-Hall, pp. 548–554. [Google Scholar]
6. Z. Wang, Q. Wang, F. Li and S. Wang. (2020). “High resolution SAR image algorithm with sample length constraints for the range direction,” Computers Materials & Continua, vol. 63, no. 3, pp. 1533–15432. [Google Scholar]
7. B. Thakur and R. Mehra. (2016). “Discrete Fourier transform analysis with different window techniques algorithm,” International Journal of Computer Applications, vol. 135, no. 12, pp. 17–20. [Google Scholar]
8. S. Rapuano and F. J. Harris. (2007). “An introduction to FFT and time domain windows, Part 11 in a series of tutorials in instrumentation and measurement,” IEEE Instrumentation & Measurement Magazine, vol. 8, no. 7, pp. 32–44. [Google Scholar]
9. R. Patel, E. M. Kumar, A. K. Jaiswal and E. R. Saxena. (2013). “Design technique of bandpass FIR filter using various window function,” IOSR Journal of Electronics and Communication Engineering, vol. 6, no. 6, pp. 52–57. [Google Scholar]
10. P. Wickramarachi. (2003). “Effects of windowing on the spectral content of a signal,” Sound and Vibration, vol. 37, no. 1, pp. 10–11. [Google Scholar]
11. R. P. Narwaria and M. Kumar. (2018). “Comparison of FIR filter using different window functions,” International Research Journal of Engineering and Technology, vol. 5, no. 10, pp. 634–637. [Google Scholar]
12. K. Sahu, A. Gavel and P. K. Rahi. (2017). “Design of low pass FIR filter using rectangular, Hanning and Kaiser window techniques,” International Journal of Research in Applied Science & Engineering Technology, vol. 5, no. II, pp. 326–340. [Google Scholar]
13. P. Singh and K. Raj. (2017). “Analysis of quantised digital FIR filter using different windowing techniques,” International Journal of Advanced Research in Science, Engineering and Technology, vol. 4, no. 10, pp. 4785–4795. [Google Scholar]
14. M. Iqbal, N. Muslim, H. Ahamd and F. Ullah. (2015). “Analysis and design of FIR filters using window function in Matlab,” International Journal of Computer Engineering and Information Technology, vol. 3, no. 1, pp. 42–47. [Google Scholar]
15. Q. Wang, X. Yan and Y. Ren. (2017). “Spectrum leakage suppression for multi-frequency signal based on DFT,” in Proc. IEEE 13th Int. Conf. on Electronic Measurement & Instruments, Yangzhou, China, pp. 394–399. [Google Scholar]
16. D. Lyon. (2009). “The discrete Fourier transform, part 4: Spectral leakage,” Journal of Object Technology, vol. 8, no. 7, pp. 23–34. [Google Scholar]
17. P. D. Welch. (1967). “The use of fast Fourier transform for the estimation of power spectra: A method based on time averaging over short, modified periodograms,” IEEE Transactions on Audio and Electroacoustics, vol. 15, no. 2, pp. 70–73. [Google Scholar]
18. H. R. Gupta and R. Mehra. (2013). “Power spectrum estimation using Welch method for various window techniques,” International Journal of Scientific Research Engineering & Technology, vol. 2, no. 6, pp. 389–392. [Google Scholar]
 | This work is licensed under a Creative Commons Attribution 4.0 International License, which permits unrestricted use, distribution, and reproduction in any medium, provided the original work is properly cited. |