DOI:10.32604/cmc.2021.014918
| Computers, Materials & Continua DOI:10.32604/cmc.2021.014918 | |
| Article |
Time Series Facebook Prophet Model and Python for COVID-19 Outbreak Prediction
1Department of Information Systems and Technology, Collage of Computer Science and Engineering, University of Jeddah, Jeddah, 23218, Saudi Arabia
2Department of Computer and Network Engineering, Collage of Computer Science and Engineering, University of Jeddah, Jeddah, 23218, Saudi Arabia and University of Tunis, Elmanar, Tunisia
*Corresponding Author: Mashael Khayyat. Email: mkhayyat@uj.edu.sa
Received: 27 October 2020; Accepted: 06 January 2021
Abstract: COVID-19 comes from a large family of viruses identified in 1965; to date, seven groups have been recorded which have been found to affect humans. In the healthcare industry, there is much evidence that Al or machine learning algorithms can provide effective models that solve problems in order to predict confirmed cases, recovered cases, and deaths. Many researchers and scientists in the field of machine learning are also involved in solving this dilemma, seeking to understand the patterns and characteristics of virus attacks, so scientists may make the right decisions and take specific actions. Furthermore, many models have been considered to predict the Coronavirus outbreak, such as the retro prediction model, pandemic Kaplan’s model, and the neural forecasting model. Other research has used the time series-dependent face book prophet model for COVID-19 prediction in India’s various countries. Thus, we proposed a prediction and analysis model to predict COVID-19 in Saudi Arabia. The time series dependent face book prophet model is used to fit the data and provide future predictions. This study aimed to determine the pandemic prediction of COVID-19 in Saudi Arabia, using the Time Series Analysis to observe and predict the coronavirus pandemic’s spread daily or weekly. We found that the proposed model has a low ability to forecast the recovered cases of the COVID-19 dataset. In contrast, the proposed model of death cases has a high ability to forecast the COVID-19 dataset. Finally, obtaining more data could empower the model for further validation.
Keywords: COVID-19; time series analysis; prediction; face book prophet model; python
COVID-19 comes from a large family of viruses identified in 1965; to date, seven groups have been recorded which have been found to affect humans. These viruses have three genotypes, which are alpha, beta, and gamma. They are considered zoonotic diseases because the natural reservoirs of these diseases are mammals and birds [1,2]. In 2002 and 2003, severe acute respiratory syndrome (SARS) led to epidemics [2]. Also, the Middle East respiratory syndrome (MERS) caused an pandemic in Saudi Arabia in 2012 [3]; and more recently, the newest variant Coronavirus Disease-2019 (COVID-19) has led to the recent pandemic in Saudi Arabia and across the world [4]. COVID-19 causes a direct and indirect transmission of respiratory diseases with a wide range of symptoms, including cold symptoms, respiratory/fever symptoms, cough, shortness of breath, kidney failure, and even death [5]. In the healthcare industry, there is much evidence that Al or machine learning algorithms can provide effective models that solve problems in order to predict confirmed cases, recovered cases and deaths. Many researchers and scientists in the field of machine learning are also involved in solving this dilemma, seeking to understand the patterns and characteristics of virus attacks, so scientists may make the right decisions and take specific actions [6]. Furthermore, many models have been considered to predict the Coronavirus outbreak such as the retro prediction model, pandemic Kaplan’s model and the neural forecasting model [7]. Other research has used the time series-dependent face book prophet Model for COVID-19 prediction in various countries such as India [8,9]. Thus, we proposed a prediction and analysis model to predict the COVID-19 in Saudi Arabia, the time series dependent face book prophet Model is used to fit the data and provide future predictions. We used FB Prophet Model to forecast for the coming days based on confirmed, recovered and death data, and observe COVID 19 separately: daily, weekly and seasonally.
Predication of the COVID-19 pandemic is attracting the attention of many researchers in diverse fields globally. For example, in China, researchers [10] have attempted to generate the pandemic curve, gathered data about population migration pre-and post-23rd January and the most updated COVID-19 epidemiological data. Then, they put the gathered data into the Susceptible-Exposed-Infectious-Removed (SEIR) model so that they can see the pandemic curve. Furthermore, to predict the pandemic, they used an artificial intelligence (AI) approach, trained on the old data (2003 SARS); in their method, a daily base epidemiological data of the COVID-19 was retrieved from the National Health Commission of China. The migration index is based on a web-based program. Then they obtained time series data by setting the sequence length time sliding window step. Using time slice data, the Long-Short-Term-Memory (LSTM) model was used as input for training, looping the training 500 times, and saving the trained LSTM model. The number of new cases was entered into the trained LSTM model to obtain a national forecast for new cases. Moreover, other research [11] confirmed that the SEIR system can be used to simulate the infectious-disease spread. However, in [12] the researchers declared that even though there are many models to predict the pandemic, these prediction models have shown a wide range of variations. This, reflects that predictions using more complex models may not be more reliable than using a simpler model, and non-identifiability in model calibrations using the confirmed-case data is the main reason for such wide variations [12]. Using the Akaike Information Criterion (AIC) for model selection, it has been shown that the SIR model performs much better than an SEIR model representing the confirmed-case data’s information. Furthermore, in [11] research highlights that the outbreak spreads are largely influenced by each country’s policy and degree of social responsibility. In the next section, this research methodology will be explained.
This paper will present the methodology and simulation results, and end with the conclusion.
Prediction has to go through a variety of phases. Fig. 1 shows the prediction Tools that have been used in this paper.

Figure 1: Prediction tools in this paper
In order to predict Coronavirus disease (COIVD-19) we will use the Time Series Analysis using face book prophet Model [13] which is an open-source library developed by Facebook, designed for making forecasts for time series datasets and using forecasting tools available in Python. This enables us to observe and predict the spread of the coronavirus pandemic on a daily or weekly basis [13]. We conducted the first steps of data analysis by reading the dataset and cleaning the dataset of missing values and outliers. Thus, for making the analysis and prediction in our work the six python libraries are ‘numpy,’ ‘Pandas,’ ‘Matplotlib,’ ‘Datetime,’ ‘sklearn.metrics’ and ‘prophet.’ Furthermore, we use Kaggle environment1 because it allows users to find and publish data sets, explore and build models in a web-based data-science environment, work with other data scientists and machine learning engineers, and enter competitions to solve data science challenges. Thus, we used Kaggle for the overall analysis. The basic steps involved in prediction process are (see Fig. 2).

Figure 2: Prediction process diagram
Analyzing the data of the confirmed, recovered, and death cases in Saudi Arabia, the total number of confirmed cases in the dataset had totaled 36,827, the number of recovered cases totaled 28487 and the number of death cases totaled 3167 for Saudi Arabia as a whole as shown in Tab. 1.
Table 1: Number of COVID-19 cases in Saudi Arabia

Fig. 3 depicts the number of Daily Cases: inactive, confirmed, recovered and death cases are shown. The number of active cases is calculated by removing deaths and recoveries from total cases, from which we get “currently infected cases.” Fig. 3 shows the number active cases has significantly changed from May to August with a noted decrease, confirmed, recovered and death cases change relatively daily.

Figure 3: Visualizing of Saudi Arabia COVID-19 cases
We have used the tail function to return the last 5 rows of confirmed cases in the dataset and to get the results in Tab. 2 that show the Confirmed Cases.
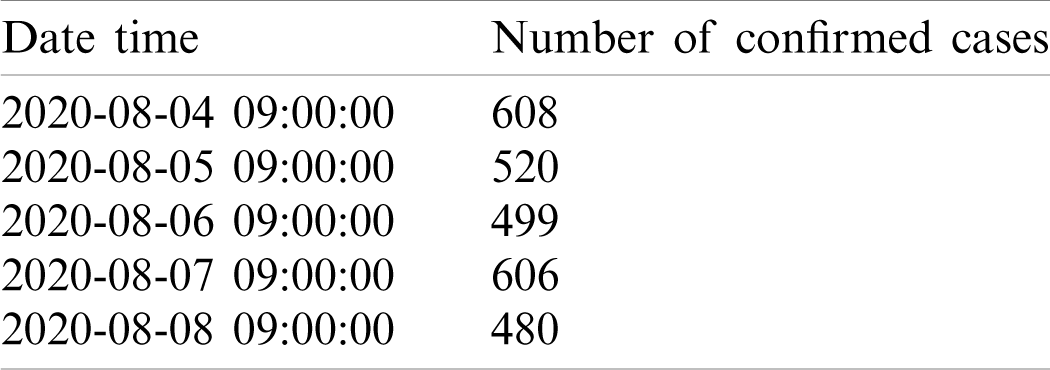
As shown in Tab. 2, the number of confirmed cases in the dataset that cover a period of five days (from August 04-2020 to August 08-2020). Furthermore, to obtain more results for forecasting time series a forecasting approach used.
The prediction function used to predict confirmed cases of COVID-19; we adopted the time series forecasting approach and predicted the number of confirmed cases in the coming days. The forecasting for September and the beginning of October 2020. Tab. 3 shows the forecasting of confirmed cases of COVID-19 starting from 26-09-2020 until to 30-09-2020 in Saudi Arabia, Tab. 4 shows the forecasting of confirmed cases for the coming days slightly lower than the actual values based on the adopted approach.
Table 3: Forecasting of confirmed cases in September using time series forecasting approach

Table 4: Forecasting of confirmed cases in October using time series forecasting approach

Tab. 4 shows the forecasting of confirmed cases of COVID-19 and starting from 1-10-2020 until 05-10-2020 the predicted values in Saudi Arabia. Tab. 3 shows forecasting of confirmed cases for the coming days with the cases are increasing and decreasing of the starting of October and the cases increasing of 4 & 5 October 2020. The predicted values are slightly lower than the Actual values.
Fig. 4 shows that at the end of March there was a decrease in the number of cases; Prophet plotted the observed values of our time series (the black dots) and the forecasted values (blue line) from March 2020 until October 2020.

Figure 4: Prediction of confirmed cases for coming days
Fig. 5 shows the weekly analysis of confirmed cases of COVID-19, the weekly analysis shows a decrease on Thursday and Saturday, and an increase on Friday.

Figure 5: The weekly analysis of confirmed cases
As can be seen in Fig. 6, the orange line represents predicted values and the blue line is for the actual values. The plot shows an upward or a downward direction for represents confirmed cases, and this shows that the predicted and actual values appear to be reasonably convergent. In Tab. 5, R-squared, mean square error (MSE), mean absolute error (MAE) are used to evaluate the performance of the model. The study results show the model as below.
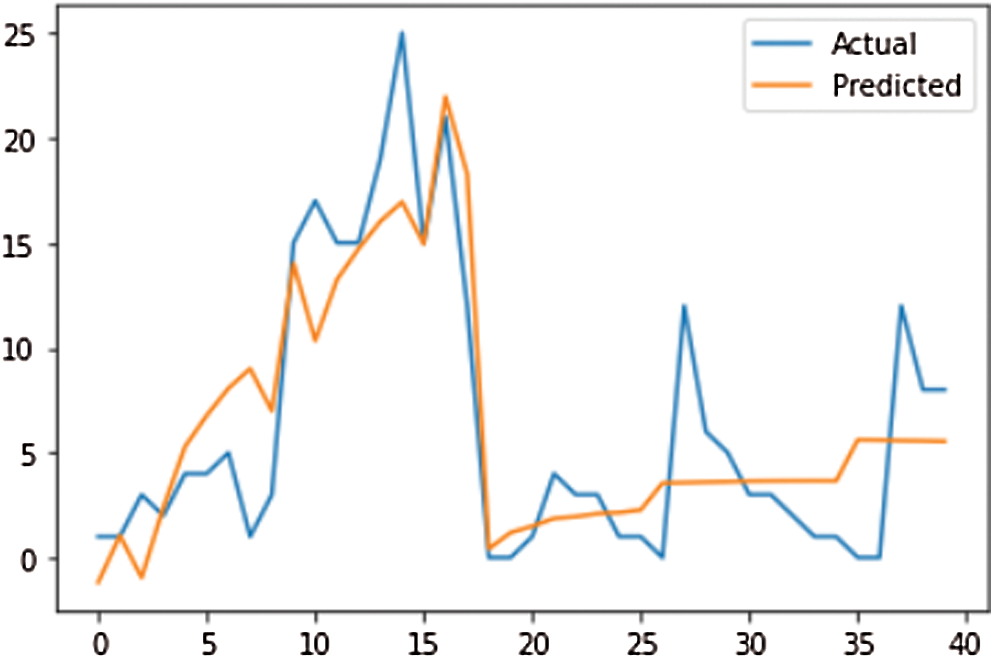
Figure 6: Comparison between actual and predicted value

The R-squared value of 0.71 is good, the MSE value of 12.96 is large and the MAE value of 2.72, for the metrics MSE and MAE the values closer to zero is better.
The tail function has been used to return the last 5 rows of recovered cases in the dataset and to get the results in Tab. 6 that show the Recovered Cases:
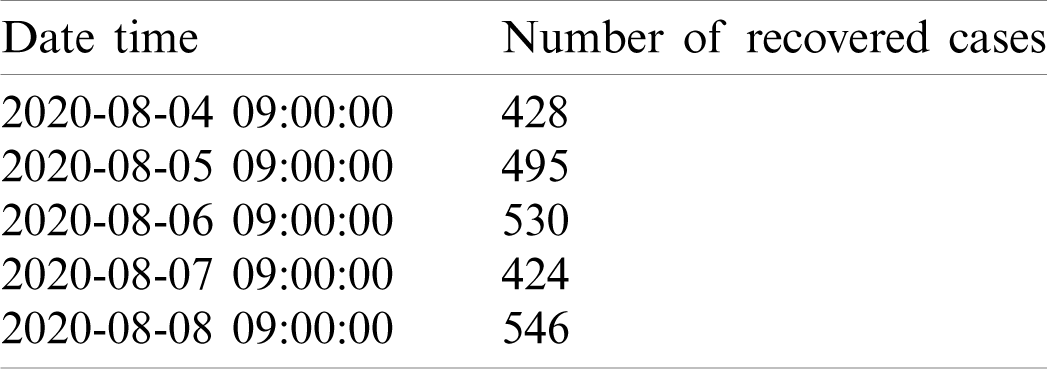
Tab. 6 shows number of recovered cases in the dataset from August 04-2020 to August 08-2020.
And for predict recovered cases of COVID-19, we adopt the time series forecasting approach and we utilize it to predict the number of recovered cases in the coming days. The forecasting for September and the beginning of October 2020. Tab. 5 shows the forecasting of recovered cases of COVID-19 starting from 26-09-2020 until to 30-09-2020 in Saudi Arabia. Tab. 7 shows the forecasting of recovered cases for the coming days is much less than the actual values.
Table 7: Forecasting of recovered cases in September

Tab. 8 shows the forecasting of confirmed cases of COVID-19 starting from 1-10-2020 until 05-10-2020 with the predicted values of confirmed cases in Saudi Arabia. Tab. 8 shows the forecasting of confirmed cases for the coming days predicting that cases are increasing in October 2020.
Table 8: Forecasting of recovered cases in October
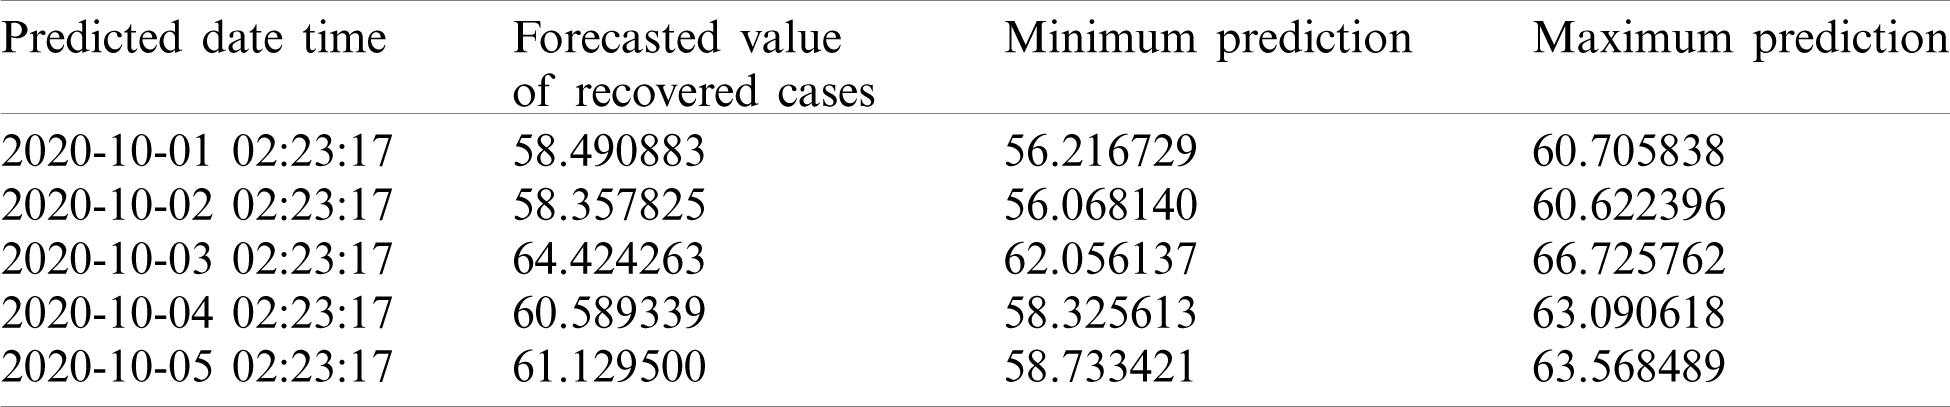
Also, for predict recovered cases of COVID-19, we undertake a time series forecasting approach and predict the number of recovered cases in the coming days. We considered the period for September and October 2020. Fig. 7 shows the number of recovered cases is increasing every day.

Figure 7: Prediction of recovered cases for coming days
Fig. 8 indicate weekly analysis of recovered cases the weekly analysis was reduced on Friday and grew on Saturday significantly. On the remaining days it was increasingly and decreasingly converging.

Figure 8: The weekly analysis of recovered cases
As we can see in Fig. 9, the orange line represents predicted values and the blue line shows the actual values. The plot shows an upward or a downward direction representing recovered cases. The predicted and actual value appear to be very convergent. The R-squared, mean square error (MSE), mean absolute error (MAE) are used in Tab. 9 to evaluate the performance of the model. The study results show the model as below.

Figure 9: Comparison between actual and predicted value of recovered cases
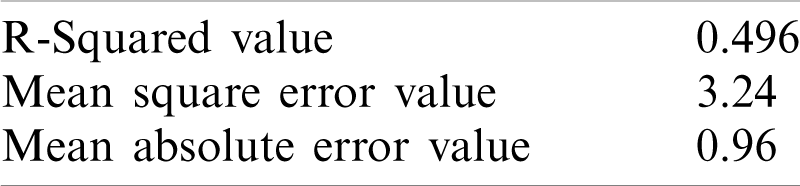
An R-squared value of 0.49, the MSE value of 3.24 and the MAE value of 0.96, for an r-squared the values closer to one is better and for the MSE and MAE the values closer to zero is better.
We have used tail function to returns the last 5 rows of death cases in the dataset and to get the results in Tab. 10 that show the Death Cases.
Tab. 10 shows the number of death cases in the dataset from August 04-2020 to August 08-2020.

For predict death cases of COVID-19, we adopt the time series forecasting approach to predict the number of deaths cases in the coming days. The forecasting for September and the beginning of October 2020. Tab. 8 shows the forecasting of recovered cases of COVID-19 starting from 26-09-2020 until 30-09-2020 with the predicted values of recovered cases in Saudi Arabia. Tab. 11 shows no forecasted COVID-19 deaths for the coming days.
Table 11: Forecasting of death cases in September

Tab. 12 shows the forecasting of death cases of COVID-19 starting from 1-10-2020 until 05-10-2020 in Saudi Arabia.
Table 12: Forecasting of death cases in October

As you can see in the Fig. 10, the real values of our time series (the black dots) and the forecasted values (the blue line), are not shown either in an upward or a downward direction. Instead, it’s just a straight line, which forecasts no death cases for the coming days.

Figure 10: Prediction of death cases for coming days
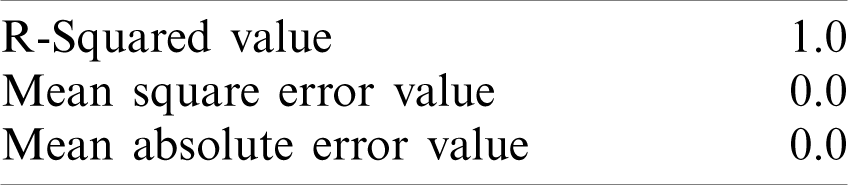
As we can see in Fig. 11, the orange line represents predicted values and the blue line is for the actual values. There is only the orange line, this is the period that we do not have the actual data, which was built based on the blue line data, is forecasting these values. As we mentioned above about the R-squared, mean square error (MSE), mean absolute error (MAE) to evaluate the performance of the model. Thus, for the metrics MSE and MAE the values closer to zero indicate the best performance of the evaluated model. For the metric R2, the best performance is observed when the values are close to one. The study results of the model are shown below in Tab. 13.
The R-squared value of 1, the MSE and the MAE value of 0 are amazing at all.

Figure 11: Comparison between actual and predicted value of death cases
The world is under the grasp of the COVID-19 virus, which has affected human lives worldwide. Thus, early prediction of the coronavirus’s spread can facilitate the planning of necessary actions from the government and people. In this work, we have shown the prediction of COVID-19 by using a time series data technique based on the currently proposed dataset to analyze the outbreak data of the COVID-19 virus. This paper proposed the utilization of a data analysis approach for pandemic prediction. Results show that the proposed model has a low ability to forecast the recovered cases of the COVID-19 dataset. In contrast, the proposed model of death cases has a high ability to forecast the COVID-19 dataset. This confirms that prediction is not an easy journey for researchers and relies on the accuracy of the data sources and the data flow. This research’s constraints and limitations are that data was not guaranteed to be accurate, and it wasn’t easy to get advance-related works due to the recent nature of COVID-19 related data. So, related sources were limited. Further research needs to be conducted to utilize different methods for further comparison.
Funding Statement: The author(s) received no specific funding for this study.
Conflicts of Interest: The authors declare that they have no conflicts of interest to report regarding the present study.
1. R. M. Anderson, C. Fraser, A. C. Ghani, C. A. Donnelly, S. Riley et al. (2004). , “Epidemiology, transmission dynamics and control of SARS: The 2002–2003 epidemic,” Philosophical Transactions of the Royal Society of London. Series B: Biological Sciences, vol. 359, no. 1447, pp. 1091–1105. [Google Scholar]
2. N. C. Peeri, N. Shrestha, M. S. Rahman, R. Zaki, Z. Tan et al. (2020). , “The SARS, MERS and novel coronavirus (COVID-19) epidemics, the newest and biggest global health threats: What lessons have we learned?,” International Journal of Eepidemiology, vol. 49, no. 3, pp. 717–726. [Google Scholar]
3. K. Mobaraki and J. Ahmadzadeh. (2019). “Current epidemiological status of middle east respiratory syndrome coronavirus in the world from 1.1. 2017 to 17.1.2018: A cross-sectional study,” BMC Infectious Diseases, vol. 19, no. 1, pp. 1–5. [Google Scholar]
4. A. A. Algaissi, N. K. Alharbi, M. Hassanain and A. M. Hashem. (2020). “Preparedness and response to Covid-19 in Saudi Arabia: Building on mers experience,” Journal of Infection and Public Health, vol. 13, no. 6, pp. 834–838. [Google Scholar]
5. Y. Liu, L. M. Yan, L. Wan, T. X. Xiang and A. Le. (2020). “Viral dynamics in mild and severe cases of Covid-19,” Lancet Infectious Diseases, vol. 20, no. 6, pp. 656–657. [Google Scholar]
6. V. Chaurasia and S. Pal. (2020). “Covid-19 pandemic: Application of machine learning time series analysis for prediction of human future,” SSRN, vol. 1, no. 1, pp. 1–10. [Google Scholar]
7. G. R. Shinde, A. B. Kalamkar, P. N. Mahalle, N. Dey, J. Chaki et al. (2020). , “Forecasting models for coronavirus disease (covid-19A survey of the state-of-the-art,” SN Computer Science, vol. 1, no. 4, pp. 1–15. [Google Scholar]
8. M. Indhuja and P. P. Sindhuja. (2020). “Prediction of covid-19 cases in India using prophet,” International Journal of Statistics and Applied Mathematics, vol. 5, no. 4, pp. 103–106. [Google Scholar]
9. D. Saha, D. Ghosh, P. Ganguly, A. Banerjee and M. Gangopadhyaya. (2020). “Covid-19 containment measure analysis of global & Indian data with predictive model comparison,” Researchsquare, vol. 1, no. 1, pp. 1–16. [Google Scholar]
10. Z. Yang, Z. Zeng, K. Wang, S. S. Wong, W. Liang et al. (2020). , “Modified SEIR and AI prediction of the epidemics trend of Covid-19 in China under public health interventions,” Journal of Thoracic Disease, vol. 12, no. 3, pp. 165–174. [Google Scholar]
11. B. Hamzah, C. Lau, H. Nazri, D. V. Ligot, G. Lee et al. (2020). , “CoronaTracker: Worldwide Covid-19 outbreak data analysis and prediction,” Bull World Health Organ, vol. 1, no. 1, pp. 1– 32. [Google Scholar]
12. W. C. Roda, M. B. Varughese, D. Han and M. Y. Li. (2020). “Why is it difficult to accurately predict the Covid-19 epidemic?,” Infectious Disease Modelling, vol. 5, no. 1, pp. 271–281. [Google Scholar]
13. S. J. Taylor and B. Letham. (2017). “Prophet: Forecasting at scale,” American Statistician, vol. 72, no. 1, pp. 37– 45. [Google Scholar]
 | This work is licensed under a Creative Commons Attribution 4.0 International License, which permits unrestricted use, distribution, and reproduction in any medium, provided the original work is properly cited. |