DOI:10.32604/cmc.2021.015041
| Computers, Materials & Continua DOI:10.32604/cmc.2021.015041 | |
| Article |
Identification of Antimicrobial Peptides Using Chou’s 5 Step Rule
1Department of Information Technology, Faculty of Computing and Information Technology, King Abdulaziz University, Rabigh, 21911, Saudi Arabia
2Department of Computer Science, School of Systems and Technology, University of Management and Technology, Lahore, Pakistan
*Corresponding Author: Yaser Daanial Khan. Email: yaser.khan@umt.edu.pk
Received: 03 November 2020; Accepted: 05 January 2021
Abstract: With the advancement in cellular biology, the use of antimicrobial peptides (AMPs) against many drug-resistant pathogens has increased. AMPs have a broad range of activity and can work as antibacterial, antifungal, antiviral, and sometimes even as anticancer peptides. The traditional methods of distinguishing AMPs from non-AMPs are based only on wet-lab experiments. Such experiments are both time-consuming and expensive. With the recent development in bioinformatics more and more researchers are contributing their effort to apply computational models to such problems. This study proposes a prediction algorithm for classifying AMPs and distinguishing between AMPs and non-AMPs. The proposed methodology uses machine learning algorithms to predict such sequences. A dataset was formulated based on 1902 samples of AMPs and 3997 samples of non-AMPs. Machine learning algorithms are trained on a fixed number of succinct coefficients retaining sequence and composition information of primary structures. The features are extracted using position relative incidence and statistical moments. System performance is validated via various validation tests including a 10-fold cross-validation approach. An overall accuracy of 95.43% was achieved. A comparison of results with existing methodologies shows that the proposed methodology outperformed existing methodologies in terms of prediction accuracy.
Keywords: Antimicrobial peptides; multidrug-resistant; antiviral; antibacterial; cytokine; classification
Cells are the smallest building blocks among all living beings. The composition of cells forms tissues and organs. The cells themselves are mainly made up of proteins, further proteins are also synthesized within cells based on the genetic code stored within the nucleus. To maintain a healthy balance, living beings require an essential amount of proteins to be present in their body [1]. Proteins or peptides are like chains formed by the composition of simpler amino acids in a certain sequence. A polypeptide chain is depicted in Fig. 1. Nature diversely makes use of proteins, peptides may be used to perform different functions like pathogenic, antimicrobial, antifungal, amphibian-skin, venom, cancer-anticancer, antiviral, immune-inflammatory, and many more.
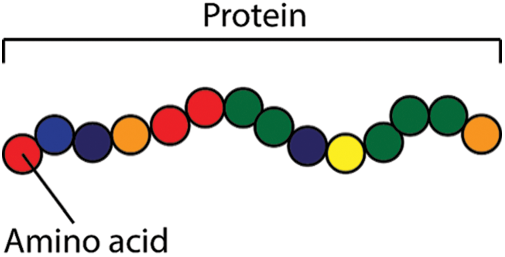
Figure 1: Protein structure
Over the past few years, the use of antibiotics for the cure of infectious diseases has been greatly increased, this increase has affected a broad range of bacterial strains to mutate gradually and become immune to currently available antibiotics. Across the board obstruction of bacterial pathogens to customary antibiotics has incited enthusiasm for the utilization of natural microbial inhibitors, such as antimicrobial peptides. Antimicrobial peptides (AMPs) are a group of host-defense peptides, a vast majority of which are gene-encoded and hatched by living beings of various types. Antimicrobial peptides (AMPs) speak to a huge amount of endogenous compounds broadly conveyed in nature [2]. Antimicrobial peptides (AMPs) are small atomic weight-bearing proteins exhibiting a broad range of antimicrobial activity against bacteria, viruses, and fungi. These peptides seem to have been conserved through the course of evolution. They usually are positively charged and have both hydrophobic and hydrophilic side that enables the molecule to be soluble in aqueous environments yet also enter lipid-rich membranes. Antimicrobial peptides have a broad range of activity and can work as antibacterial, antifungal, antiviral, and sometimes even as anticancer peptides. Antibacterial peptides work differently by exhibiting various properties like antibacterial activity, mitogen activity, or by acting as signaling molecules including pathogen-lytic activities [3]. A lot of work has been done in the field of antibacterial peptides, describing their identification, characterization, and mechanism of action towards understanding their various biotechnological applications. Extensive work has been done to compile these peptides in the form of a database.
Antiviral peptides fight against viruses by preventing viral attachment and providing protection to the host cell from viral infection. These peptides are usually found in nature but can also be produced synthetically. Natural sources for extraction of these peptides can be milk, amphibians such as frog or toad skin, or even multiple types of plants. By studying the behavior of certain viruses, researchers have developed antiviral drugs that stop them from interacting or penetrating host cell membranes. A large number of such antiviral drugs are known that stop the spread of influenza viruses [4].
Another important class of peptides that are known to be effective against fungal pathogens for many years is antifungal peptides [4]. Fungal pathogen has more complex biological structure from viruses and bacteria thus many fungal infections have been linked to large mortality rates in many countries [5]. For this purpose, a large number of antifungal peptides have been discovered or developed to fight against such complex fungal infections. These peptides disrupt fungi cell walls as fungal cell membranes are composed of a component called chitin. Antifungal peptides disrupt the cell wall of fungus as they bear binding capabilities with chitin.
Similarly, cytokine peptides are the messenger of the molecules of the immune system and they play a vital role in the interaction between two cells. Cytokine mediates cellular interaction among lymphocytes, dendritic cells, macrophages, other inflammatory cells (neutrophils), and connective tissue cells.
The knowledge of protein 3D (three-dimensional) structures or their complexes with ligands is vitally important for rational drug design. Although X-ray crystallography is a powerful tool in determining these structures, it is time-consuming and expensive, and not all proteins can be successfully crystallized. Membrane proteins are difficult to crystallize and most of them will not dissolve in normal solvents. Therefore, so far very few membrane protein structures have been determined. NMR is indeed a very powerful tool in determining the 3D structures of membrane proteins (see, e.g., [6,7]), but it is also time-consuming and costly. To acquire the structural information in a timely manner, a series of 3D protein structures have been developed by means of structural bioinformatics tools (see, e.g., a comprehensive review [8] and the long list of papers cited therein). Meanwhile, facing the explosive growth of biological sequences discovered in the post-genomic age, to timely use them for drug development, a lot of important sequence-based information, such as PTM (posttranslational modification) sites in proteins, have been successfully predicted. Actually, the rapid development in sequential bioinformatics and structural bioinformatics have driven the medicinal chemistry undergoing an unprecedented revolution, in which the computational biology has played increasingly important roles in stimulating the development of finding novel drugs. In view of this, the computational (or in silico) methods were also utilized in the current study.
With the explosive growth of biological sequences in the post-genomic era, one of the most important but also most difficult problems in computational biology is how to express a biological sequence with a discrete model or a vector, yet still keep considerable sequence-order information or key pattern characteristic. This is because all the existing machine-learning algorithms (such as “Optimization” algorithm [9], “Covariance Discriminant” or “CD” algorithm [10], “Nearest Neighbor” or “NN” algorithm, and “Support Vector Machine” or “SVM” algorithm [11]) can only handle vectors as elaborated in a comprehensive review. However, a vector defined in a discrete model may completely lose all the sequence-pattern information. To avoid completely losing the sequence-pattern information for proteins, the pseudo amino acid composition [11] or PseAAC was proposed. Ever since the concept of Chou’s PseAAC was proposed, it has been widely used in nearly all the areas of computational proteomics. Because it has been widely and increasingly used, four powerful open access soft-wares, called ‘PseAAC’, ‘PseAAC-Builder’, ‘propy’, and ‘PseAAC-General’ [12], were established: The former three are for generating various modes of Chou’s special PseAAC [13]; while the 4th one for those of Chou’s general PseAAC [14], including not only all the special modes of feature vectors for proteins but also the higher level feature vectors such as “Functional Domain” mode (see Eqs. (9), (10) of [14]), “Gene Ontology” mode (see Eqs. (11), (12) of [14]), and “Sequential Evolution” or “PSSM” mode (see Eqs. (13), (14) of [14]). Encouraged by the successes of using PseAAC to deal with protein/peptide sequences, the concept of PseKNC (Pseudo K-tuple Nucleotide Composition) [15] was developed for generating various feature vectors for DNA/RNA sequences [16], that have proved very useful as well. Particularly, in 2015 a very powerful web-server called ‘Pse-in-One’ and its updated version ‘Pse-in-One2.0’ have been established that can be used to generate any desired feature vectors for protein/peptide and DNA/RNA sequences according to the need of users’ studies
In 2013 a predictor namely iAMP-2L was proposed. It used Pseudo Amino Acid Composition (PseAAC) along with a k-Nearest Neighbor technique for feature extraction and classification respectively. This technique was noteworthy as it was the first one that made use of sequence and combination information of amino acid residues. Subsequently, a predictor named AMPScanner was developed for which the author defined a set of descriptive features specific to antimicrobial peptides. Another researcher used the PseAAC methodology along with SVM for the prediction of the antimicrobial peptides. The author used the CD-HIT approach for the clustering of sequences. Zare, Mohabatkar, & Faramarzi, in 2015 also applied Chou’s approaches for the prediction of antiviral peptides. The predictor was only limited to the identification of antiviral peptides. In 2016 Wei et al. [17] proposed a technique called iACP, this sequence-based technique is developed for the prediction and identification of anticancer peptides. Authors also compare their results with other researchers. The accuracy was 95.06% and the MCC was 0.897. Meher et al. in 2017 attempted another technique for the prediction of AMPs, in this approach the authors used a support vector machine (SVM) for classification. Barrett, Jiang, & White in 2018 used a Bayesian network model for the prediction of antimicrobial peptides activities yielding an accuracy of 94%. Moreover, an in-silico technique based on the SVM classifier along with PaDEL based features was devised that provided a peak accuracy of 91.82%. Further work was established on the AMPScanner model through the incorporation of convolution and recurrent neural networks proposing an improved iAMPPred model.
As demonstrated by a series of recent publications and summarized in three comprehensive review papers [14–18], to develop a really useful predictor for a biological system, one needs to follow “Chou’s 5-steps rule” to go through the following five steps: (1) select or construct a valid benchmark dataset to train and test the predictor; (2) represent the samples with an effective formulation that can truly reflect their intrinsic correlation with the target to be predicted; (3) introduce or develop a powerful algorithm to conduct the prediction; (4) properly perform cross-validation tests to objectively evaluate the anticipated prediction accuracy; (5) establish a user-friendly web-server for the predictor that is accessible to the public. Papers presented for developing a new sequence-analyzing method or statistical predictor by observing the guidelines of Chou’s 5-step rules have the following notable merits: (1) crystal clear in logic development, (2) completely transparent in operation, (3) easily to repeat the reported results by other investigators, (4) with high potential in stimulating other sequence-analyzing methods, and (5) very convenient to be used by the majority of experimental scientists. The significance of 5-step rule in proteomic and genomic analysis for drug discovery is further elaborated in [6,18–25].
This section discusses the proposed methodology articulated for building a robust predictor for the identification of antimicrobial peptides. Fig. 2 illustrates the flow of methodology. The initial step is the collection of experimentally proven robust data from the UNIPROT database. In the next step, the data is further refined to reduce homology using the CD-HIT tool. This refined data is transformed into fixed-sized vectors of coefficients using the proposed feature extraction methodology. Machine learning models are trained using these feature vectors. After substantial training, the model is validated using well-defined validation techniques to quantify the accuracy indexes of the proposed predictor,

Figure 2: Flow chart of proposed methodology
A major part of the dataset was extracted from the Uniprot database. Uniprot is a freely accessible and comprehensive resource for proteins and peptides related information and its explanation. The Uniprot protein database consists of a large amount of protein knowledge known as the Uniprot knowledge base [26,27].
A positive data set is mainly composed of AMPs including Antibiotic, Antiviral, Antimicrobial, fungicides, and cytokines. Uniprot uses all these terms as keywords for the annotation of proteins. All the records were queried using the advanced search tool of Uniprot, those protein sequences were searched annotated with any of the above given Uniprot keywords. Also, ambiguous and small sequences were excluded that were annotated with words like probably, fragment, potential, etc. Subsequently, a negative dataset is also obtained from Uniprot and consists of only non-AMPs. The advanced query options are set such that only those proteins are extracted which are reviewed and whose annotated properties are experimentally proven while uncategorized data is left out. The dataset is further uploaded to CD-HIT servers for redundancy removal and homology reduction. CD-HIT stands for Cluster Database at High Identity with Tolerance. CD-HIT is an algorithm used for clustering peptides sequences and is widely used by many researchers. Clusters were obtained from CD-HIT by applying a 60 percent sequence identity cut-off filter. The CD-HIT server used is available on the website http://weizhong-lab.ucsd.edu/cdhit_suite/cgi-bin/index.cgi?cmd=cd-hit. All the sequences were provided in FASTA format. The sequence identity parameter was set at 0.6 for 60% sequence homology. The CD-HIT server returned files containing numerous clusters within the positive as well as negative datasets. Only a single representative sequence within each cluster is selected to reduce homology bias. Thus, a dataset of a total of 1902 AMPs and 3997 non-AMPS are finalized for feature extraction after this process.
As in most machine learning (ML) approaches, a dataset is usually divided into two subsets. One for training and the other for validation. The training dataset usually contains a higher percentage of data than the validation dataset. In supervised ML approaches the training data is labeled according to the category to which it belongs. Thus, ML classifiers train on this data and alter its parameters accordingly to the target class. Once the model is trained its classification accuracy is tested on the validation dataset. Classification accuracy can be determined using many available approaches. The use of jackknife or cross-validation techniques such as 5-fold or 10-fold to determine accuracy is considered to be the most rigorous and generalized benchmark to analyze the performance of a predictor. All these techniques compute classification accuracy based on multiple independent data subsets. Subsequently, in this paper, the dataset is formulated according to the following expression:

where ‘A’ represents the positive data containing AMP and ‘N’ represents the negative data containing non-AMPS. Hence, a total of 1902+3997 = 5899 data samples are used.
Expressing a biological sequence in a fixed sized vector form may result in losing its important sequence-based characteristics. Thus, to solve this issue many computational models have been proposed. These models preserve the basic characteristics of sequences and provide an opportunity to apply computational models to analyze biological studies.
Thus, to resolve such complex bio-computational problems Kuo-Chen Chou proposed a sequential protein sampling model “pseudo amino acid composition (PseAAC).” Since then this model has been used by a large number of researchers [26–28]. The main idea behind PseAAC is to completely preserve the sequence order characteristics of amino acids. As PseAAC is the successor of AAC (Amino Acid Composition). AAC consists of 20 components, where each component is represented from one of the 20 native amino acids based on the occurrence frequency. While PseAAC contains more than 20 components, the first 20 factors belong to the native amino acid compositions while the remaining components contain the sequence order information. Further, the components of PseAAC were subsequently enhanced in [29,30] by incorporating numerous position relative matrices and the introduction of statistical moments. These components along with position and composition relative coefficients are explained further.
Multiple types of moments based on specific polynomials or distribution functions have been developed by mathematicians and statisticians. The proposed work uses raw, central, and Hahn moments to translate previously extracted information into a reduced set of moments.
To calculate the mean, asymmetry, and variance of a probability distribution, raw moments are used. These moments are scale and location variant. While raw moments are both scale and location variant, the central moments are location invariant. These moments are calculated along the centroid of data. Thus, making central moment’s location invariant [7,31]. Additionally, Hahn moments exhibit both location and scale variant traits. The calculation of these three moments is important because of their correlation to sequence order information [32,33].
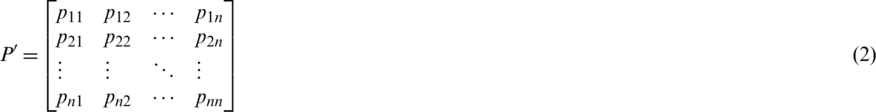
The proposed approach uses a two-dimensional version of these moments. Thus, to apply these moments, the single-dimensional protein sequences is firstly transformed into two-dimensional notation. A matrix P is used which transforms all the protein components into an
  2D matrix.
After transforming protein sequences, initially, raw moments are computed. The following equation is used to compute raw moments up to 3 degrees.

where i + j corresponds to the degree of raw moments. This equation outputs third ordered raw moments as M00, M01, M10, M11, M12, M21, M30, and M03.
After the computation of raw moments, we calculate the centroid moments. A centroid is analogous to the center of gravity which represents the central point of data along which all the data samples are evenly distributed in all directions. Central moments are calculated using the following equation:

where  is the centroid. Hahn moments requires an evenly dimensioned data organization. The protein primary sequence has already been transformed into matrix P
 . The Hahn moments of order n are computed using the following equation:

where the Pochhammer and the gamma symbols values are elaborated in [25]. Further to calculate the orthogonal moments of 2D data the following equation is used:

2.4 Position Relative Incident Matrix (PRIM)
The proposed model presents a Position Relative Incident Matrix (PRIM) to quantize the relative positioning of amino acids in an arbitrary polypeptide chain. This matrix succinctly represents the relative positioning of all the component residues within a polypeptide chain. PRIM matrix has a  dimension and is represented as:
 Represents the sum of jth entry position concerning the occurrence of first ith entry. This matrix gives a total of 400 coefficients which are further reduced to 24 elements by applying moments on PRIM as input moments.
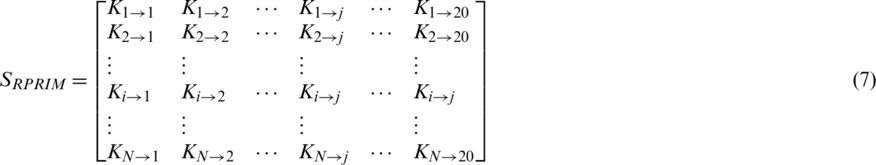
2.5 Reverse Position Relative Incidence Matrix
To uncover hidden patterns that reside in datasets, data is thoroughly analyzed from varying perspectives. Feature extraction approaches help in expanding dataset characteristics in such a way that it extracts all the valuable data features that are needed for a Machine Learning (ML) classifier to improve its accuracy. As stated above the PRIM matrix analyzes the relative positioning of amino acid residues present in a polypeptide chain. The reverse PRIM (RPRIM) provides the same information for the reversed primary structure. The following matrix describes RPRIM in a  -dimensional matrix. Each dimension is set at 20 because the number of natively occurring amino acids is 20. The primary structure of proteins is combinational sequences of these native amino acids.
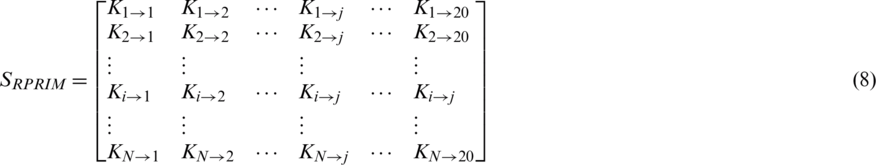
Similar to PRIM, this matrix also gives a total of 400 coefficients which are further reduced to 24 elements by applying moments with RPRIM as input which constitutes 8 coefficients each for raw, central, and Hahn.
2.6 Frequency Matrix Determination
Another common feature extraction approach that is used by multiple researchers [7,29–33] is the frequency distribution matrix. This matrix annotates the occurrences of amino acids in a single peptide. The frequency matrix shows the number of times any amino acid is repeated in a given peptides samples.

where fi shows the occurrence frequency of ith the amino acid in the polypeptide chain. This vector-only accounts for compositional information while the sequence order information is completely lost.
2.7 Accumulative Absolute Position Incidence Vector
As stated above, the frequency matrix shows the number of times each amino acid is repeated in a given polypeptide sample chain. While doing this frequency matrix completely disregards the protein sequence information. Accumulative absolute position incidence vector (AAPIV) describes the absolute position of every amino acid present in a polypeptide chain. AAPIV works by forming a vector containing 20 elements that contain the sum of all the positions at which the corresponding native amino acids exist in a given polypeptide chain concerning the starting position. AAPIV is expressed as follows:

From the above expression an arbitrary position of the ith the element of AAPIV vector is calculated as:

2.8 Reverse Accumulative Absolute Position Incidence Vector (RAAPIV) Generation
As previously discussed, the feature extraction approaches help in expanding dataset characteristics in such a way that it extracts all the valuable data features that are needed for a machine learning classifier to improve its accuracy. Applying the same approach on the reverse input also improves data characteristics. Similarly, RAAPIV is calculated by reversing a peptide sequence and then applying AAPIV on this reversed order sequence. RAAPIV is expressed as:

The feature set has been derived from the previous work illustrated in [29]. The set of feature vector coefficients have been optimally curated such that they provide the most accurate results at the lowest computational cost.
Many machine learning algorithms have been developed to solve decision problems. Each algorithm has its pros and cons. A trend in the use of artificial neural networks is seen as multiple researchers have used ANN in many bio-computational decision problems. In this study, ANN with backpropagation technique is applied for peptides prediction. ANN has been inspired by the working of the human brain. The human brain consists of neurons that work together to process and receive information and learn skills from experience. ANN algorithm also works similarly, it consists of multiple nodes that are linked with each other as shown in Fig. 3. The first layer of nodes in the input layer, the second layer is called the hidden layer while the third layer is the output layer. Data that needs to be modeled is passed onto the input layer while the hidden layer(s) are used for processing. Subsequently, the output layer shows the resultant outcome. In backpropagation, the output of the output layer is again fed into the hidden layer for improving its classification accuracy upon each iteration to reduce or minimize the error rate in classification.
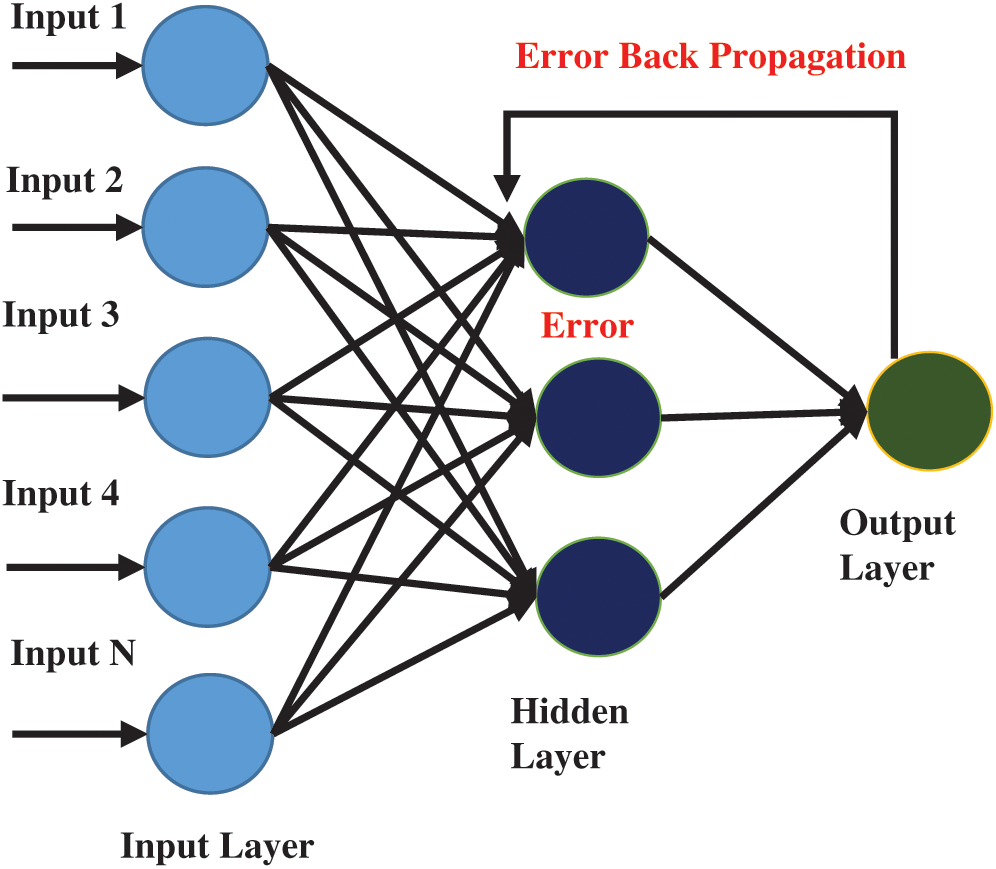
Figure 3: Architecture of multilayer artificial neural network
To obtain an input matrix for ANN, each sequence in the dataset is processed to extract all the above-described features. Each row in the input matrix corresponds to a single peptide sequence containing extracted features such as PRIM, RPRIM, FM, AAPIV, and RAAPIV along with the statistical moments of the two-dimensional transformed sequence [33–38].
One of the most commonly used training functions for ANN is the gradient descent function. The primary purpose of using this approach is to minimize the error. The gradient descent algorithm works iteratively to find a set of parameters that helps to minimize the primary function [36]. Gradient function can be expressed as:

where the objective function  is parameterized by
  and
and  represent the gradient function followed by the learning rate
Similarly, other classifiers are also trained and evaluated on the same data to evaluate which classifier performs best for the described problem. Probabilistic neural networks are governed by non-parametric functions to describe the probability density function of each class. Data from each class is used to derive a probability density function while the probability of new input data belonging to a certain class is calculated by Bayes’ rule. Support Vector Machine (SVM) is also another binary classifier that is fine-tuned to construct a hyperplane that optimally partitions the data of both classes. Another classifier used as a benchmark is the k-nearest neighbor which is a multiclass classifier. It forms clusters for each class and computes its centroid. The Euclidean distance of any new input with all the centroids is computed. The input is assigned to the class corresponding to the centroid having the least Euclidean distance. Random forest is another popular classifier that works as an association of decision trees. Each tree decides the class based on a subset of feature vectors. A voting algorithm decides the most likely outcome. The Scikit-Learn library for Python 3.7 provides support for all of these classifiers.
Each method shows the model performance in a new unique way. Henceforth, it is imperative to select which metrics should be used to quantize and explain the classification model more precisely. Subsequently, the benchmark testing mechanism also needs to be set to score the model’s classification metrics. Consistently, the Scikit-Learn library for Python 3.7 was used to compute feature vectors, train models, and draw results through validation techniques.
The performance of each ML classifier can only be represented in terms of some evaluation metrics. The proposed methodology is evaluated using four well-known metric formulations. These metrics are “Acc” which describes the overall accuracy of the system, “MCC” for finding the overall stability of the proposed algorithm, “Sn” and “Sp” for describing the overall sensitivity and specificity of the proposed methodology. The conventional formulation for MCC described by many researchers is difficult to understand. But fortunately using symbols introduced in converted these metrics formulation expressions in such a way that it was easier to understand and implement.


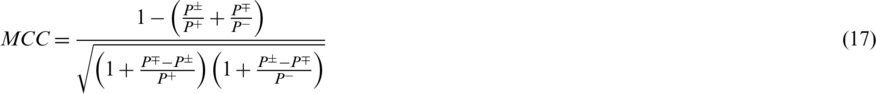
where P+ represents the number of true AMPs sequences.  represents the total number of AMPs sequences incorrectly identified as non-AMPs. P− represents the total number of non-AMPs sequences and
  shows the total number of non-AMPs incorrectly predicted as AMPs.
To further elaborate these equations let assumes some scenarios for example when the value of  , it indicates that no AMP sequence was incorrectly predicted as non-AMPs. Thus, giving the sensitivity value of 1. When
  it shows that all the AMPs are incorrectly predicted as non-AMPs, hence the value of sensitivity will be 0. Similarly, when
  indicates none of the non-AMPs sequenced have been identified as AMPs giving a total specificity of 1. When
  , then all the non-AMPs sequences are incorrectly predicted as AMPs sequences and the specificity value equals 0. When
  shows that none of the AMPs in the positive dataset and no non-AMP sequence in the negative dataset have been correctly predicted. A value of
  and
and  shows the worst case and indicates that all of the AMPs sequences and all of the non-AMPs sequences were incorrectly predicted. In this case, the overall accuracy of the system will be 0 and
  .
.
Several validation tests were established to demonstrate the effectiveness of the proposed technique. Many researchers have used this type of testing approach across all fields of science. The simplest of these tests is the self-consistency test. The self-consistency test establishes that how well the model has responded to the training process. Typically, all the available data is used to train the model. Once the training converges that model is tested using the same training data. All the metrics are computed to gather a depiction of how well the model has been trained. The results of the self-consistency test graphically illustrated with the help of a receiver operating characteristics (ROC) curve. The curve plots the true positive rate against the false-positive rate. The area encompassed under the curve is representative of the accuracy of the model. Fig. 4 shows the ROC curve plotted using the results of the self-consistency test. The enormous area spanning under the curve signifies that the accuracy of the model. The figure illustrates that the best accuracy is exhibited by the artificial neural network in the self-consistency test as compared with SVM, KNN, PNN, and random forest. Tab. 1 depicts the metrics obtained from this test.
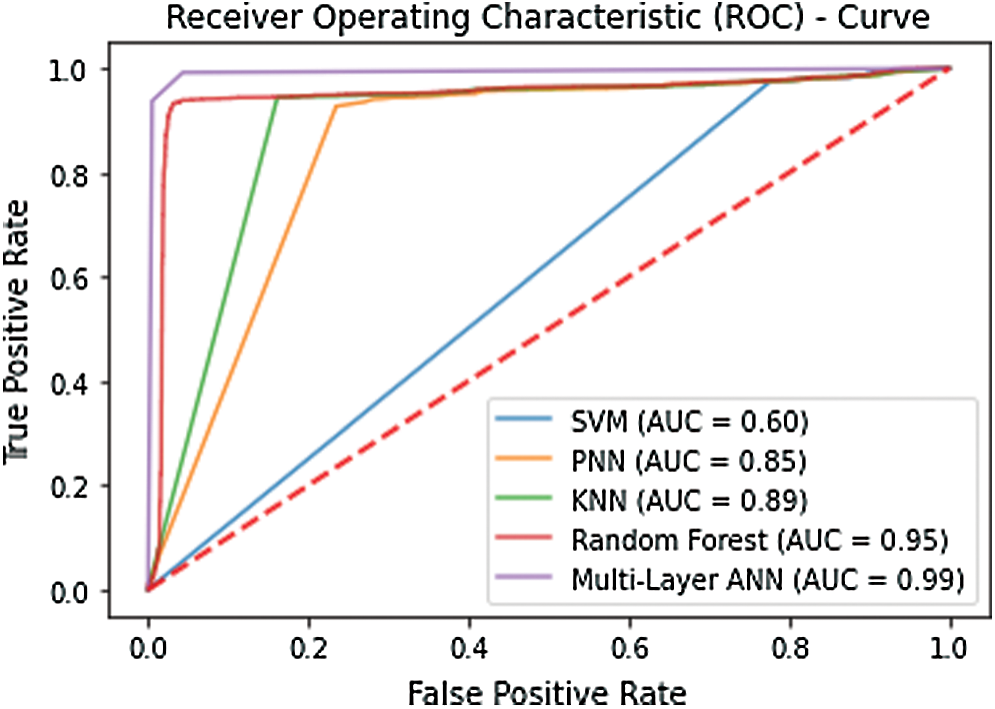
Figure 4: ROC obtained after performing the self-consistency test
Table 1: Self-consistency results

The self-consistency test helps to investigate how well a model has adapted to the training data. However, it does not verify the ability of the model to respond to unknown data. Subsequently, this test helps to identify the most suitable classifier for the benchmark dataset. In this case it’s quite evident that multilayer ANN performs best.
A basic test for evaluating the performance of the model for unknown data when new data is not readily available is the independent set test. The available dataset is randomly partitioned into two unequal size partitions. The larger partition is used to train the model while the smaller partition is usually used to test the accuracy of the model. The test data works as an independent data set as it has not been used in any way to train the model. An independent set test was performed by partitioning the dataset into two partitions. The larger partition contained 70% of the data while the smaller partition contained the left out 30% data.
The test yields an overall accuracy of 96.1% and an MCC of 0.9102. Fig. 5 shows the ROC curve illustrating the test results of Independent set testing while Tab. 2 shows the metrics obtained from the test.
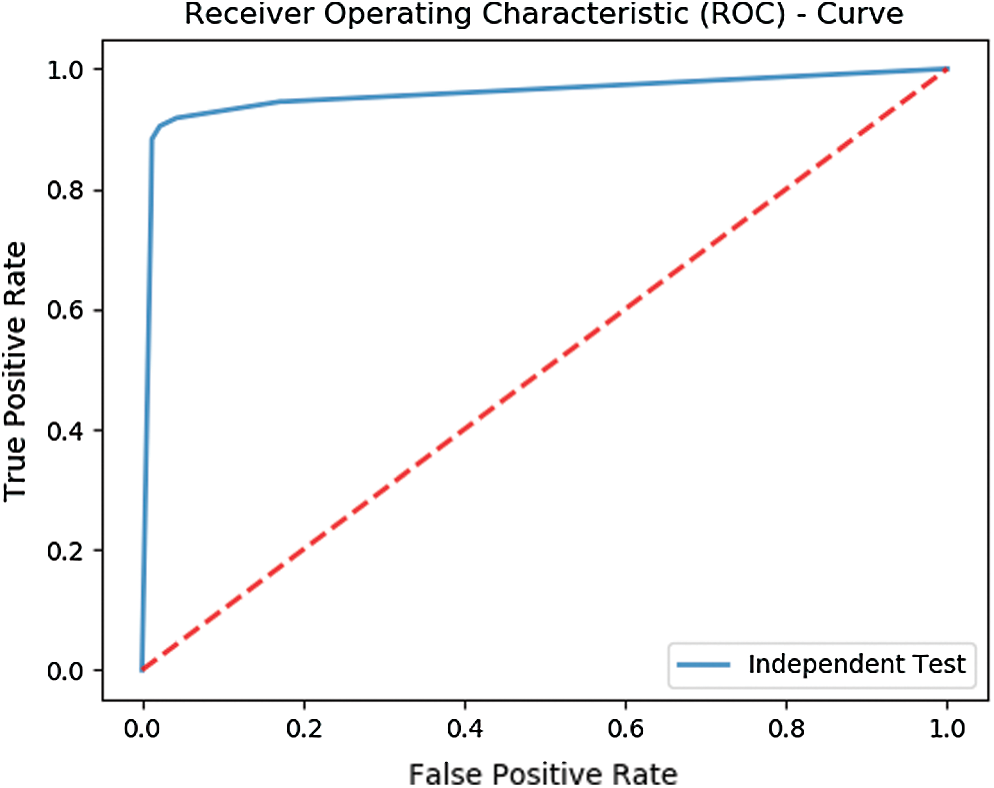
Figure 5: ROC depicting the results of Independent set testing
Table 2: Results of Independent set testing

Since there can be several permutations for partitioning data therefore independent set testing is not considered a rigorous test. However, a more rigorous test is the cross-validation test. In k-fold cross-validation testing, data is divided into k number of equal but disjoint partitions such each data element is selected randomly. The value of k remains constant throughout the test. The testing is repeated k times such that the output for each partition is testing while the rest of the partitions are used for training. The average is of the metrics yielded for each partition is considered to be the overall result. The proposed model was rigorously tested using 10-fold and 5-fold cross-validation. The metrics obtained for each fold in 10-fold cross-validation is depicted in Fig. 6.
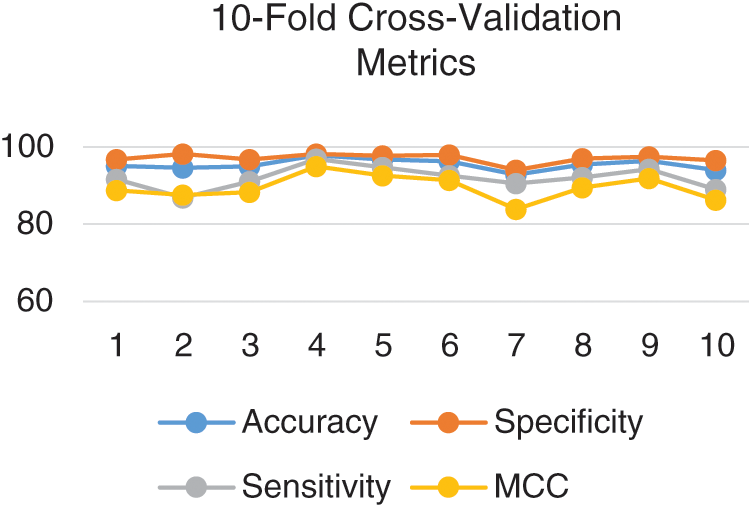
Figure 6: Metrics for each fold in the 10-fold cross-validation
Further, Fig. 7 depicts the ROC curve obtained for the 10-fold cross-validation test. The curve in bold illustrates the mean of the test.
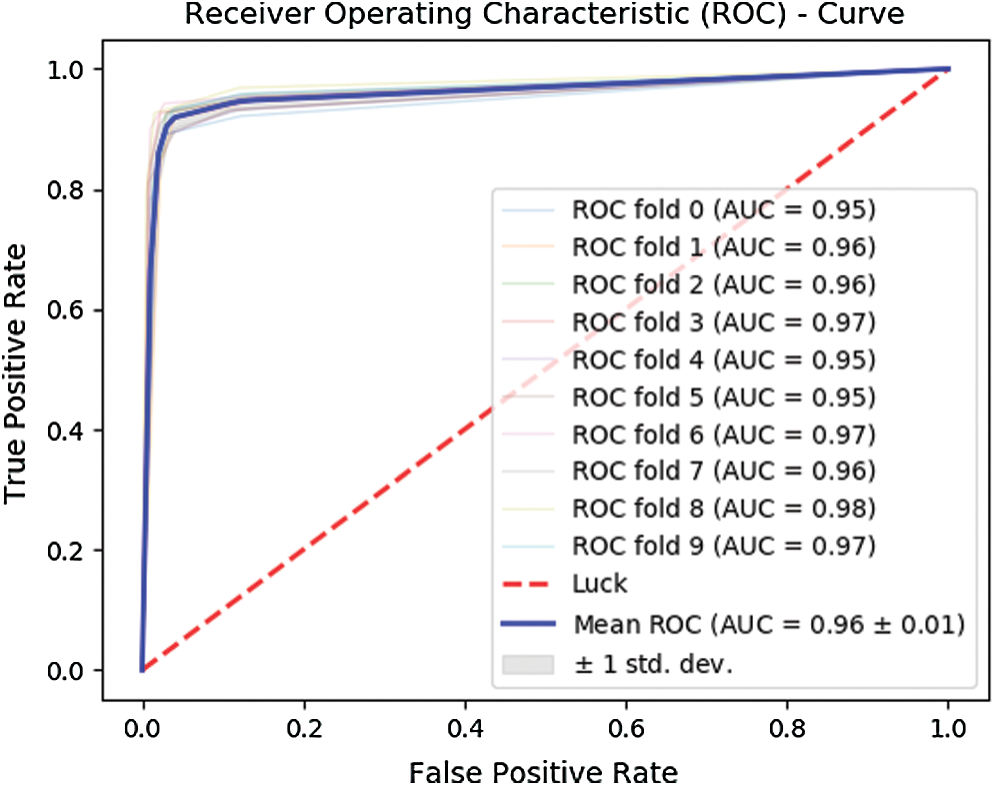
Figure 7: ROC for 10-fold cross-validation
The 10-fold cross-validation test revealed an overall accuracy of 95.43% and an MCC of 0.90.
In silico techniques for the treatment of proteomic characteristics are vastly beneficial to researchers as it readily provides answers to question which require excruciating time through in-vivo or in-vitro techniques. The research community has a great appetite for updated, robust, and accurate prediction models for this purpose. To corroborate that a model is industrious and can prove beneficial for the research community, it has to be analyzed in comparison with other existing competing models. An independent set test was formulated to form a comparison of the proposed methodology with the existing state of art methodologies. The performance of the proposed model was evaluated along with other such models namely AMPScanner, CS-AMPPred, AntiMPmod, iAMPPred, and iAMP-2L models. Fig. 8 shows a bar chart depicting the accuracy of each of the described existing techniques in comparison with the proposed iAMP-NNPred model.
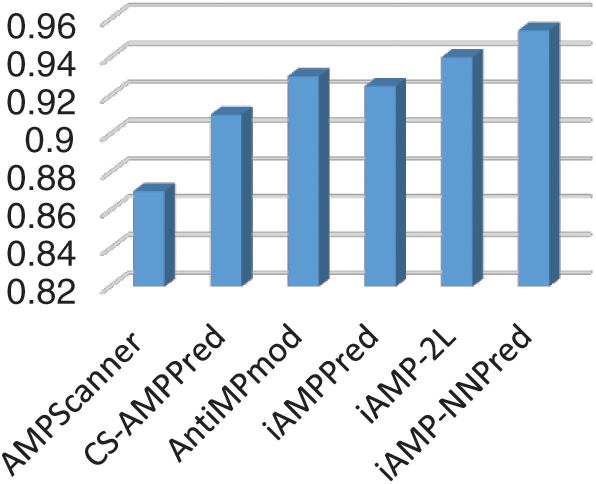
Figure 8: Accuracy of proposed and existing predictors
Also, Fig. 9 represents the ROC curve for the results obtained from each predictor.
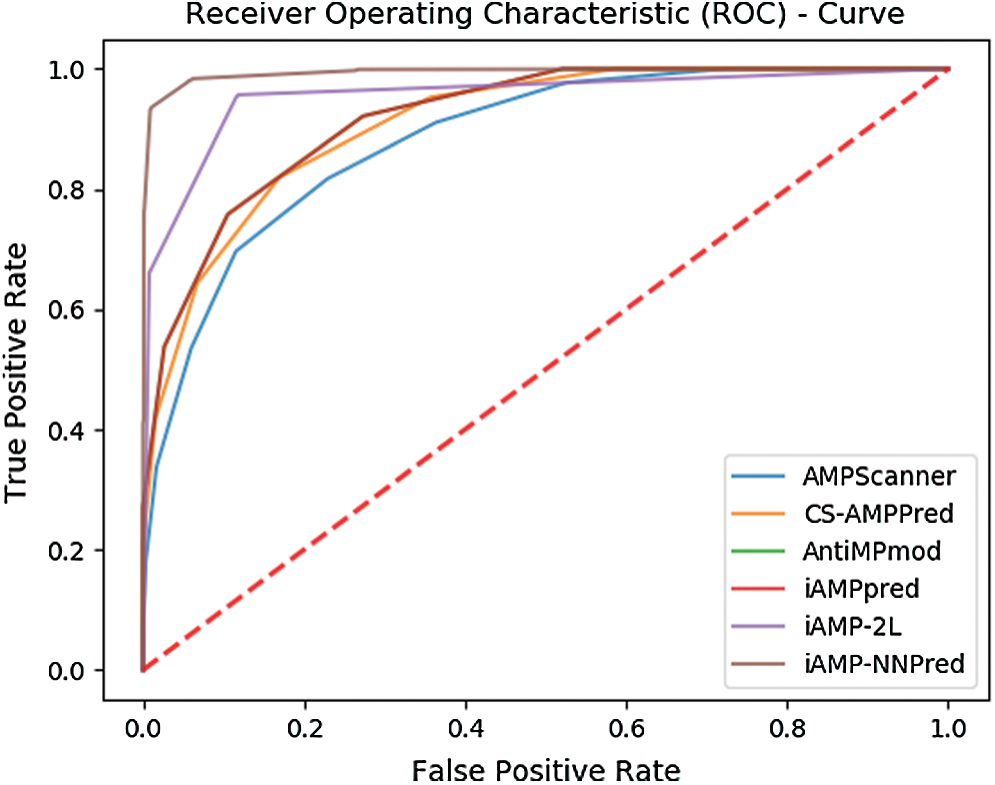
Figure 9: ROC based comparison of proposed and existing predictors
The curves show that the area encompassed by the curve of the proposed technique is fairly greater than the other state of art antimicrobial peptide predictors.
The study focuses on the design and development of a prediction algorithm for identifying AMPs and non-APMS. With the recent development in bioinformatics more and more researchers are contributing their effort to apply computational models for classifying multiple types of sequences. Many existing models exist which address the discussed problem. A comparison of the proposed technique with other existing ones has been provided in the study. Experiments demonstrate that the proposed techniques perform fairly well than the existing ones. The existing techniques use a different methodology for the extraction of features from the benchmark dataset. Some techniques use PseAAC methodology while others derive feature vectors using the physicochemical properties of amino acid residues. iAMPPred is an extension of previous AMPScanner techniques, the novelty of the technique is the use of convolution neural networks for extraction of feature vectors. The proposed technique uses an extended methodology for extraction composition and sequence-related information of the proteomic sequence. The strength of the methodology lies in its ability to inscribe position correlation among amino acid residues throughout the sequence. Moreover, it provides significant constructs for accounting for the compositional factors of the sequence. Another dividend provided by the technique is the use of a multilayer neural network which has numerous parameters. The parameters can be fine-tuned through probing and feedback such that the best results are produced. The proposed system unveils an accuracy of 96.1% via 10-fold cross-validation. The rigorous testing of the proposed methodology using the benchmark dataset provides convincing evidence that the predictor can be confidently used by the research community for identification antimicrobial peptides.
Furthermore, use of graphical approaches to study biological and medical systems can provide an intuitive vision and useful insights for helping analyze complicated relations therein as shown by the eight master pieces of pioneering papers from the then Chairman of Nobel Prize Committee Sture Forsen [39–44], and many follow-up papers (see, e.g., [45–47]). They are very useful for in-depth investigation into the topic of the current paper, and we will use them in our future efforts.
As shown in a series of recent publications (see, e.g., [48–50]) in demonstrating new findings or approaches, user-friendly and publicly accessible web-servers will significantly enhance their impacts, driving medicinal chemistry into an unprecedented revolution, we shall make efforts in our future work to provide a web-server to display the findings that can be manipulated by users according to their need.
Supplementary Data: Supplementary File 1 contains Uniprot accession numbers of all the antimicrobial peptides within the dataset while Supplementary File 2 contains accession numbers for the non-antimicrobial peptides.
Funding Statement: This project was funded by the Deanship of Scientific Research (DSR), King Abdulaziz University (https://www.kau.edu.sa/), Jeddah, under Grant No. (DF-794-611-1441). The authors, therefore, gratefully acknowledge DSR technical and financial support. The funders had no role in study design, data collection, and analysis, decision to publish, or preparation of the manuscript.
Conflicts of Interest: The authors declare that they have no conflicts of interest to report regarding the present study.
1. B. Alberts, A. Johnson, J. Lewis, M. Raff, K. Roberts et al. (2002). , “Cell movements and the shaping of the vertebrate body,” in Molecular Biology of the Cell, 4th ed. Garland Science, Taylor & Francis. [Google Scholar]
2. A. Izadpanah and R. L. Gallo. (2005). “Antimicrobial peptides,” Journal of the American Academy of Dermatology, vol. 52, no. 3, pp. 381–390. [Google Scholar]
3. G. Wang, X. Li and Z. Wang. (2016). “APD3: The antimicrobial peptide database as a tool for research and education,” Nucleic Acids Research, vol. 44, no. D1, pp. D1087–D1093. [Google Scholar]
4. M. D. Turner, B. Nedjai, T. Hurst and D. J. Pennington. (2014). “Cytokines and chemokines: At the crossroads of cell signalling and inflammatory disease,” Biochimica et Biophysica Acta (BBA)—Molecular Cell Research, vol. 1843, no. 11, pp. 2563–2582. [Google Scholar]
5. W. F. Porto, Á.S. Pires and O. L. Franco. (2012). “CS-AMPPred: An updated SVM model for antimicrobial activity prediction in cysteine-stabilized peptides,” PLoS One, vol. 7, no. 12, pp. e51444. [Google Scholar]
6. M. J. Berardi, W. M. Shih, S. C. Harrison and J. J. Chou. (2011). “Mitochondrial uncoupling protein 2 structure determined by NMR molecular fragment searching,” Nature, vol. 476, no. 7358, pp. 109–113. [Google Scholar]
7. H. Butt and Y. D. Khan. (2019). “Prediction of S-Sulfenylat ion sites using statistical moments based features via Chou’S 5-Step rule,” International Journal of Peptide Research and Therapeutics, vol. 26, pp. 1291–1301. [Google Scholar]
8. D.-S. Cao, Q.-S. Xu and Y.-Z. Liang. (2013). “Propy: A tool to generate various modes of Chou’s PseAAC,” Bioinformatics, vol. 29, no. 7, pp. 960–962. [Google Scholar]
9. X. Cheng, X. Xiao and K.-C. Chou. (2017). “pLoc-mPlant: Predict subcellular localization of multi-location plant proteins by incorporating the optimal GO information into general PseAAC,” Molecular BioSystems, vol. 13, no. 9, pp. 1722–1727. [Google Scholar]
10. X. Cheng, X. Xiao and K.-C. Chou. (2017). “pLoc-mVirus: Predict subcellular localization of multi-location virus proteins via incorporating the optimal GO information into general PseAAC,” Gene, vol. 628, pp. 315–321. [Google Scholar]
11. K.-C. Chou. (2011). “Some remarks on protein attribute prediction and pseudo amino acid composition,” Journal of Theoretical Biology, vol. 273, no. 1, pp. 236–247. [Google Scholar]
12. M. A. Akmal, N. Rasool and Y. D. Khan. (2017). “Prediction of N-linked glycosylation sites using position relative features and statistical moments,” PloS One, vol. 12, no. 8, pp. e0181966. [Google Scholar]
13. M. A. Akmal, W. Hussain, N. Rasool, Y. D. Khan, S. A. Khan et al. (2020). , “Using Chou’s 5-steps rule to predict O-linked serine glycosylation sites by blending position relative features and statistical moment,” IEEE/ACM Transactions on Computational Biology and Bioinformatics, . https://doi.org/10.1109/TCBB.2020.2968441. [Google Scholar]
14. H. Butt, N. Rasool and Y. D. Khan. (2017). “A treatise to computational approaches towards prediction of membrane protein and its subtypes,” Journal of Membrane Biology, vol. 250, no. 1, pp. 55–76. [Google Scholar]
15. Y. D. Khan, F. Ahmad and M. W. Anwar. (2012). “A neuro-cognitive approach for iris recognition using back propagation,” World Applied Sciences Journal, vol. 16, no. 5, pp. 678–685. [Google Scholar]
16. Y. D. Khan, S. A. Khan, F. Ahmad and S. Islam. (2014). “Iris recognition using image moments and k-means algorithm,” The Scientific World Journal, vol. 2014, Article ID 723595, 9 pages, . https://doi.org/10.1155/2014/723595. [Google Scholar]
17. H. Butt, N. Rasool and Y. D. Khan. (2018). “Predicting membrane proteins and their types by extracting various sequence features into Chou’s general PseAAC,” Molecular Biology Reports, vol. 45, no. 6, pp. 2295–2306. [Google Scholar]
18. H. Tayara Tahir and T. K. Chong. (2019). “Chong, iRNA-PseKNC (2methylIdentify RNA 2’-O-methylation sites by convolution neural network and Chou’s pseudo components,” Journal of Theoretical Biology, vol. 465, pp. 1–6. [Google Scholar]
19. G. Zhou and M. Deng. (1984). “An extension of Chou’s graphic rules for deriving enzyme kinetic equations to systems involving parallel reaction pathways,” Biochemical Journal, vol. 222, no. 1, pp. 169–176.
20. A. H. Butt, S. A. Khan, H. Jamil, N. Rasool and Y. D. Khan. (2016). “A prediction model for membrane proteins using moments based features,” BioMed Research International, vol. 2016, Article ID 8370132, 7 pages, . https://doi.org/10.1155/2016/8370132.
21. Y. D. Khan, F. Ahmed and S. A. Khan. (2014). “Situation recognition using image moments and recurrent neural networks,” Neural Computing and Applications, vol. 24, no. 7–8, pp. 1519–1529.
22. W. Ghauri, Y. D. Khan, N. Rasool, S. A. Khan, K.-C. Chou et al. (2018). , “pNitro-Tyr-PseAAC: Predict nitrotyrosine sites in proteins by incorporating five features into Chou’s general PseAAC,” Current Pharmaceutical Design, vol. 24, no. 34, pp. 4034–4043.
23. Y. D. Khan, N. Rasool, W. Hussain, S. A. Khan, K.-C. Chou et al. (2018). , “iPhosT-PseAAC: Identify phosphothreonine sites by incorporating sequence statistical moments into PseAAC,” Analytical Biochemistry, vol. 550, pp. 109–116.
24. M. Awais, W. Hussain, Y. D. Khan, N. Rasool, S. A. Khan et al. (2019). , “iPhosH-PseAAC: Identify phosphohistidine sites in proteins by blending statistical moments and position relative features according to the Chou’s 5-step rule and general pseudo amino acid composition,” IEEE/ACM Transactions on Computational Biology and Bioinformatics, . https://doi.org/10.1109/TCBB.2019.2919025.
25. Y. D. Khan, N. Rasool, W. Hussain, S. A. Khan, K.-C. Chou et al. (2018). , “iPhosY-PseAAC: Identify phosphotyrosine sites by incorporating sequence statistical moments into PseAAC,” Molecular Biology Reports, vol. 45, no. 6, pp. 2501–2509. [Google Scholar]
26. O. Barukab, Y. D. Khan, S. A. Khan and K.-C. Chou. (2019). “iSulfoTyr-PseAAC: Identify tyrosine sulfation sites by incorporating statistical moments via Chou’s 5-steps rule and pseudo components,” Current Genomics, vol. 20, no. 4, pp. 306–320. [Google Scholar]
27. H. Butt and Y. D. Khan. (2019). “CanLect-Pred: A cancer therapeutics tool for prediction of target cancerlectins using experiential annotated proteomic sequences,” IEEE Access, vol. 8, pp. 9520–9531. [Google Scholar]
28. H. Butt, N. Rasool and Y. D. Khan. (2019). “Prediction of antioxidant proteins by incorporating statistical moments based features into Chou’s PseAAC,” Journal of Theoretical Biology, vol. 473, pp. 1–8. [Google Scholar]
29. W. Hussain, Y. D. Khan, N. Rasool, S. A. Khan and K.-C. Chou. (2019). “SPalmitoylC-PseAAC: A sequence-based model developed via Chou’s 5-steps rule and general PseAAC for identifying S-palmitoylation sites in proteins,” Analytical Biochemistry, vol. 568, pp. 14–23. [Google Scholar]
30. Y. D. Khan Hussain, N. Rasool, S. A. Khan and K.-C. Chou. (2019). “SPrenylC-PseAAC: A sequence-based model developed via Chou’s 5-steps rule and general PseAAC for identifying S-prenylation sites in proteins,” Journal of Theoretical Biology, vol. 468, pp. 1–11. [Google Scholar]
31. S. Ilyas, W. Hussain, A. Ashraf, Y. D. Khan, S. A. Khan et al. (2019). , “iMethylK-PseAAC: Improving accuracy of lysine methylation sites identification by incorporating statistical moments and position relative features into general PseAAC via Chou’s 5-steps rule,” Current Genomics, vol. 20, no. 4, pp. 275–292. [Google Scholar]
32. S. A. Khan, Y. D. Khan, S. Ahmad and K. H. Allehaibi. (2019). “N-MyristoylG-PseAAC: Sequence-based prediction of N-myristoyl glycine sites in proteins by integration of PseAAC and statistical moments,” Letters in Organic Chemistry, vol. 16, no. 3, pp. 226–234. [Google Scholar]
33. D. Khan, A. Batool, N. Rasool, S. A. Khan and K.-C. Chou. (2019). “Prediction of nitrosocysteine sites using position and composition variant features,” Letters in Organic Chemistry, vol. 16, no. 4, pp. 283–293. [Google Scholar]
34. D. Khan, M. Jamil, W. Hussain, N. Rasool, S. A. Khan et al. (2019). , “pSSbond-PseAAC: Prediction of disulfide bonding sites by integration of PseAAC and statistical moments,” Journal of Theoretical Biology, vol. 463, pp. 47–55.
35. S. J. Malebary, M. S. U. Rehman and Y. D. Khan. (2019). “iCrotoK-PseAAC: Identify lysine crotonylation sites by blending position relative statistical features according to the Chou’s 5-step rule,” PloS One, vol. 14, no. 11, pp. e0223993.
36. Y. D. Khan, N. Amin, W. Hussain, N. Rasool, S. A. Khan et al. (2020). , “iProtease-PseAAC (2LA two-layer predictor for identifying proteases and their types using Chou’s 5-step-rule and general PseAAC,” Analytical Biochemistry, vol. 588, pp. 113477. [Google Scholar]
37. R. Carter Kuochen and S. Forsen. (1981). “A new graphical-method for deriving rate-equations for complicated mechanisms,” Chemica Scripta, vol. 18, no. 2, pp. 82–86.
38. K. U. U. Rehman and Y. D. Khan. (2019). “A scale and rotation invariant Urdu nastalique ligature recognition using cascade forward backpropagation neural network,” IEEE Access, vol. 7, pp. 120648–120669. [Google Scholar]
39. C. Kuo-Chen and S. Forsen. (1981). “Graphical rules of steady-state reaction systems,” Canadian Journal of Chemistry, vol. 59, no. 4, pp. 737–755. [Google Scholar]
40. P. K. Meher, T. K. Sahu, V. Saini and A. R. Rao. (2017). “Predicting antimicrobial peptides with improved accuracy by incorporating the compositional, physico-chemical and structural features into Chou’s general PseAAC,” Scientific Reports, vol. 7, no. 1, pp. 1–12. [Google Scholar]
41. S. Xie OuYang, M. J. Berardi, X. Zhao, J. Dev, W Yu et al. (2013). , “Unusual architecture of the p7 channel from hepatitis C virus,” Nature, vol. 498, no. 7455, pp. 521–525. [Google Scholar]
42. A. Dehzangi, R. Heffernan, A. Sharma, J. Lyons, K Paliwal et al. (2015). , “Gram-positive and Gram-negative protein subcellular localization by incorporating evolutionary-based descriptors into Chou’s general PseAAC,” Journal of Theoretical Biology, vol. 364, pp. 284–294. [Google Scholar]
43. J. Dev, D. Park, Q. Fu, J. Chen, H. J. Ha et al. (2016). , “Structural basis for membrane anchoring of HIV-1 envelope spike,” Science, vol. 353, no. 6295, pp. 172–175. [Google Scholar]
44. P. Du, S. Gu and Y. Jiao. (2014). “PseAAC-general: Fast building various modes of general form of Chou’s pseudo-amino acid composition for large-scale protein datasets,” International Journal of Molecular Sciences, vol. 15, no. 3, pp. 3495–3506. [Google Scholar]
45. P. Du, X. Wang, C. Xu and Y. Gao. (2012). “PseAAC-builder: A cross-platform stand-alone program for generating various special Chou’s pseudo-amino acid compositions,” Analytical Biochemistry, vol. 425, no. 2, pp. 117–119. [Google Scholar]
46. X. Du, Y. Diao, H. Liu and S. Li. (2019). “MsDBP: Exploring DNA-binding proteins by integrating multiscale sequence information via Chou’s five-step rule,” Journal of Proteome Research, vol. 18, no. 8, pp. 3119–3132. [Google Scholar]
47. L. Hu, T. Huang, X. Shi, W.-C. Lu, Y.-D. Cai et al. (2011). , “Predicting functions of proteins in mouse based on weighted protein-protein interaction network and protein hybrid properties,” PloS One, vol. 6, no. 1, pp. e14556. [Google Scholar]
48. Z. Ju and S. Y. Wang. (2020). “Prediction of lysine formylation sites using the composition of k-spaced amino acid pairs via Chou’s 5-steps rule and general pseudo components,” Genomics, vol. 112, no. 1, pp. 859–866. [Google Scholar]
49. M. Kabir, S. Ahmad, M. Iqbal and M. Hayat. (2020). “iNR-2L: A two-level sequence-based predictor developed via Chou’s 5-steps rule and general PseAAC for identifying nuclear receptors and their families,” Genomics, vol. 112, no. 1, pp. 276–285. [Google Scholar]
50. Kuo-Chen. (2019). “Artificial intelligence (AI) tools constructed via the 5-steps rule for predicting post-transla-tional modifications,” Trends Artificial Intelligence, vol. 3, no. 1, pp. 60–74. [Google Scholar]
 | This work is licensed under a Creative Commons Attribution 4.0 International License, which permits unrestricted use, distribution, and reproduction in any medium, provided the original work is properly cited. |