DOI:10.32604/cmc.2021.015175
| Computers, Materials & Continua DOI:10.32604/cmc.2021.015175 | |
| Article |
Applying and Comparison of Chaotic-Based Permutation Algorithms for Audio Encryption
1Department of Computer Science, Faculty of Computers and Information, Kafrelsheikh University, Egypt
2Department of Computer Science, College of Computer and Information Sciences, Jouf University, KSA
3Department of Computer Science, Faculty of Computers and Information, Menoufia University, Egypt
*Corresponding Author: Osama M. Abu Zaid. Email: osamabuzaid@yahoo.com, osamaabuzaid@fci.kfs.edu.eg
Received: 09 November 2020; Accepted: 03 January 2021
Abstract: This research presents, and clarifies the application of two permutation algorithms, based on chaotic map systems, and applied to a file of speech signals. They are the Arnold cat map-based permutation algorithm, and the Baker’s chaotic map-based permutation algorithm. Both algorithms are implemented on the same speech signal sample. Then, both the premier and the encrypted file histograms are documented and plotted. The speech signal amplitude values with time signals of the original file are recorded and plotted against the encrypted and decrypted files. Furthermore, the original file is plotted against the encrypted file, using the spectrogram frequencies of speech signals with the signal duration. These permutation algorithms are used to shuffle the positions of the speech files signals’ values without any changes, to produce an encrypted speech file. A comparative analysis is introduced by using some of sundry statistical and experimental analyses for the procedures of encryption and decryption, e.g., the time of both procedures, the encrypted audio signals histogram, the correlation coefficient between specimens in the premier and encrypted signals, a test of the Spectral Distortion (SD), and the Log-Likelihood Ratio (LLR) measures. The outcomes of the different experimental and comparative studies demonstrate that the two permutation algorithms (Baker and Arnold) are sufficient for providing an efficient and reliable voice signal encryption solution. However, the Arnold’s algorithm gives better results in most cases as compared to the results of Baker’s algorithm.
Keywords: Arnold’s cat map; chaotic maps; permutation algorithms; speech encryption; Baker’s chaotic map
We have been in the middle of a technological revolution in recent years, which involves stable and secure multimedia transmission [1–4]. Transmitting speech or audio files via communication networks requires an encryption process, which is vital for conserving files by contra reading, modifying the signals, faking an insert for the signals, or removing part of their tenor.
Speech conversations are considered a vital part of our lifestyle. During the last few years, the fast and extensive growth of network technology has increased speech conversations through the public switch telephone network, cell phones, satellites, and the internet [5–8]. Preventing unauthorized people from eavesdropping is almost impossible when an audio signal is transmitted through the air or unreliable wired connections [7,8].
Leakage prevention is vital due to the regular flow of audio signals worldwide over transmission devices [3,4]. Crypt-analysis activities have rapidly developed. Thus, it is possible for any unauthorized person using the simplest receiver to receive transmitted data. Consequently, the protection of speech interactions has recently become a critical problem [8].
The criteria to meet multimedia protection needs have led to the invention of excellent encryption mechanisms (e.g., chaos-based). Chaos-based encryption mechanisms are considered perfect for practical use because they provide a secured combination of speed, high protection, complexity, rational overhead computing, and computational power [3,4]. Chaotic maps are highly complex nonlinear dynamic systems used in figure correspondence and encryption [3,4,9–12] because they are highly sentient to the initial conditions and can create strong pseudo-random sequences.
The two permutation algorithms are based on Baker’s map [3,13] and Arnold’s map [3,14–16]. These algorithms were used for shuffling voice signals. Shuffling is shifting speech signal locations without altering the values; thus, successful shuffling raises confusion and security.
Both chaotic maps are two-dimensional (2D) chaotic invertible maps. The Baker’s map is a chaotic bijection of a square I unit ( ) onto itself. Baker’s map structure includes a generalized map and discretized map [3]. After applying the two algorithms on an equivalent sample of speech signals, the comparative analysis is introduced using several experimental and statistical analyses for decryption and encryption, such as the time for both procedures, histogram of encrypted speech signals, correlation coefficient (CC) between samples within the original and encrypted signals, spectral distortion (SD) measures, and log-likelihood ratio (LLR) measures.
This paper is arranged as follows: Section 2 presents the chaotic maps (Baker’s chaotic map and Arnold’s cat map) used in our research. Section 3 describes the algorithms’ application on speech signals. Additionally, it discusses speech patterns, spectrograms, and histograms for permuted speech signals. Section 4 examines the measurements and analyses of performing encryption and decryption time, CC, SD, and LLR measures. Section 5 is the conclusion of the paper.
A succinct overview of the two chaotic mapping systems used in this work is clarified in this section. These are Baker’s map and Arnold’s map.
Chaotic map systems are sensible to the initial parameters. If specific parameters are used, the system operates in several orbits, which are complicated and strenuous to analyze and compute. The system output sequences have strong randomness, weak correlation, and unpredictability [8,13].
One of the chaotic map systems that rely on the encryption process’s permutations is Baker’s chaotic map. Chaotic structures use maps to rearrange the elements in the file as a whole or as a file block. Baker’s chaotic map is one of the 2D invertible chaotic maps that has been introduced. We follow Baker’s chaotic map to shuffle locations for speech signals in the audio file. Baker’s map, B, is described in Eq. (1) [13,17,18]:

The map acts on the unit square depicted in Fig. 1. Baker’s chaotic map system is a chaotic bijection of the unit square  onto itself [13,17]. Two versions of Baker’s chaotic map exist: The generalized map and discretized map.

Figure 1: General shape of Baker’s map
In the generalized Baker map, the square is divided into vertical k rectangles instead of dividing the square into two rectangles of the same size, where 
 ,
,  , F0 = 0, whereas
  (Fig. 2). The generalized Baker map extends each rectangle by a factor of 1/pi horizontally. Moreover, the factor pi contracts the rectangle vertically. Finally, all rectangles are stacked on top of each other as illustrated in Fig. 2 and formally as in Eq. (2):


Figure 2: Generalized Baker map
The discretized Baker map is an effective tool for randomizing objects within a square matrix. Let  denote the discretized map, where the [
 ] vector is the secret key, Skey. With N defined as the number of data items in a row, the secret key is chosen where every integer ni is a division of N, where
  . Moreover, let
  . The data item at the indices (r, s), with
  , and
, and  is mapped to
  (r, s) by Eq. (3), where N1 = 0:

The messy permutation is implemented as follows in phases:
1. A square matrix ( ) is split into N of rectangles, each is ni in width and contains N items.
2. Items in every rectangle are reorganized into a row within the produced permutation matrix. Rectangles are possessed from right to left, starting with higher rectangles and then lower ones. For every column within each rectangle, the scan begins from the bottom left corner toward the top items. Fig. 3 offers an instance of an  matrix permutation.

Figure 3: (a) Generalized Baker map. (b) Discretized Baker map
As clarified in Fig. 3, the secret key is selected as (2, 4, 2) (i.e., n1 = 2, n2 = 4, and n3 = 2), whereas N = 8. Fig. 3a displays the generalized Baker map, whereas Fig. 3b depicts the discretized Baker map.
Shang et al. [15] stated that Arnold’s map is a 2D chaotic invertible map. We chose the Arnold cat map system for shuffling locations of speech signal items in the voice file. Without inadequate generality, we estimated the multimedia file dimension as  . (It could be
  .) Arnold’s method is defined in Eq. (4) [15,19,20]:
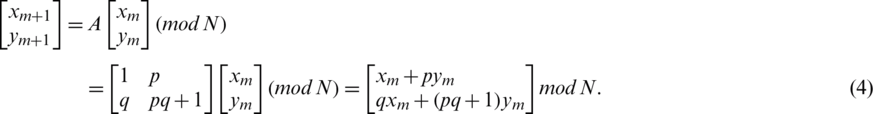
There are positive numbers for p and q, which results in  because (pq + 1) − pq. In addition, (xm+1, ym+1) is the new location of the premier item location (xm, ym) when Arnold’s map is applied one time, in which
  . Upon R repetitions, T as a positive integer exists at which
  . The variable T is based on p, q, and size N parameters of the premier multimedia file (audio or image). Therefore, the parameters p, q and the number of repetitions R can all be employed as private keys.
3 Applying Algorithms on Speech Signals
The outcomes of implementing the two algorithms (based on Baker’s chaotic map system and Arnold’s cat map system) on speech signals are discussed in this section. The premier speech signal file of a time domain is a conversation between women and men. Its samples are demonstrated in Fig. 4, where L is the length of the vector of this speech file, which is equal to 60,416 for this file.

Figure 4: Premier speech signal patterns in the time domain
Fig. 5 clarifies the corresponding spectrograms for premier speech file signals, clarified in Fig. 4.

Figure 5: Spectrograms of the speech signals for premier file
Baker’s algorithm is implemented on the premier speech file three times with different choices for the key (N) each time, where  is represented as [4, 2, 4, 4, 2],
  is represented as [8, 2, 2, 8, 2, 4, 4, 2], and
  is represented as [8, 2, 2, 4, 4, 4, 2, 8, 2, 4, 4, 2, 4, 4, 2, 2, 2, 4]). In addition, Arnold’s algorithm is implemented on the same premier speech file three times at
  ,
,  , and
, and  with different choices for N each time. It also computes another dimension (M), where
  , 32, or 64, and
  for each case (i.e.,
  or L/64, respectively). Fig. 6 illustrates the corresponding histogram of premier speech signals, which is clarified in Fig. 4.

Figure 6: Histogram of the premier speech signal file
The two algorithms were applied with different cases of keys and dimensions on the original speech signals. The results of the speech signal pattern histograms and spectrograms of the permuted speech signals are registered and plotted for each case for each algorithm compared to the plots of the premier speech file clarified in Figs. 4–6.
3.1 Permuted Speech Signal Patterns
Fig. 7 illustrates the permuted speech signals’ patterns for Baker’s algorithm and Arnold’s algorithm in the case of  , in which Fig. 7a depicts the outcome of Baker’s algorithm, and Fig. 7b depicts the outcome of Arnold’s algorithm. Fig. 7 indicates that the permuted speech of Baker’s algorithm is close to the original speech. In contrast, the permuted speech of Arnold’s algorithm is different from the original speech (i.e., the result of applying Arnold’s algorithm is better than the result of applying Baker’s algorithm for
  ).
).

Figure 7: Permuted speech signal patterns in the time domain at N = 16: (a) Baker and (b) Arnold
Fig. 8 displays the permuted speech signal patterns for Baker’s and Arnold’s algorithms for N = 32. Figs. 8a and 8b illustrate the outcome of Baker’s and Arnold’s algorithms, respectively. Fig. 8 clarifies that the permuted speech of Baker’s algorithm is slightly different from the original speech. However, the permuted speech of Arnold’s algorithm is entirely different from the premier speech (i.e., the result of applying Arnold’s algorithm is better than the result of applying Baker’s algorithm for N = 32).
Figure 8: Permuted speech signal patterns in the time domain at N = 32: (a) Baker and (b) Arnold
Fig. 9 conveys the permuted speech signal patterns for Baker’s and Arnold’s algorithms for N = 64, where Figs. 9a and 9b display the outcome of Baker’s and Arnold’s algorithms, respectively. Additionally, Fig. 9 illuminates that the permuted speech of Baker’s algorithm is more confusing than the original speech. However, the permuted speech of Arnold’s algorithm is entirely different from the premier speech (i.e., the result of Arnold’s algorithm is better than the result of Baker’s algorithm for N = 64).

Figure 9: Permuted speech signal patterns in the time domain at N = 64: (a) Baker and (b) Arnold
A spectrogram represents an optical image of the signal frequency spectrum as it varies over time when applied to an audio signal. Additionally, it is usually depicted as an image with the density shown by altering the color or brightness.
Figs. 10–12 illustrate the permuted speech signal spectrograms for Baker’s and Arnold’s algorithms for N = 16, N = 32, and N = 64, respectively. Figs. 10a, 11a, and 12a present the results of Baker’s algorithm, whereas Figs. 10b, 11b, and 12b present the results of Arnold’s algorithm. Figs. 10–12 illustrate the spectrograms of permuted speech of Baker’s algorithm, which are slightly different from the spectrograms of the premier speech for N = 16, N = 32, and N = 64, respectively.
Figure 10: Permuted speech spectrograms in the time domain at N = 16: (a) Baker and (b) Arnold

Figure 11: Permuted speech spectrograms in the time domain at N = 32: (a) Baker and (b) Arnold

Figure 12: Permuted speech spectrograms in the time domain at N = 64: (a) Baker and (b) Arnold
However, the spectrograms of permuted speech for Arnold’s algorithm are entirely different from the premier speech spectrograms for all cases (i.e., implementing Arnold’s algorithm is better than implementing Baker’s algorithm).
The histogram is used for continuous data, whereas bins represent data domains. Additionally, histograms are a convergent portrayal of the distribution of categorical or numerical data. Both encryption procedures are used as permutation methods (scrambling of signal positions) for speech files. The histogram for the permuted speech signal file corresponds to the histogram for the premier speech signal file in Fig. 6 for all situations, except the histogram that applies Baker’s algorithm for N = 64 because the length of the permuted speech signal file is 61,440.
In contrast, the length of the original speech signal file is 60,416. This exceptional case is illustrated in Fig. 13. Thus, Arnold’s algorithm is more stable and efficient than Baker’s algorithm for  . In the decryption phase for both Baker’s and Arnold’s algorithms, all outcomes and plots of patterns of speech signals, spectrograms, and histograms for the decrypted speech files correspond to all signal plots of the premier speech files clarified in Figs. 4–6. Therefore, the decryption process is equally efficient and reliable with the application of the two algorithms.

Figure 13: Histogram of permuted speech signals with Baker’s algorithm at N = 64
4 Empirical Outcomes and Comparative Analysis
The empirical outcomes and comparative study are presented using various empirical and statistical tests for encryption and decryption methods. These tests include the encryption or decryption time, CC between samples of the premier file and signals of the encrypted file, SD test, and LLR test.
4.1 Time of Encryption or Decryption
In this test, the time in seconds for the encryption (permutation) and decryption was estimated for applying both algorithms on the premier speech signal file in all situations of N. Tab. 1 displays the time of encryption or decryption procedures for both algorithms for all N (16, 32, and 64).
Table 1: Results of encryption and decryption time with the Baker and Arnold algorithms
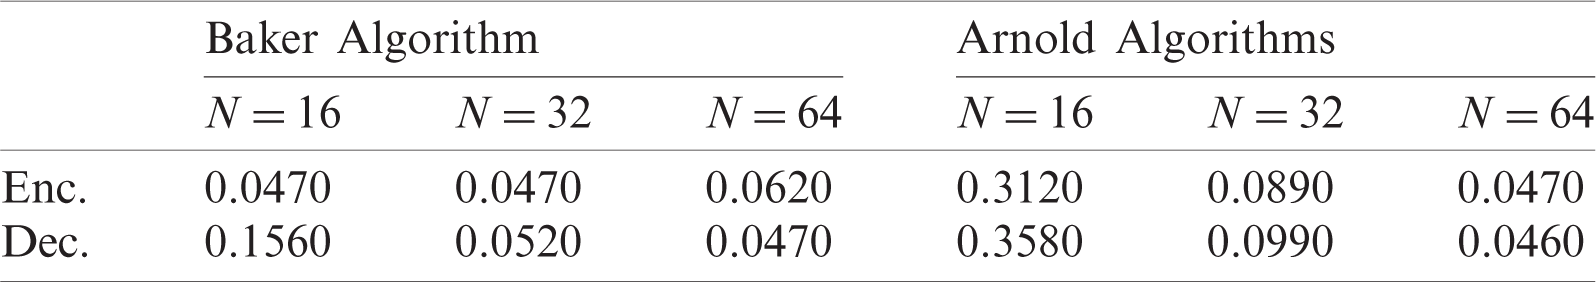
As illustrated in Tab. 1 and Figs. 14 and 15, the execution times for both algorithms’ encryption and decryption procedures are satisfactory and less than 0.36 s. In contrast, the times for encryption and decryption for both algorithms are quite close in most cases of N.

Figure 14: Encryption time for the Baker and Arnold algorithms at N = 16, 32, and 64

Figure 15: Decryption time for the Baker and Arnold algorithms at N = 16, 32, and 64
If premier and encrypted files are extremely dependent, the CC is 1 (i.e., an encryption procedure is unsuccessful in hiding the premier signal information). If the CC is 0, then the premier voice signals and their encryptions are entirely different. Consequently, encryption protocol success means lower CC values [1,4]. The CC is calculated using Eq. (5):

where  . Moreover,
  and
and  are the speech signal values of the premier and encrypted files, respectively.
Tab. 2 displays the encryption outcomes of the CC for both algorithms in all situations of N. Fig. 16 clarifies the outcomes of the CC for encrypted speech signals produced by both algorithms in all situations of N.
Table 2: Correlation coefficient encryption outcomes using the Baker and Arnold algorithms
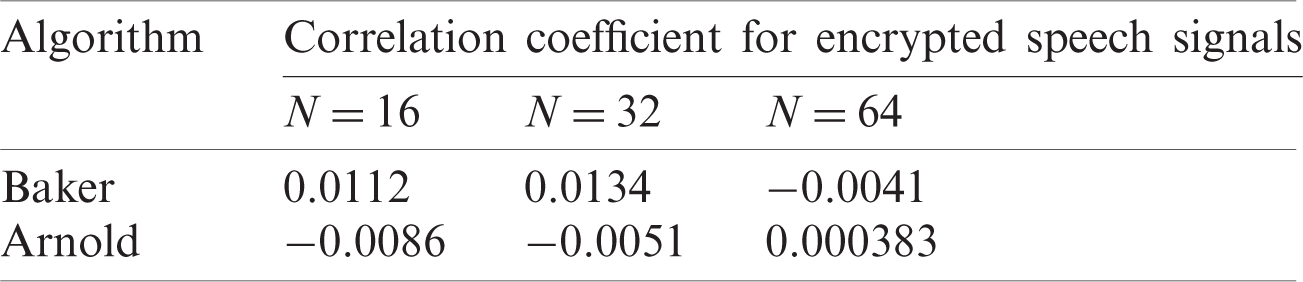

Figure 16: Correlation coefficient (CC) values for the Baker and Arnold algorithms at N = 16, 32, and 64
Tab. 2 and Fig. 16 illustrate that both algorithms (Baker and Arnold) achieve small values (close to 0); thus, both are complicated and efficient algorithms for encrypting voice signals. However, the CC outcomes using the Arnold algorithm are better than those using the Baker algorithm for all situations of N (16, 32, and 64). The CC outcomes for decrypted speech signals is 1 for both algorithms for all cases of N because the decryption of both produces a decrypted speech signal file that completely corresponds to the premier speech signal file.
The SD is a form of measurement implemented in the frequency domain on the frequency spectrum of the premier and encrypted voice signals. It is measured in decibels to show how far the spectrum of encrypted signals is from that of the premier speech signals. It is possible to calculate the SD using Eq. (6) [7,8]:

where Vs(k) is the premier speech signal spectrum in decibels of a specific fraction, Vy(k) is the encrypted and decrypted audio signal spectrum in decibels of the same portion, M is the count of portions, and Ls is the portion longitude. A greater SD between the premier and encrypted files improves the efficiency of the encryption. However, the SD must be as small as possible between the premier file and decrypted file.
Tab. 3 displays the SD measurement results for encrypting with both algorithms in all cases of N. Fig. 17 presents the outcomes of SD for the encrypted speech file, which were generated by the Baker and Arnold algorithms in all situations of N.
Table 3: Spectral distortion outcomes for encrypting with the Baker and Arnold algorithms
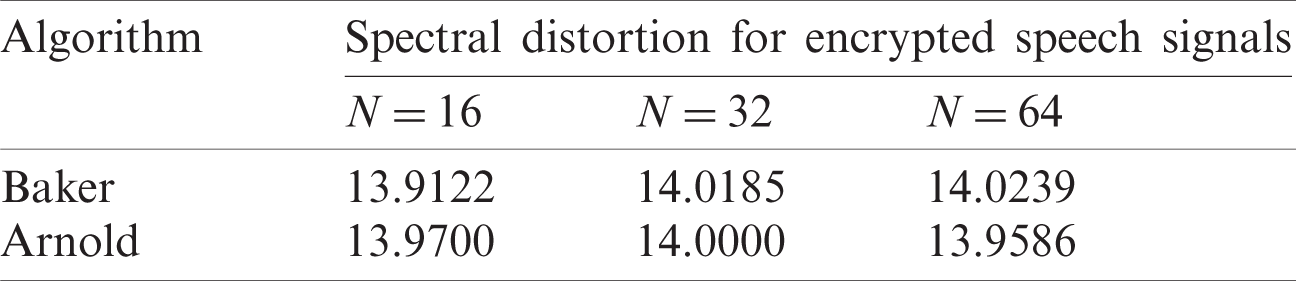

Figure 17: Values of spectral distortion (SD) for the Baker and Arnold algorithms at N = 16, 32, and 64
Tab. 3 and Fig. 17 illustrate that both algorithms accomplish very convergent values for SD in all situations of N (16, 32, and 64), whereas all outcomes are greater than 13.90 (far from 0). Consequently, both algorithms are complicated and efficient for encrypting speech signal files. The outcomes of the SD of decrypted speech signals is 0 for both algorithms for all cases of N because the decryption by both algorithms produces a decrypted speech signal file that completely corresponds to the premier speech signal file.
The LLR metric for speech signals is based on the supposition that every portion can be interpreted using a linear all-pole predictive model as in Eq. (7) [7,8]:

where am (for 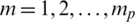 ) are coefficients of the all-polar candidate, Gs is the candidate gain, and u(n) is the perfect source of irritation for the candidate. The voice signal is fenced to form frames that have longitudes of 15 to 30 ms. It is possible to calculate the LLR using Eq. (8) [8]:

where  is the vector of the coefficient for LPCs (
 for the premier clear speech signal),
  is the vector of the coefficient for LPCs (
 for the signals of encrypted or decrypted speech file), and
  is the 2D array of autocorrelation for the signals of the encrypted or decrypted speech file. A greater LLR among the premier and encrypted file signals results in higher competence of the encryption process. In contrast, the nearer the LLR is to zero, the higher the competence of the process of decryption becomes.
Tab. 4 displays the LLR test outcomes for encryption with both algorithms in all cases of N. Fig. 18 presents the outcomes of the LLR for the encrypted speech file signals, which were produced by implementing both algorithms for all values of N. Tab. 4 and Fig. 18 clarify that both algorithms (Baker and Arnold) fulfill the perfect outcomes of the LLR in all situations of N (16, 32, and 64). Thus, both are complicated and efficient algorithms for speech signal encryption; however, the LLR outcomes of the Arnold algorithm are better than those of the Baker algorithm for all situations of N (16, 32, and 64).
Table 4: Log-likelihood ratio for encrypting with the Baker and Arnold algorithms
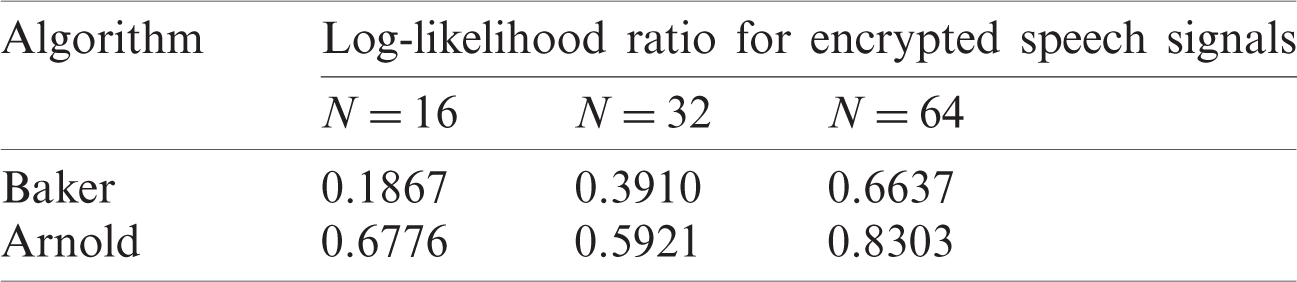

Figure 18: Log-likelihood ratio values for the Baker and Arnold algorithms for N = 16, 32, and 64
The LLR outcomes for the decrypted speech signal file are 0 for both algorithms for all cases of N because the decryption by both algorithms produces a decrypted speech file that entirely corresponds to the premier speech file.
In this paper, two permutation algorithms based on chaotic map systems are discussed. The Baker and Arnold algorithms are implemented on a premier speech file to secure it using a permutation procedure for the signal locations. The permuted speech files generated by implementing both algorithms were examined and compared to each other using the following comparative analyses and empirical tests: the time for encryption and decryption, histogram, CC, SD, and LLR. The encryption/decryption times for both algorithms (Baker and Arnold) are very good and less than 0.36 s, whereas the encryption and decryption times for both are very close in all cases. Both algorithms achieve low (near 0) CC values, but the CC outcomes are better using Arnold’s algorithm than Baker’s algorithm in all situations. Both algorithms achieve very convergent perfect values for SD in all situations.
Additionally, both algorithms attain perfect results for LLR in all situations, but the LLR outcomes are better with Arnold’s algorithm than Baker’s algorithm in all situations. Moreover, permuted speech signal patterns and spectrograms were plotted and compared to the original speech signals, illustrating that Arnold’s algorithm is better and more stable than Baker’s algorithm. The decryption results for both algorithms produce a decrypted speech file that fully corresponds to the premier speech file. The final results reveal that the two permutation algorithms are robust algorithms to provide a productive and settled method to encrypt speech files. However, Arnold’s algorithm provides good results in most cases compared to the results of Baker’s algorithm.
Funding Statement: The authors received no specific funding for this study.
Conflicts of Interest: The authors declare that they have no conflicts of interest to report regarding the present study.
1. N. A. El-Fishawy and O. M. Abu Zaid. (2007). “Quality of encryption measurement of bitmap images with RC6, MRC6, and Rijndael block cipher algorithms,” International Journal of Network Security, vol. 5, no. 3, pp. 241–251. [Google Scholar]
2. S. Tedmori and N. Al-Najdawi. (2012). “Lossless image cryptography algorithm based on discrete cosine transform,” International Arab Journal of Information Technology, vol. 9, no. 5, pp. 471–478. [Google Scholar]
3. O. M. Abu Zaid, N. A. El-fishawy, E. Nigm and O. Faragallah. (2013). “A proposed encryption scheme based on henon chaotic system (PESH) for image security,” International Journal of Computer Applications, vol. 61, no. 5, pp. 29–39. [Google Scholar]
4. O. M. Abu Zaid, N. A. El-fishawy, E. Nigm. (2016). “Encryption quality measurement of a proposed cryptosystem algorithm for the colored images compared with another algorithm,” International Arab Journal of Information Technology, vol. 13, no. 1, pp. 288–290. [Google Scholar]
5. E. Mosa, N. W. Messiha and O. Zahran. (2009). “Random encryption of speech signal,” in Int. Conf. on Computer Engineering & Systems 2009, Cairo, Egypt, pp. 306–311. [Google Scholar]
6. E. Mosa, N. W. Messiha and O. Zahran. (2009). “Random chaotic encryption of speech signals in transform domain,” in Int. Conf. on Computer Engineering & Systems 2009, Cairo, Egypt, pp. 300–305. [Google Scholar]
7. E. Mosa, N. W. Messiha, O. Zahran and F. E. Abd El-Samie. (2010). “Encryption of speech signal with multiple secret keys in time and transform domains,” International Journal of Speech Technology, vol. 13, no. 4, pp. 231–242. [Google Scholar]
8. E. Mosa, N. W. Messiha, O. Zahran and F. E. Abd El-Samie. (2011). “Chaotic encryption of speech signals,” International Journal of Speech Technology, vol. 14, no. 4, pp. 285–296. [Google Scholar]
9. X. Ma, C. Fu, W. Lei and S. Li. (2011). “A novel chaos-based image encryption scheme with an improved permutation process,” IJACT, vol. 3, no. 5, pp. 223–233. [Google Scholar]
10. D. Chen and Y. Chang. (2011). “A novel image encryption algorithm based on logistic maps,” AISS, vol. 3, no. 7, pp. 364–372. [Google Scholar]
11. O. M. Abu Zaid, N. A. El-Fishawy and E. Nigm. (2013). “A proposed permutation scheme based on 3-D chaotic system for encrypting the colored images,” Internation Journal of Computer Science Issues, vol. 10, no. 4, pp. 208–214. [Google Scholar]
12. O. M. Abu Zaid, N. A. El-Fishawy and E. Nigm. (2013). “Cryptosystem algorithm based on chaotic systems for encrypting colored images,” International Journal of Computer Science Issues, vol. 10, no. 4, pp. 215–224. [Google Scholar]
13. H. Alhumyani. (2020). “Efficient image cipher based on Baker map in the discrete cosine transform,” Cybernetics and Information Technologies, vol. 20, no. 1, pp. 68– 81. [Google Scholar]
14. C. Wei-bin and Z. Xin. (2009). “Image encryption algorithm based on Henon chaotic system,” Int. Conf. on Image Analysis and Signal Processing, Taizhou, pp. 94–97, . https://doi.org/10.1109/IASP.2009.5054653. [Google Scholar]
15. Z. Shang, H. Ren and J. Zhang. (2008). “A block location scrambling algorithm of digital image based on Arnold transformation,” The 9th Int. Conf. for Young Computer Scientists, Hunan, 2008, pp. 2942–2947, . https://doi.org/10.1109/ICYCS.2008.99. [Google Scholar]
16. L. Zhu, W. Li, L. Liao and H. Li. (2006). “A novel algorithm for scrambling digital image based on cat chaotic mapping,” Int. Conf. on Intelligent Information Hiding and Multimedia, Pasadena, CA, USA, pp. 601–604, . https://doi.org/10.1109/IIH-MSP.2006.265074. [Google Scholar]
17. C. Fu, W. Li, Z. Meng, T. Wang and P. Li. (2013). “A symmetric image encryption scheme using chaotic Baker map and Lorenz system,” in Ninth Int. Conf. on Computational Intelligence and Security, Leshan, pp. 724–728. [Google Scholar]
18. M. F. Mursi, H. H. Ahmed, F. E. Abd El-samie and A. H. Abd El-aziem. (2013). “A new image encryption scheme based on multiple chaotic systems in different modes of operation,” Advances in Information Science and Applications, vol. II, pp. 487–496. [Google Scholar]
19. A. Bisht, M. Dua, S. Dua and P. Jaroli. (2019). “A color image encryption technique based on bit-level permutation and alternate logistic maps,” Journal of Intelligent Systems, vol. 29, no. 1, pp. 1246–1260. [Google Scholar]
20. A. Savita, P. Singh, A. K. Yadav and K. Singh. (2018). “Asymmetric audio encryption system based on Arnold transform and random decomposition,” Asian Journal of Physics, vol. 27, no. 9–12, pp. 711–719. [Google Scholar]
 | This work is licensed under a Creative Commons Attribution 4.0 International License, which permits unrestricted use, distribution, and reproduction in any medium, provided the original work is properly cited. |