DOI:10.32604/cmc.2021.015470
| Computers, Materials & Continua DOI:10.32604/cmc.2021.015470 | |
| Article |
An Efficient Genetic Hybrid PAPR Technique for 5G Waveforms
1Department of Electronics and Communication Engineering, JECRC University, Jaipur, 303905, India
2Department of Electronics and Communications Engineering, A’Sharqiyah University, Ibra, 400, Oman
3Department of Electrical Engineering, College of Electronics and Information Engineering, Sejong University, Gwangjin-gu, Seoul, 05006, Korea
4Department of Electrical & Computer Engineering, University of Ottawa, Ottawa, ON K1N 6N5, Canada
5School of Telecommunication Engineering, Suranaree University of Technology, Nakhon Ratchasima, Thailand
6College of Computer Engineering and Sciences, Prince Sattam bin Abdulaziz University, Alkharj, 11942, Saudi Arabia
*Corresponding Author: Peerapong Uthansakul. Email: uthansakul@sut.ac.th
Received: 23 November 2020; Accepted: 11 January 2021
Abstract: Non-orthogonal multiple access (NOMA) is a strong contender multicarrier waveform technique for the fifth generation (5G) communication system. The high peak-to-average power ratio (PAPR) is a serious concern in designing the NOMA waveform. However, the arrangement of NOMA is different from the orthogonal frequency division multiplexing. Thus, traditional reduction methods cannot be applied to NOMA. A partial transmission sequence (PTS) is commonly utilized to minimize the PAPR of the transmitting NOMA symbol. The choice phase aspect in the PTS is the only non-linear optimization obstacle that creates a huge computational complication due to the respective non-carrying sub-blocks in the unitary NOMA symbol. In this study, an efficient phase factor is proposed by presenting a novel bacterial foraging optimization algorithm (BFOA) for PTS (BFOA-PTS). The PAPR minimization is accomplished in a two-stage process. In the initial stage, PTS is applied to the NOMA signal, resulting in the partition of the NOMA signal into an act of sub-blocks. In the second stage, the best phase factor is generated using BFOA. The performance of the proposed BFOA-PTS is thoroughly investigated and compared to the traditional PTS. The simulation outcomes reveal that the BFOA-PTS efficiently optimizes the PAPR performance with inconsequential complexity. The proposed method can significantly offer a gain of 4.1 dB and low complexity compared with the traditional OFDM.
Keywords: Wireless networks; 5G; non-orthogonal multiple access; peak to average power ratio; partial transmission sequence; bacterial foraging optimization algorithm
Orthogonal frequency division multiplexing (OFDM) is a modern multicarrier scheme (MCS) utilized in the fourth generation (4G) communication system. However, OFDM possesses several disadvantages, such as loss of bandwidth due to the employment of cyclic prefix, complex calculations due to the frequency error, incapable of handling huge volume of data traffic, and leakage of the spectrum [1]. Non-orthogonal multiple access (NOMA) is an advanced waveform based on the MCS. NOMA is considered an equally strong waveform contender for the fifth generation (5G) communication system. It is expected to play a significant role in enhancing the throughput of the advanced radio system. Yet, it still suffers from a high peak-to-average power ratio (PAPR), and it degrades the power amplifier (PA) performance in the transceiver. In NOMA, sub-carriers are abundant. When a respective number of sub-carriers attained maximum power at a particular moment, the output receptacle of the NOMA signal is increased and results in high PAPR. The PA experiences a serious non-linearity that reduces the BER, PAPR, and OFDM performance [2]. NOMA employs two systems at the transmitter and receiver of the framework: super coding (SC) and successive interference cancellation (SIC). SC helps to access the multiple sub-carriers’ resources simultaneously, and the multiplexing of sub-carriers is accomplished in the power domain. SIC helps users decode their signal by treating other signals as noise and finally cancels the interference caused by other signals. Unlike OFDM, SIC supports multiple numbers of sub-carriers. Even users with poor channel conditions experience proper service due to the increased overall throughput of the NOMA. NOMA can be easily blended with other advanced technologies, such as massive multiple-input and multiple-output (MIMO), Internet of Things, and cognitive radio technology. Several PAPR minimization techniques are explored and studied for the OFDM system [3]. Reduction techniques are classified into three categories, including signal addition schemes [4], coding schemes [5], and probabilistic schemes [6]. The conventional minimization techniques cannot be immediately applied to an advanced waveform NOMA because of the different structure arrangements than OFDM [7,8]. In recent years, numerous studies on performance reduction have been published [9–14]. In the conventional bacterial foraging optimization algorithm (BFOA), the maximum permissible phase factor is w = 2 and 4. In the projected method, w is extended to 2, 4, 8, 16, and 32, for which efficient optimization is achieved. The key objective of BFOA is to search for the best phase factors, which can be weight to the PTS blocks to acquire a low peak power. Still, PAPR minimization approaches in advanced waveform by BFOA for partial transmission sequence (BFOA-PTS) have not yet been investigated. In the initial step, PTS is applied to the NOMA signals, and in the next step, the BFOA phase vectors are weighted to the PTS NOMA symbols. The different combinations of phase factors (w) and sub-blocks are applied to reduce the PAPR of the system. The reduction techniques also degrade the signal’s quality while reducing the signal’s peak power. PAPR may be defined as a random variable that determines the alteration in the peak and average power of an MCS like NOMA [15]. A combination of PTS-PSO is applied to the OFDM framework. The OFDM sub-blocks are multiplied by the perfect phase elements generated by the PSO methods. The findings revealed that the recommended PTS-PSO curtails the peak power and moderates the waveform arrangement [16]. The efficiency of the OFDM structure is greatly enhanced by integrating with MIMO. However, the throughput of the structure is greatly affected due to the increase in peak power. In [17], the increase in peak power is minimized by utilizing the PTS-PSO procedure on the OFDM structure. The experimental results revealed an increase in throughput and peak power performance. The contribution of this study is summarized as follows:
• Projects a peak power minimization algorithm that can be applied to all advanced waveforms.
• Proposes a novel scheme that combines PTS and BFOA to enhance throughput performance.
• The projected method realized a gain of 4.1 dB and low complexity compared with the OFDM.
The rest of this article is organized as follows. The key features and significance of projected system are provided in Section 2. Then, recent regulatory and standard body activities aimed at fostering future wireless systems are described in Section 3.
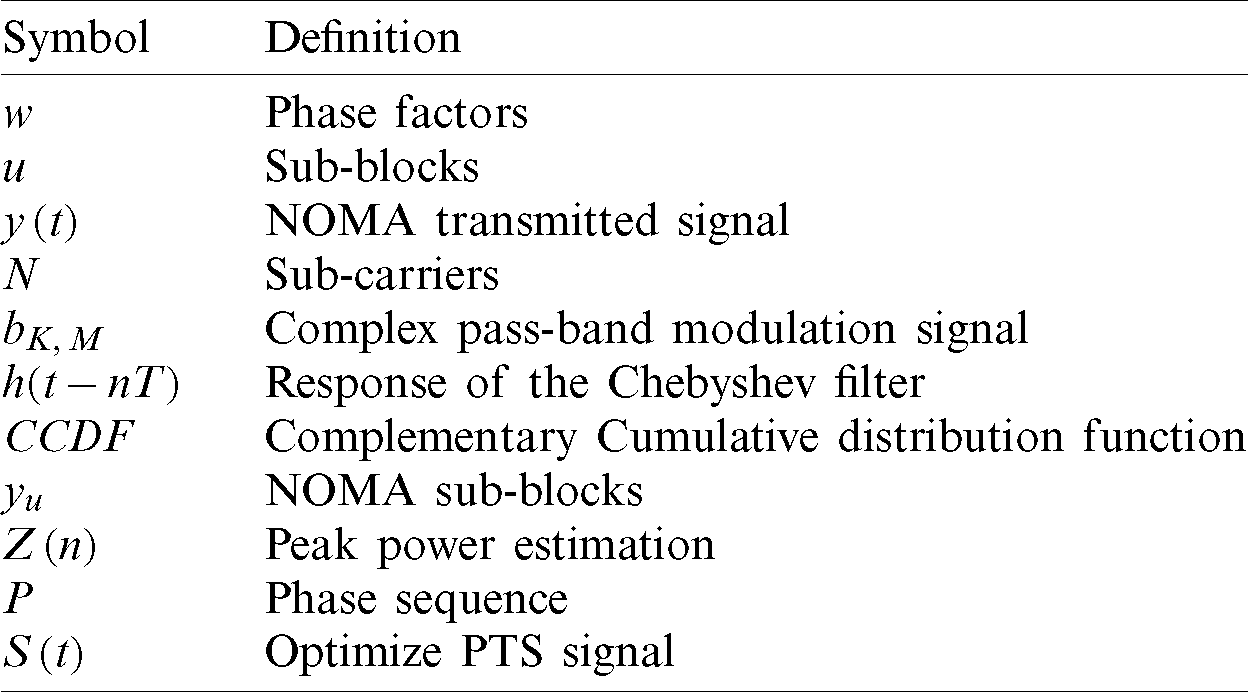
The schematic of NOMA is shown in Fig. 1. The definition of symbols used in this study is summarized in Tab. 1.
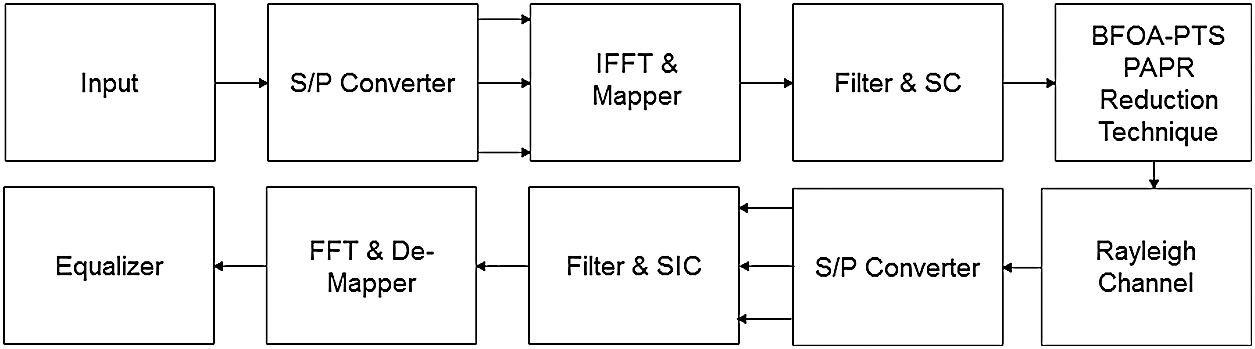
Figure 1: Schematic of the proposed NOMA
Table 1: Definition of symbols
It is designed based on Chebyshev filter, SC, and inverse fast Fourier transforms (IFFT), SIC, and fast Fourier transform (FFT) [18]. The NOMA signal is expressed as

where  is the complex pass-band modulation signal. M is the vector of the NOMA symbol, N is the total number of sub-carriers, and
  .
.
PAPR is deliberated to specify the threshold variation of the peak power of a broadcast signal. Hence, the change in the largest value of the NOMA signal is estimated by PAPR. The complex NOMA signal can be written as

where h(t − nT) is the response of the Chebyshev filter. The PAPR is mathematically expressed in [19] as

Traditionally, PAPR is defined in terms of dB as

The performance of reduction techniques is estimated, and the complementary cumulative distribution function (CCDF) of PAPR is calculated as

BFOA is based on Escherichia coli bacteria proposed by [20]. In the foraging duration, tumble and swim procedures are taken away by the bacteria. The main objective is to upsurge the finest nutrient spot in the pre-set repetition. Chemotaxis is the process in which the number of bacteria (Bn) proceeds by taking a minor bit of a small number of swim steps (Sn). The quality of the present nutrient location is computed and correlated to the former position. If the quality of the present nutrient outperforms the previous one, then the bacteria complete Sn. Otherwise, the location of the preceding bacteria is varied in the operating direction. High-quality nutrient positions are observed by the bacteria after the duration of chemotaxis steps (Cn). Hence, the optimization (O) is achieved at 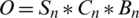 . BFOA involves two supplementary procedures known as replication and eradication circulation. In the reproduction process, the bacteria in N nutrient locations are coordinated in a subside manner and split into two halves (N/2). The bacterial whose fitness is poor will not endure. The bacteria with high fitness is put into identical nutrient positions for upcoming replication steps (Rs). After replication, an eradication circulation process grounded on eradication probability (Ep) is applied. Afterward, some bacteria are randomly selected and set in the nutriment locations for further repetition. The efficient nutrient position is enhanced by the fittest bacteria [21,22].
The schematic of the proposed BFOA-PTS is shown in Fig. 2. In the PTS technique, the input blocks are divided into U sub-blocks. The sub-blocks are conglomerate with low peak power by employing the phase sequence based on BFOA. All NOMA signals have lower PAPRs than the primary NOMA signal. Thus, the throughput is improved significantly with minimal spectrum leakage.
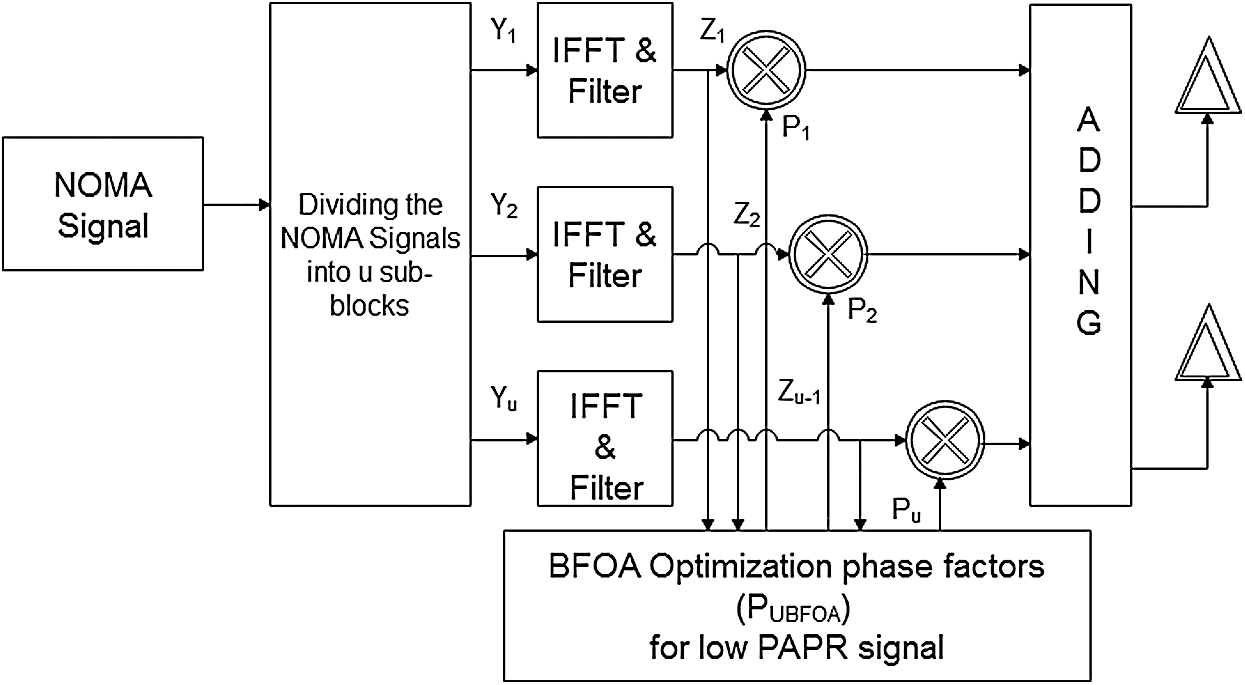
Figure 2: Proposed hybrid method
Step 1: Divide NOMA signal into U sub-blocks:

Step 2: Estimate the NOMA transmission signal’s peak power by converting the frequency domain to the time domain. Utilize the IFFT in the projected structure to divide the NOMA symbol into numerous sub-blocks. Employ it as an analysis filter. Applying IFFT on yu to estimate the peak power is given as

Step 3: Apply the filtering techniques to the group of sub-carriers for the signal separation, interference avoidance, and leakage reduction of the spectrum. Apply the Chebyshev filter to Z(n):

Step 4: Use BFOA to generate the phase factor for which low PAPR value is accomplished [23,24]:

where  , and
, and  . Pu is represented in terms of vector W given as:

In the proposed method, the food nutrient is analogous to the phase sequence:

where  . WU −1 combinations can be considered to find the ideal
  for which the least value of peak power is achieved, as shown in Eqs. (9), (9.1), and (9.2).
Step 5: Multiply the NOMA signals to the different values of phase factors to obtain a low peak power signal. Optimize the PTS signal Z(t) by multiplying with PuBFOA:

Step 6: Determine the minimum PAPR NOMA. Obtain the least PAPR value of the NOMA signal by selecting different combinations of  as
as

The present work is analyzed using MATLAB. The constraints used in the model are shown in Tab. 2. In the traditional approach, the phase factor is restricted to w = 2 and 4. In the projected method, w can be selected as equivalent to the number of sub-blocks. Therefore, the peak power can be decreased by increasing the size of u and w.
Table 2: Simulation parameters.

The number of multiplications required in the projected method is WU −1. The required multiplication and addition for PTS are 4N(NU + NV + 2VV) and 2N(2NV + 2(2VV − V −2V)) and for SLM-CT are  and
and  . Here, V is the number of sub-blocks, N is the total number of sub-carriers, and V is phase factors [25]. In terms of complexity, BFOA outperforms traditional techniques. In this study,
  and
and  are selected for the simulation. The time-domain NOMA signal is presented in Fig. 3.
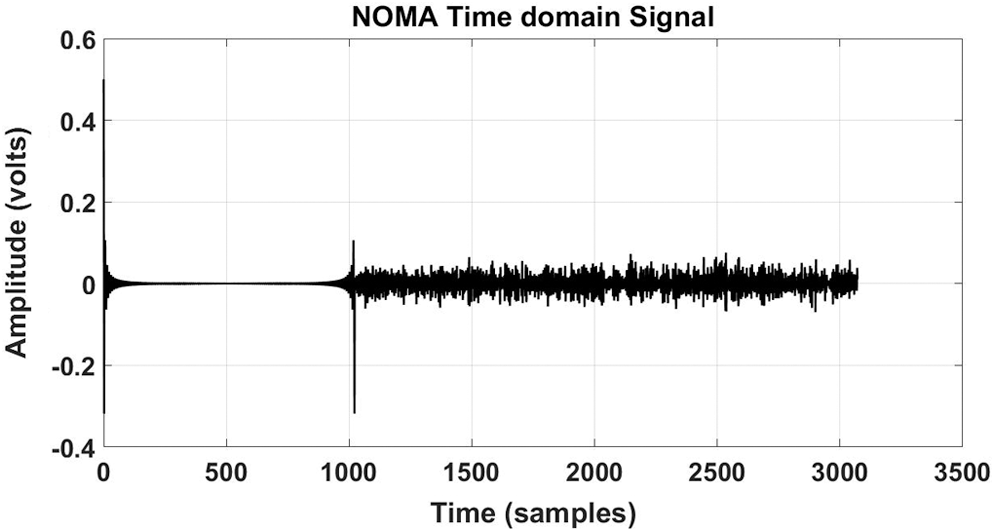
Figure 3: NOMA time-domain signal
The performance of the projected work is evaluated. The CCDF of NOMA PAPR for u = 16 is shown in Fig. 4. At 10−3 CCDF, the efficiency of 16.6% in the PAPR is achieved by the PTS. The efficiencies of 33%, 35%, 48%, 62.5%, and 67% are observed for  ,
,  ,
,  ,
,  , and
, and  are observed, respectively. The ideal PAPR performance is achieved when
  .
.
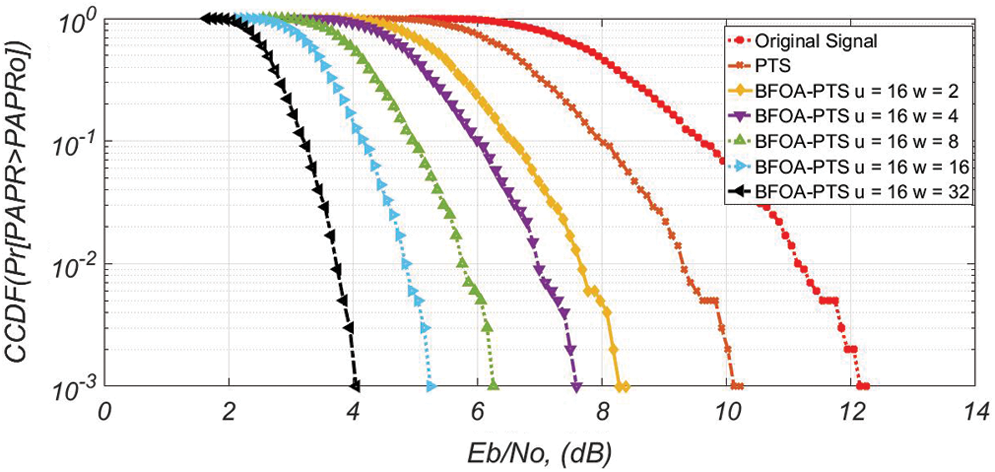
Figure 4: PAPR efficiency for u = 16
The CCDF of NOMA PAPR for u = 32 is shown in Fig. 5. At 10−3 CCDF, the efficiencies of 16.6%, 35%, 41%, 50%, 66.6%, and 83.3% are observed for PTS when  ,
,  ,
,  ,
,  ,
,  , respectively. The optimal PAPR performance is also observed when
  . Thus, the proposed PTS-BFOA outperforms conventional PTS.
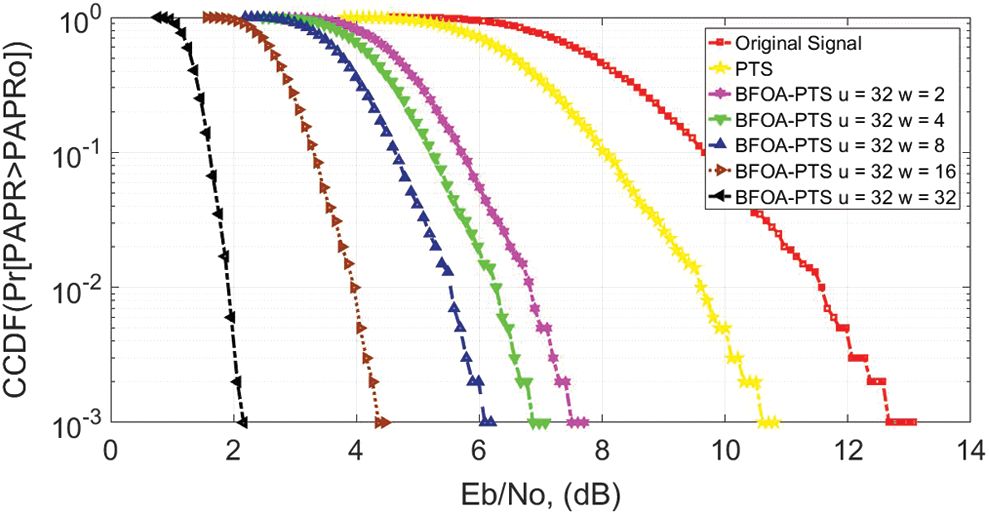
Figure 5: PAPR efficiency for u = 32
The throughput of the filter bank multicarrier (FBMC) is analyzed, and the BER graph is depicted in Fig. 6. The BER of the FBMC without introducing BFOA-PTS is 10−3 at 12 dB SNR. At 10−3 dB, the gains of 2.2, 4.06, 5.8, 6.6, 7.8, and 9 dB are achieved for PTS when  ,
,  ,
,  ,
,  , and
, and  , respectively, different from the 12 dB original signal. The best throughput is observed when
  .
.
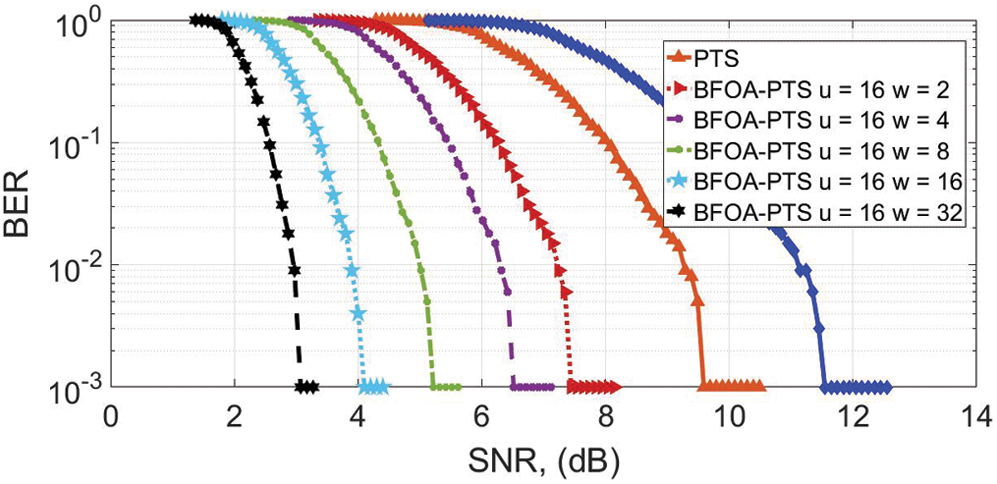
Figure 6: BER for u = 16
At the BER of 10−3, the gain of 2.4 dB is achieved for PTS, as shown in Fig. 7. The gains of 5.9, 6.2, 8, 9, and 9.9 dB are achieved for BFOA-PTS when  ,
,  ,
,  ,
,  , and
, and  , respectively, different from the 12 dB original signal.
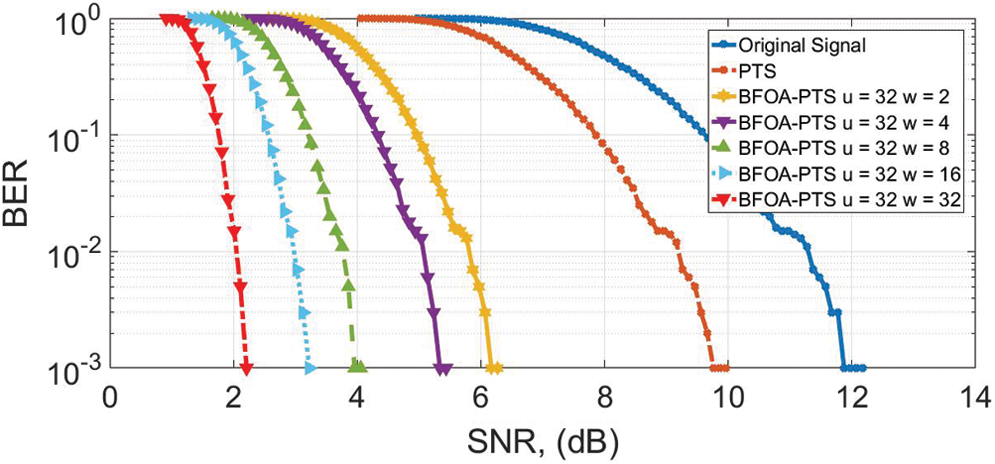
Figure 7: BER for u = 32
At 10−3 CCDF, the PAPR of NOMA and OFDM is 12 and 13.2 dB, without applying the reduction algorithm, as shown in Fig. 8. At 10−3 CCDF, the PAPR is reduced to 2.9 dB for FBMC-BFOA-PTS  and 6.2 dB for OFDM-BFOA-PTS
  .
.
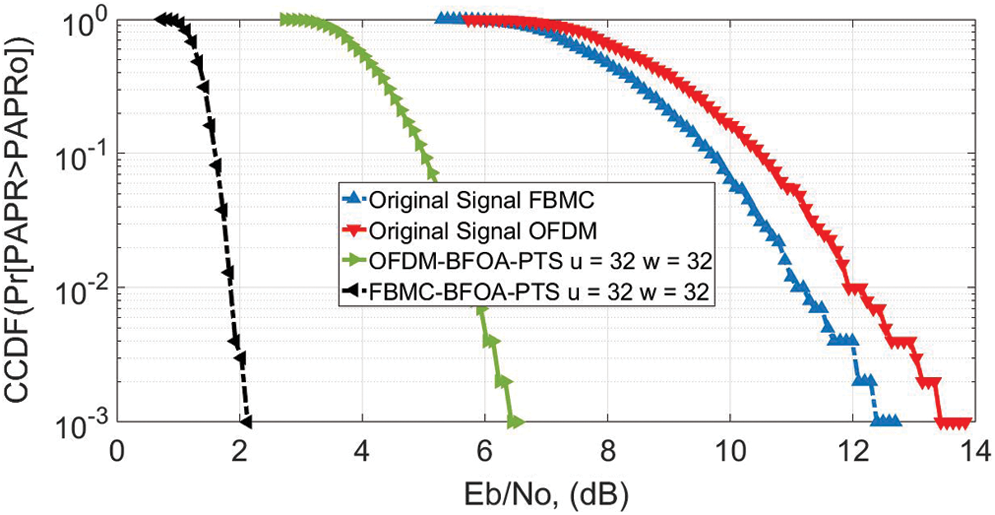
Figure 8: PAPR for u = 32; OFDM vs. FBMC
At the BER of 10−3, the SNR of NOMA and OFDM is 12 and 13.2 dB, without applying the reduction algorithm, as shown in Fig. 9. The BER of 10−3 is accomplished at 2.1 dB for FBMC-BFOA-PTS 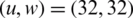 and 4.9 dB for OFDM-BFOA-PTS
  .
.
Figure 9: BER for u = 32; OFDM vs. FBMC
A novel PTS-BFOA PAPR minimization method attuned with advanced 5G waveform techniques is proposed in this study. The proposed method is grounded along with the combination of PTS and BFOA. The PAPR minimization is accomplished in a two-stage process. In the initial stage, PTS is applied to the NOMA signal, resulting in the partition of the NOMA signal into an act of sub-blocks. In the second stage, the best phase factor is generated using BFOA. The sub-blocks are weighted with different combinations of WU −1, where low PAPR is obtained. Therefore, the PAPR performance is enhanced, and complexity is reduced by selecting different values of u and w.
Acknowledgement: The authors would like to thanks the editors of CMC and anonymous reviewers for their time and reviewing this manuscript. Also, this work was supported by the Deanship of Scientific Research at Prince Sattam bin Abdulaziz University, Saudi Arabia.
Funding Statement: This research was supported by SUT Research and Development Fund.
Conflicts of Interest: The authors declare that they have no conflicts of interest to report regarding the present study.
1. Y. Wu and W. Y. Zou. (1995). “Orthogonal frequency division multiplexing: A multi-carrier modulation scheme,” IEEE Transactions on Consumer Electronics, vol. 41, no. 3, pp. 392–399. [Google Scholar]
2. Z. Wu, K. Lu, C. Jiang and X. Shao. (2018). “Comprehensive study and comparison on 5G NOMA schemes,” IEEE Access, vol. 6, pp. 18511–18519. [Google Scholar]
3. A. M. Rateb and M. Labana. (2019). “An optimal low complexity PAPR reduction technique for next generation OFDM systems,” IEEE Access, vol. 7, pp. 16406–16420. [Google Scholar]
4. P. Mishra and M. U. Amin. (2018). “PAPR reduction in OFDM using various coding techniques,” International Journal of Wireless and Mobile Computing, vol. 15, no. 1, pp. 16–20. [Google Scholar]
5. F. Sandoval, G. Poitau and F. Gagnon. (2017). “Hybrid peak-to-average power ratio reduction techniques: Review and performance comparison,” IEEE Access, vol. 5, pp. 27145–27161. [Google Scholar]
6. B. M. Lee and Y. Kim. (2013). “An adaptive clipping and filtering technique for PAPR reduction of OFDM signals,” Circuits Systems, and Signal Processing, vol. 32, no. 3, pp. 1335–1349. [Google Scholar]
7. M. H. Alsharif, A. H. Kelechi, M. A. Albreem, S. A. Chaudhry, M. S. Zia et al. (2020). , “Sixth generation (6G) wireless networks: Vision, research activities, challenges and potential solutions,” Symmetry, vol. 12, no. 4, pp. 676. [Google Scholar]
8. A. Kumar and H. Rathore. (2019). “Modified DSLM technique for PAPR reduction in FBMC system,” Radio electronic Communication System, vol. 62, no. 8, pp. 416–421. [Google Scholar]
9. M. A. Aboul-Dahab, M. M. Fouad and R. A. Roshdy. (2019). “Generalized discrete Fourier transform for FBMC peak to average power ratio reduction,” IEEE Access, vol. 7, pp. 81730–81740. [Google Scholar]
10. H. Rathore and A. Kumar. (2020). “Reduction of peak average power ratio for FBMC waveform with P-PTS technique,” International Journal of Sensors, Wireless Communications and Control, vol. 10, no. 1, pp. 47–54. [Google Scholar]
11. A. Kumar and M. Gupta. (2019). “Peak average power reduction in NOMA by using PTSCT technique,” Recent Patents on Computer Science, vol. 13, no. 3, pp. 502–507. [Google Scholar]
12. X. He, L. Ling, Y. Zhou, S. Chen and Y. Yang. (2019). “Novel RAPF scheme and its performance of PAPR reduction and BER in FBMC-OQAM system,” IET Communications, vol. 13, no. 13, pp. 1916–1920. [Google Scholar]
13. D. Na and K. Choi. (2018). “Low PAPR FBMC,” IEEE Transactions on Wireless Communications, vol. 17, no. 1, pp. 182–193. [Google Scholar]
14. M. Laabidi and R. Bouallegue. (2019). “Three implementations of the tone reservation PAPR reduction scheme for the FBMC/OQAM system,” IET Communications, vol. 13, no. 7, pp. 918–925. [Google Scholar]
15. S. Gökceli, T. Levanen, T. Riihonen, M. Renfors and M. Valkama. (2019). “Frequency-selective PAPR reduction for OFDM,” IEEE Transactions on Vehicular Technology, vol. 68, no. 6, pp. 6167–6171. [Google Scholar]
16. J. Liu, Y. Li, G. Song and Y. Sun. (2019). “Detection and analysis of symbol-asynchronous uplink NOMA with equal transmission power,” IEEE Wireless Communications Letters, vol. 8, no. 4, pp. 1069–1072. [Google Scholar]
17. P. Yang, Y. Xiao, M. Xiao and S. Li. (2019). “6G wireless communications: Vision and potential techniques,” IEEE Network, vol. 33, no. 4, pp. 70–75. [Google Scholar]
18. Q. Zhang, H. Chen, J. Luo, Y. Xu, C. Wu et al. (2018). , “Chaos enhanced bacterial foraging optimization for global optimization,” IEEE Access, vol. 6, pp. 64905–64919. [Google Scholar]
19. S. Mumtaz, J. M. Jornet, J. Aulin, W. H. Gerstacker, X. Dong et al. (2017). , “Terahertz communication for vehicular networks,” IEEE Transactions on Vehicular Technology, vol. 66, no. 7, pp. 5617–5625. [Google Scholar]
20. J. Zhang, Z. Cui, Y. Wang, H. Wang, X. Cai et al. (2019). , “A coupling approach with GSO-BFOA for many objective optimization,” IEEE Access, vol. 7, pp. 120248–120261. [Google Scholar]
21. A. S. Cacciapuoti, K. Sankhe, M. Caleffi and K. R. Chowdhury. (2018). “Beyond 5G: THz-based medium access protocol for mobile heterogeneous networks,” IEEE Communications Magazine, vol. 56, no. 6, pp. 110–115. [Google Scholar]
22. J. F. Harvey, M. B. Steer and T. S. Rappaport. (2019). “Exploiting high millimeter wave bands for military communications, applications, and design,” IEEE Access, vol. 7, pp. 52350–52359. [Google Scholar]
23. D. M. Mittleman. (2018). “Twenty years of terahertz imaging,” Optics Express, vol. 26, no. 8, pp. 9417–9431. [Google Scholar]
24. M. Paul, G. Sanyal, D. Samanta, G. N. Nguyen and D. N. Le. (2018). “Admission control algorithm based on the effective bandwidth in vehicle-to-infrastructure communication,” IET Communications, vol. 12, no. 6, pp. 704–711. [Google Scholar]
25. S. Abadal, C. Han and J. M. Jornet. (2020). “Wave propagation and channel modeling in chip-scale wireless communications: A survey from millimeter-wave to terahertz and optics,” IEEE Access, vol. 8, pp. 278–293. [Google Scholar]
 | This work is licensed under a Creative Commons Attribution 4.0 International License, which permits unrestricted use, distribution, and reproduction in any medium, provided the original work is properly cited. |