DOI:10.32604/cmc.2021.015872
| Computers, Materials & Continua DOI:10.32604/cmc.2021.015872 | |
| Article |
Machine Learning-based USD/PKR Exchange Rate Forecasting Using Sentiment Analysis of Twitter Data
1Department of Computer Science & IT, Glim Institute of Modern Studies, Bahawalpur, 63100, Pakistan
2Institute of Numerical Sciences, Kohat University of Science & Technology, Kohat, 26000, Pakistan
3Department of Computer Science, Concordia College Bahawalpur, Bahawalpur, 63100, Pakistan
4Institute of Computing, Kohat University of Science and Technology, Kohat, 26000, Pakistan
5Faculty of Applied Studies, King Abdulaziz University, Jeddah, 21577, Saudi Arabia
6Department of Statistics, The Islamia University of Bahawalpur, Bahawalpur, 63100, Pakistan
7Department of Mathematics, Université de Caen, LMNO, Campus II, Science 3, Caen, 14032, France
*Corresponding Author: Wali Khan Mashwani. Email: mashwanigr8@gmail.com
Received: 11 December 2020; Accepted: 14 January 2021
Abstract: This study proposes an approach based on machine learning to forecast currency exchange rates by applying sentiment analysis to messages on Twitter (called tweets). A dataset of the exchange rates between the United States Dollar (USD) and the Pakistani Rupee (PKR) was formed by collecting information from a forex website as well as a collection of tweets from the business community in Pakistan containing finance-related words. The dataset was collected in raw form, and was subjected to natural language processing by way of data preprocessing. Response variable labeling was then applied to the standardized dataset, where the response variables were divided into two classes: “1” indicated an increase in the exchange rate and “ −1” indicated a decrease in it. To better represent the dataset, we used linear discriminant analysis and principal component analysis to visualize the data in three-dimensional vector space. Clusters that were obtained using a sampling approach were then used for data optimization. Five machine learning classifiers—the simple logistic classifier, the random forest, bagging, naïve Bayes, and the support vector machine—were applied to the optimized dataset. The results show that the simple logistic classifier yielded the highest accuracy of 82.14% for the USD and the PKR exchange rates forecasting.
Keywords: Machine learning; exchange rate; sentiment analysis; linear discriminant analysis; principal component analysis; simple logistic
Sentiment analysis is the process of identifying the general sentiment in a given text in an automated fashion. It consists of ranking the opinions expressed in the text to determine whether the relevant attitude has a positive, negative, or neutral tone [1]. In recent years, sentiment analysis has received considerable attention, not only from scientific researchers, but also from practitioners in marketing and advertising. This development can be attributed to recent advances in online social networks and the speed of information relay [2]. In particular, large amounts of data are gleaned from social media to analyze sentiments. Indeed, to obtain information reflecting the mood at any given time, we need to collect the relevant social media posts containing heterogeneous views. It is useful to analyze the content of popular social media platforms, such as Facebook, Twitter, and LinkedIn. Analyzing posts within a given time frame can help determine general public opinion on a specific topic [3].
The currency exchange rate is defined as the price of one currency as expressed in another. This is continually determined in the everchanging financial market by determining the supply of and demand for a given currency. The current system is based on a regime of floating change, and is characterized by the freedom to change currency rates in financial markets [4].
The variation in the rate of change in currency is driven by many economic determinants. Among them is economic growth—whereby a country records an increase in economic transactions that increase the demand for its currency but this does not always lead to an appreciation in its exchange value—expected inflation—whereby the price of a basket of basic goods in foreign currency should be the same as that in the local currency [5], such that the exchange rate of the currency of a country with rising inflation depreciates—the current account—an economic aggregate that reflects trade imbalances between a country and the rest of the world [6], where a current account surplus normally leads to an appreciation in the exchange value of the currency, and the opposite obtains in case of a current account deficit—the interest rate differential—whereby ever more players intervene in the changing market by making trade-offs between the levels of remuneration offered by different countries and their central banks—and central bank interventions, according to which central banks around the world provide quantitative support for national monetary policies [7].
In this study, we focus on exchange rate content available on Twitter. In brief, Twitter is a so-called “microblogging” social network with 350 million monthly active users that allows for communication in the form of messages not exceeding 280 characters, called “tweets” [8]. These messages are not addressed to a particular person but to all subscribers (“followers”) of the person sending the message (it is also possible to send a private message to a specific user). The principle is simple: Type the message and tap “Tweet” to broadcast it to your followers. A notification appears in your device’s status bar and disappears once your tweet has been posted. The major attraction here is immediacy: One can get real-time information and broadcast it instantly. Twitter allows users to share information quickly, which is crucial to the exchange of opinions in real time. Of course, Twitter is also an important customer service tool [9].
The three major benefits of sentiment analysis on Twitter are scalability, real-time analysis, and consistency of criteria. “Scalability” allows for the analysis of many tweets mentioning a specific topic [10]. Some manual tasks can also be automated to scale the tools for sentiment analysis as the amount of data grows, thus delivering valuable insights in real time. Real-time analysis is essential for monitoring sudden changes in the public mood. In particular, it is useful for determining if negative reviews, of a given product or service, are on the rise and taking appropriate action before the problem worsens. Moreover, real-time analytics includes the real-time tracking of brand mentions on Twitter using sentiment analysis. The criteria used are consistent because machine learning models can be used for sentiment analysis using a precise set of rules. In this way, Twitter data can be labeled consistently, thus avoiding inconsistencies resulting from human error [11].
The proposed study makes the following contributions:
• Tweet preprocessing: For this purpose, various means of natural language processing (NLP) are employed to preprocess the extracted dataset, such as removing irregular terms, accepting English tweets only, and extracting, lemmatizing, and removing stop words.
• Data labeling: To label the dataset, we use the Natural Language Toolkit (NLTK) Python library [12], which assigns numerical sentiment scores (on a negative-to-positive scale) to the data.
• Visualization: This process is used to better understand and represent the data for analysis. We use linear discriminant analysis (LDA) [13] followed by principal component analysis (PCA) [14] to project high-dimensional data in low dimensions.
• Machine learning approach: Supervised machine learning (ML) classifiers are used to build the simple logistic (SL), random forest (RF), bagging (B), naïve Bayes (NB), and support vector machine (SVM) classification models through a cluster obtained using a sampling approach.
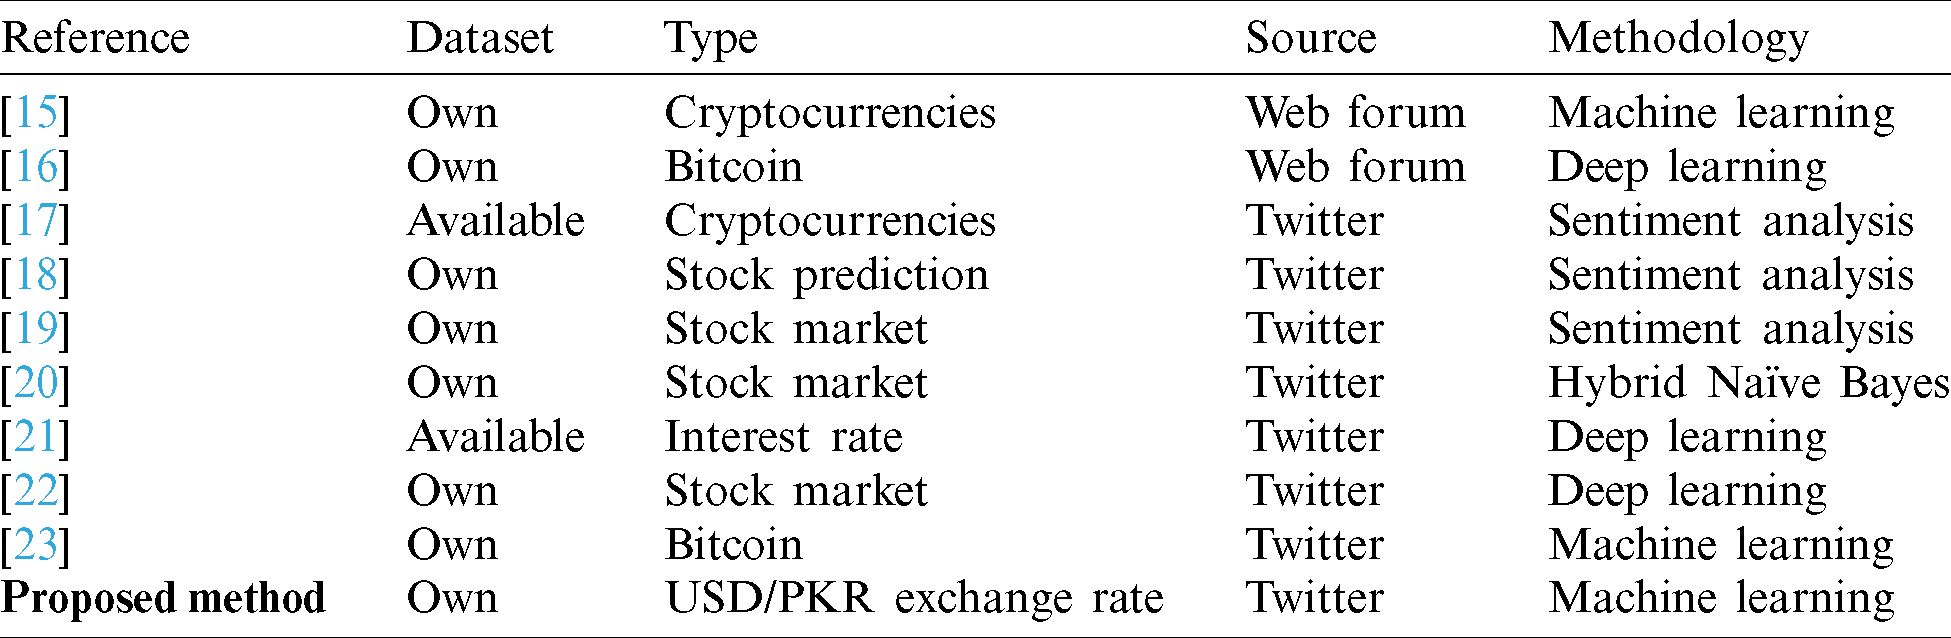
No study to date has considered forecasting the United States Dollar (USD) and the Pakistani Rupee (PKR) exchange rate. Indeed, most relevant research has engaged in exchange rate forecasts for other currencies as well as bitcoin forecasts [15–23]. Some of them are presented in Tab. 1.
Table 1: Past work in the relevant areas of finance
2 Material and Data Collection
This study aims to forecast the exchange rate between the United States Dollar (USD) and the Pakistani rupee using tweets from Twitter. For this purpose, first, we scraped a publicly available exchange rate dataset from the Pakistani Forex website (http://www.forex.com.pk) based on the exchange rate between the USD and the Pakistani rupee via a Python library called Scrapy. The exchange rates were collected from January 1, 2015 to January 1, 2020.
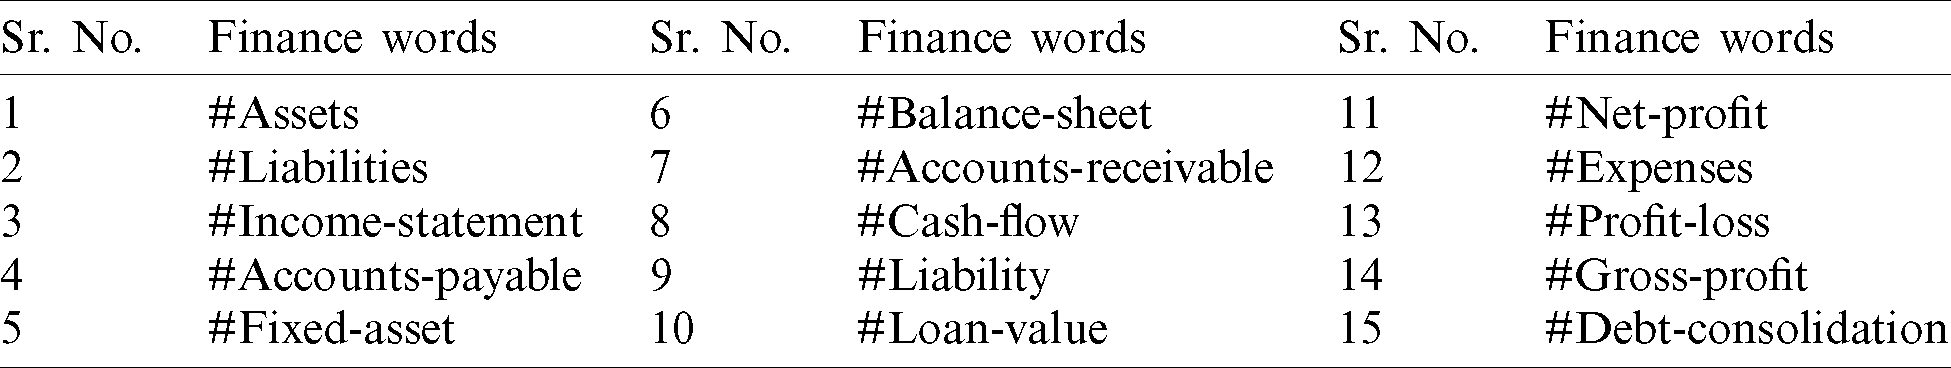
Second, we collect a dataset based on the Twitter timeline (https://www.twitter.com) containing tweets from the Pakistani business society, the Ministry of Finance, politicians, and the State Bank of Pakistan using the Python library Tweepy. A total of 7,800 samples were collected. Twitter provides text analysis using various parameters of tweets to the research community. Tweets can be scraped using a query-based method or a targeted user. We used targeted users with specific financial terms, like “cash flow,” “profit and loss,” “income statement,” and “net profit,” as described in Tab. 2.
Table 2: Trending financial terms gleaned from social media
We now detail the proposed method. In the first step, we collected data for the exchange rate dataset and finance-related tweets, and subjected them to natural language processing (NLP) by way of data preprocessing/data standardization. Response variable labeling process was then applied to the standardized dataset. In the second step, we applied the linear discriminant analysis (LDA) and principal component analysis (PCA) for data visualization. This helped us determine the reliability of the dataset. Finally, we used five machine learning classifiers—simple logistic (SL), random forest (RF), bagging (B), naïve Bayes (NB), and support vector machine (SVM)—through a cluster obtained from a sampling-based approach. The proposed methodology is shown in Fig. 1.
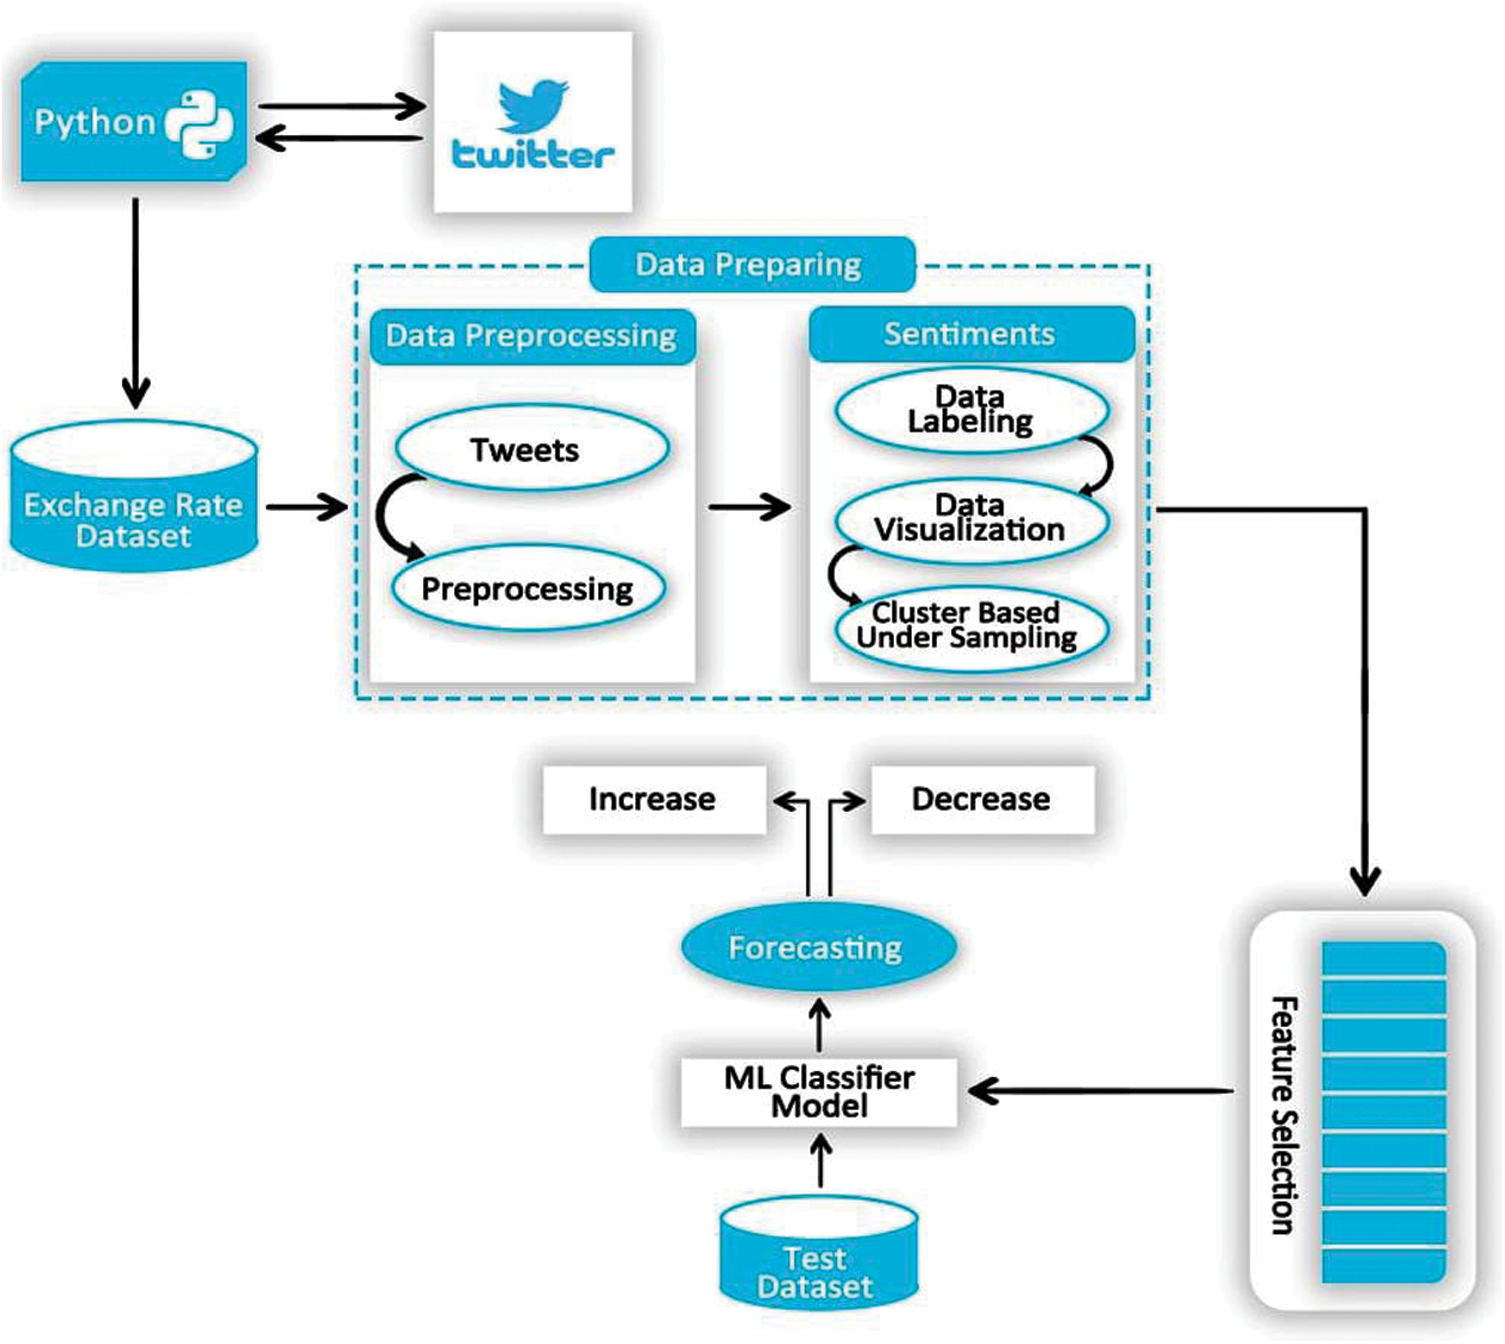
Figure 1: Proposed framework for USD/PKR exchange rate forecasting using Twitter data and sentiment analysis based on machine learning
The extracted dataset was in raw format, and contained a large amount of noise, such as special symbols and hyperlinks. To extract sentiments from it, we needed a noise-free dataset. Therefore, natural language processing (NLP) was used to preprocess the dataset by removing irregular terms, accepting English tweets only, and extracting, lemmatizing, and removing stop words [24]. This process is shown in Fig. 2.
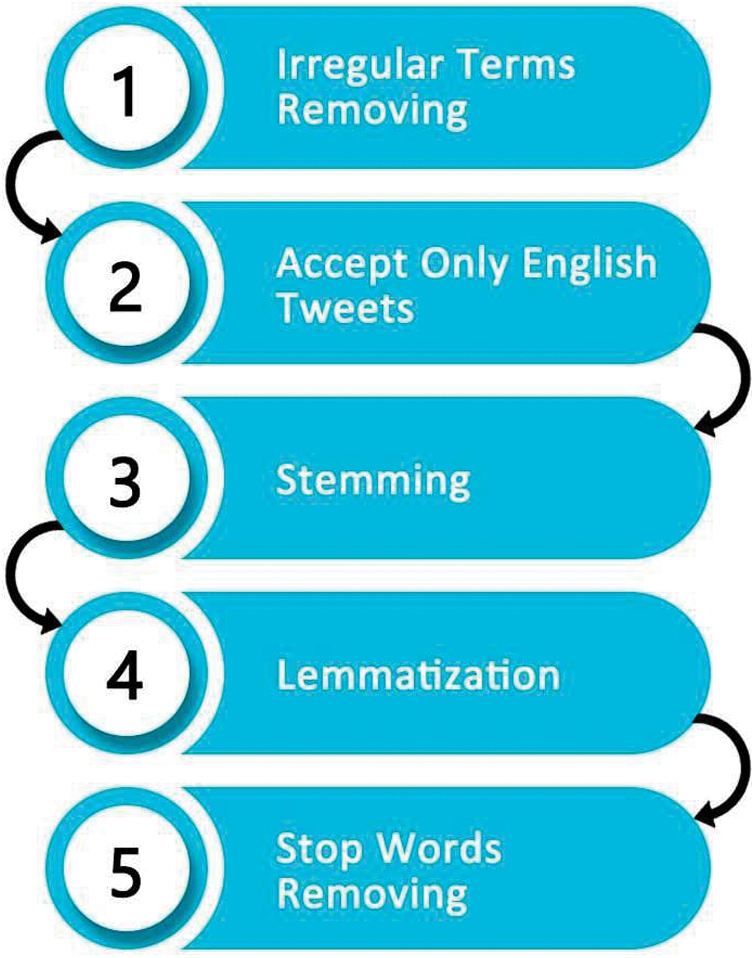
Figure 2: Steps of data preprocessing
2.2.1 Removing Irregular Terms
The Twitter data contained unstructured text with a large amount of noise, such as HTML tags, accented characters, special characters, numerical values, hyperlinks, extra-wide spaces and tabs, and emojis. This noise affects sentiment analysis. Such noise was thus removed to more easily find the desired data.
2.2.2 Accepting Only English Tweets
English is an international language spoken across the world. Most of the business community in Pakistan also uses English on social media platforms like Twitter. We thus considered only English-language tweets in this study.
The process of relating a derived word to its root state is called stemming. We applied the table approach to it, which reduces instances of “s,” “es,” “ed,” and “ing” from the end of words. This process l the standardization of textual data.
Lemmatization is an advanced form of stemming that considers the “morphological analysis” of words. The output we will get after lemmatization is called ‘lemma’, which is a root word rather than root stem, the output of stemming. After lemmatization, we will be getting a valid word that means the same thing. The tweets to be extracted were financial terms, and we used Python’s Lemmatize Sentence library for this.
The process of removing words that are supplied to render expressions grammatical but contain no information, such as “a,” “is,” “an,” “the,” and “and,” is called stop word removal. These stop words are of minimal importance, and occur in large quantities in open text, articles, and comments. We removed such words by using the nltkCorpus ML algorithm.
To label the dataset, we used the Natural Language Toolkit (NLTK) from the Python library to provide a numerical sentiment score (on a negative-to-positive scale) to the data. We assign the value “1” to a tweet if it indicated an increase in the exchange rate and “ −1” if it indicated a decreasing exchange rate. If a tweet expressed both scenarios, we assigned it the value “0” to indicate that it was a neutral tweet, as shown in Tab. 3.
Table 3: Response variable value setting scenarios
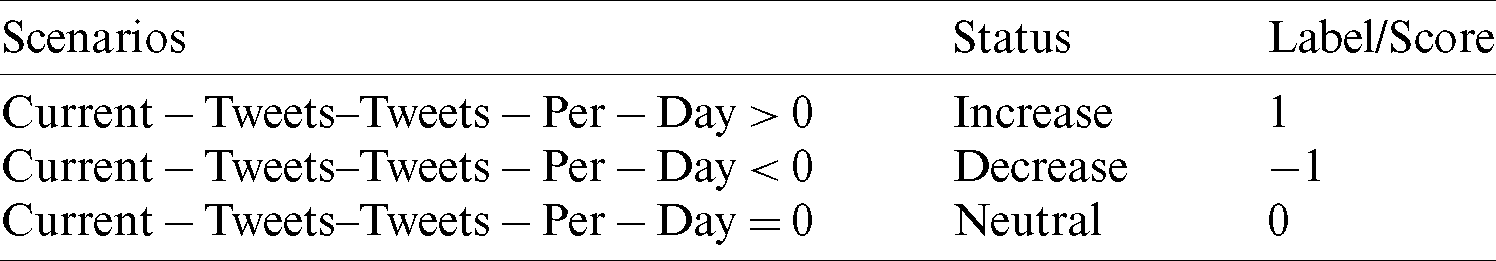
Per the scenarios mentioned above, we prepared our dataset containing 7,800 samples. Of them, 4,315 items expressed an increase in the exchange rate, 3,121 items indicated a decrease in it, and 364 items were neutral. We removed the neutral samples from the dataset for better sentiment analysis. Finally, a dataset containing 7,436 samples was used for further analysis.
Data visualization is the first step in better understanding data. Various approaches to data visualization are available. We first used linear discriminant analysis (LDA). It is a method of analyzing numerical datasets to find a linear combination of features and separate them into two classes (the red features here indicated an increasing exchange rate and the green features indicated a decreasing exchange rate). This reduces the dimensionality of the dataset. Data visualization using the LDA approach is shown in Fig. 3.
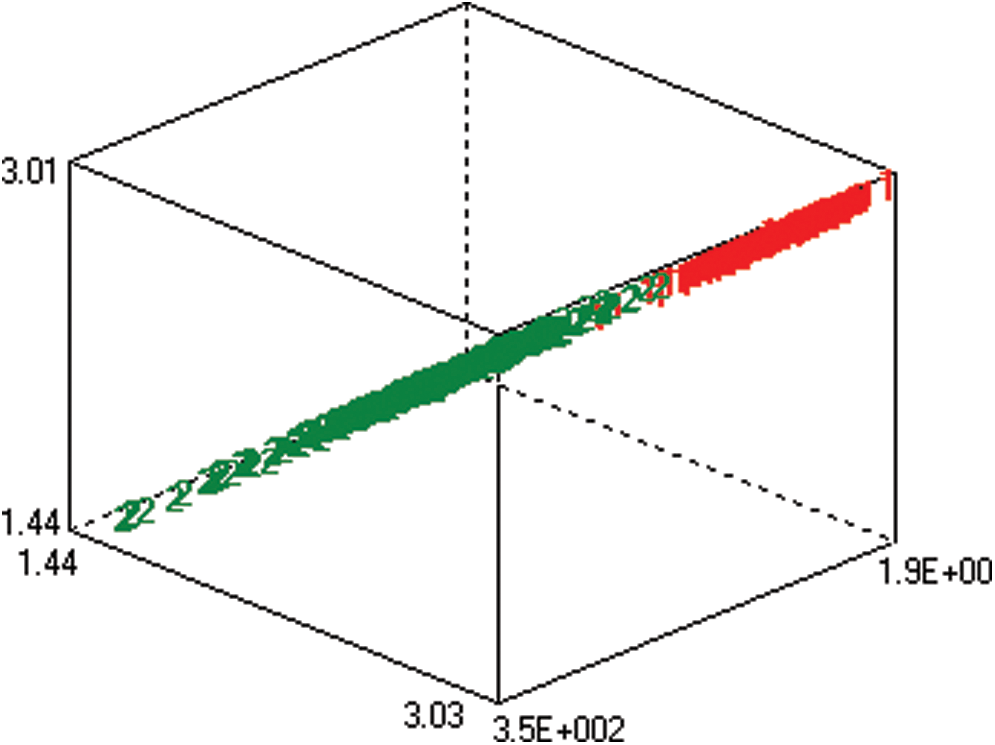
Figure 3: Data visualization using LDA
LDA does not provide a better understanding of the dataset. Hence, we used PCA for visualization. High-dimensional data were thus projected into low dimensions. The low-dimensional feature vector space is generally considered to be three-dimensional, and yields a scatter plot for observation. The data visualization using the PCA approach is shown in Fig. 4.
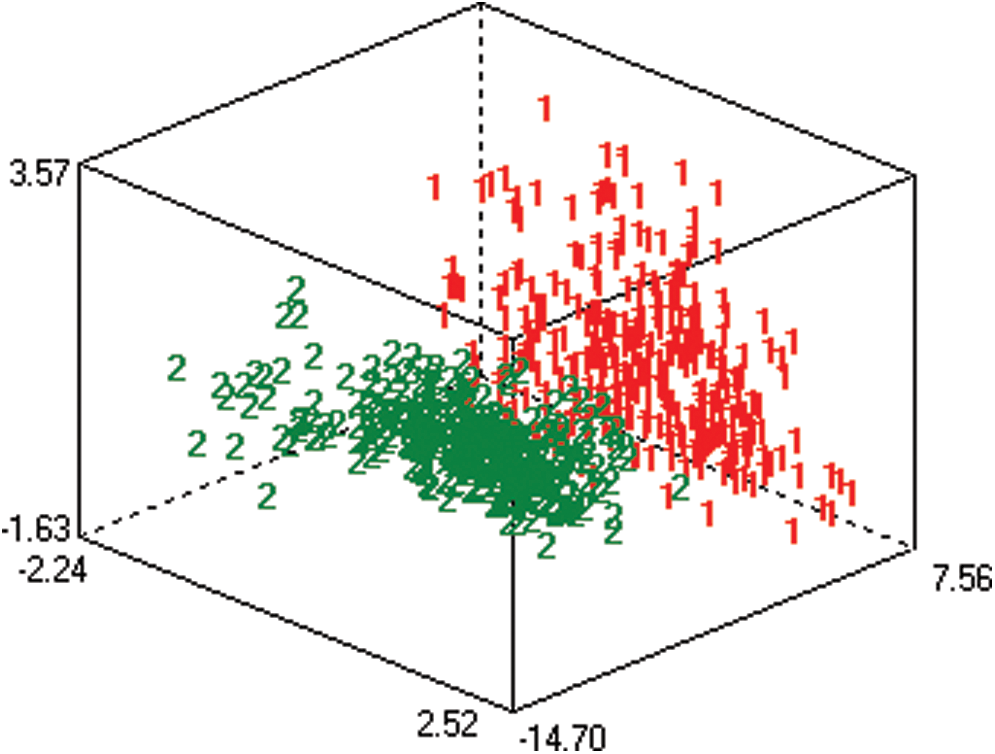
Figure 4: Data visualization using the PCA approach
PCA yielded a better separation of the cluster into two classes (red: increasing exchange rate; green: decreasing exchange rate).
2.5 Cluster Obtained Through Sampling
The reduction in the size of the majority class (having the greater frequency in the class distribution of training) led to a loss of information. To solve this problem, a cluster obtained using a sampling approach can be used [25]. The first cluster of full data was called the C cluster. An appropriate number (N) of samples from the majority class were then selected from each cluster by considering the ratio of the number of samples of the minority class in the cluster. From each cluster, N samples were randomly selected from the majority class as shown in Eq. (1). In the jth cluster (1  j
j  C),
C),  was:
was:

Five machine learning (ML) classifiers were employed to build classification models—simple logistic (SL), random forest (RF), bagging (B), naïve Bayes (NB), and support vector machine (SVM)—by using the cluster obtained above. The SL classifier delivered the best performance because it does well with a large amount of noisy and complex data [26]. The SL classifier is expressed as

where

and x1,  , xk the explanatory variables for parameters w0, w1,
  , wk, respectively.
The overall accuracy of sentiment classification related to the USD/PKR exchange rate using tweets with the machine learning classifiers was evaluated via the kappa statistic, a metric that compares the observed accuracy with the expected accuracy. The “true positive” (TP) is an outcome where the model correctly predicts the positive class, “false positive” (FP) is one where the model incorrectly predicts the positive class, and “precision” is related to the reproducibility and repeatability of the results, and is defined as the degree to which repeated measurements can obtained under unchanged conditions. it is given by

“Recall” is the fraction of the total number of relevant instances that are retrieved, specified by

The F-measure is calculated based on precision and recall, and is given by

The receiver-operating characteristic (ROC) is a graphical plot equating the TP and the FP of a classifier because the refinement thresholds of the classifier are different for the two, the mean absolute error (MAE) quantity is used to measure how close forecasts or predictions are to the eventual outcomes, and the root mean-squared error (RMSE) contributes the standard deviation in the sample between the predicted and the observed values. These measures are shown in Tab. 4.
Table 4: Results of machine learning-based US Dollar/Pakistani Rupee exchange rate forecasting
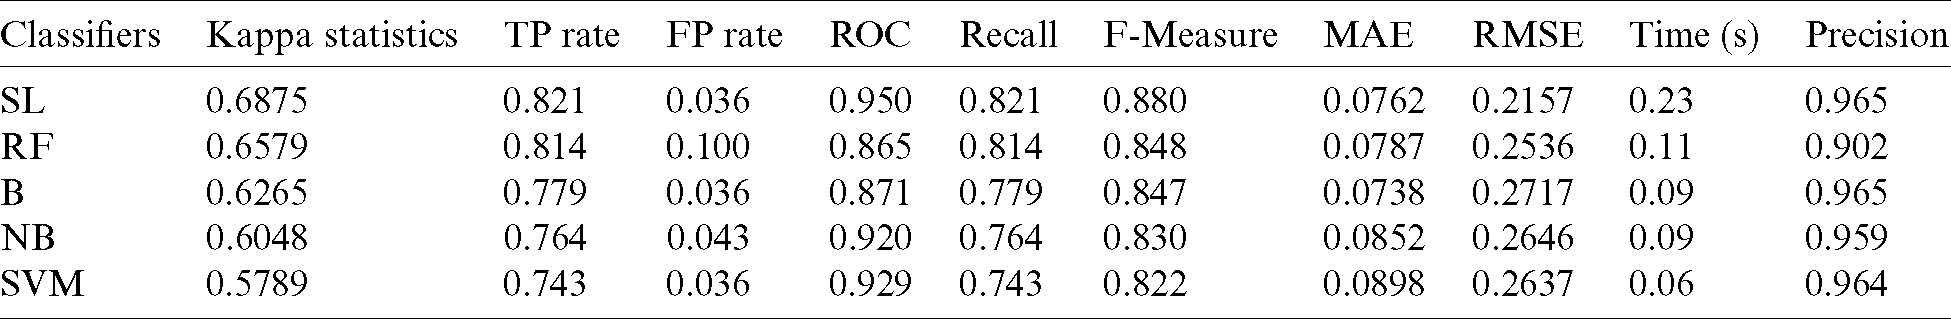
The SL classifier yielded the best classification results of the five ML classifiers implemented, as shown in Fig. 5.
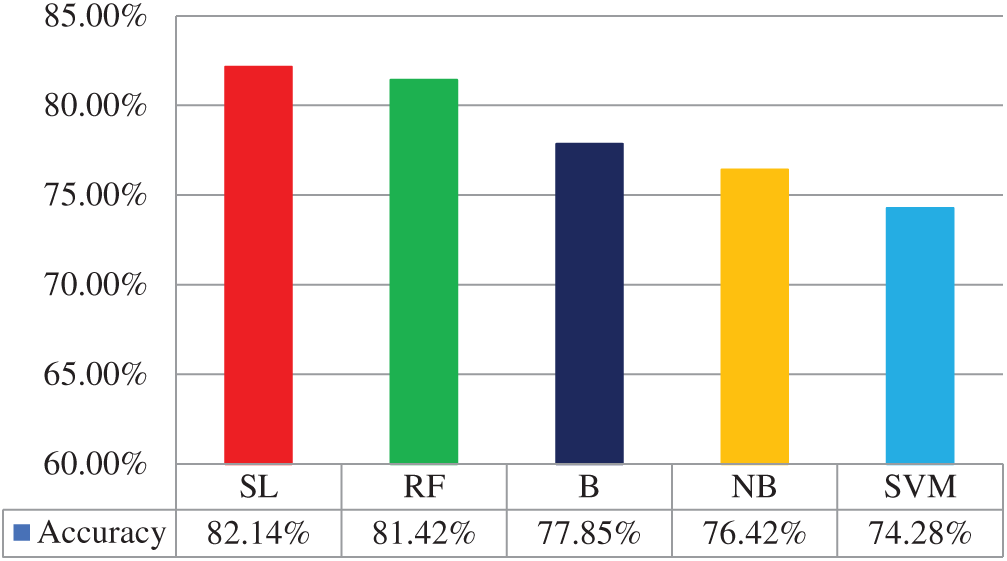
Figure 5: The overall results of sentiment analysis of the five ML classifiers
This study proposed a method to forecast the USD/PKR exchange rate by using sentiment analysis combined with machine learning methods. We used two social media platforms for data collection: exchange rates from forex, and Twitter data consisting of finance-related words. Various NLP method were used to preprocess the extracted dataset, such as removing irregular terms, accepting English tweets only, and extracting, lemmatizing, and removing stop words. Following this, the response variables were divided into two classes: “1” indicated an increase and “ −1” a decrease in the exchange rate. The data were then visualized using LDA and PCA. Finally, five ML classifiers—simple logistic (SL), random forest (RF), bagging (B), naïve Bayes (NB), and support vector machine (SVM)—were used on the optimized dataset, and yielded respective accuracies of 82.14%, 81.42%, 77.85%, 76.42%, and 74.28%. The proposed method and its results can be used by the Pakistani business community to invest in the local market and forecast exchange rates for the future.
Acknowledgement: The authors thank anonymous referees for their careful reading of the manuscript and constructive comments that significantly improved this paper. Samreen Naeem and Aqib Ali thank their supervisor, Dr. Salman Qadri, assistant professor, Department of Information Technology, The Islamia University of Bahawalpur, Pakistan, for his support.
Funding Statement: The authors received no specific funding for this study.
Conflicts of Interest: The authors declare that they have no conflicts of interest to report regarding the present study.
1. L. G. Serrano, J. A. Olivas, F. P. Romero and E. V. Herrera. (2015). “Sentiment analysis: A review and comparative analysis of web services,” Information Sciences, vol. 311, no. 4, pp. 18–38. [Google Scholar]
2. E. Cambria, M. Grassi, A. Hussain and C. Havasi. (2012). “Sentic computing for social media marketing,” Multimedia Tools and Applications, vol. 59, no. 2, pp. 557–577. [Google Scholar]
3. M. L. Faulkner and A. Nierenberg. (2013). Networking for Every College Student and Graduate: Starting your Career off Right, New Jersey, United States: FT Press, . [Online]. Available: http://ptgmedia.pearsoncmg.com/images/9780133741131/-samplepages/0133741133.pdf. [Google Scholar]
4. H. Dellas and G. S. Tavlas. (2018). “Milton Friedman and the case for flexible exchange rates and monetary rules,” Cato Journal, vol. 38, pp. 361–366. [Google Scholar]
5. A. Mian and A. Sufi. (2018). “Finance and business cycles: The credit-driven household demand channel,” Journal of Economic Perspectives, vol. 32, no. 3, pp. 31–58. [Google Scholar]
6. C. J. Bermejo and R. A. Werner. (2018). “Does foreign direct investment generate economic growth? A new empirical approach applied to Spain,” Economic Geography, vol. 94, no. 4, pp. 425–456. [Google Scholar]
7. E. Albagli, L. Ceballos, S. Claro and D. Romero. (2019). “Channels of US monetary policy spillovers to international bond markets,” Journal of Financial Economics, vol. 134, no. 2, pp. 447–473. [Google Scholar]
8. T. S. Duz and O. Tas. (2020). “Social media sentiment in international stock returns and trading activity,” Journal of Behavioral Finance, vol. 21, no. 4, pp. 1–14. [Google Scholar]
9. V. Kalia, D. A. Ortiz, A. K. Patel, A. K. Moriarity, C. L. Canon et al. (2018). , “Leveraging twitter to maximize the radiology meeting experience,” Journal of the American College of Radiology, vol. 15, no. 1, pp. 177–183. [Google Scholar]
10. F. Nazir, M. A. Ghazanfar, M. Maqsood, F. Aadil, S. Rho et al. (2019). , “Social media signal detection using tweets volume, hashtag, and sentiment analysis,” Multimedia Tools and Applications, vol. 78, no. 3, pp. 3553–3586. [Google Scholar]
11. M. Alrubaian, M. A. Qurishi, A. Alamri, M. A. Rakhami, M. M. Hassan et al. (2018). , “Credibility in online social networks: A survey,” IEEE Access, vol. 7, no. 1, pp. 2828–2855. [Google Scholar]
12. S. Bird, E. Klein and E. Loper. (2009). Natural Language Processing with Python: Analyzing Text with the Natural Language Toolkit, Massachusetts, United States: O’Reilly Media, Inc., . [Online]. Available: http://nltk.org/book_1ed/. [Google Scholar]
13. S. Balakrishnama and A. Ganapathiraju. (1998). “Linear discriminant analysis a brief tutorial,” Institute for Signal and Information Processing, vol. 18, no. 19, pp. 1–8. [Google Scholar]
14. S. Wold, K. Esbensen and P. Geladi. (1987). “Principal component analysis,” Chemometrics and Intelligent laboratory Systems, vol. 2, no. 3, pp. 37–52. [Google Scholar]
15. F. Valencia, E. A. Gómez and B. A. Valdés. (2019). “Price movement prediction of cryptocurrencies using sentiment analysis and machine learning,” Entropy, vol. 21, no. 6, pp. 589–605. [Google Scholar]
16. Z. H. Kilimci. (2020). “Sentiment analysis-based direction prediction in bitcoin using deep learning algorithms and word embedding models,” International Journal of Intelligent Systems and Applications in Engineering, vol. 8, no. 2, pp. 60–65. [Google Scholar]
17. J. Abraham, D. Higdon, J. Nelson and J. Ibarra. (2018). “Cryptocurrency price prediction using tweet volumes and sentiment analysis,” SMU Data Science Review, vol. 1, no. 3, pp. 1–12. [Google Scholar]
18. S. Das, R. K. Behera and S. K. Rath. (2018). “Real-time sentiment analysis of Twitter streaming data for stock prediction,” Procedia Computer Science, vol. 13, no. 2, pp. 956–964. [Google Scholar]
19. P. F. Pai and C. H. Liu. (2018). “Predicting vehicle sales by sentiment analysis of Twitter data and stock market values,” IEEE Access, vol. 6, pp. 57655–57662. [Google Scholar]
20. G. A. J. Alkubaisi, S. S. Kamaruddin and H. Husni. (2018). “Conceptual framework for stock market classification model using sentiment analysis on Twitter based on hybrid naïve Bayes classifiers,” International Journal of Engineering & Technology, vol. 7, no. 2.14, pp. 57–61. [Google Scholar]
21. M. Yasir, S. Afzal, K. Latif, G. M. Chaudhary, N. Y. Malik et al. (2020). , “An efficient deep learning-based model to predict interest rate using Twitter sentiment,” Sustainability, vol. 12, no. 4, pp. 1660–1674. [Google Scholar]
22. Y. Ruan, A. Durresi and L. Alfantoukh. (2018). “Using twitter trust network for stock market analysis,” Knowledge-Based Systems, vol. 145, no. 1, pp. 207–218. [Google Scholar]
23. F. H. Jahjah and M. Rajab. (2020). “Impact of Twitter sentiment related to bitcoin on stock price returns,” Journal of Engineering, vol. 26, no. 6, pp. 60–71. [Google Scholar]
24. R. Patel and K. Passi. (2020). “Sentiment analysis on Twitter data of world cup soccer tournament using machine learning,” IoT, vol. 1, no. 2, pp. 218–239. [Google Scholar]
25. D. Devi, S. Namasudra and S. Kadry. (2020). “A boosting-aided adaptive cluster-based under sampling approach for treatment of class imbalance problem,” International Journal of Data Warehousing and Mining vol. 16, no. 3, pp. 60–86. [Google Scholar]
26. S. Yücelbaş. (2020). “Simple logistic hybrid system based on greedy stepwise algorithm for feature analysis to diagnose Parkinson’s disease according to gender,” Arabian Journal for Science and Engineering, vol. 45, no. 3, pp. 2001–2016. [Google Scholar]
 | This work is licensed under a Creative Commons Attribution 4.0 International License, which permits unrestricted use, distribution, and reproduction in any medium, provided the original work is properly cited. |