DOI:10.32604/cmc.2021.016560
| Computers, Materials & Continua DOI:10.32604/cmc.2021.016560 | |
| Article |
Vehicle Re-Identification Model Based on Optimized DenseNet121 with Joint Loss
1Jiangsu Engineering Center of Network Monitoring, Engineering Research Center of Digital Forensics, Ministry of Education, School of Computer and Software, Nanjing University of Information Science & Technology, Nanjing, 210044, China
2Jiangsu Collaborative Innovation Center of Atmospheric Environment and Equipment Technology, Nanjing University of Information Science & Technology, Nanjing, 210044, China
3Department of Civil and Environmental Engineering, Rensselaer Polytechnic Institute, Troy, NY, 12180, USA
*Corresponding Author: Xiaorui Zhang. Email: zxr365@126.com
Received: 21 December 2020; Accepted: 02 February 2021
Abstract: With the increasing application of surveillance cameras, vehicle re-identification (Re-ID) has attracted more attention in the field of public security. Vehicle Re-ID meets challenge attributable to the large intra-class differences caused by different views of vehicles in the traveling process and obvious inter-class similarities caused by similar appearances. Plentiful existing methods focus on local attributes by marking local locations. However, these methods require additional annotations, resulting in complex algorithms and insufferable computation time. To cope with these challenges, this paper proposes a vehicle Re-ID model based on optimized DenseNet121 with joint loss. This model applies the SE block to automatically obtain the importance of each channel feature and assign the corresponding weight to it, then features are transferred to the deep layer by adjusting the corresponding weights, which reduces the transmission of redundant information in the process of feature reuse in DenseNet121. At the same time, the proposed model leverages the complementary expression advantages of middle features of the CNN to enhance the feature expression ability. Additionally, a joint loss with focal loss and triplet loss is proposed in vehicle Re-ID to enhance the model’s ability to discriminate difficult-to-separate samples by enlarging the weight of the difficult-to-separate samples during the training process. Experimental results on the VeRi-776 dataset show that mAP and Rank-1 reach 75.5% and 94.8%, respectively. Besides, Rank-1 on small, medium and large sub-datasets of Vehicle ID dataset reach 81.3%, 78.9%, and 76.5%, respectively, which surpasses most existing vehicle Re-ID methods.
Keywords: Vehicle re-identification; densenet; joint loss; focal loss; SE block
In recent years, vehicle re-identification (Re-ID) has received more attention, and it can be broadly employed in video surveillance, intelligent traffic, and other fields [1,2]. Especially when the license plate is blocked, removed, or even forged, vehicle Re-ID will evolve into the exclusive approach for traffic control departments to find escape vehicles. Vehicle Re-ID can be understood as a sub-problem of image retrieval, whose purpose is to detect and track the target vehicle in a cross-camera monitoring system [3]. Compared with person Re-ID [4], the vehicle Re-ID is a more challenging task in the following two aspects: (1) in the case of uncontrolled natural lighting, viewing angle, low resolution, and complex background, the visual appearance of the same car under different camera viewpoint changes greatly, which shows distinct intra-class differences, as shown in Fig. 1a. (2) vehicles with the same model have similar visual appearances, such as the same color and model characteristics, leading to obvious inter-class similarity, as shown in Fig. 1b [5].
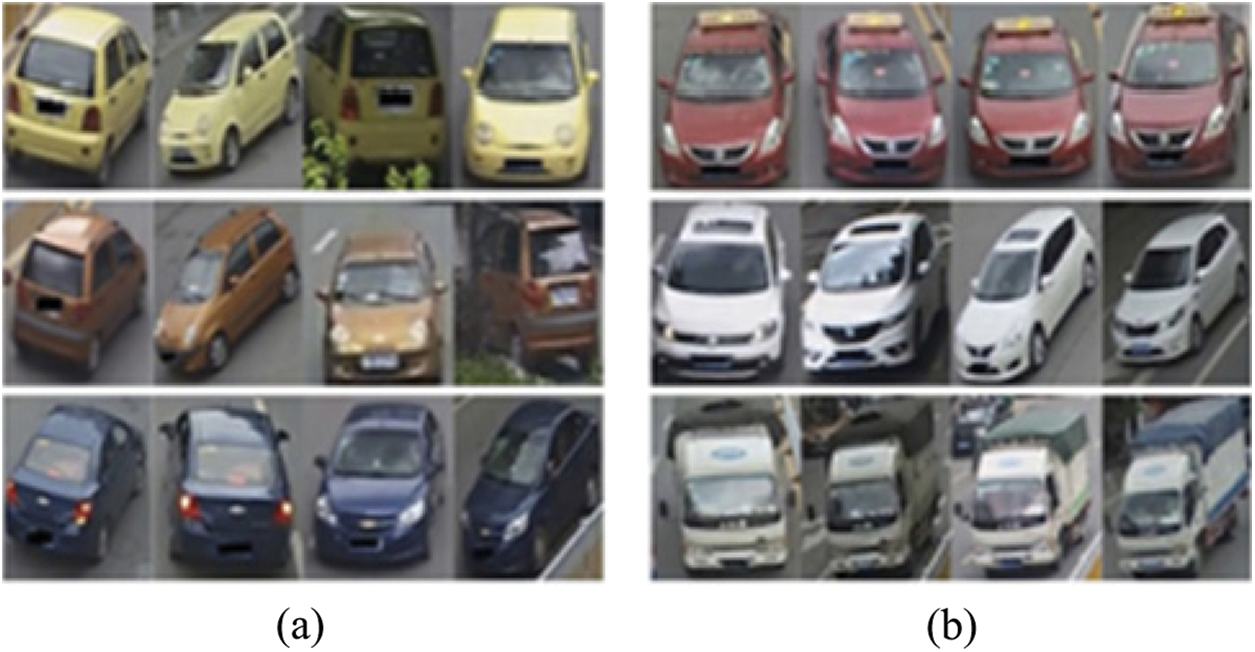
Figure 1: Examples of vehicle Re-ID difficulties (a) the same vehicle in a row (b) different vehicles in a row
In order to solve the mentioned challenges, most of the current research adopt deep learning methods to automatically extract vehicle image features. To re-identify the vehicle from a whole perspective, many methods directly extract the global characteristics of the vehicle through a convolutional network [6,7]. Further, literature [8,9] proves the superiority of DenseNet in the Re-ID task. In earlier research, each layer of DenseNet uses all previous layers as input, which can strengthen the propagation and utilization of features. However, these methods directly use DenseNet as the backbone network, and features in each layer are completely passed to the next layer without distinction. As a result, the features obtained in the end contain some useless feature information, which may lead to misjudgment and affect the accuracy of recognition.
Although the calculation of global features is simple and less time consuming., it is easy to cause misjudgment due to the large posture variation and the occlusion of vehicles. Therefore, some researchers began to focus on the local information of the vehicle. The studies [10,11] extract local features, such as car windows, car lights, and etc. Then, the network can pay attention to more discriminative local features in the learning process. Although these methods can effectively cope with the challenges caused by partial occlusion and posture change of vehicles, they need to mark the positions of windows and lights in advance, leading to extra marking and a large amount of calculation. Yu et al. [12] proved that the deep network itself includes some domain-invariant local characteristic information with discrimination abilities in the middle layer. Therefore, considering reducing manual labeling costs and simplifying the calculation, there is no need to use additional labeling methods to extract the local features of the vehicle. The same recognition effect can be achieved directly by using the extracted middle-level features.
As a means to enhance the model to recognize difficult-to-recognize samples, some Re-ID models attempt to improve the network loss function [13–15]. These models generally adapt triplet loss or cross-entropy loss. Nevertheless, the traditional cross-entropy loss function only constrains a single class corresponding to the real identity tag, and they tend to be insufficient to take notice of the difficult-to-recognize samples during the training process. Consequently, these models fail to solve the problem of low recognition rate due to enormous inconsistency in the classification difficulty of dissimilar samples.
To solve above challenges, this paper proposes a straightforward yet efficient vehicle Re-ID model. By adding the SE block, the traditional DenseNet121 network structure is optimized to reduce the impact of useless features during the feature reuse and obtain more effective features. This proposed model leverages the complementary expression advantage of middle features on CNN and fuses these features of the middle layer with the last layer, learning more comprehensive and characteristic features. At the same time, the focal loss is introduced to pay more attention to difficult-to-samples during the training process and to improve the model’s ability to recognize difficult-to-separate samples.
The main contributions of the present study are as follows:
1. A straightforward yet effective optimized DenseNet121 is proposed as the backbone network. Due to feature reuse, there is an excess of ineffectual features extracted by the original DenseNet121. Thus, through adding SE blocks, the corresponding weight of each channel feature can be assigned according to the respective importance. The weighted channel features are passed to the deep layer, and the channel features with the largest weight are prioritized, thereby reducing redundant channel feature information. Additionally, we exploit middle-layer features besides the last layer features to exert complementary advantages of every-layer features in the network, which obtains effective global features and distinctive local features without additional annotation.
2. The joint loss of focal loss and triplet loss is used to supervise the network to improve the accuracy of vehicle Re-ID. Focal loss can enlarge the weight of difficult-to-separate samples and reduce the weight of the simple samples. Hence, in the course of training, more attention can be paid to the difficult-to-separate vehicle samples, which improves the model’s recognition accuracy of difficult-to-separate samples. To some extent, it effectively addresses the problem of low recognition accuracy resulting from the similarity of vehicles.
3. Also, to improve the robustness of the model against partial occlusion of vehicle images, a random erasing strategy is proposed. During the training, a rectangular region is randomly selected from the original image, and the pixel values of the region are randomly replaced. Images participating in the training will be occluded to different degrees, which can reduce the risk of overfitting and improve the robustness of the model. A large number of experiments on VeRi-776 and VehicleID datasets are implemented, which verifies the effectiveness of the proposed method.
The rest of the paper is organized as follows: Section 2 reviews the relevant work and Section 3 introduces the proposed model of vehicle Re-ID. Extensive experimental results are presented and analyzed in Section 4 and finally, the conclusions are summarized in Section 5.
With the prosperity of deep learning, vehicle Re-ID has achieved some progress in recent years. Broadly speaking, these approaches could be classified into two classes, i.e., feature extraction and loss design.
A series of methods attempt to identify vehicles based on feature extraction. Wu et al. [5] applied ResNet50 to extract global features of vehicle images and used spatiotemporal information to further improve the recognition results. Shen et al. [6] endeavored to extract global features for evaluation on multiple datasets by utilizing mobilenet. With the proposal of DenseNet, DenseNet121 is applied in Re-ID task [8,9]. DenseNet is proposed by Huang et al. [16], which is a convolutional neural network with dense connections, combining the model ResNet [17], and the advantages of Highway [18]. Each layer of DenseNet accepts all the preceding layers as its additional input, which can achieve feature reuse and improve efficiency. However, feature reuse will also cause many unimportant features to be repeatedly transmitted, which results in the final feature containing redundant features and affect the accuracy of Re-ID. All of the above methods belong to the extraction of global features, allowing the network to extract a feature from the entire image. Nevertheless, when the pose changes greatly and the image is occluded, the global features are easy to result in misjudgment.
Due to the limitations of global features, local information on vehicles is widely applied. Wang et al. [19] marked 20 key-points for vehicle images to extract local features of different positions. Khorramshahi et al. [20] tackled the problem of false attention by adaptively choosing the key-points to focus on, based on the orientation of the vehicle. Some works [21,22] learned the local features of each piece, they divided features into blocks to learn fine-grained features. He et al. [10] took pre-trained YOLO to detect areas of interest such as car windows, lights, license, and plates, etc. Zhang et al. [11] proposed the adoption of a local attention module to learn the weight of each candidate region for obtaining the local region with the most distinguishing degree. Meng et al. [23] generated view masks (front, back, top and side) by training an U-shape parsing network and then strengthened local features from various perspectives. Yet, these methods require additional annotations, such as key point annotations and local location annotations, etc.
Apart from designing better features, a series of losses is also exploited to achieve higher performance. In some recent researches [24,25], each car was treated as a class and the id loss was calculated based on its class label. The constraint of id loss is too simple, so Wang et al. [26] applied the attribute information about extra marked vehicle pictures, such as vehicle type, color, etc., to train the network by calculating attribute loss with sufficient annotation information. These methods treat the Re-ID task as a classification problem, which belongs to representational learning. The model is relatively simple and easy to train, but it is apt to overfit in the training process. Moreover, the training will be difficult, when the number of IDs increases to a certain extent.
Due to some deficiencies in representational learning, some studies focus on another type of loss function, called metric learning. Liu et al. [13] proposed a DRDL method to improve triplet loss into a cluster coupling loss (CCL), which alleviates the slow convergence of traditional triplet and the sensitivity of anchor point selection. Zhang et al. [14] proposed an optimized sampling method of triples, which reduces the randomness of sampling. Bai et al. [15] proposed a group-sensitive triplet embedding method, which can significantly reduce the negative impact of inter-class similarity and the intra-class difference in vehicle Re-ID.
Metric learning directly learns characteristic similarity through the network. The purpose of metric learning is to make the distance between vehicles with the same ID in the feature space smaller than the distance between vehicles with different IDs. There is no requirement that metric learning to adjust the network structure according to the number of IDs, and it can be easily extended to new datasets. However, only using the metric loss function has too simple constraints on the sample distance, and it is difficult to adapt to refined recognition. Consequently, metric learning is usually combined with representation learning. Different loss functions are constrained to each other so that the network can learn more representative characteristics. The current researches [13–15] mostly applied the loss function combined cross-entropy with a triple loss function. However, the traditional cross-entropy loss function is incapable of paying enough attention to the difficult-to-separate samples in the training set, i.e., such samples are difficult to distinguish and easy to be misclassified, so it cannot overcome the problem of enormous inconsistency in the classification difficulty.
The present research introduces the SE block module combined with the features of the middle layer to optimize the traditional DenseNet121. SE block (Squeeze-and-Excitation block) [27] weights the channels then transfers the weighted channel features to the deep layer, which reduces the transmission of redundant information and pays more attention to the channel features with the largest amount of information. Concurrently, by using the method in [12], the present study leverages the complementary expression advantages of the middle and deep features of CNN, directly uses the invariant local identification features of the middle layer to fuse with the final layer feature map. It is proposed that the middle-level features of CNN are more obvious to the local feature of the image as well as highlight the features of local locations with discrimination. Hence, without additional annotation and calculation, the local response features can be directly extracted from the middle layer, which is convenient for fusion with the features of the last layer, so as to further improve the feature expression ability of the model.
To overcome the shortcomings of the traditional cross-entropy loss function, Lin et al. [28] proposed focal loss for the first time in the field of target detection, which is utilized to solve the problem that the dense detector encounters the unbalance of the foreground-background during the training. According to the study, a focal loss can amplify the weight of the loss of difficult-to-separate samples in the total loss, and reduce the weight of the loss of easy-to-separate samples in the total loss. Thus, the present study proposes applying focal loss instead of cross-entropy and combine it with the triplet loss for supervised learning of the network. In the training process, the model can pay more attention to the contribution of difficult-to-separate vehicle samples, reduce the influence of simple samples, and improve the accuracy of the model’s judgment on difficult-to-separate samples.
First, we defined each vehicle image as x, which has a unique identification tag y corresponding to it. Given a training set  , the main purpose of vehicle Re-ID is to obtain a better feature extraction model
  through training set learning.
  is the parameter set of the model
  . In the test, given a query vehicle image xq and gallery set
  , by comparing
  with each
  , we can find the image with the same identity ID as the query from the gallery set.
We proposed a straightforward yet efficient vehicle Re-ID network, specifically the improvement of the DenseNet121 network structure and the loss function: (1) the traditional DenseNet121 network structure has been optimized using the combination of SE block and middle layer features. SE block is adopted to make the model pay more attention to the channel features with the largest amount of information in the process of feature transmission. Concurrently, the features of the middle layer and the last layer are fused to improve the feature expression ability of the model (2) the joint loss apply focal loss instead of cross-entropy loss to fuse with triplet loss, which reduces the weight of easy-to-separate samples and increases the weight of difficult-to-separate samples so as to improves the model’s ability to judge difficult samples.
The overall network framework is presented in Fig. 2. Input  vehicle images at a time and each image is cropped to
  pixels. The vehicle image features after randomly erasing are extracted by optimized DenseNet121, which is shown in the upper part of Fig. 1. The corresponding SE block is added after the dense block of DenseNet121. Features extracted by SE block3 and SE block4 are mid-level features fmid and high-level features fhigh, respectively, combine these two features to get final feature f. A batch normalization (BN) layer is added after f to get the normalized features fb. In the training phase, f and fb are used to calculate triplet loss and focal loss, respectively. BN layer can make feature distribution more compact, reduce mutual interference between triplet loss and focal loss, and achieve the effect of simultaneous convergence.
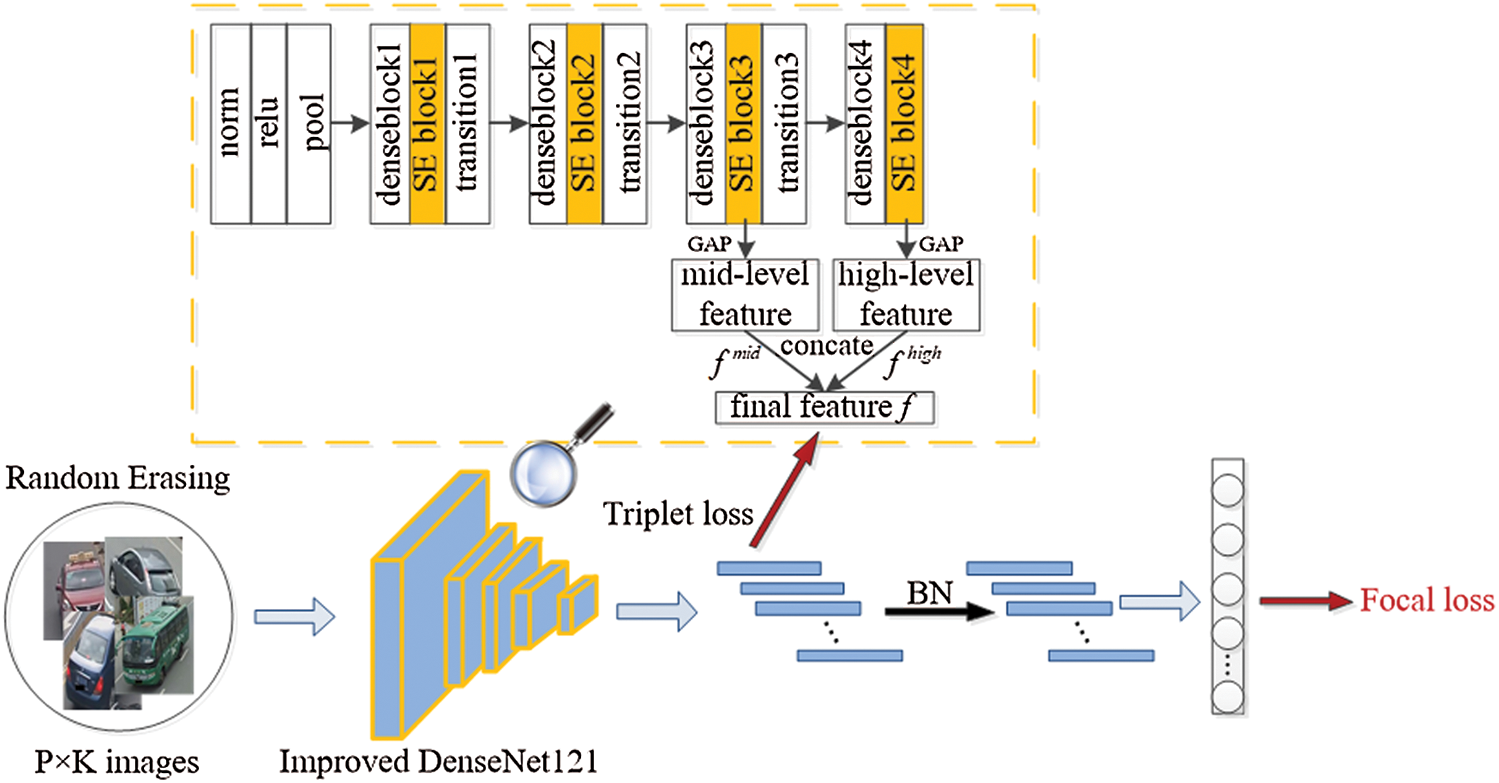
Figure 2: The overall structure of the proposed model
DenseNet is a convolutional neural network with dense connections. The basic idea is to ensure the maximum transmission of information between layers in the network, thereby directly connecting all layers. The main peculiarity is that each layer of the network is not only connected to the next layer but also directly connected to each layer in front. The input of each layer comes from the output of all the previous layers, as shown in Fig. 3.
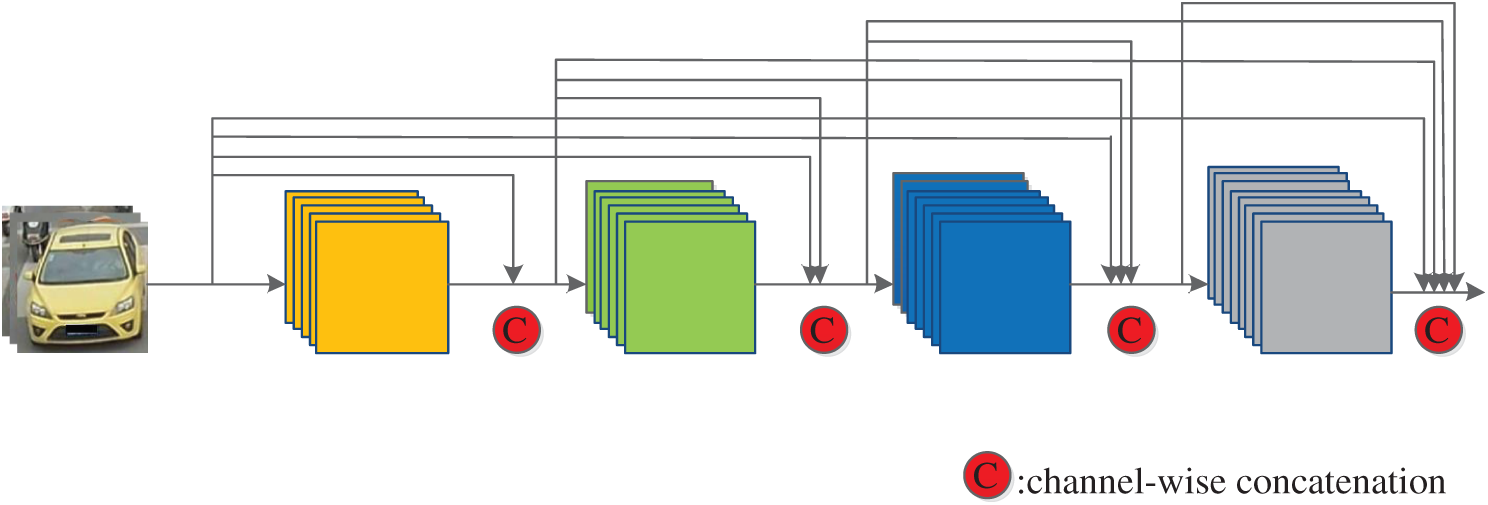
Figure 3: Forward propagation of DenseNet
The output at layer l of the network can be expressed as

 represents a non-linear transformation function, which is a combined operation.
Each layer of DenseNet accepts all the previous layers as its additional input, which can realize feature reuse and improve efficiency. But at the same time, it will bring many unimportant features repeated transmission. SE block enables the model to pay more attention to the channel features with the largest amount of information in the process of feature transmission. Therefore, we adopted the SE block to improve the DenseNet121 network structure to reduce the impact of unimportant features.
As shown in the upper part of the network structure in Fig. 1, an SE block is added after each dense block module of DenseNet121, and the SE block structure is shown in Fig. 4. For feature X with height H, width W, and channel C, global average pooling is used as a squeeze operation, followed by two fully-connected layers to model the correlation between channels. Given a reduction ratio r, feature dimension reduction is carried out through a full connection layer, and after ReLU activation, it will be upgraded to the original dimension through a fully-connected layer. Then the normalized weight is obtained through a sigmoid function, finally, the normalized weight is weighted to each channel feature through a scale operation to obtain the features  that are passed forward. After the SE block is added, the importance of each channel feature can be acquired through the network according to loss. As a result, the effective feature map has a significant weight, while the invalid or ineffective feature map has a small weight, to reduce the impact of ineffective features in the DenseNet121 feature reuse process.
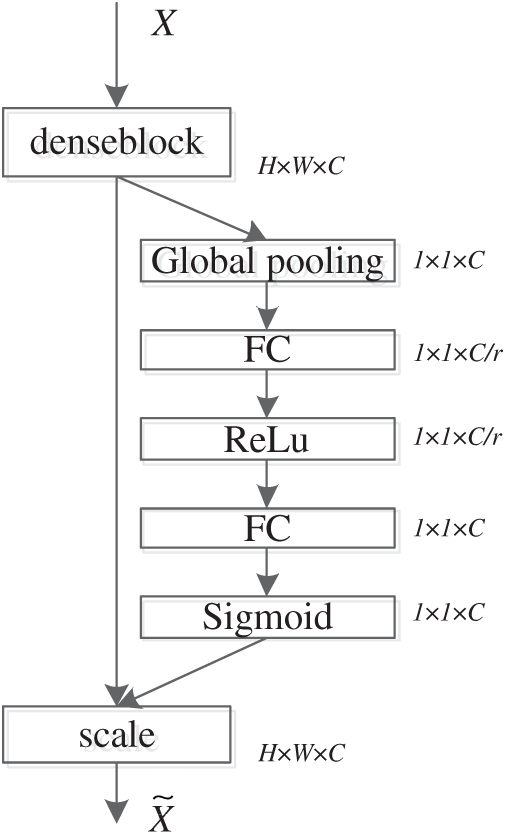
Figure 4: Structure of SE block
At the same time, the present study makes use of the complementary expression advantages of the middle and deep features of CNN to fuse the features of the middle layer and the final layer, so that the model can learn more distinct features. From the bottom to the top, the features extracted from the deep learning model often correspond to more abstract and semantically higher visual concepts. Yu et al. [12] visualized the middle layer of the network and found that the deep network has learned the internal local attributes in the middle layer, and the middle layer features are more obvious response to the local. We extracted the middle layer features of DenseNet121, as shown in the network structure of Fig. 1, the features obtained by SE block3 and SE block4 are denoted by  and
and  , respectively. Then the feature vector of the middle layer can be expressed as

A global average pooling (GAP) was performed on  and
and  respectively, and then stitched these two vectors as the final image representation f.
The loss function is essential in the vehicle Re-ID task. The vehicle Re-ID loss function generally uses joint loss to optimize the network, and most networks use a combination of triple loss and cross-entropy loss. Some different vehicles of the same style are not easily distinguishable even by human eyes. Therefore, it is necessary to design a better loss function to make the model that pays more attention to such indistinguishable vehicle samples and reduce the influence of simple samples. Hence, we proposed using a focal loss instead of cross-entropy loss in vehicle Re-ID, to increase the weight of difficult-to-separate samples so as to pay more attention to the contribution of difficult-to-separate samples in the training.
Triplet loss is the most widely used in metric learning. Many metric learning methods make different improvements on the triplet loss. The advantage of triple loss lies in the learning of image details. Three paired images are input each time, including an anchor image a, a positive sample p with the same ID as a, and a negative sample n with a different ID. The triplet loss function is expressed as

 is the Euclidean distance calculated by the feature vector of a and p, similarly
  .
.
The cross-entropy loss function for multiple categories is defined as

pi represents the probability obtained by the i-th sample after the activation function, and yi represents the true label of the i-th sample.
The focal loss of multiple categories is expressed as

n represents the number of categories,  is a hyperparameter greater than 0. The term
  is utilized to enlarge the weight of the loss of the difficult-to-separate samples in the total loss and reduce impact of easy-to-separate samples. For easy-to-separate samples, i.e., samples with larger p, the modulation factor
  is smaller; conversely, for difficult-to-separate samples, the modulation factor is larger. In this way, during training, the loss of difficult-to-separate samples is amplified, and the model pays more attention to these samples. It solves the problem that a large number of easy-to-separate samples reduce the overall loss and improves the judgment ability of the model for difficult-to-separate samples.
The combined loss of triplet loss and focal loss is utilized. Triplet loss clusters samples in the feature space and learns the similarity between samples. Focal loss learns the interface of various samples in the feature space and classifies the samples in the feature space. The joint loss is employed to optimize the network and let different loss functions constrain each other so that the network can learn more representative characteristics.
The triplet loss and focal loss are combined as the loss function of the model, and the joint loss is expressed as

 is the coefficient of focal loss, and
  is considered equal to 1.
To reduce the risk of overfitting and improve the robustness of the model, the technique of random erasing is adopted in the present study. Random erasing is a data expansion method proposed by Zhong et al. [29]. During training, a rectangular area is randomly selected in the original image, and the pixels in the area are replaced with random values. In this process, the images will be occluded to different degrees, which reduce the risk of overfitting and improve the robustness of the model. Random erasing is independent of the parameter learning process, so it can be integrated into any CNN-based recognition model. As shown in Fig. 5, the pixels of the vehicle image are replaced by random pixel values with a certain probability, which can simulate the situation of the vehicle being blocked and improve the robustness of the model.
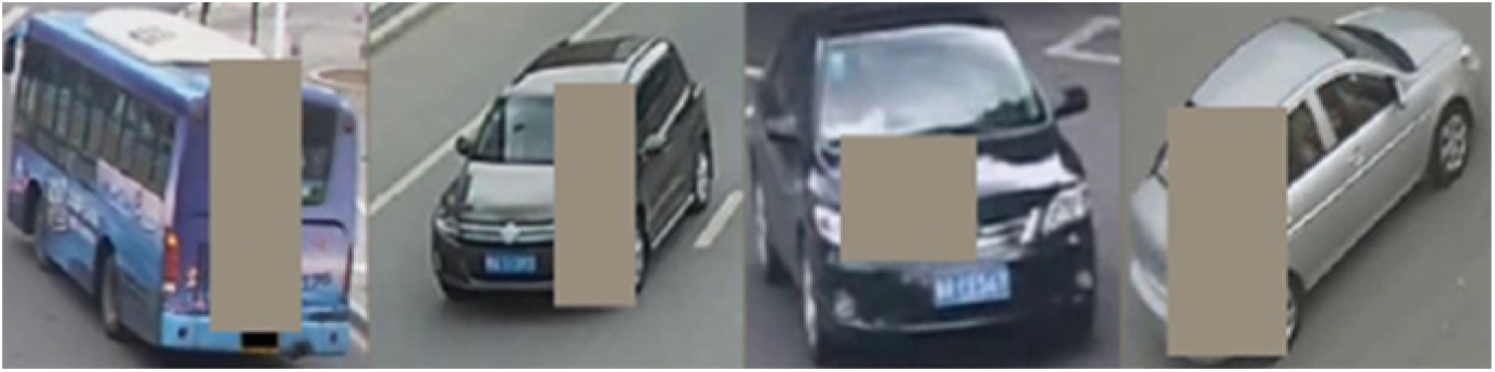
Figure 5: Examples of erased vehicle image
The qualitative analysis experiments are carried out on the Veri-776 dataset to determine the optimal parameters. At the same time, the image of vehicle query is visualized, which further proves the effectiveness of the proposed method on the two popular datasets, Veri-776 and VehicleID, we compared our method with other existing methods.
4.1 Datasets and Evaluation Metrics
We evaluated the proposed method on two large-scale datasets for vehicle Re-ID, including VehicleID and VeRi776, strictly following the evaluation protocols.
VeRi-776 [30] contains 619 vehicle models and a total of 40,000 vehicle images. These images are captured by 20 cameras in a variety of different traffic scenes, and each car is captured by 2–18 cameras at different locations, so the vehicle images have different resolutions, backgrounds, and occlusions. Each vehicle image has detailed annotation information, including body-color, vehicle style, and brand, etc. This dataset can reflect the actual situation of real-world traffic scenes, is suitable for vehicle Re-ID and is more challenging than other datasets.
In VehicleID [13] dataset, the vehicle images are captured by multiple non-overlapping surveillance cameras from two viewpoints (front and back), including 26,267 vehicles and a total of 221,763 images. The dataset annotates the color, vehicle style, and vehicle ID of the vehicle, and contains more vehicle images and identity information, which is appropriate for fine-grained vehicle retrieval. Due to the large size, the dataset is divided into small-scale, medium-scale, and large-scale datasets. The number of vehicle IDs in them is 800, 1600, and 2,400 respectively.
We adopted two evaluation metrics, which are mean Average Precision (mAP) and Cumulative Match Curve (CMC) in our experiments [31]. The mAP metric evaluates the overall performance for ReID. The CMC shows the probability that a query identity appears in differently sized candidate lists. We used Rank-n from CMC; Rank-n refers to the accuracy of the first n images in the matching result.
The mAP is the average of the AP. An AP is the area of the PR curve. PR is obtained by two parameters, precision, and recall. The calculation formulas of precision and recall are as follows
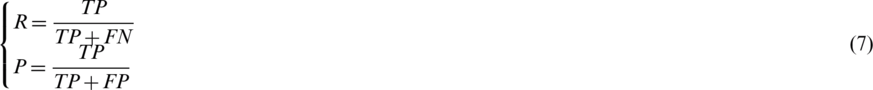
Among them, TP indicates the number of positive examples in the training set that are predicted to be positive examples, FP is the number of positive examples but actually negative examples, FN is the number of negative examples, but actually positive examples.
The PR curve is drawn with Recall and Precision as the abscissa and ordinate respectively, and the enclosed area is computed to obtain the average accuracy. Rank-n indicates the probability of correct matching among the first n items in the returned image set after searching.
All experiments are completed in NVIDIA RTX 2080Ti, Python 3.7, Pytorch 1.3.1 environment. The backbone Densene121 is initialized from the ImageNet pre-trained model. All pictures are preprocessed and unified into  , and data enhancement processing is done such as random flipping and cropping data. Training batch size is
  , where P is the number of pedestrians in each batch, K is the number of pictures of each pedestrian in each batch, set P = 8, and K = 4. The network is trained for a total of 120 epochs. The warmup learning rate strategy was used [32]. The basic learning rate was set to 0.0035, exponential decay was performed in the 40th epoch and 70th epoch, and the attenuation coefficient was set to 0.1. We used the Adam optimizer with the weight attenuation coefficient set to 0.0005 and the margin of the triple loss is set to 0.3.
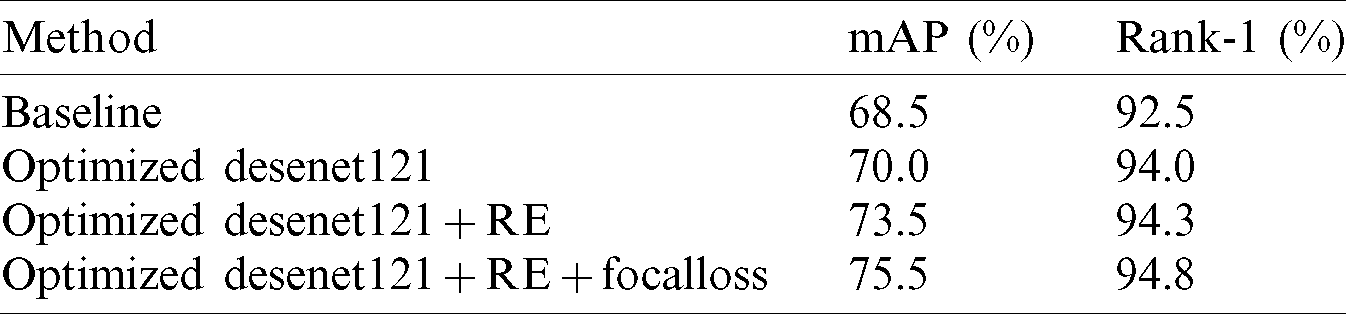
To further demonstrate the effectiveness of the proposed method, the method is qualitatively analyzed on the VerI-776 dataset, and the appropriate parameters are selected. The baseline is based on the original Desenet121 network structure using the combined loss of triple loss and cross-entropy loss. It can be seen from Tab. 1 that the baseline has obtained relatively good results, with mAP and Rank-1 reaching 68.5% and 92.5%. The Desenet121 was replaced with optimized Desenet121, both mAP and Rank-1 have been promoted. It reflects the effectiveness of the optimized Desenet121 by using the SE block combined with the features of the middle layer, and the extracted features are more distinguishable. Using random erasing on the Optimized Desenet121 network structure, it’s observed that the improvement is more significant. Therefore, in the future research on vehicle Re-ID, random erasing can be considered to preprocess the image. At the same time, replacing the cross-entropy loss with the focal loss achieved the best experimental results. The mAP and Rank-1 reached 94.8% and 75.5%, respectively. This is owing to the focal loss pays more attention to difficult samples and improves the classification accuracy of the model.
Table 1: Qualitative analysis on VeRi-776
The proposed model uses the joint loss of triplet loss and focal loss. The focal loss enlarges the weight of the loss of difficult-to-separate in the total loss through the  , and reduces the weight of the loss of easy-to-separate samples. In this way, during training, the loss of difficult-to-separate samples is amplified, and the model pays more attention to these samples. One important hyperparameter is tested on the VerI-776 dataset, and the best hyperparameter is selected. The following Fig. 6 shows the results of the experiment on VerI-776. It is observed that the relationship between mAP, Rank-1 and
  is not linear and does not increase with the increase of
  . If the value of
  is 2, the best result is obtained, so the parameter
  of focal loss is considered.
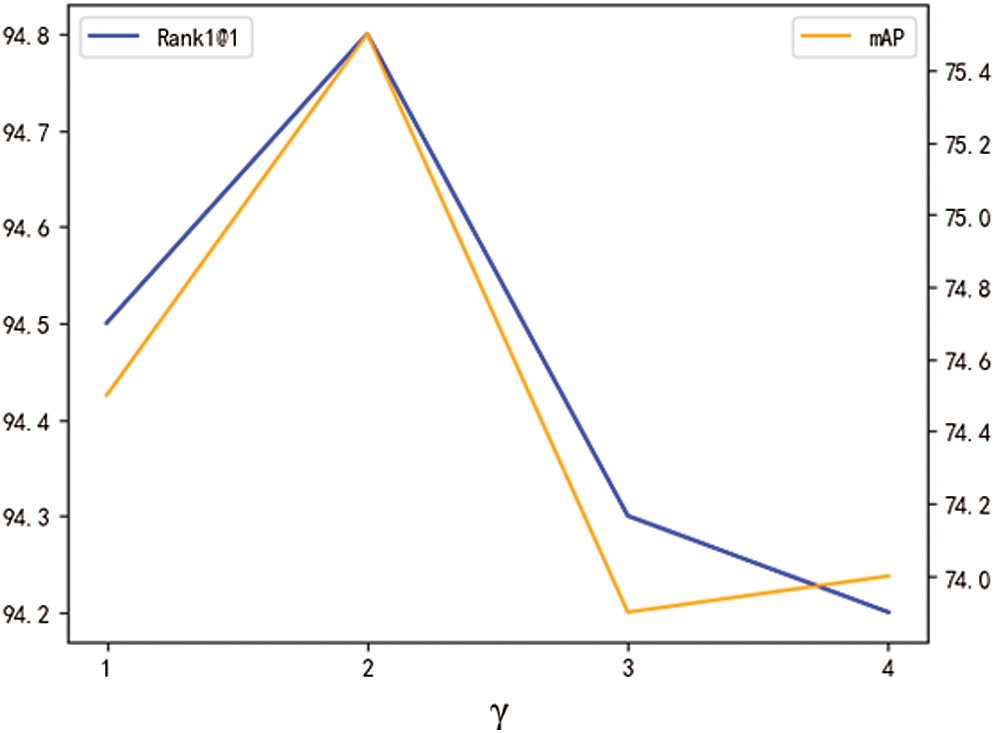
Figure 6: The selection of parameter  (match rate (%) and mAP (%) for different
  on the VeRi-776 dataset)
To further illustrate the effectiveness of the proposed framework, we visualized some examples of query results on VeRi-776, as shown in Fig. 7. True matches are green, false matches are red. The left is the query result of the baseline, and the right is the query result of the proposed method. Judging from the query results, the correct number of queries is more than that of the baseline, and the query effect is more effective than the baseline, which once again verifies the effectiveness of the proposed method.
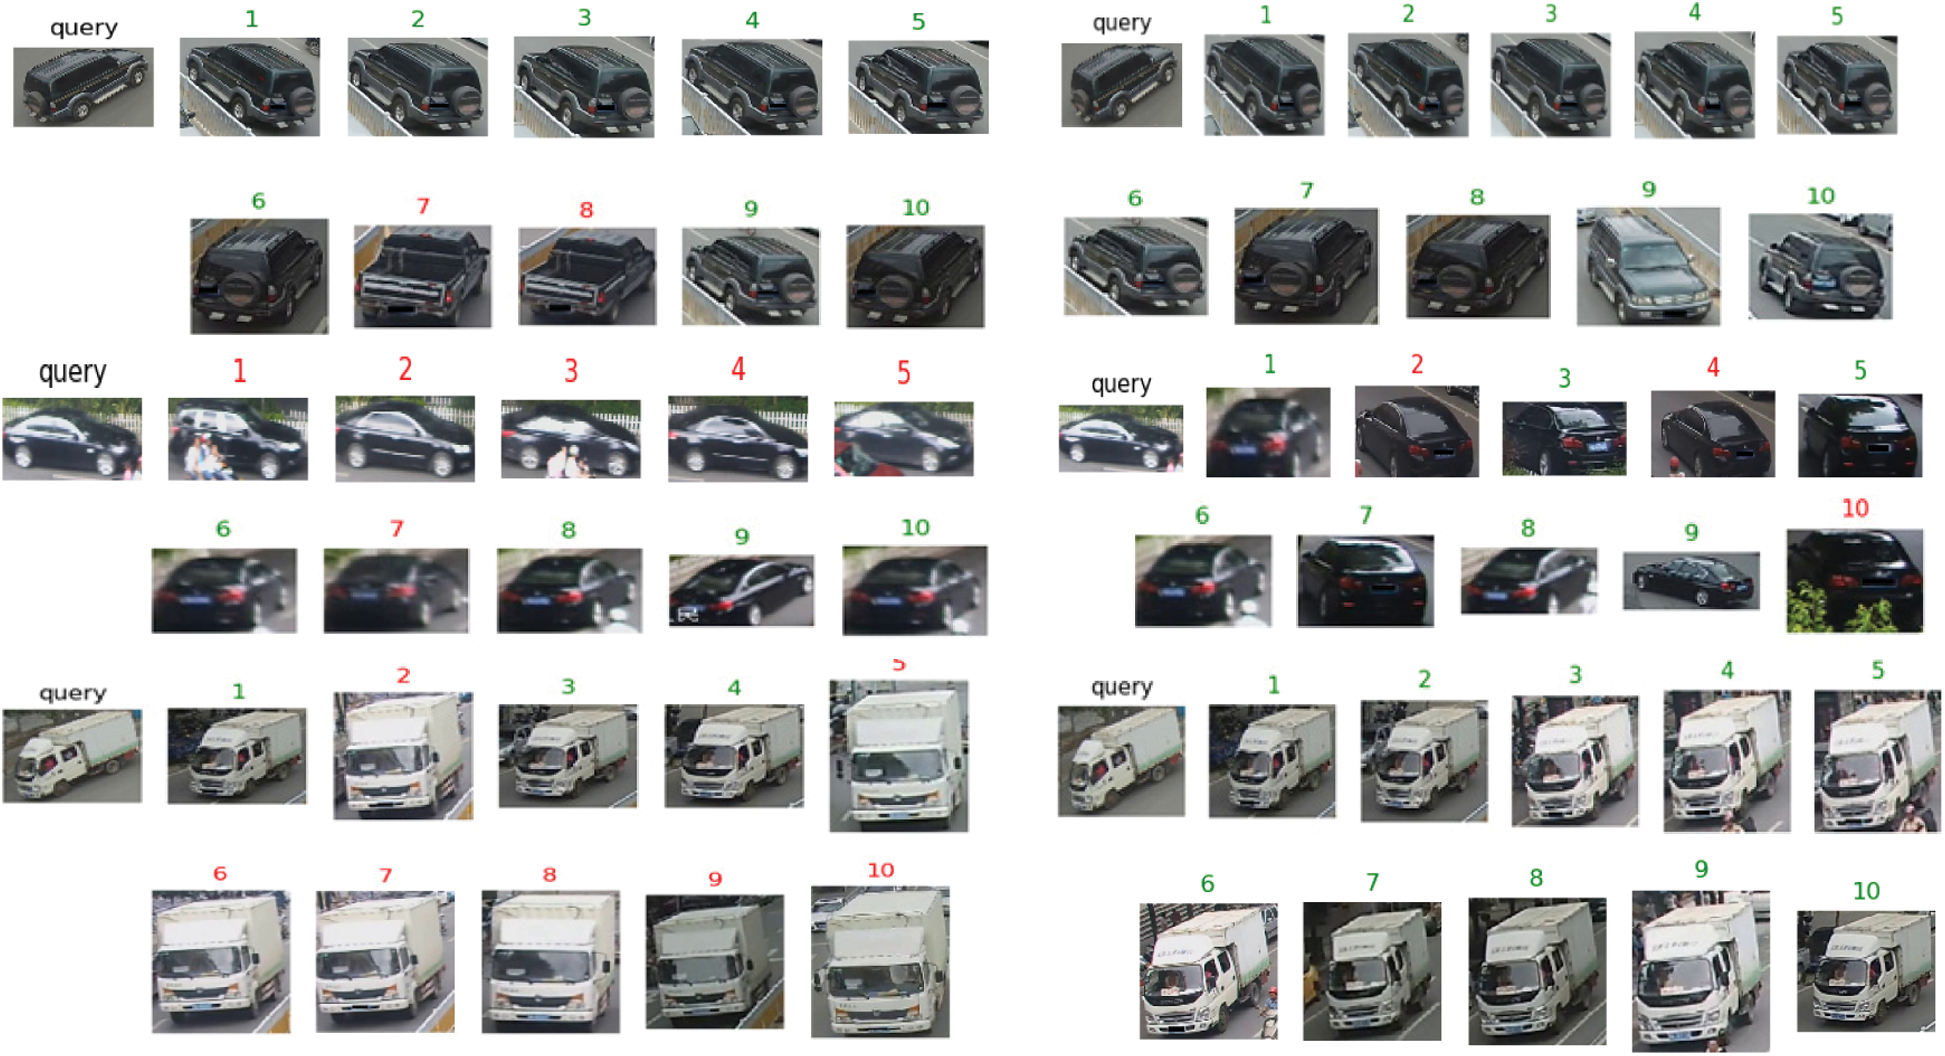
Figure 7: Visualization of vehicle re-ID results (rank-10) on the VeRi-776
4.4 Comparison with State-of-the-Art Methods
We compared the proposed method with other methods on VeRi-776 and VehicleID datasets. Among them, LOMO [33] is a traditional manual method, FACT [30] combines deep learning and traditional methods, and the rest is based on deep learning methods. On the two datasets, our method far exceeds LOMO and FACT, indicating that the deep learning method has greatly surpassed the traditional method, and it is an inevitable trend to solve the problem of vehicle Re-ID with deep learning. PRN [10] uses pre-trained YOLO to detect areas of interest such as car windows, lights, and license plates. OIFE [19] and AAVER [20] use key points to obtain local information. Both RAM [21] and SAN [22] learn the local features of each piece in blocks. All of the above methods belong to local feature learning. PAMTRI [8] assists feature learning by gesture estimation. Both VAMI [34] and EALN [35] methods use GAN network to generate vehicle images. It can be seen from Tabs. 2 and 3 that the proposed method is superior to the earlier mentioned methods. Compared with PAMTRI, which also utilizes DenseNet121 as the backbone, our method improves mAP and Rank-1 on VeRi by 3.6% and 1.9%, respectively. It is worth mentioning that our network structure is more concise than other network structures, and does not require substantial additional annotations and calculations. But the effect of the method of the present study is still behind that of PVEN [23]. PVEN enlarges the part of the common view of the vehicle image under different viewing angles and overcomes the huge differences in the instances under different views. The proposed method does not take into account the difference in viewing angles, and the accuracy rate needs to be further optimized. The focus on viewing angle characteristics is also a direction for future improvement.
Table 2: Performance comparison of different methods in analysis of VeRi-77 dataset
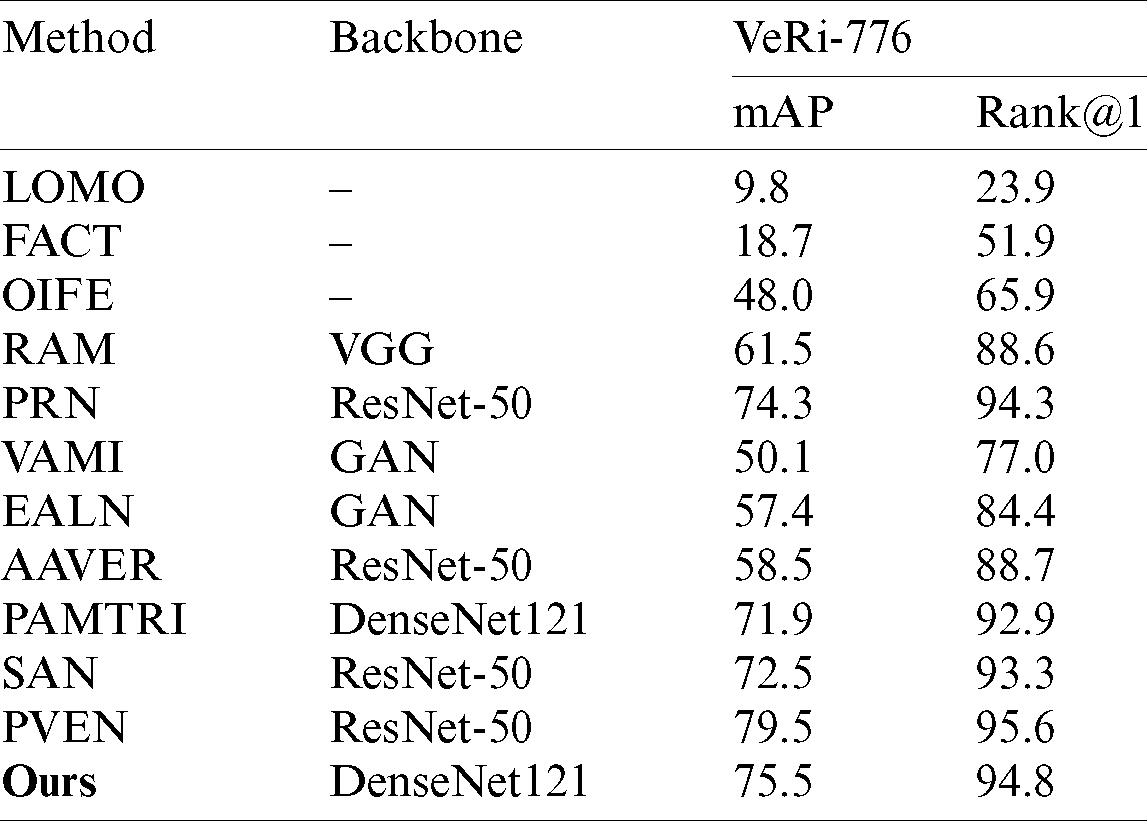
Table 3: Performance comparison of different methods in analysis of VehicleID dataset

In this paper, an end-to-end simple and efficient vehicle re-ID model is proposed, which uses the SE block combined with information from the middle layer to improve the performance of DenseNet121. The use of the SE block reduces the impact of useless features in the feature reuse process. At the same time, using the complementary expression advantages of CNN’s middle and deep features, the features of the middle and last layers are merged, so that the model can learn more effective and distinguishing features. In addition, the joint loss of focal loss and triplet loss is proposed for the first time in vehicle Re-ID. In the training process, more attention is paid to difficult-to-separate samples to enhance the model’s judgment. The experimental results demonstrate that, compared with the existing vehicle Re-ID methods, the proposed model is simple and efficient, and surpasses many current methods in the analysis of VeRi-776 and VehicleID datasets. In view of the challenges of intra-class differences in different views and inter-class similarities between different vehicles, vehicle Re-ID still has great research prospects. In future work, we will further consider the perspective difference based on the proposed model to extract more effective features and improve the performance of vehicle re-recognition. In addition, we will continue to simplify the complexity of the model, realize the lightweight of the model, and transplant it to smart devices in the future to realize real-time traffic scene vehicle Re-ID.
Funding Statement: This work was supported, in part, by the National Nature Science Foundation of China under Grant Numbers 61502240, 61502096, 61304205, 61773219; in part, by the Natural Science Foundation of Jiangsu Province under Grant Numbers BK20201136, BK20191401; in part, by the Priority Academic Program Development of Jiangsu Higher Education Institutions (PAPD) fund.
Conflicts of Interest: The authors declare that they have no conflicts of interest to report regarding the present study.
1. W. Sun, X. R. Zhang, X. Z. He, Y. Jin and X. Zhang. (2020). “A two-stage vehicle type recognition method combining the most effective gabor features,” Computers, Materials & Continua, vol. 65, no. 3, pp. 2489–2510. [Google Scholar]
2. W. Sun, H. J. Du, S. B. Nie and X. Z. He. (2019). “Traffic sign recognition method integrating multi-layer features and kernel extreme learning machine classifier,” Computers, Materials & Continua, vol. 60, no. 1, pp. 147–161. [Google Scholar]
3. S. D. Khan and H. A. Ullah. (2019). “Survey of advances in vision-based vehicle re-identification,” Computer Vision and Image Understanding, vol. 182, no. 3, pp. 50–63. [Google Scholar]
4. X. L. Tang, X. Sun, Z. Z. Wang, P. P. Yu, N. Cao et al. (2020). , “Research on the pedestrian re-identification method based on local features and gait energy images,” Computers, Materials & Continua, vol. 64, no. 2, pp. 1185–1198. [Google Scholar]
5. F. Wu, S. Y. Yan, J. S. Smith and B. L. Zhang. (2019). “Vehicle re-identification in still images: Application of semi-supervised learning and re-ranking,” Signal Processing: Image Communication, vol. 76, no. 4, pp. 261–271. [Google Scholar]
6. Y. T. Shen, T. Xiao, H. S. Li, S. Yi and X. G. Wang. (2017). “Learning deep neural networks for vehicle re-id with visual-spatio-temporal path proposals,” in Proc. ICCV, Venice, Italy, pp. 1900–1909. [Google Scholar]
7. R. Kuma, E. Weill, F. Aghdasi and P. Sriram. (2019). “Vehicle re-identification: An efficient baseline using triplet embedding,” in Proc. IJCNN, Budapest, HUN, pp. 1–9. [Google Scholar]
8. Z. Tang, M. Naphade, S. Birchfield, J. Tremblay, W. Hodge et al. (2019). , “Pamtri: Pose-aware multi-task learning for vehicle re-identification using highly randomized synthetic data,” in Proc. ICCV, Seoul, Korea, pp. 211–220. [Google Scholar]
9. X. Fu, X. Yang, Z. G. Cao, K. C. Gong, Z. W. Fang et al. (2018). , “Towards good practices on building effective CNN baseline model for person re-identification,” arXiv preprint arXiv: 1807. 11042. [Google Scholar]
10. B. He, J. Li, Y. F. Zhao and Y. H. Tian. (2019). “Part-regularized near-duplicate vehicle re-identification,” in Proc. CVPR, Long Beach, CA, pp. 3997–4005. [Google Scholar]
11. X. Y. Zhang, R. F. Zhang, J. W. Cao, D. Gong, M. Y. You et al. (2019). , “Part-guided attention learning for vehicle re-identification,” arXiv preprint arXiv: 1909. 06023. [Google Scholar]
12. Q. Yu, X. B. Chang, Y. Z. Song, T. Xiang and T. M. Hospedales. (2017). “The devil is in the middle: Exploiting mid-level representations for cross-domain instance matching,” arXiv preprint arXiv: 1711. 08106. [Google Scholar]
13. H. Y. Liu, Y. H. Tian, Y. W. Yang, L. Pang and T. J. Huang. (2016). “Deep relative distance learning: Tell the difference between similar vehicles,” in Proc. CVPR, Las vegas, USA, pp. 2167–2175. [Google Scholar]
14. Y. H. Zhang, D. Liu and Z. J. Zha. (2017). “Improving triplet-wise training of convolutional neural network for vehicle re-identification,” in Proc. ICME, Hong Kong, China, pp. 1386–1391. [Google Scholar]
15. Y. Bai, Y. H. Lou, F. Gao, S. Q. Wang, Y. Wu et al. (2018). , “Group-sensitive triplet embedding for vehicle reidentification,” Transactions on Multimedia, vol. 20, no. 9, pp. 2385–2399. [Google Scholar]
16. G. Huang, Z. Liu, V. D. M. Laurens and K. Q. Weinberger. (2017). “Densely connected convolutional networks,” in Proc. CVPR, Hawaii, USA, pp. 4700–4708. [Google Scholar]
17. K. M. He, X. Y. Zhang, S. Q. Ren and J. Sun. (2016). “Deep residual learning for image recognition,” in Proc. CVPR, Las vegas, USA, pp. 770–778. [Google Scholar]
18. J. G. Zilly, R. K. Srivastava, J. Koutnık and J. Schmidhuber. (2017). “Recurrent highway networks,” in Proc. ICML, Sydney, Australia, pp. 4189–4198. [Google Scholar]
19. Z. D. Wang, L. T. Tang, X. H. Liu, Z. L. Yao, S. Yi et al. (2017). , “Orientation invariant feature embedding and spatial temporal regularization for vehicle re-identification,” in Proc. ICCV, Venice, Italy, pp. 379–387. [Google Scholar]
20. P. Khorramshahi, A. Kumar, N. Peri, S. S. Rambhatla, J. C. Chen et al. (2019). , “A dual path model with adaptive attention for vehicle re-identification,” in Proc. ICCV, Seoul, Korea, pp. 6132–6141. [Google Scholar]
21. X. B. Liu, S. L. Zhang, Q. M. Huang and W. Gao. (2018). “Ram: A region-aware deep model for vehicle re-identification,” in Proc. ICME, San Diego, USA, pp. 1–6. [Google Scholar]
22. J. Qian, W. Jiang, H. Luo and H. Y. Yu. (2020). “Stripe-based and attribute aware network: A two-branch deep model for vehicle re-identification,” Measurement Science and Technology, vol. 31, no. 9, pp. 1–9. [Google Scholar]
23. D. C. Meng, L. Li, X. J. Liu, Y. D. Li, S. J. Yang et al. (2020). , “Parsing-based view-aware embedding network for vehicle re-identification,” in Proc. CVPR, Virtual, pp. 7103–7112. [Google Scholar]
24. L. J. Yang, P. Luo, C. L. Chen and X. O. Tang. (2015). “A large scale car dataset for fine-grained categorization and verification,” in Proc. CVPR, Boston, USA, pp. 3973–3981. [Google Scholar]
25. A. Kanaci, X. T. Zhu and S. Guo. (2017). “Vehicle reidentification by fine-grained cross-level deep learning,” in Proc. BMVC, London, UK, pp. 772–788. [Google Scholar]
26. H. B. Wang, J. J. Peng, D. Y. Chen, G. Q. Jiang, T. T. Zhao et al. (2020). , “Attribute-guided feature learning network for vehicle re-identification,” arXiv preprint arXiv: 2001. 03872. [Google Scholar]
27. J. Hu, L. Shen and G. Sun. (2018). “Squeeze-and-excitation networks,” in Proc. CVPR, Salt Lake, USA, pp. 7132–7141. [Google Scholar]
28. T. Y. Lin, P. Goyal, R. Girshick, K. M. He and P. Dollar. (2017). “Focal loss for dense object detection,” in Proc. ICCV, Venice, Italy, pp. 2980–2988. [Google Scholar]
29. Z. Zhong, L. Zheng, G. L. Kang, S. Z. Li and Y. Yang. (2020). “Random erasing data augmentation,” in Proc. AAAI, New York, USA, pp. 13001–13008. [Google Scholar]
30. X. C. Liu, W. Liu, H. D. Ma and H. Y. Fu. (2016). “Large-scale vehicle reidentification in urban surveillance videos,” in Proc. ICME, Seattle, USA, pp. 1–6. [Google Scholar]
31. X. R. Zhang, X. Chen, W. Sun and K. Ge. (2020). “Progress of vehicle re-identification research based on deep learning,” Computer Engineering, vol. 46, no. 11, pp. 1–11. [Google Scholar]
32. X. Fan, W. Jiang, H. Luo and M. Fei. (2019). “Spherereid: Deep hypersphere manifold embedding for person re-identification,” Visual Communication and Image Representation, vol. 60, pp. 51–58. [Google Scholar]
33. S. C. Liao, Y. Hu, X. Y. Zhu and S. T. Li. (2015). “Person re-identification by local maximal occurrence representation and metric learning,” in Proc. CVPR, Boston, USA, pp. 2197–2206. [Google Scholar]
34. Y. Zhou and L. Shao. (2018). “Aware attentive multi-view inference for vehicle re-identification,” in Proc. CVPR, Salt Lake, USA, pp. 6489–6498. [Google Scholar]
35. Y. H. Lou, Y. Bai, J. Liu, S. Q. Wang and L. Y. Duan. (2019). “Embedding adversarial learning for vehicle re-identification,” Transactions on Image Processing, vol. 28, no. 8, pp. 3794–3807. [Google Scholar]
 | This work is licensed under a Creative Commons Attribution 4.0 International License, which permits unrestricted use, distribution, and reproduction in any medium, provided the original work is properly cited. |