DOI:10.32604/cmc.2021.012540
| Computers, Materials & Continua DOI:10.32604/cmc.2021.012540 | |
| Article |
Analysis and Forecasting COVID-19 Outbreak in Pakistan Using Decomposition and Ensemble Model
1Institute of Computing Science and Technology, Guangzhou University, Guangzhou, 510006, China
2Department of Statistics, Abdul Wali Khan University, Mardan, 23200, Pakistan
3Department of English, University of Malakand, Chakdara, 188800, Pakistan
4Department of Natural Sciences and Humanities, University of Engineering and Technology, Lahore, 54000, Pakistan
*Corresponding Author: Muhammad Aamir. Email: aamirkhan@awkum.edu.pk
Received: 30 August 2020; Accepted: 16 January 2021
Abstract: COVID-19 has caused severe health complications and produced a substantial adverse economic impact around the world. Forecasting the trend of COVID-19 infections could help in executing policies to effectively reduce the number of new cases. In this study, we apply the decomposition and ensemble model to forecast COVID-19 confirmed cases, deaths, and recoveries in Pakistan for the upcoming month until the end of July. For the decomposition of data, the Ensemble Empirical Mode Decomposition (EEMD) technique is applied. EEMD decomposes the data into small components, called Intrinsic Mode Functions (IMFs). For individual IMFs modelling, we use the Autoregressive Integrated Moving Average (ARIMA) model. The data used in this study is obtained from the official website of Pakistan that is publicly available and designated for COVID-19 outbreak with daily updates. Our analyses reveal that the number of recoveries, new cases, and deaths are increasing in Pakistan exponentially. Based on the selected EEMD-ARIMA model, the new confirmed cases are expected to rise from 213,470 to 311,454 by 31 July 2020, which is an increase of almost 1.46 times with a 95% prediction interval of 246,529 to 376,379. The 95% prediction interval for recovery is 162,414 to 224,579, with an increase of almost two times in total from 100802 to 193495 by 31 July 2020. On the other hand, the deaths are expected to increase from 4395 to 6751, which is almost 1.54 times, with a 95% prediction interval of 5617 to 7885. Thus, the COVID-19 forecasting results of Pakistan are alarming for the next month until 31 July 2020. They also confirm that the EEMD-ARIMA model is useful for the short-term forecasting of COVID-19, and that it is capable of keeping track of the real COVID-19 data in nearly all scenarios. The decomposition and ensemble strategy can be useful to help decision-makers in developing short-term strategies about the current number of disease occurrences until an appropriate vaccine is developed.
Keywords: Analysis; ARIMA; COVID-19; decomposition and ensemble model; forecasting
Several pneumonia cases were reported in the capital of Hubei Province, Wuhan city, China, in December 2019. The relevant cause for this disease was recognized as a novel Coronavirus which has recently been termed as a serious intense respiratory disorder Coronavirus 2 (SARS-CoV-2) [1]. The major symptoms of the disease include hack, fever, malaria, runs, and dyspnea [2]. The fatality rate concerning COVID-19 is 2%–3%. However, this rate increases among old patients and patients with co-morbidities. COVID-19 is a growing infection and exact information about it is not accessible even in well-advanced countries. The authors in [3] investigated the pandemic pattern and expectation of COVID-19 in Iran. They utilized the complete daily reports of COVID-19 patients (hospitalization and extreme cases) stated by the Iranian Ministry of Health and Medical Education. The forecast models of Least Square Error (LSE) and Gompertz Von Bertalanffy were utilized to foresee the number of cases from April 3, 2020, till May 13, 2020 [3].
The disease is growing fast, and its wide-range spread damages numerous lives as well as the economy. To explore and find useful and remedial measures, it is important to know about the lifetime of the disease. These measures include shutting down schools, fringes, suspending network administrations, and workers. These circumstances deteriorated economic growth in many countries. Having the option to exactly predict the destiny of a disease is critical, however, the collection of associated data is difficult in the time of crises. Due to these factors, the present sample data are limited. This was the reason for opting the machine learning approaches that provide the forecasts with a higher accuracy rate. The authors in [4] proposed a methodology that can provide the best forecasts by using small data sets. They experimented on the COVID-19 outbreak data using their proposed methodology. The authors highlighted that the proposed algorithm provides the lowest forecasting error in comparison with other available models and named the “Polynomial Neural Network with Corrective Feedback (PNNCF)” model. The outcome of the study revealed that the newly established model provides the best forecast for the novel COVID-19 outbreak with limited data in hand and can help mankind in this difficult time.
Starting on 26 March 2020, Pakistan had 1179 COVID-19 instances, comprising a majority of 421 cases from Sindh, 394 cases from Punjab, 131 cases from Baluchistan, 123 cases from Khyber Pakhtunkhwa, 84 cases from Gilgit-Baltistan, 25 cases from the Capital city Islamabad and1 case from Azad Jammu and Kashmir [5]. The fundamental source of spreading the COVID-19 outbreak in Pakistan was travelling. Considering all factors, the number of spreading infectious instances is increasing in Pakistan daily. Starting on 26 March 2020, nine deaths had been recorded from COVID-19 [5]. The mortality rate from COVID-19 in Pakistan is 0.8%, comparatively smaller than that of the USA, Iran, China, and Italy [5]. The SIR (Susceptible-Infected-Recovered) model of epidemiological examination predicts that just about 90 million inhabitants will be infected in the coming days with 5% serious. In any case, the Pakistan social insurance framework cannot deliver facilities to such a large population. Subsequently, appropriate measures need to be taken in time to lessen this number by limiting neighborhood transmission of the infection. This should be possible by isolation, segregation, mass testing, and social separating of the dynamic coronavirus cases in Pakistan. In addition, better correspondence between the specialists is required to control the COVID-19 outbreak transmission [6].
Within the present scenario, the main focus would be on preventing the uncontrollable disease and on designing a human services framework for desired outcomes. It is, therefore, essential to develop statistical models that are computationally sound and can help plan initiators in particular and the overall population in general. Giving a future estimate of a conceivable number of daily cases can help the clinical workers attending new patients. Thus, forecasting models should be capable of governing worldwide disease risk. Therefore, authors in [7] utilized the ARIMA model for forecasting the growth rate of 2019-nCov infection. When contrasted with other forecasting models, for example, Wavelet Neural System (WNS) and Support Vector Machine (SVM), the ARIMA model is progressively capable in the forecast of typical complexities. The authors selected the best ARIMA model for the given data in hand and provided the forecasts for the upcoming 20 days of new confirmed cases. The basic goal of their study was to identify the best forecasting model for the COVID-19 outbreak and provide a reasonable estimate of the new cases in India [7]. Authors in [5] have conducted a study dependent on information from the National Institution of Health Islamabad (NIHI) and forecasted the COVID-19 outbreak in Pakistan including the new cases, recoveries, and deaths by using the classical ARIMA model. The chosen forecasted models highlighted that the number of new cases, recoveries, and deaths are increasing in Pakistan at an exponential rate. The forecasted results showed that the new cases in Pakistan will increase 2.7 times by the end of May 2020. It was observed that the number of recoveries increases rapidly and an increase of 8 times is expected by the end of May 2020. Similarly, the total number of deaths could touch a figure of 500 by the end of May 2020, and the increase is almost three times the current number of deaths on 12 April 2020. These results showed an alarming situation in Pakistan for May 2020. The health and government authorities should adopt the new methodologies to better stop this pandemic from further spread until proper medication or vaccine is developed [5].
This study is motivated by the study of [5], where it is argued, based on 47 historical observations of the COVID-19 outbreak from 26 Feb 2020 to 12 April 2020, the number of observations is not enough and requires accurate time-series forecasting. Moreover, they only used the ARIMA model to provide the forecast for May 2020. However, in this study, we used the ARIMA model as a benchmark and employed a more sophisticated model that can handle the non-stationarity and nonlinearity of the COVID-19 data. Furthermore, we used 126 intraday values from 26 Feb 2020 to 30 Jun 2020 and provided the forecast for the next 31 days until 31 Jul 2020 for confirmed cases, deaths, and recoveries in Pakistan.
The framework of this study is presented in Fig. 1 and the steps involved are outlined below:
• In the first step, the original times series of COVID-19 outbreak are decomposed into IMFs including the number of confirmed cases, deaths, and recovered cases by applying the EEMD technique.
• In the second step, for each IMF, the best ARIMA model is selected through the Box-Jenkins procedure and the same model is used to forecast each IMF.
• In the third step, we ensemble all the forecasts for the final output.
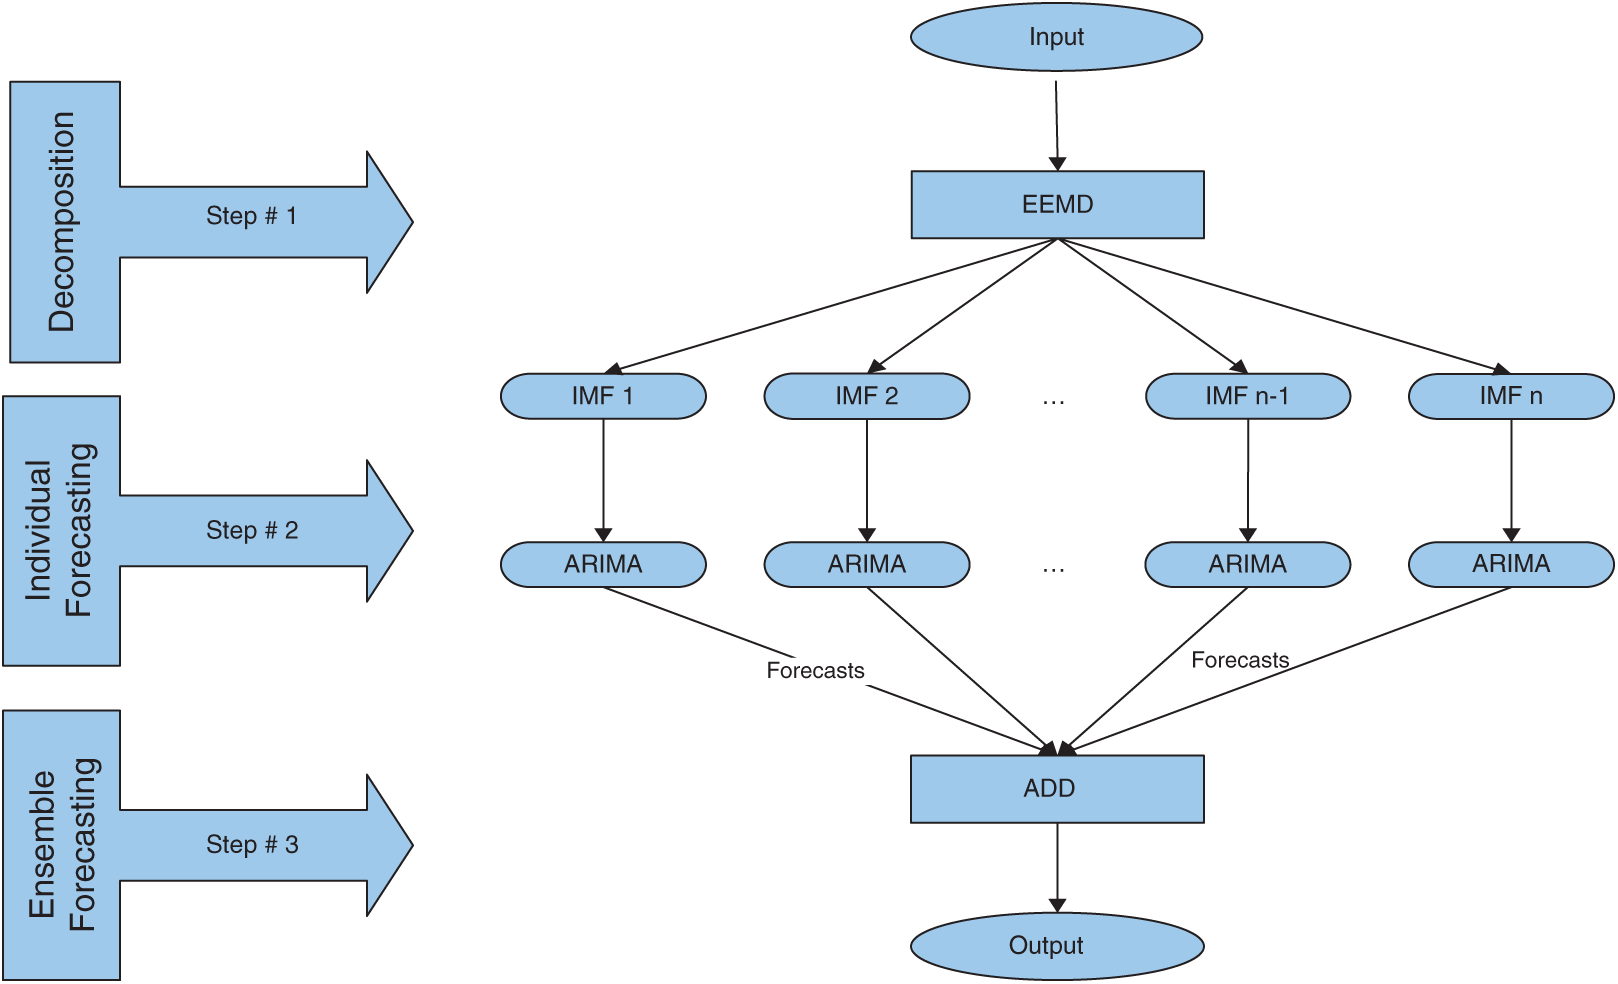
Figure 1: Flowchart of this study
In the end, the individual ARIMA model is compared with the decomposition and ensemble models to assess which model provides more accurate forecasts to be utilized in the future. For a clearer picture, the framework of this study is shown in Fig. 1.
2.2 Statistical Model Development for Analysis
For time series analysis and to predict the COVID-19 outbreak for the next twenty days, the ARIMA model is widely exploited. Since time series data are both nonlinear and nonstationary (which are the basic assumptions for the ARIMA model), the EEMD technique is used to handle this assumption. EEMD decomposed the original time-series into several independent components called IMFs. EEMD procedure developed by the authors [8], is an experimental technique that is employed to express a nonstationary and nonlinear form of real data. This data pre-preparing technique is an improvement upon the EMD time-frequency, self-versatile, and does not depend on process data and transformation methodology. EMD is mainly utilized for disintegrating the unique time-series into a limited and low number of oscillatory components relying upon the local distinctive time scale [9].
EEMD technique is exploited to divide the original time-series into several independent IMFs. Each IMF must satisfy two conditions: (i) over the extracted IMF, the number of extrema and zero-crossing must not differ by at most 1, (ii) the mean formed by the two envelopes at any point of the signal must be equal to zero. Employing these two conditions, some meaningful IMFs could be extracted from the original time-series. The steps used in EEMD are the following: (i) a white noise series is added to the original series Yt (ii) the IMFs must be obtained from the new added white noise series (iii) replicate the steps (i) and (ii) over and over by accumulating a different white noises series to the original series Yt [10]. Due to the added white noise, the EEMD yields meaningful and genuinely stable procedures [11].
After the decomposition step, the ARIMA model was applied to all the extracted IMFs. ARIMA is one of the best modelling techniques and has been widely used [12]. The standard notation of the ARIMA model is ARIMA(p, d, q), where p and q represent the order of autoregressive and moving average terms respectively, and d indicates the order of drift level change. To determine the order of the ARIMA model Autocorrelation Function (ACF) and Partial Autocorrelation Function (PACF) plots are utilized because that auto.arima command does not always work well. Subsequently, these selected models are tried for variance normality. In the next step, these models are tested for forecast accuracy to decide about the best model using Mean Absolute Deviation (MAD), Mean Absolute Percentage Error (MAPE), and Mean Squared Deviation (MSD). Likewise, the fitted ARIMA model compared with other candid models including Quadratic, Linear, and S-Curve Trends, Moving Average, Single, and Double Exponential models exploiting forecasting accuracy measures MAD, MSD, and MAPE to select the best model to predict. Due to the restricted access to information, we emphasize non-seasonal models to represent the trend (increase or decrease) after some time. Henceforth, we expected that the trend of the current COVID-19 cases would proceed soon (no less than a month). It is believed that the ARIMA model provides a good forecast for the short timeframe information. The predicted intervals until the end of July 2020 are provided for new confirmed, deaths and recovered cases in Pakistan. The COVID-19 data was analyzed through the R programming language by using the packages like “t series, zoo, and forecast” to get the best ARIMA model [5].
Finally, the fitted model parameters are evaluated followed by model confirmation and used to predict the COVID-19 cases (confirmed, deaths and recoveries) for the upcoming 31 days, i.e., from 1 Jul 2020 to 31 Jul 2020. The
where, Yt represents the confirmed new cases of COVID-19 outbreak at tth day,
2.3 Forecast Evaluation Criterions
As one of the important criteria in time series analysis is the forecast evaluation of competing models, so to test the robustness and generalizability of the EEMD-ARIMA model for the COVID-19 outbreak in Pakistan, three forecasting measures for evaluation are employed in this study. These criteria are Root Mean Square Error (RMSE), Mean Absolute Error (MAE), and MAPE. The former two are the absolute measures, while the latter is the relative measure, and their mathematical equations are as follows:
•
•
•
where Yi and
3 Data Analysis and Discussions
In this study, the daily data of the Pakistan COVID-19 outbreak (confirmed, deaths, and recovered) are used. The data are obtained from the official website of Pakistan [13] which is publicly available, designated for COVID-19 outbreak, and is updated daily. The first case of the coronavirus was filed on 26 Feb 2020 in Pakistan. Thus, the data utilized in this study are from 26 Feb 2020 to 30 Jun 2020, summing up to a total of 126 intraday values. A dashboard summary of the COVID-19 outbreak of Pakistan is presented in Fig. 2. Firstly, the data were divided into two parts, the first 100 observations from 26 Feb 2020 to 04 Jun 2020 are used to train the model, while the rest of the observations from 05 Jun 2020 to 30 Jun 2020 are employed as the testing set to evaluate the models. The best-forecasted model based on forecasting evaluation criteria was selected and used to provide the forecasts for the next month dated 01 Jul 2020 to 31 Jul 2020 for confirmed cases, deaths, and recoveries in Pakistan.
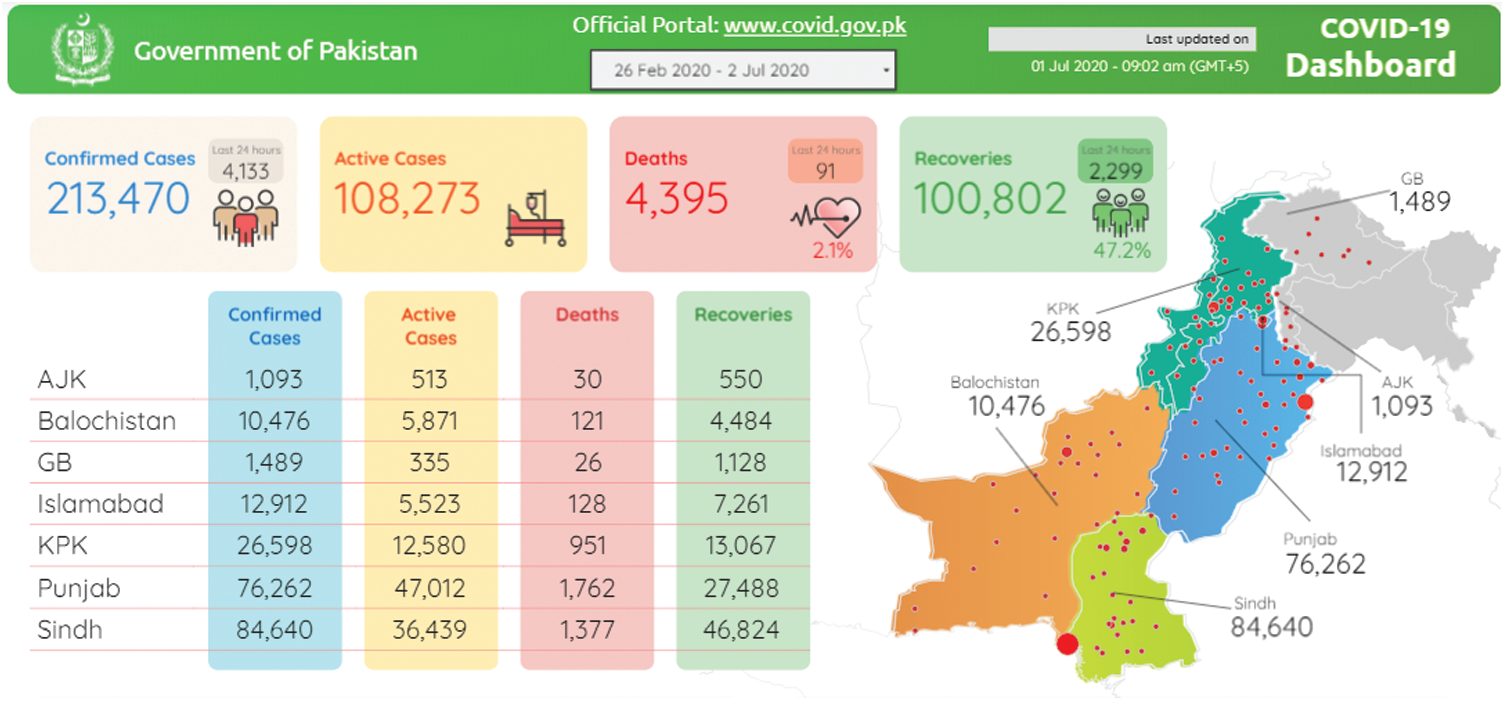
Figure 2: Dashboard summary of the COVID-19 outbreak of Pakistan from 26 Feb 2020 to 30 Jun 2020. Source: http://COVID.gov.pk/stats/pakistan
The total number of confirmed cases, deaths, and recoveries of the COVID-19 outbreak in Pakistan to date are 213470, 4395, and 100802 respectively. All three daily accumulative time series are shown in Fig. 3. It can be observed from Fig. 3, that only the trend and random effect are present while there is no sign of seasonality. All the datasets are shown daily on the plot. From Fig. 3, it can be seen that the COVID-19 cases in Pakistan are increasing exponentially which is alarming for health and government officials in Pakistan. The authorities should adopt new policies to control the COVID-19 outbreak from further spreading before a proper medication or vaccine is developed.
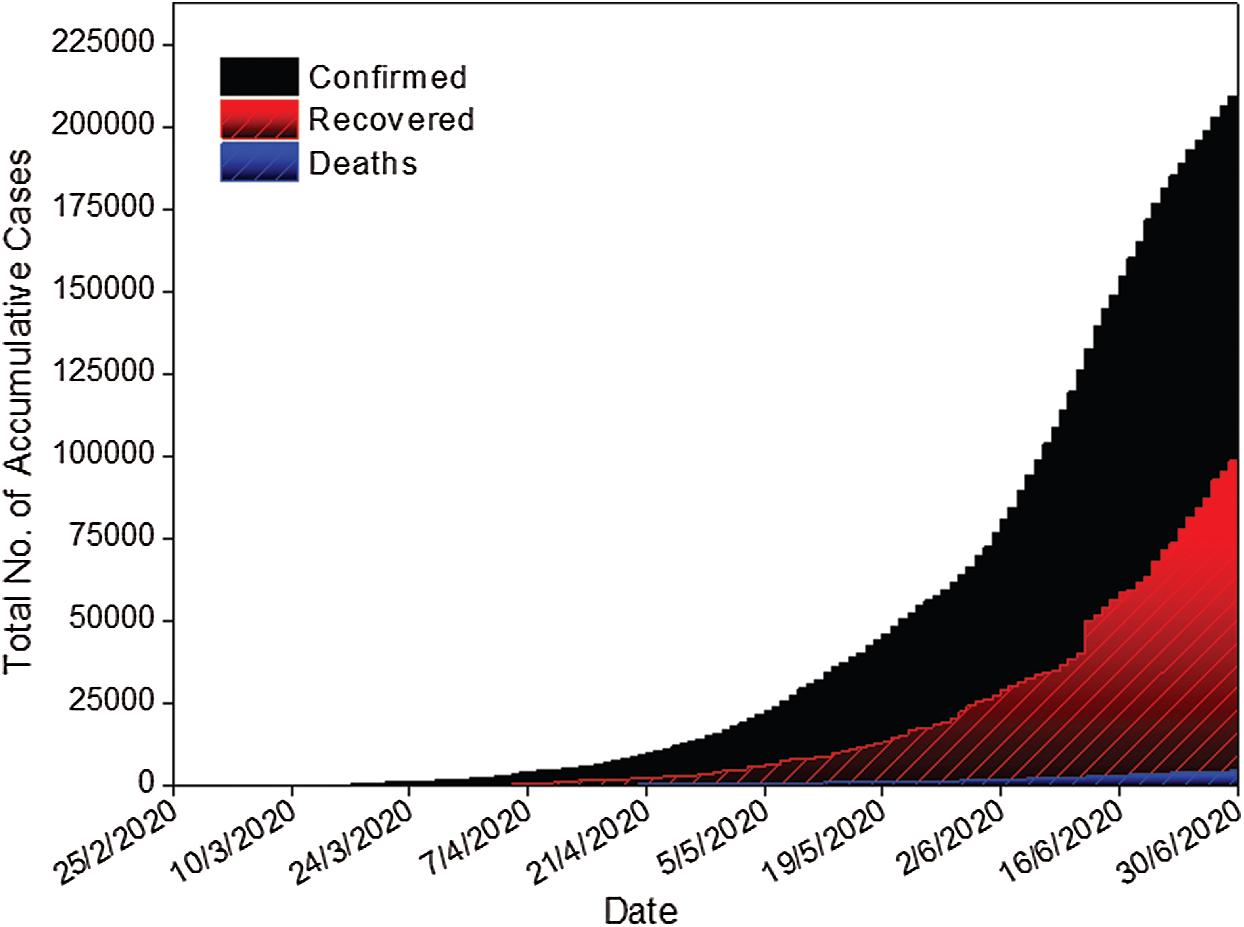
Figure 3: Plot of the total number of accumulative cases from 26 Feb 2020 to 30 Jun 2020
The complete description of all the three data sets, i.e., Confirmed, Recovered and Death cases are presented in Tab. 1.
Table 1: Description of all data sets

Two parameters directly affecting the performance of the EEMD model i.e., white noise magnitude and ensemble size, should be fixed before using EEMD. The already established rule for fixing these parameters is,
Using the above description, the EEMD technique is employed in this work and three data sets of COVID-19 outbreak in Pakistan are decomposed. For data decomposition, the freely available R software package “Rlibeemd” has been used [14]. Figs. 4–6 represent the decomposition results of all three data sets (Confirmed, Deaths, and Recovered). It is observed that all IMFs had different amplitudes, wavelengths, and frequencies. The First IMF had the lowest wavelength, maximum amplitude, and highest frequency. The second IMF had a smaller amplitude and frequency with larger wavelengths as compared to the first IMF. Similarly, this pattern continues up to the last IMF where the wavelength increases while the corresponding frequency and amplitude decrease. Therefore, the decomposition provided by EEMD is physically meaningful with different scales for every IMF, which are all independent [15]. Hence, the results of the decompositions would help in improving the forecasting accuracy of new confirmed cases, deaths, and recoveries of COVID-19 outbreak in Pakistan.
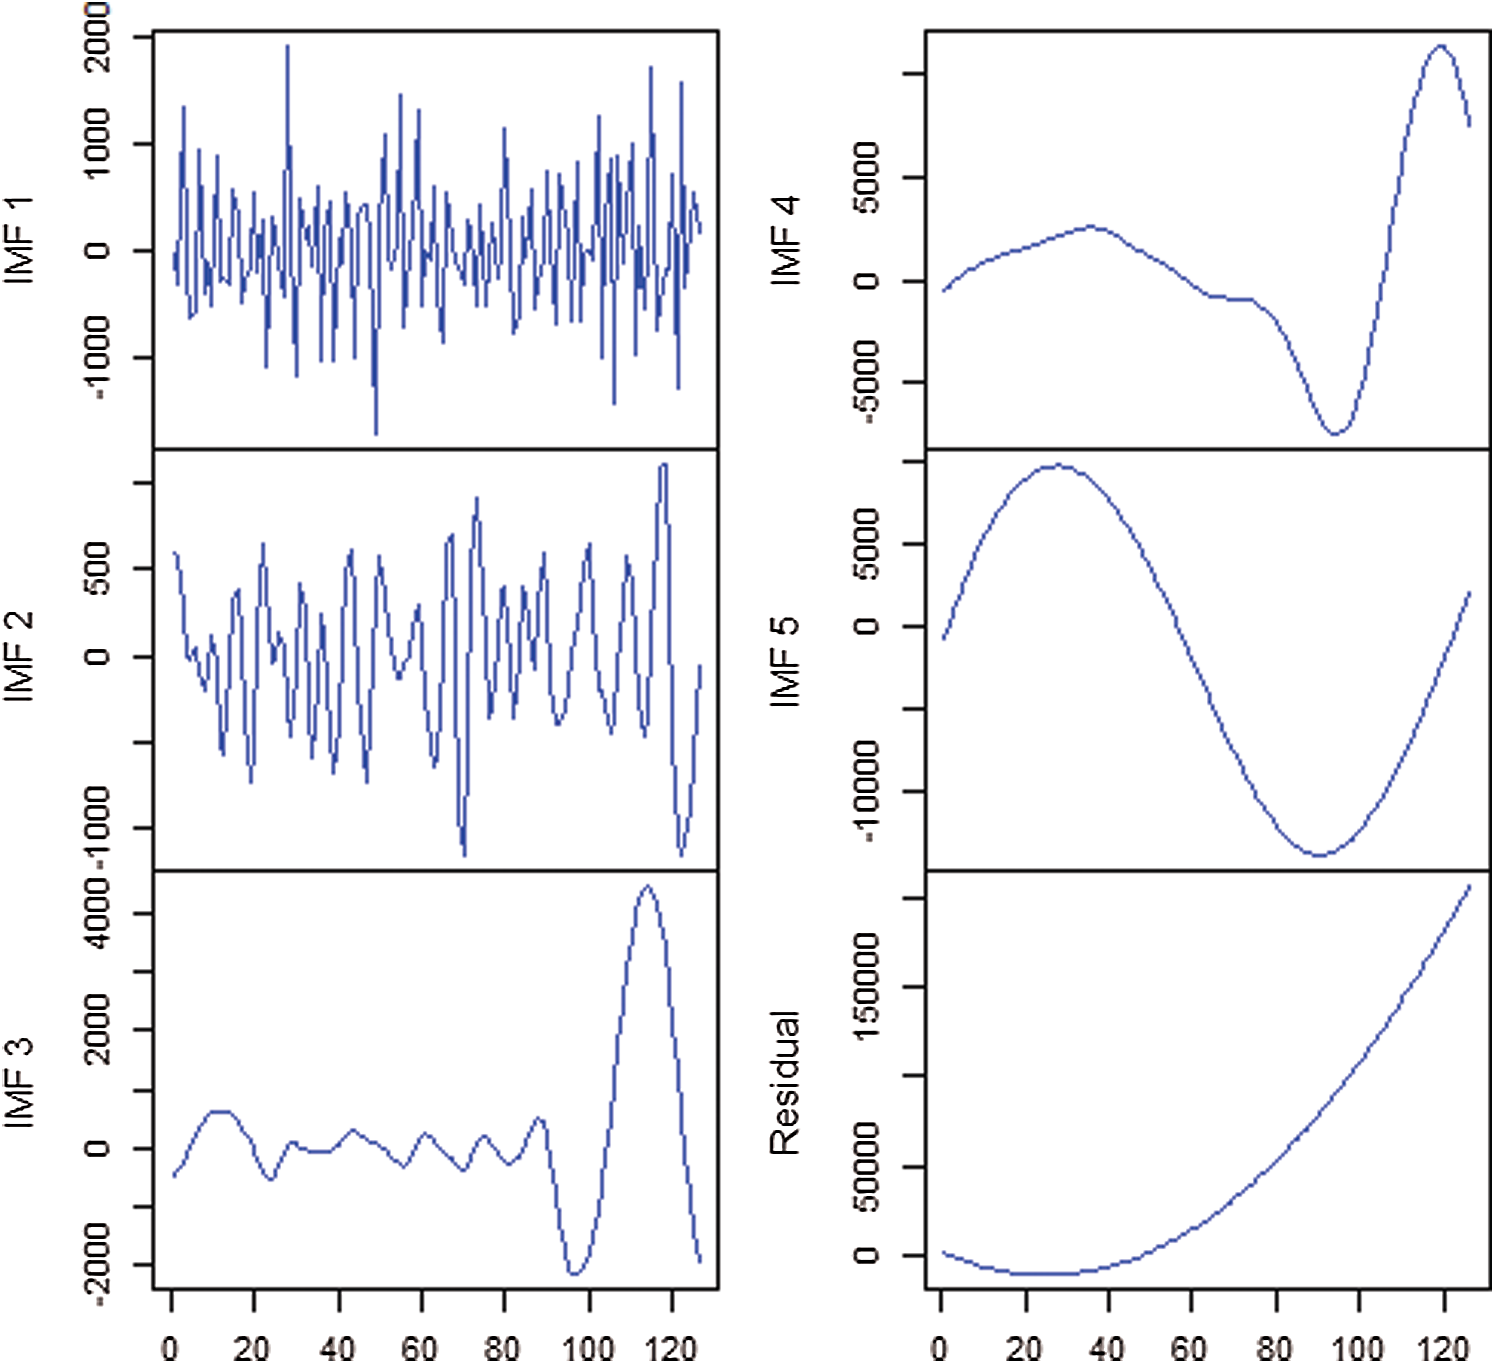
Figure 4: IMFs of confirmed cases of Pakistan
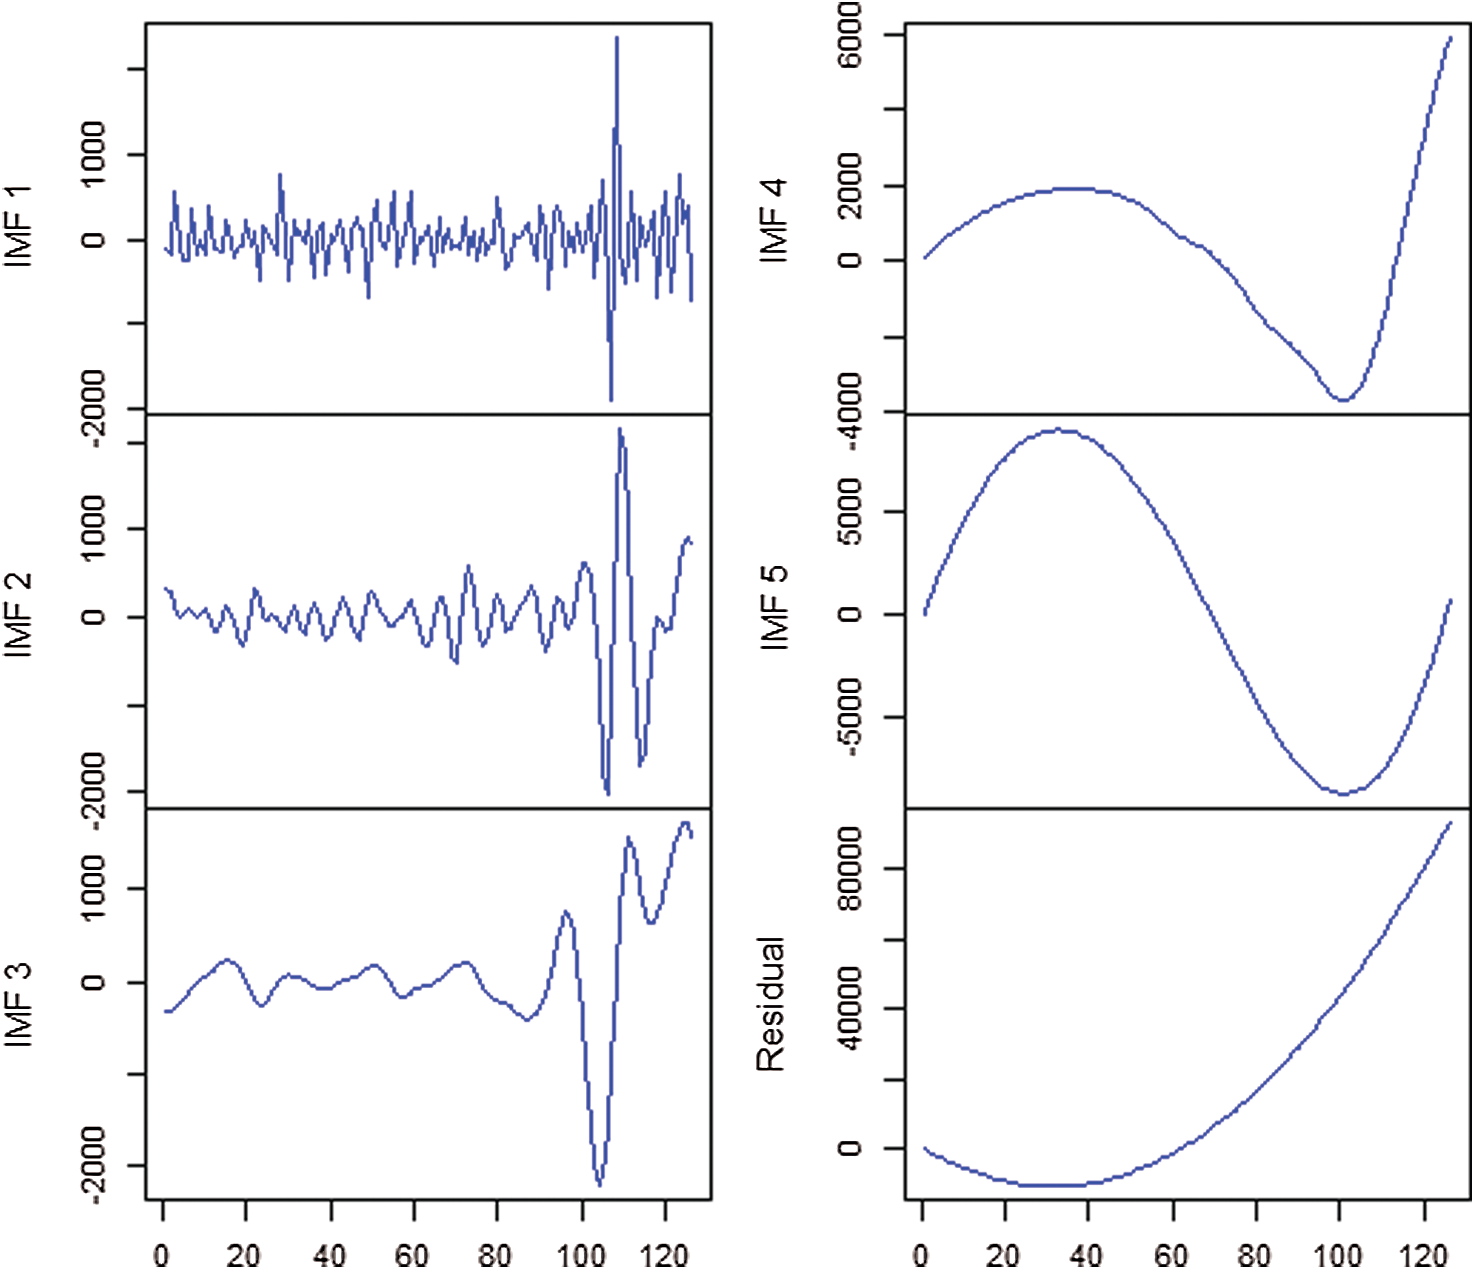
Figure 5: IMFs of recovered cases of Pakistan
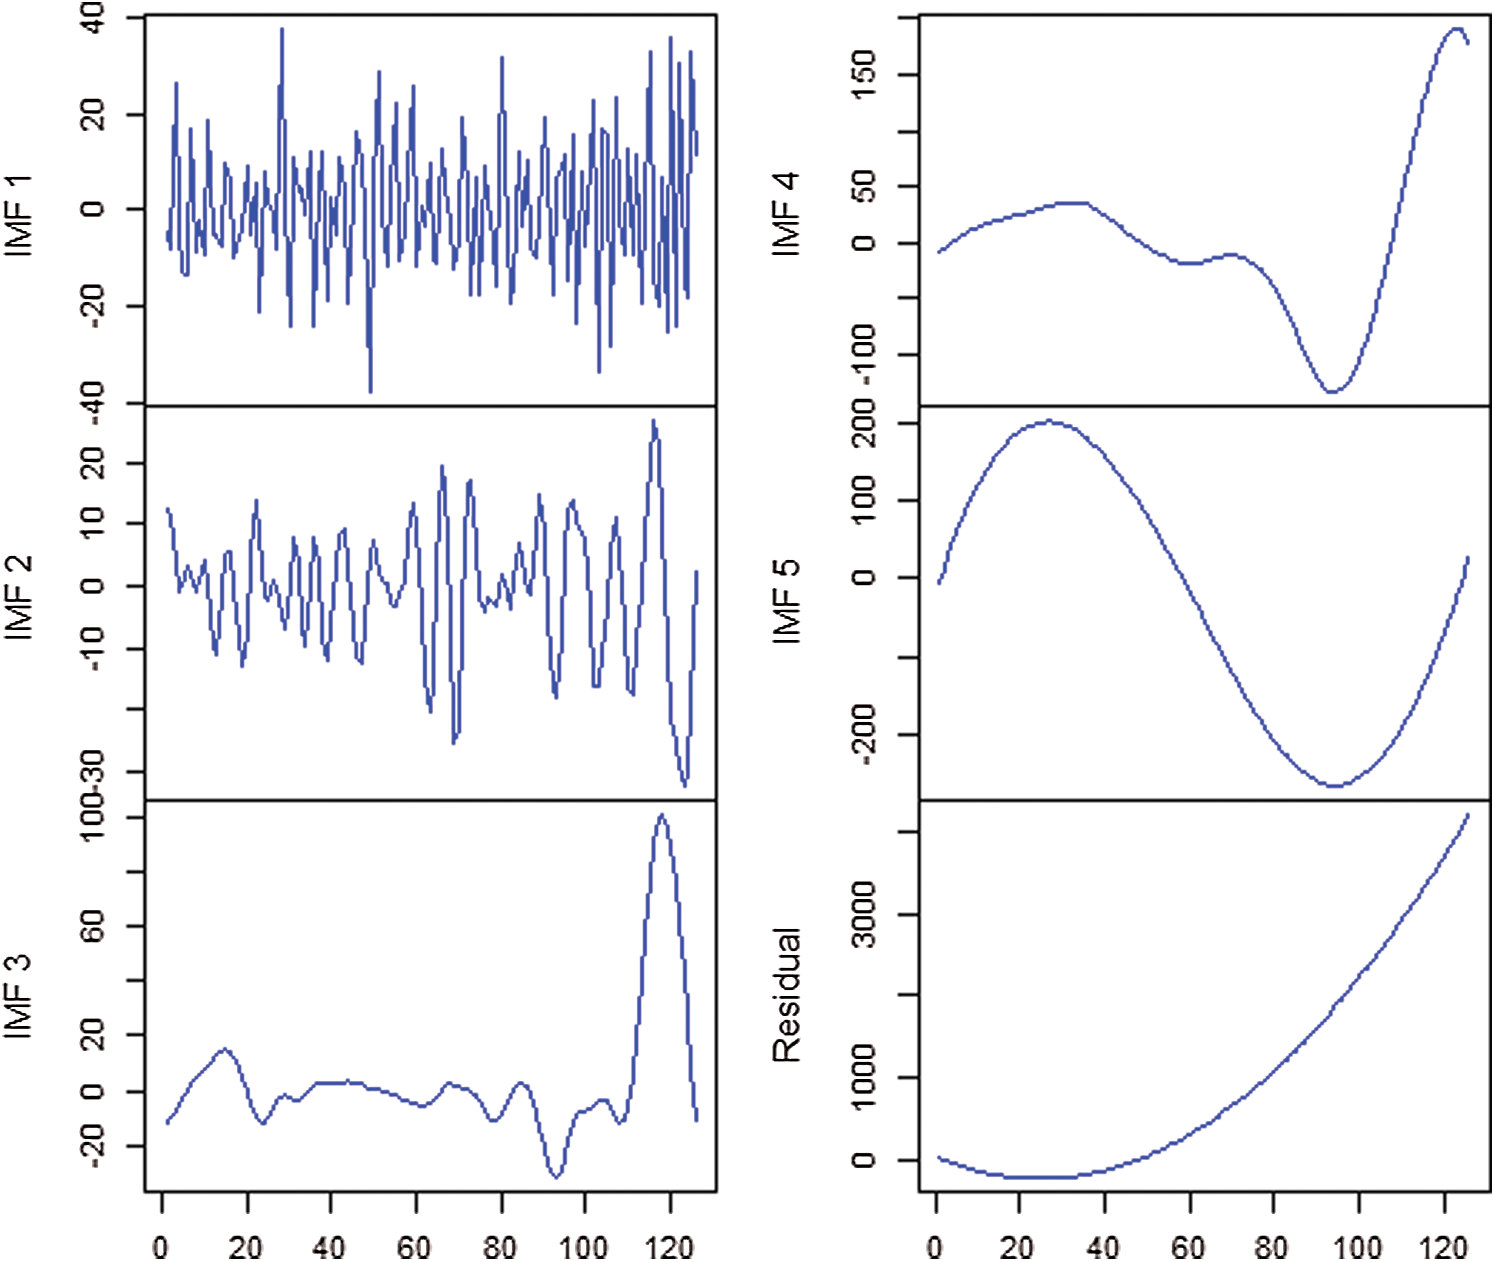
Figure 6: IMFs of death cases of Pakistan
In this section, the best ARIMA models for new Confirmed cases, Deaths, and recoveries of the COVID-19 outbreak in Pakistan were computed. For computation and ARIMA model selection, the R software “forecast” package was used. For ARIMA modelling, the number of observations should be at least 50 [11,16]. For new confirmed cases, the best model is ARIMA (2, 2, 1), for Deaths and recoveries ARIMA (1, 2, 5) and ARIMA (3, 2, 2) are the best models respectively. The estimates of all these model parameters are placed in Tab. 2. It can be observed from Tab. 2 that the p-values of all parameters are less than 0.01 except the 3rd and 1st moving average term for recovered and death cases respectively. This reveals that the fitted ARIMA models for confirmed, recovered and death cases were statistically significant and could be used for forecasting. All three forecasting evaluation measures were computed and placed in Tab. 4 for all three data sets.
Table 2: Parameter estimates of ARIMA models and their p-values

This study, in the first step, used the EEMD procedure to decompose the Confirmed, death, and recovered series in IMFs. Secondly, the best ARIMA model for every decomposed IMF was selected based on the Box-Jenkins methodology for all three datasets. The best orders of selected ARIMA (p,d,q) model for all IMFs are placed in Tab. 3. These best-selected models were applied to forecast every kth IMF. In the last step, all forecasted values of IMFs are added for the final output of the original series. The forecasting accuracy measures of the EEMD-ARIMA model for all data sets were computed and placed in Tab. 4.
Table 3: ARIMA(p, d, q) model order for all IMFs and data sets

Table 4: Forecasting evaluation measures of all series

To assess and choose the best model for forecasting the COVID-19 outbreak in Pakistan, three quantitative measures comprising MAE, RMSE, and MAPE were used. With these performance evaluation measures, the results of EEMD-ARIMA and ARIMA models are shown in Tab. 4. For a clearer picture, these results are also plotted and placed in Fig. 7.
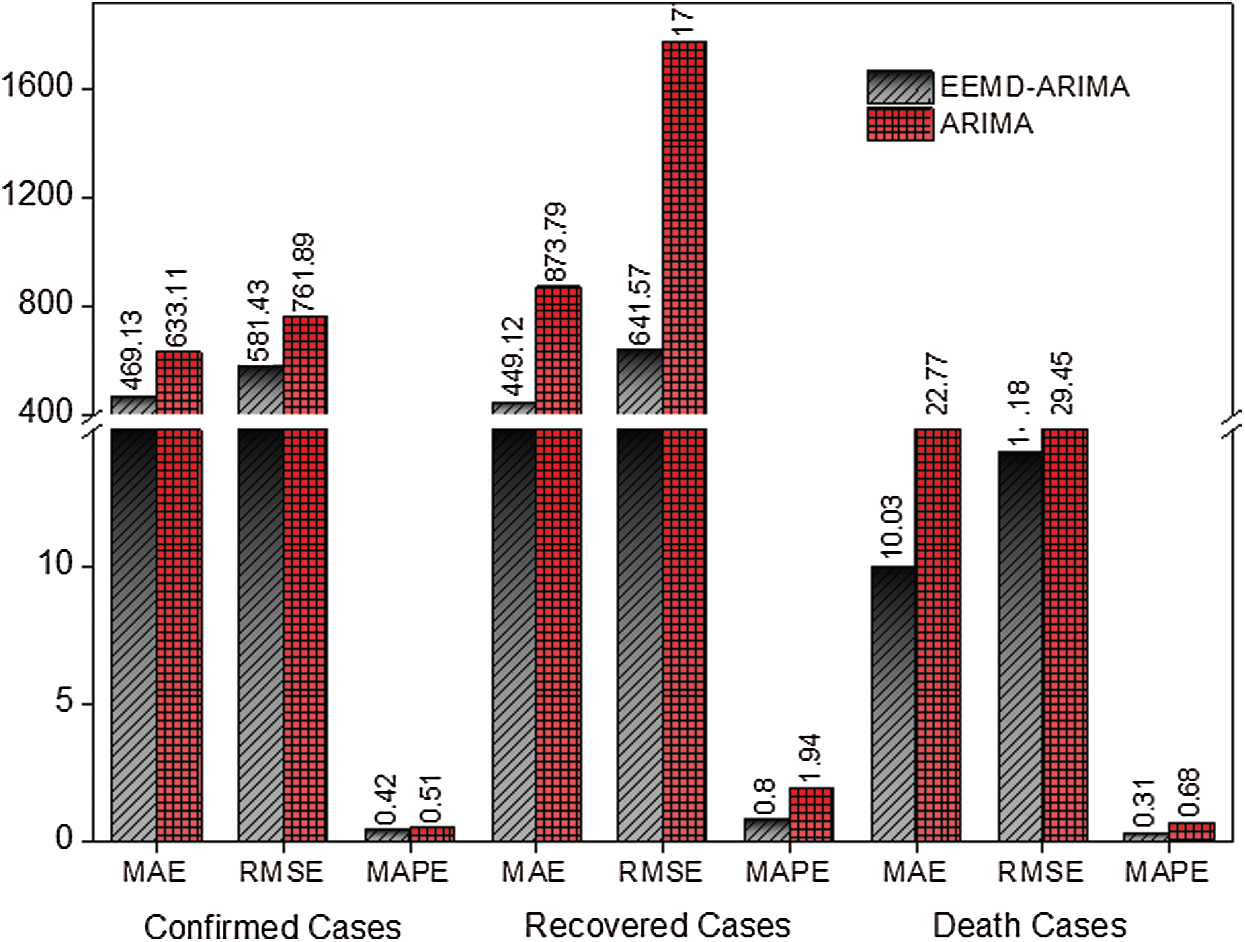
Figure 7: The MAE, RMSE, and MAPE plot of EEMD-ARIMA and ARIMA models for confirmed, recovered, and death cases
The MAE for both models ARIMA and EEMD-ARIMA is calculated for new Confirmed cases, deaths, and recoveries as shown in Tab. 4. The hybrid EEMD-ARIMA model achieved the lowest values (the best) for all the three series of COVID-19 outbreak in Pakistan. On the other hand, the single ARIMA model achieved the highest values (the worst) for all the three series of COVID-19 outbreak in Pakistan. Thus, the model EEMD-ARIMA outperformed the ARIMA model in all three data sets. Hence, in the first quantitative evaluation measure, MAE registered the usefulness of the hybrid EEMD-ARIMA model.
The next was the RMSE evaluation criterion which is computed for both models and all the data sets. The RMSE is shown in Tab. 4 for all three data sets and plotted in Fig. 7. The hybrid EEMD-ARIMA model attained the lowest values for all three data sets. On the contrary, the single ARIMA model achieved the highest values for all three data sets. Thus, the RMSE also indicated that the hybrid EEMD-ARIMA model was the best model that outperformed the single ARIMA model. Hence, the second quantitative evaluation measure also registered the usefulness of the hybrid EEMD-ARIMA model, which can handle the non-stationarity and nonlinearity of the data successfully.
The last is the MAPE, which is the relative measure that is used to compute both models and all three data sets. The values of MAPE are placed in Tab. 4 and plotted in Fig. 7. The hybrid model EEMD-ARIMA attained the lowest values for all three data sets of COVID-19 outbreak of Pakistan. On the other hand, the single ARIMA model achieved the highest values (the worst) for all three data sets. Thus, the MAPE results also revealed that the hybrid model EEMD-ARIMA is the best forecasting model for the COVID-19 outbreak. The values of MAPE of hybrid model EEMD-ARIMA were 0.42%, 0.80%, and 0.31% for confirmed, recovered, and death cases respectively, and fall in the category of highly accurate forecasts (perfect) [16]. Hence, all three forecast evaluation measures confirmed the usefulness of the hybrid EEMD-ARIMA model. Moreover, based on these analyses, the hybrid model EEMD-ARIMA could be used to forecast the next 31 days values of new confirmed cases, deaths, and recoveries of the COVID-19 outbreak in Pakistan. These forecasted values are shown in the next section.
The actual trend of detecting the COVID-19 outbreak in Pakistan has been increasing with exponential growth and is based on public behaviour and the Government’s interference. Using the 126 days data from 26 Feb 2020 until 30 Jun 2020 and employing the EEMD-ARIMA model, we forecasted the three series up to 31 July 2020. As we were trading with the nonstationary and nonlinear time series and the EEMD model automatically bypasses this assumption, EEMD split the univariate time-series into several independent components for which the forecast is more accurate. The best model for all IMFs is used and forecast for the number of new confirmed cases, deaths, and recoveries was computed daily. For the final output, the forecasted values of all IMFs were simply added. The forecasting results from the model EEMD-ARIMA for new confirmed cases demonstrate that there is a rapid increase in the number of confirmed cases with an exponential growth rate. The forecasted values of the confirmed cases are shown in Fig. 8. The forecasted value on 31 Jul 2020 is 311454 which is equivalent to the 1.46 times of the current number of confirmed cases and the 95% prediction interval of the new confirmed cases is from 246,529 to 376,379, as shown in Fig. 8.
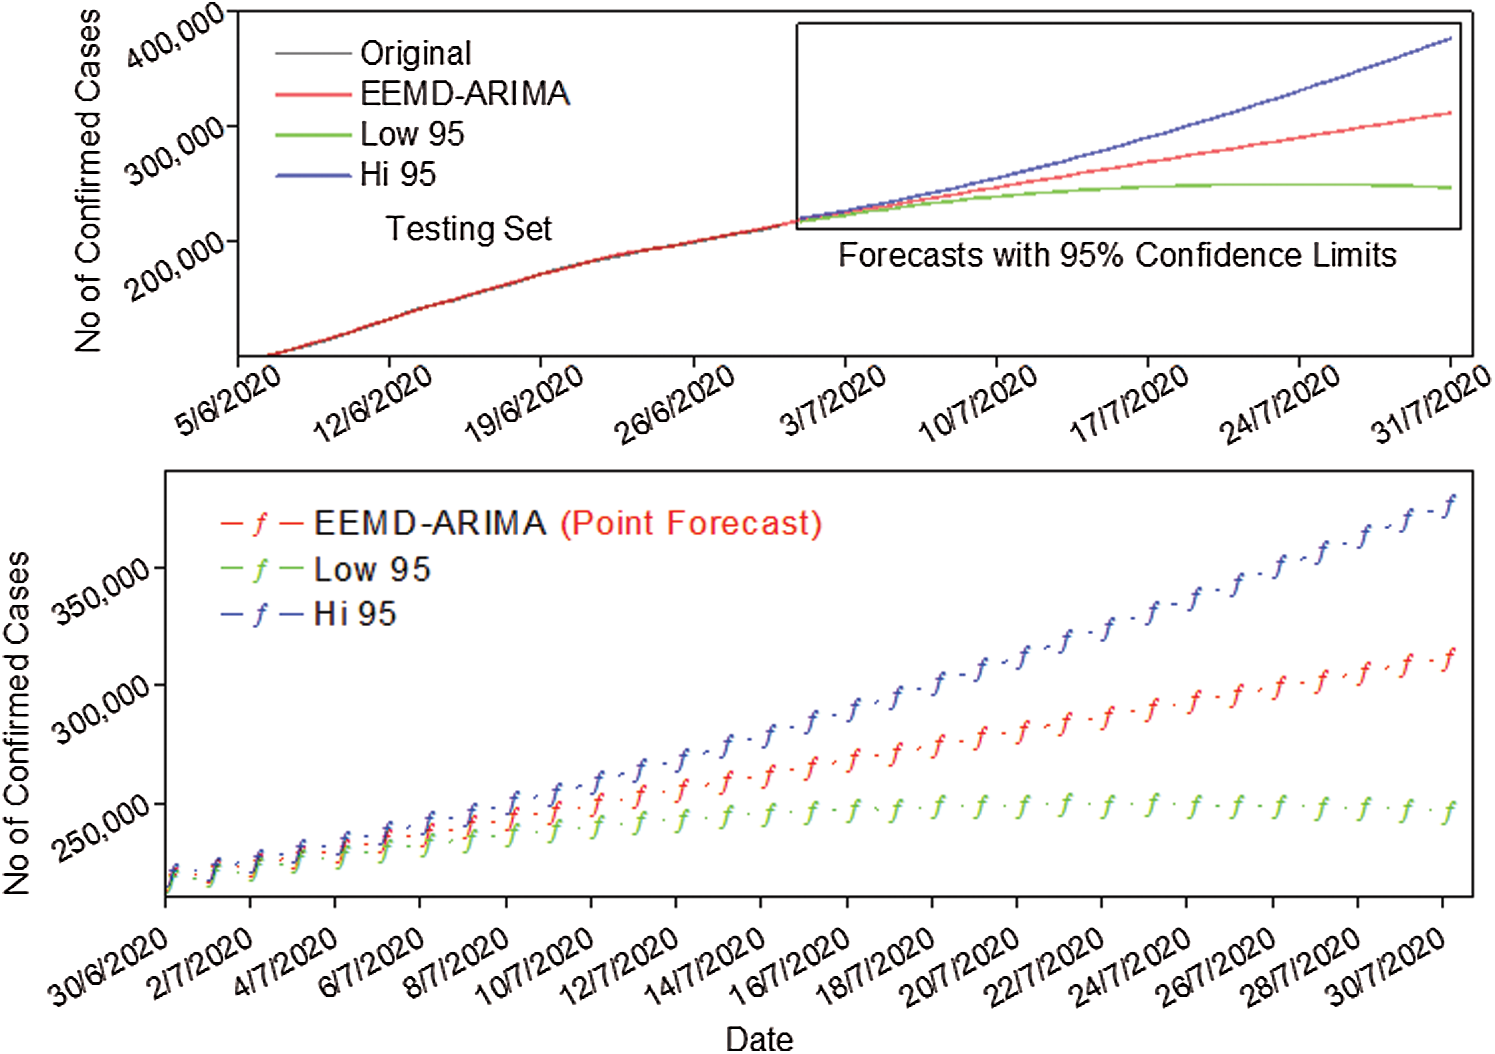
Figure 8: Forecast of new confirmed cases with 95% prediction interval up to 31 Jul 2020
The results from the forecasting model for recovered cases are shown in Fig. 9. It reveals that there is also a rapid increase in the recoveries and almost follows the exponential trend which is a good sign for the government. The total number of recoveries will reach 193497, which is almost two times the current recoveries. The 95% prediction interval for the recovered cases is from 162414 to 224579 (see Fig. 9).
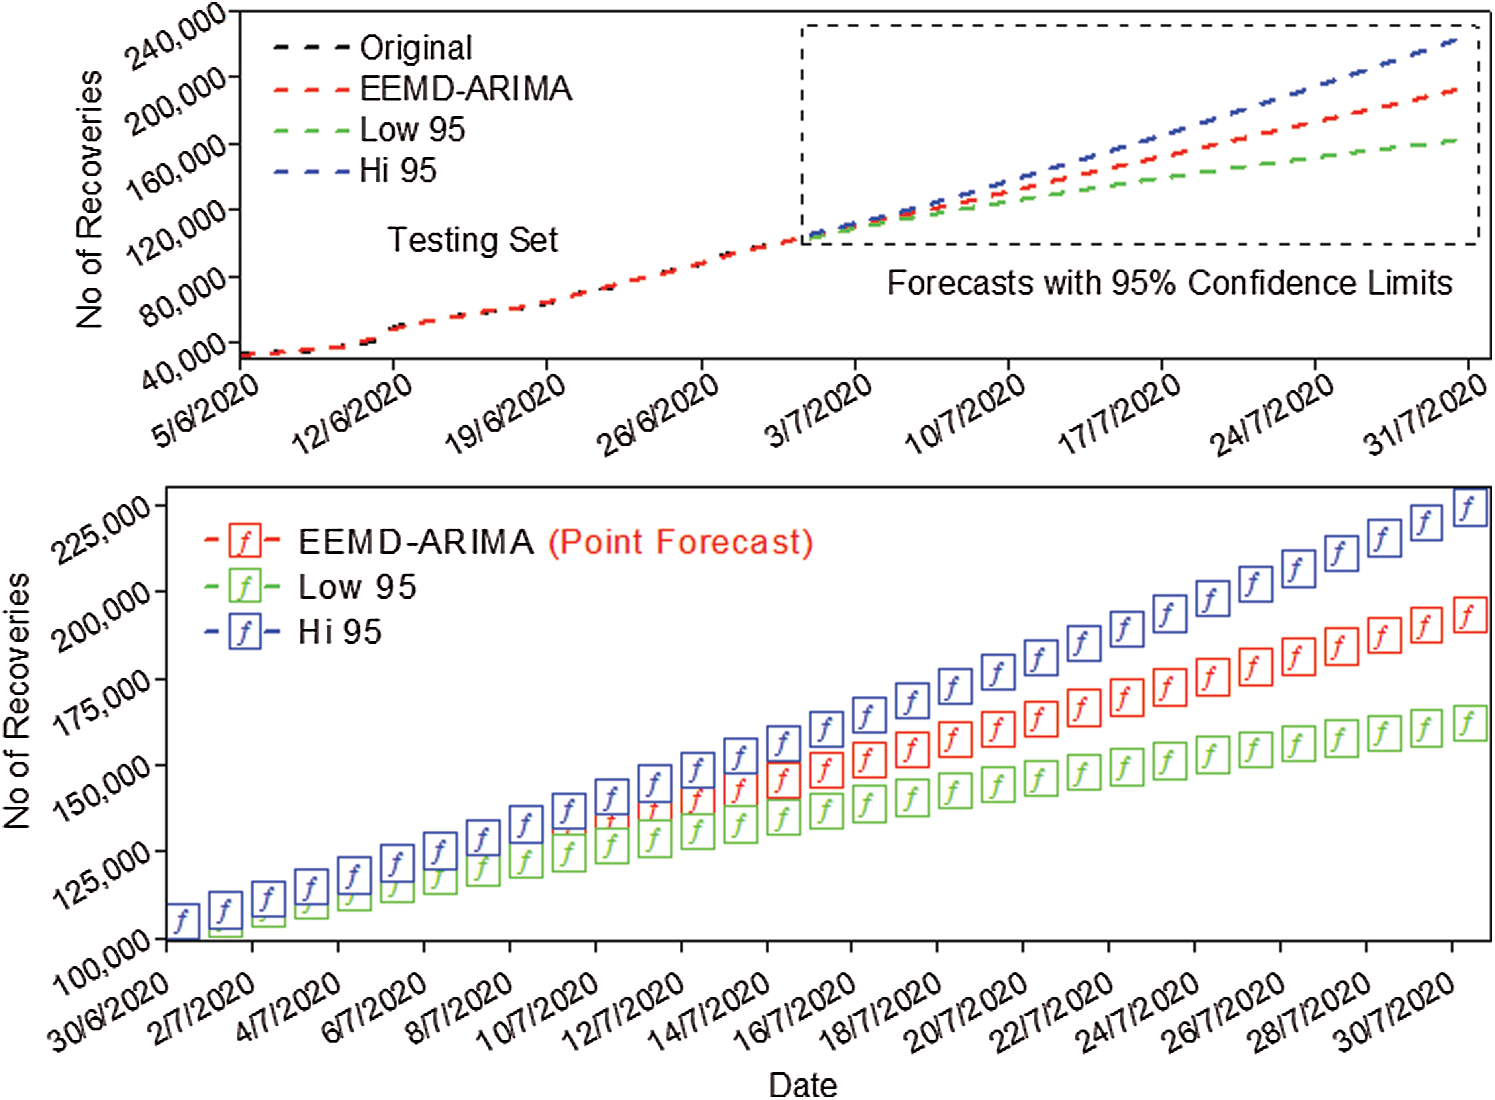
Figure 9: Forecast of recovered cases with 95% prediction interval up to 31 Jul 2020
Similarly, the forecasting model for deaths revealed that the total number of deaths will rise to 6751 up to 31 Jul 2020 if the current death rate prevails. This number is almost 1.54 times the current deaths. The 95% prediction interval for the number of deaths is estimated from 5617 to 7885 (see Fig. 10).
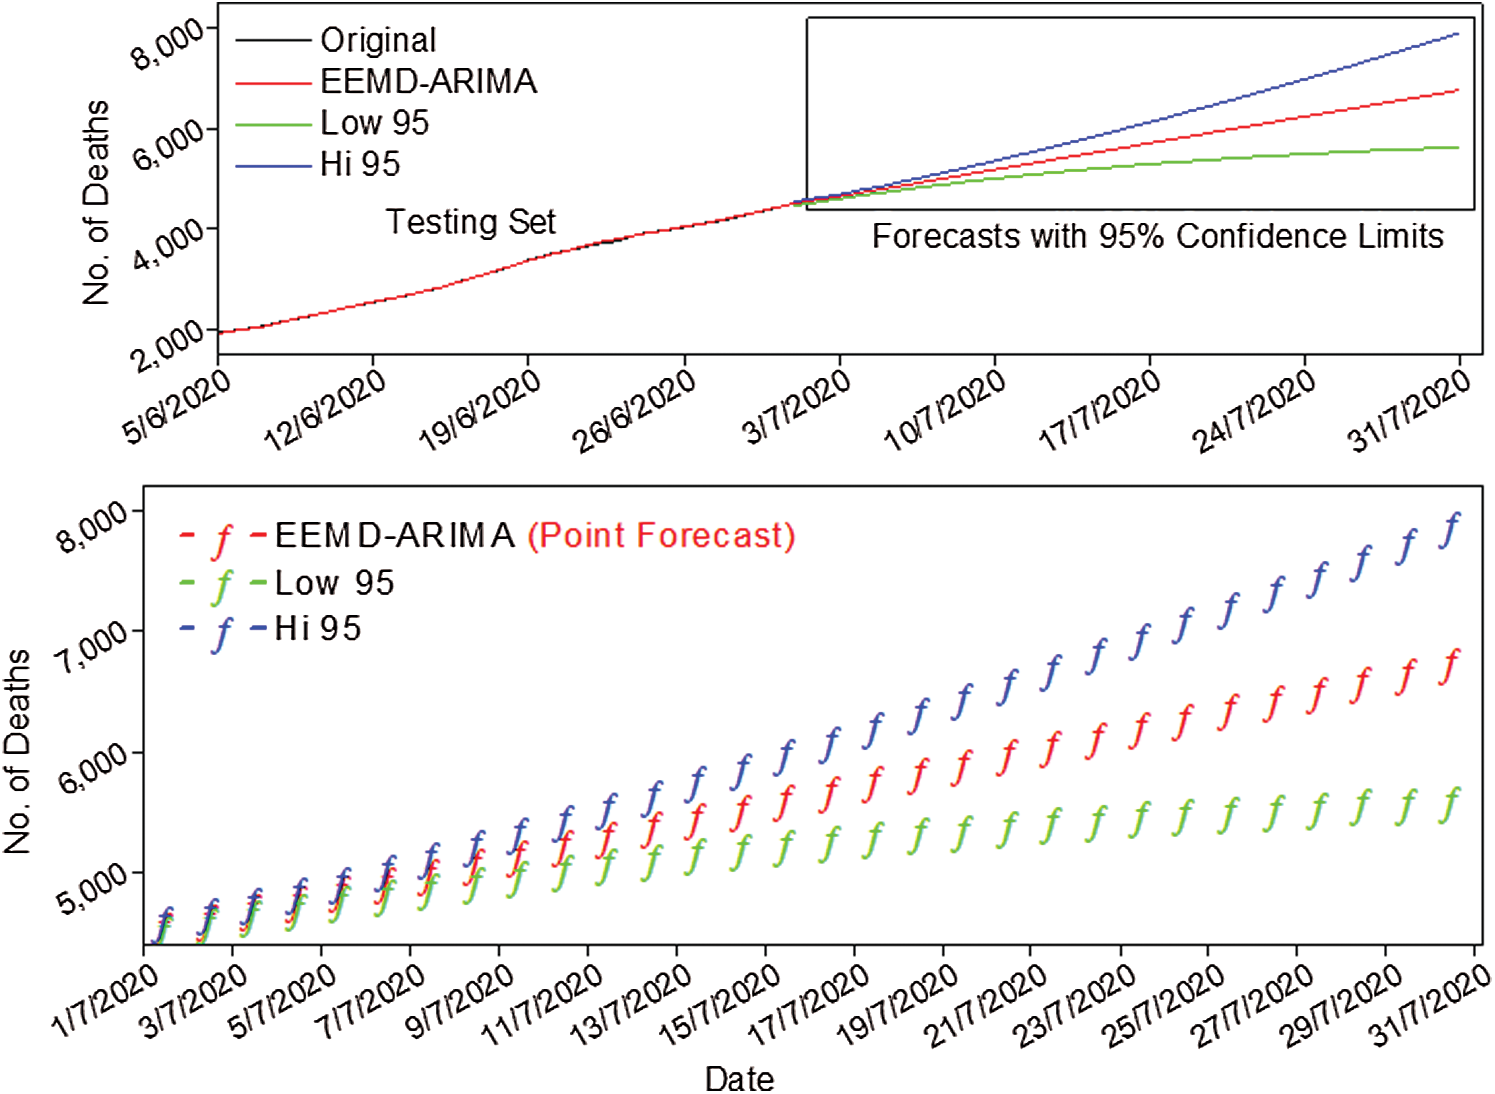
Figure 10: Forecast of death cases with 95% prediction interval up to 31 Jul 2020
The key findings of this work are summarized as follows:
• The EEMD-ARIMA model is useful and follows the actual data pattern of the data in almost all three scenarios (the new confirmed cases, deaths, and recoveries).
• The forecast shows that in the upcoming 31 days, the total number of new Confirmed cases and Deaths will increase by almost 1.5 times the current numbers, while the recovered cases increase two times the current number, (see Fig. 1), until 31 Jul 2020.
• From this study, it is revealed that the hybrid model EEMD-ARIMA also provides the best forecast for the short term. Therefore, policymakers could use this technique to take up updated decisions for the short-term plan.
• The forecasts established in this study may be useful and helpful for the Pakistani public and specifically for the government to plan their activities in making up-to-date decisions to prevent further spread of COVID-19 infection.
In this study, the short-term forecast about the COVID-19 outbreak in Pakistan is provided for confirmed, deaths, and recovered cases. The proposed EEMD-ARIMA model for forecasting the COVID-19 outbreak showed promising results for all three scenarios. The outcomes of this study show that the number of confirmed cases will increase rapidly and will 1.5 times in number (see Fig. 1) on 31 July 2020 provided if the current trend prevails. Similarly, the number of recoveries also increases at a high rate and will become double until 31 Jul 2020. Currently, as compared to the new confirmed cases, the rate of the recovered cases is still quite low which is equal to the 0.4 times of the confirmed cases. Except for 12 June 2020, the number of recovered patients was 9809 and the number of confirmed cases reported was 6472. However, the number of confirmed cases is still increasing at a rapid rate because the virus is spreading in all regions of the country as presented in Fig. 1. Similarly, the forecasting results in Fig. 9 showed that the number of death cases will also increase up to 6751 until 31 Jul 2020 and would be 1.5 times according to Fig. 1. Nevertheless, the number of death cases in Pakistan is still low as compared to the rest of the world. Similar kinds of inferences have been drawn by the other researchers [5,17] but with a smaller number of observations and used only simple ARIMA model. Also, the interpretation of the results was not simple for a layman. Thus, in this study, a simple approach is used to demonstrate the results.
It is worthwhile to mention that most of the previous research studies have been conducted about the alertness scenarios modelling rather than the predictions [18]. The basic purpose of the research is to inform the decision-making authorities so that the actions should be taken to slow down the spread of the COVID-19 outbreak and established the health system to respond to the pandemic. The other precautionary measures are also needed to slow down the spread of COVID-19 disease in Pakistan [5]. The outcome of this study revealed that the number of new confirmed cases as well as the deaths will increase until 31 Jul 2020. Thus, we suggest the continuation of the precautionary measures proposed by the authors [5]. The authors of this study believe that the forecast provided is useful for government agencies and the public to make updated decisions and avoid the further spread of the COVID-19 outbreak in Pakistan.
Pakistan is a developing country with a shortage of health facilities that resultantly influences the circumstances because no vaccine or medication has been produced to date to forestall or fix the COVID-19 pandemic. Government officials and public health officers should control the rapid increase in the spread of the COVID-19 outbreak by taking some tough decisions. Other than government officials, the overall population also needs to ensure their safety by taking the respective precautionary measures and practice of social distancing to avoid further spread of the COVID-19 outbreak, as shown in Fig. 7. In conclusion, the statistical analysis confirms that the EEMD-ARIMA model is useful for the short-term forecasting for COVID-19. The decomposition and ensemble strategy can be helpful to help decision-makers in developing short term strategies with regards to the current number of disease occurrences.
Funding Statement: The author(s) received no specific funding for this study.
Conflicts of Interest: The authors declare that they have no conflicts of interest to report regarding the present study.
1. W. Guan, Z. Ni, Y. Hu, W. Liang, C. Ou et al. (2019). , “China medical treatment expert group for COVID-19,” Clinical Characteristics of Coronavirus Disease, vol. 382, no. 18, pp. 1708–1720. [Google Scholar]
2. D. Wu, T. Wu, Q. Liu and Z. Yang. (2020). “The SARS-COV-2 outbreak: What we know,” International Journal of Infectious Diseases, vol. 94, no. 395, pp. 44–48. [Google Scholar]
3. A. Ahmadi, Y. Fadai, M. Shirani and F. Rahmani. (2020). “Modeling and forecasting trend of COVID-19 epidemic in Iran until May 13, 2020,” Medical Journal of the Islamic Republic of Iran, vol. 34, pp. 183–195. [Google Scholar]
4. S. J. Fong, G. Li, N. Dey, R. G. Crespo and E. H. Viedma. (2020). “Finding an accurate early forecasting model from small dataset: A case of 2019-NCOV novel coronavirus outbreak,” International Journal of Interactive Multimedia and Artificial Intelligence, vol. 6, no. 1, pp. 132–140. [Google Scholar]
5. M. Yousaf, S. Zahir, M. Riaz, S. M. Hussain and K. Shah. (2020). “Statistical analysis of forecasting COVID-19 for upcoming month in Pakistan,” Chaos, Solitons & Fractals, vol. 138, no. 8, pp. 109926. [Google Scholar]
6. S. Raza, M. A. Rasheed and M. K. Rashid. (2020). “Transmission potential and severity of COVID-19 in Pakistan,” Preprints, . [Online]. Available: https://www.preprints.org/manuscript/202004.0004/v1. [Google Scholar]
7. H. Tandon, P. Ranjan, T. Chakraborty and V. Suhag. (2020). “Coronavirus (COVID-19ARIMA based timeseries analysis to forecast near future,” Preprints, . [Online]. Available: https://arxiv.org/abs/2004.07859. [Google Scholar]
8. Z. Wu and N. E. Huang. (2009). “Ensemble empirical mode decomposition: A noise-assisted data analysis method,” Advances in Adaptive Data Analysis, vol. 1, no. 1, pp. 1–41. [Google Scholar]
9. N. E. Huang, Z. Shen, S. R. Long, M. C. Wu, H. H. Shih et al. (1998). , “The empirical mode decomposition and the Hilbert spectrum for nonlinear and non-stationary time series analysis,” Proc. of the Royal Society of London. Series A: Mathematical, Physical and Engineering Sciences, vol. 454, no. 1971, pp. 903–995. [Google Scholar]
10. F. Martínez, M. P. Frías, F. Charte and A. J. Rivera. (2019). “Time series forecasting with KNN in R: The tsfknn package,” R Journal, vol. 9, no. 2, pp. 229–242. [Google Scholar]
11. M. Aamir and A. Shabri. (2018). “Improving crude oil price forecasting accuracy via decomposition and ensemble model by reconstructing the stochastic and deterministic influences,” Advanced Science Letters, vol. 24, no. 6, pp. 4337–4342. [Google Scholar]
12. C. Chatfield and H. Xing. (2019). The Analysis of Time Series: An Introduction with R, 7th ed. Chapman and Hall: CRC Press, pp. 1–85. [Google Scholar]
13. Ministry of National Health Services Islamabad Pakistan. (2020). [Online]. Available: http://covid.gov.pk/stats/pakistan. [Google Scholar]
14. J. Helske and P. Luukku. (2018). “Ensemble empirical mode decomposition (EEMD) and its complete variant (CEEMDAN),” . [Online]. Available: http://cran.pau.edu.tr/web/packages/Rlibeemd/Rlibeemd.pdf. [Google Scholar]
15. S. Debert, M. Pachebat, V. Valeau and Y. Gervais. (2011). “Ensemble-empirical-mode-decomposition method for instantaneous spatial-multi-scale decomposition of wall-pressure fluctuations under a turbulent flow,” Experiments in Fluids, vol. 50, no. 2, pp. 339–350. [Google Scholar]
16. W. Gao, M. Aamir, A. B. Shabri, R. Dewan and A. Aslam. (2019). “Forecasting crude oil price using Kalman filter based on the reconstruction of modes of decomposition ensemble model,” IEEE Access, vol. 7, pp. 149908–149925. [Google Scholar]
17. F. Petropoulos and S. Makridakis. (2020). “Forecasting the novel coronavirus COVID-19,” PLoS One, vol. 15, no. 3, pp. e0231236. [Google Scholar]
18. F. Shearer, J. Walker, N. Tellioglu, J. M. Mccaw, J. Mcvemon et al. (2020). , “Assessing the risk of spread of COVID-19 to the Asia pacific region,” Preprints, . [Online]. Available: https://www.medrxiv.org/content/10.1101/2020.04.09.20057257v2. [Google Scholar]
 | This work is licensed under a Creative Commons Attribution 4.0 International License, which permits unrestricted use, distribution, and reproduction in any medium, provided the original work is properly cited. |