DOI:10.32604/cmc.2021.015503
| Computers, Materials & Continua DOI:10.32604/cmc.2021.015503 | |
| Article |
Skin Melanoma Classification System Using Deep Learning
Department of Computer Science and Engineering, CEG Campus, Anna University, Chennai, India
*Corresponding Author: R. Thamizhamuthu. Email: tamillec2011@gmail.com
Received: 24 November 2020; Accepted: 23 January 2021
Abstract: The deadliest type of skin cancer is malignant melanoma. The diagnosis requires at the earliest to reduce the mortality rate. In this study, an efficient Skin Melanoma Classification (SMC) system is presented using dermoscopic images as a non-invasive procedure. The SMC system consists of four modules; segmentation, feature extraction, feature reduction and finally classification. In the first module, k-means clustering is applied to cluster the colour information of dermoscopic images. The second module extracts meaningful and useful descriptors based on the statistics of local property, parameters of Generalized Autoregressive Conditional Heteroscedasticity (GARCH) model of wavelet and spatial patterns by Dominant Rotated Local Binary Pattern (DRLBP). The third module reduces the features by the t-test, and the last module uses deep learning for the classification. The individual performance shows that GARCH parameters of 3rd DWT level sub-bands provide 92.50% accuracy than local properties (77.5%) and DRLBP (88%) based features for the 1st stage (normal/abnormal). For the 2nd stage (benign/malignant), it is 95.83% (GRACH), 90% (DRLBP) and 80.8% (Local Properties). The selected 2% of features from the combination gives 99.5% and 100% for 1st and 2nd stage of the SMC system. The greatest degree of success is achieved on PH2 database images using two stages of deep learning. It can be used as a pre-screening tool as it provides 100% accuracy for melanoma cases.
Keywords: Dermoscopic images; skin cancer; melanoma; deep learning; autoregressive models
The decrease in mortality rate due to skin cancer may be attributed to several treatment and detection factors. Due to the vast amount of research in both categories, significant advances have seen over the past 30 years. One of the prognostic factors for cancer cure is detection at the earliest. Currently, the advancement in imaging techniques and computerized system provides better results. The imaging techniques used for skin cancer diagnosis is dermoscopy, where a magnified visualization of the affected skin region is acquired. It shows the morphological structures that cannot be found by naked eyes. The accuracy of skin melanoma diagnosis has been improved with the use of many algorithms, such as ABCD rule [1], 7-point checklist [2] and pattern analysis [3]. However, the interpretation is time-consuming and also it is subjective based on skills of dermatologists. To overcome these difficulties, computerized systems are developed to help the dermatologists.
Among the various components in the computerized system, feature extraction and classification are the main components. Many spatial and spectral features are utilized in the former steps, and many machine learning methods are developed in the later stage for the classification. Apart from ABCD rule [1], quantitative measures such as the shape of the affected region [4], colors and structural differences [5,6] are used for effective classification. Textural patterns play a vital role to extract dominant features in the medical domain. These patterns include Haralick features [7] from gray level co-occurrence matrix, Laws texture features [8], Local Binary Pattern (LBP) [9] and their extensions.
Due to the advancement in multiresolution analysis, frequency domain features are added to the feature vector to increase accuracy further. Some of them are Discrete Wavelet Transform (DWT) [10], Multi wavelet transform [11], Contourlet [12], Curvelet [13], and Shearlet [14]. They can be used for the diagnosis independently or combined with the statistical features for better performance. The novelty is the choice of feature vectors used for effective classification of dermoscopic images. DWT will be used in conjunction with GARCH [15] to generate one of the feature vectors used with other features. In the diagnosis stage, many machine learning approaches are used for classification such as SVM [11], Naive Bayes [12], k-nearest neighbour [16], and decision trees [17].
The evaluation of deep learning [18–20] helps the computerized system highly effective in melanoma diagnosis, and thus this study uses deep learning as a classifier. The objective is to design a computerized SMC system with a high level of sensitivity and specificity. The rest of the paper is as follows: Section 2 discusses SMC system’s design and a summary of the results obtained in this study are discussed in Section 3. The conclusion is given in the last Section.
This Section discusses the design of the SMC system. It consists of four sequential steps which are illustrated in Fig. 1. Section 2.1 explains the lesion segmentation by a clustering approach. Section 2.2 describes how the features are extracted from dermoscopic images. The feature reduction technique is described in Section 2.3, and Section 2.4 explains the deep learning approach for the classification.
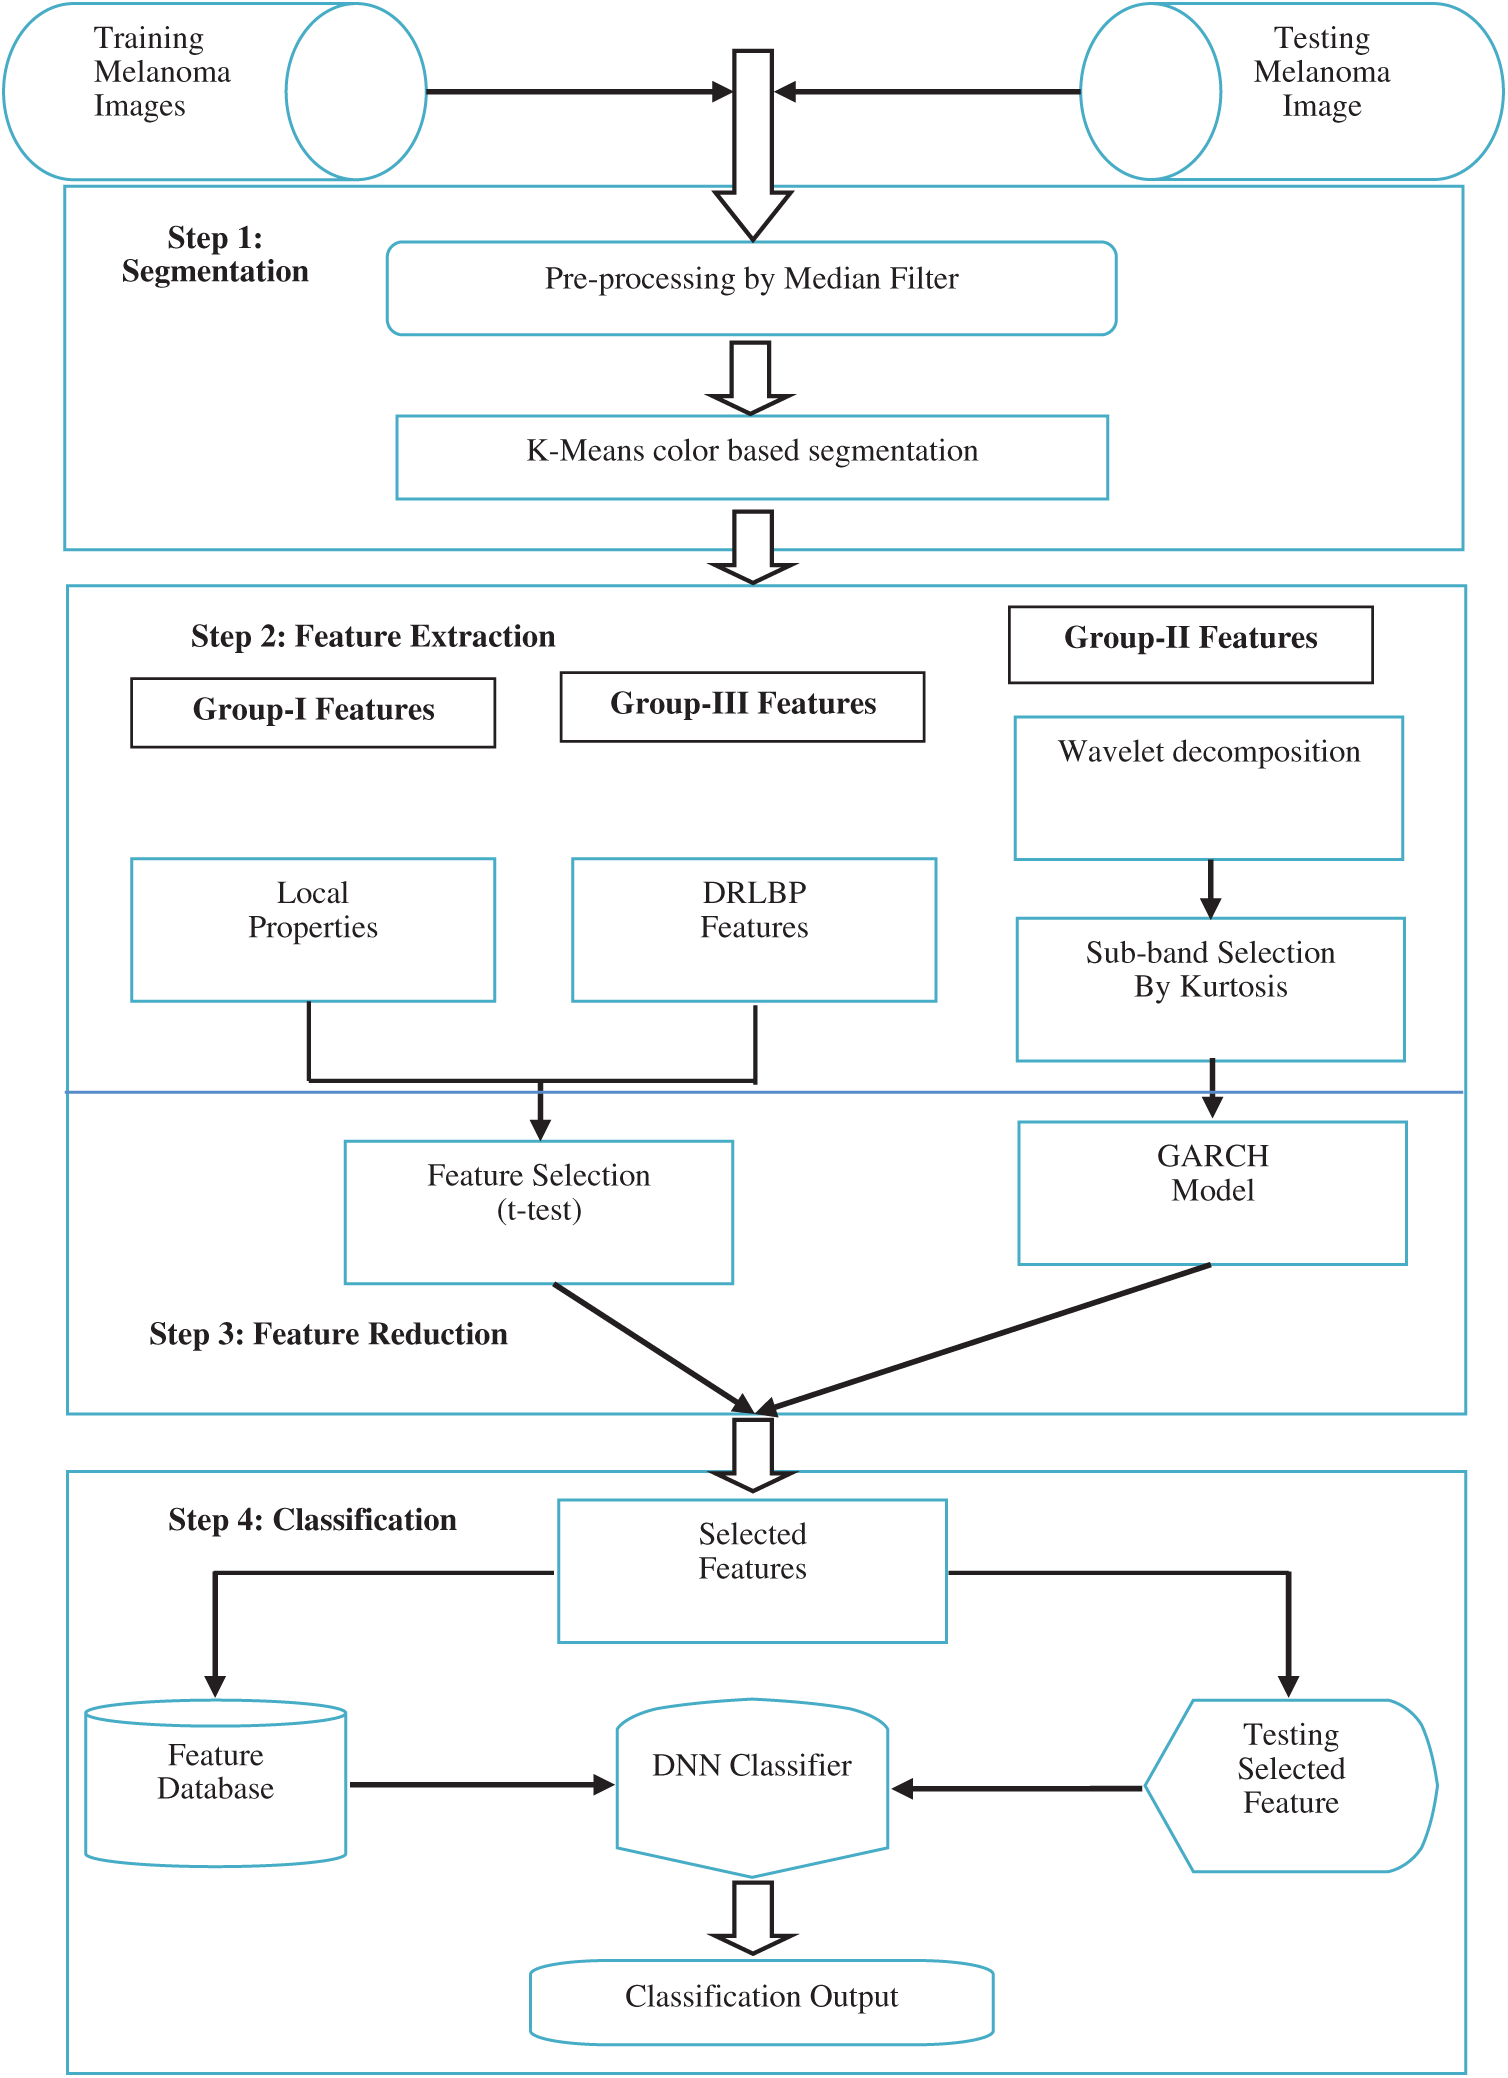
Figure 1: Block diagram of the SMC system
The exact skin cancer region is segmented using k-means clustering approach on RGB colour image. Before segmentation, the noises and hair in the images are removed by averaging filter with a predefined window size of
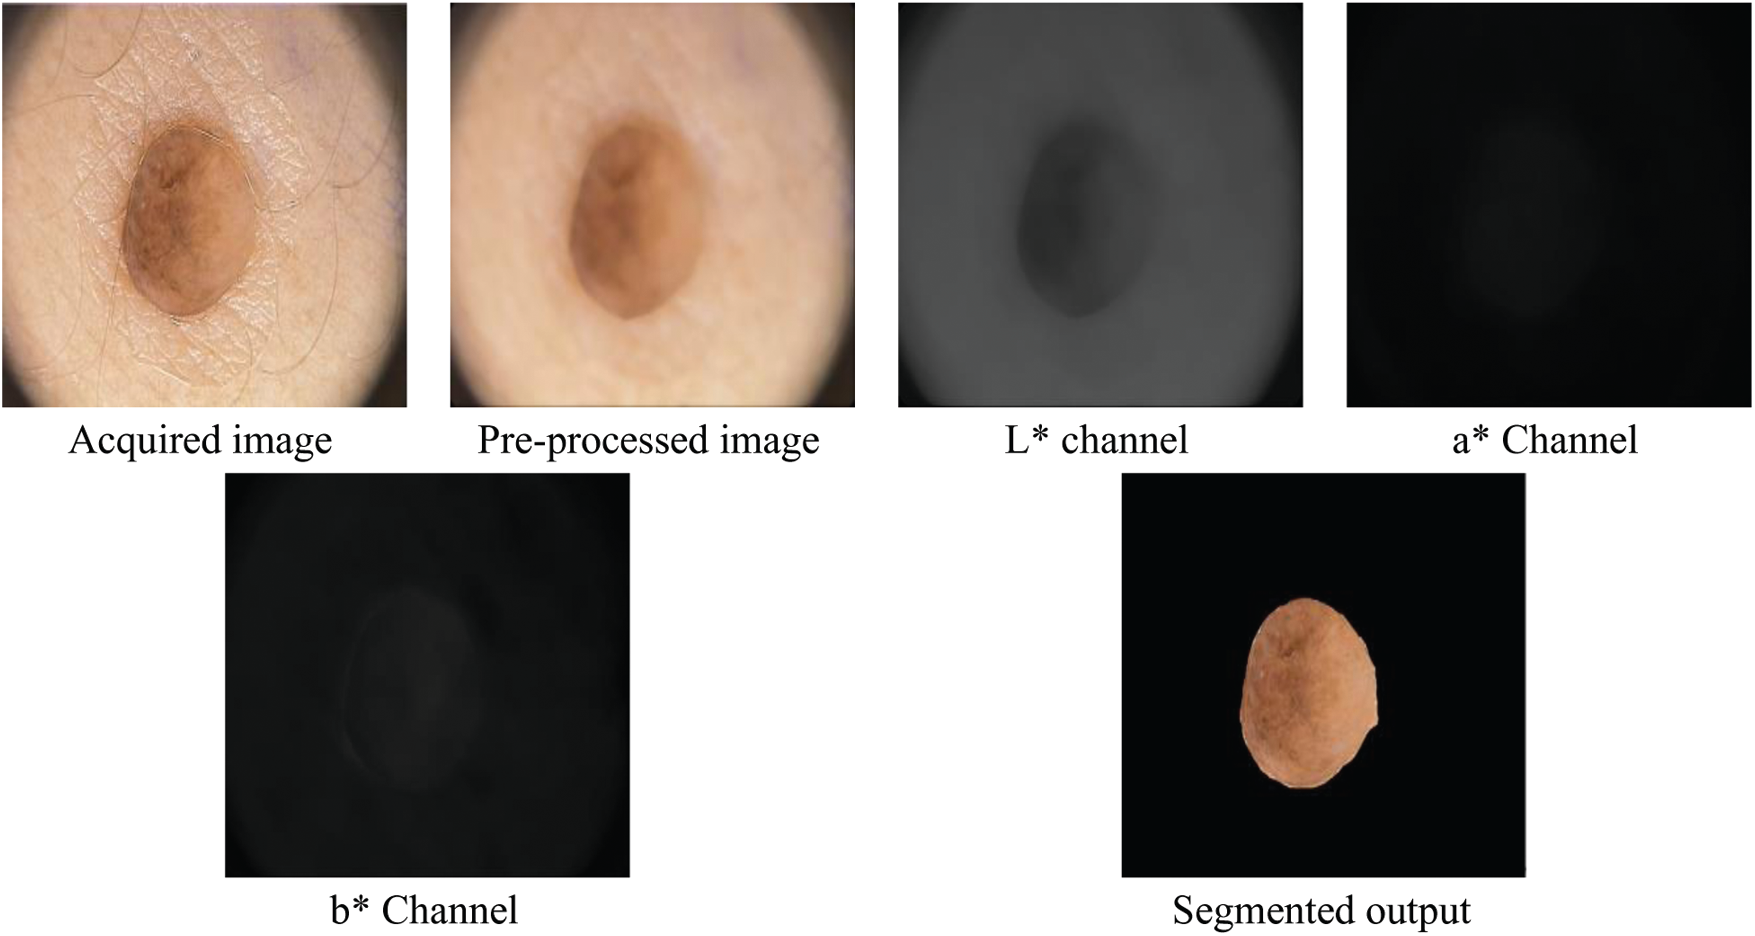
Figure 2: Outputs of segmentation of the SMC system
Feature extraction aims to preserve the class discriminating information so that best class separation is achieved for least computational complexity. A classifier then uses these to decide whether the region is normal or abnormal. The advantage of extracting descriptors is that they will be a more compact representation of the segmented region than the image pixels alone if carefully chosen. The features are usually chosen based on the domain under consideration and in this study fall into three categories. The first group is based on the statistics of local property, and the second group consists of the parameters of the GARCH model of wavelet. Thirdly, spatial patterns of skin lesions are also recorded.
There are four local properties extracted in this study, mean (
The second moment is called variance and its positive square root is called
The third standardized central moment is skewness (Eq. (3)), and the fourth standardized central moment is called kurtosis (Eq. (4)).
Using Eqs. (1)–(4), the local proprieties are computed for each colour channel and stored in the feature database.
To boost the performance of the SMC system, GARCH model is applied in the wavelet domain. The GARCH (p, q) for
and
where
At first, the dermoscopic images are transformed into DWT domain which is a powerful tool used in many pattern recognition techniques [22]. DWT is very useful to increase the accuracy of the SMC system as it provides localized frequency information. Fig. 3 shows a DWT decomposition of a dermoscopic image at two levels. While applying DWT on the dermoscopic image, it is observed that it provides four sub-bands by applying low pass and high pass filter in a predefined manner.
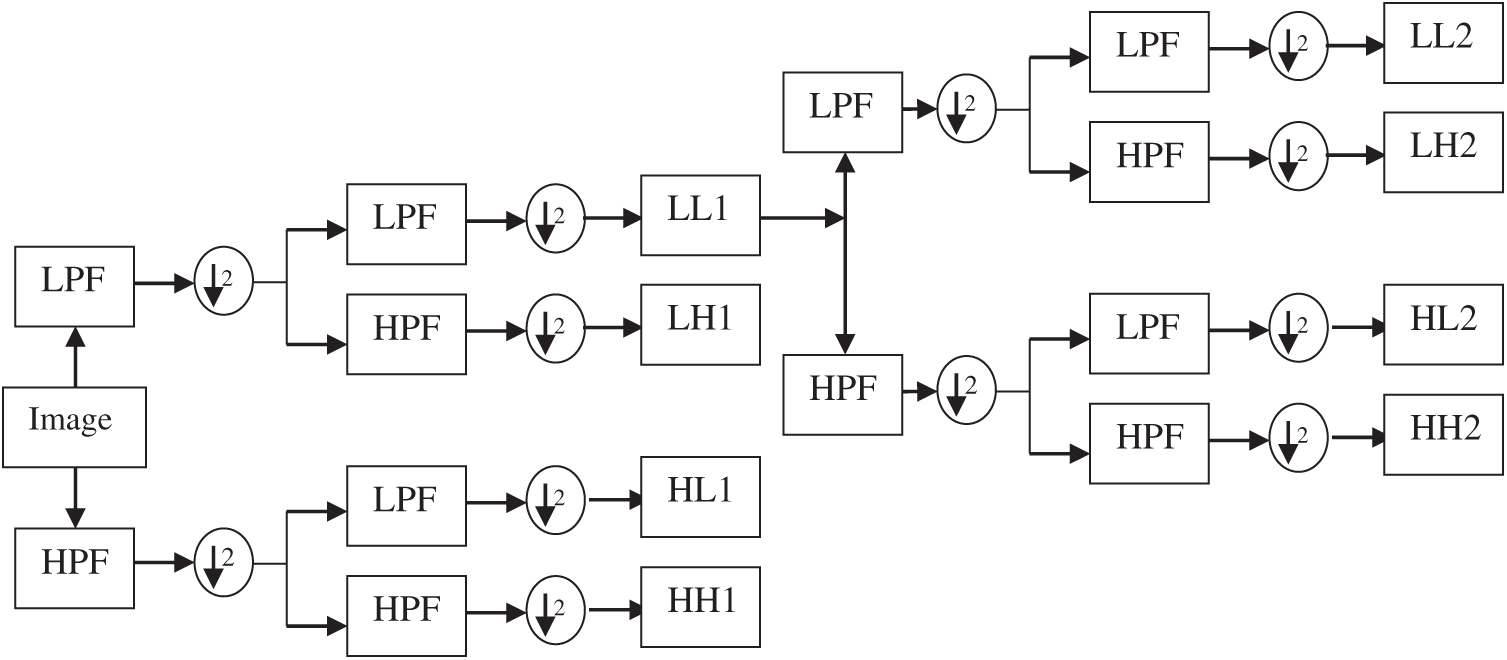
Figure 3: DWT decomposition of a dermoscopic image at two levels
It is noted that the GARCH model is efficient only when the distribution of data has a heavy tail [23]. Thus, the coefficients’ distribution in each sub-band in the DWT domain is tested for a heavy tail. It is achieved by calculating the K value using Eq. 4 which demonstrates whether they have a heavy tail or not. For a Gaussian distribution, K is three. If the K value of any data is greater than three, it indicates a heavier tail than the Gaussian distribution. Hence, the GARCH parameters are extracted from the sub-bands which have K of more than three.
DRLBP [24] is an extended version of LBP [9]. LBP features are rotational invariant due to the fixed order of the weights. To overcome this limitation, the weights are arranged based on a reference direction which is computed locally. It is defined as
where ic and in are intensity of central pixel and nth neighborhood pixels respectively. The DRLBP is defined based on D is given below.
It is evident from the Eq. (8), the weights depend on D and thus DRLBP satisfies the rotation invariant property. DRLBP gives the spatial pattern in the dermoscopic images. In this study, they are computed for each colour channel and stored in the feature database. The feature extraction is also used in [25,26].
A large set of features makes the classification system extremely computationally intensive. The complexity of the SMC system increases more when the combination of features used in the classifiers. Thus a feature reduction step is necessary to eliminate the poor performing features that affect the classifier’s performance. The significant features are identified using t-test [27].
Let us consider features from two classes; c1 of n1 samples and c2 of n2 samples. A statistical value called as t is computed for a particular feature (f) in the feature set is defined by
where
2.4 Classification by Deep Learning
The non-linear relationship between the features of different classes can be modeled by neural networks which consist of input layers (number of features), hidden layer (normally 1) and output layer (number of classes). The information in the bracket shows the number of layers in each layer. The relationship between the features can be effectively modeled if the number of the hidden layer is increased. This is called deep learning [28] and in this study, it is applied for the classification.
The error between the actual and desired output is computed at first. The weights are updated iteratively while computing the error signal in the training phase. The update is done using the mean-squared error function. In the output layer, the error is multiplied using the sigmoid activation function. This process is stopped when the error is minimized at a predefined level by using the backpropagation algorithm. It is a descent algorithm that propagates the error from the output layer to lower layers. The weights are adjusted for the dampening oscillations with the help of learning rate and momentum factor so that the error rate is reduced in a decent direction. As the SMC system outputs a binary decision, a linear function is used in the output layer.
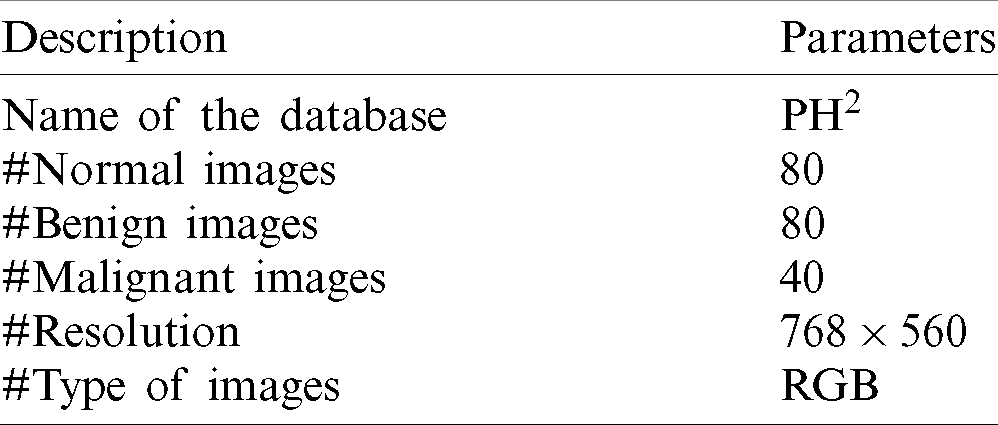
The developed SMC system is analyzed using publically available dermoscopic image databases; PH2 [29,30]. It is extremely useful for the development and testing of any computerized skin cancer classification system. Also, they included ground truth data that describes the types of abnormal severity present in the dermoscopic images. The system is applied to classify the dermoscopic images into normal and abnormal categories in the first stage and then classified into benign or malignant in the second stage. The various details about the databases are listed in Tab. 1.
Table 1: Basic information about the images used in this study
The accuracy (Ac) of the system can be broken into two important measures; sensitivity (Sn) and specificity (Sp). Before defining these two terms, four more variables are to be computed from the SMC system’s outputs. When the system correctly identifies a positive result, it is referred to True Positive (TP) and if the system incorrectly identifies a positive result, it is referred as False Positive (FP). Similarly, two more terms can be defined and referred to True Negative (TP) and False Negative (FN) for identifying negative results. The definition of sensitivity and specificity are as follows:
There is no misclassification for a perfect system, which means that sensitivity and specificity will both be 100%. A high sensitivity measure can lead to a decrease the mortality rate. These measures are computed using k-fold (10-fold) cross-validation testing scheme where the classifier uses k-1 folds in training, and the remaining fold is tested.
As the GARCH features are extracted from DWT with many resolution levels of decomposition, the local properties and DRLBP are first analyzed independently. All normal images are considered a group of negative samples and abnormal images as positive samples in this stage. Then, k-fold cross-validation is employed for splitting images into these two groups for training and testing purposes. The confusion matrices obtained from these features are given in Fig. 4.
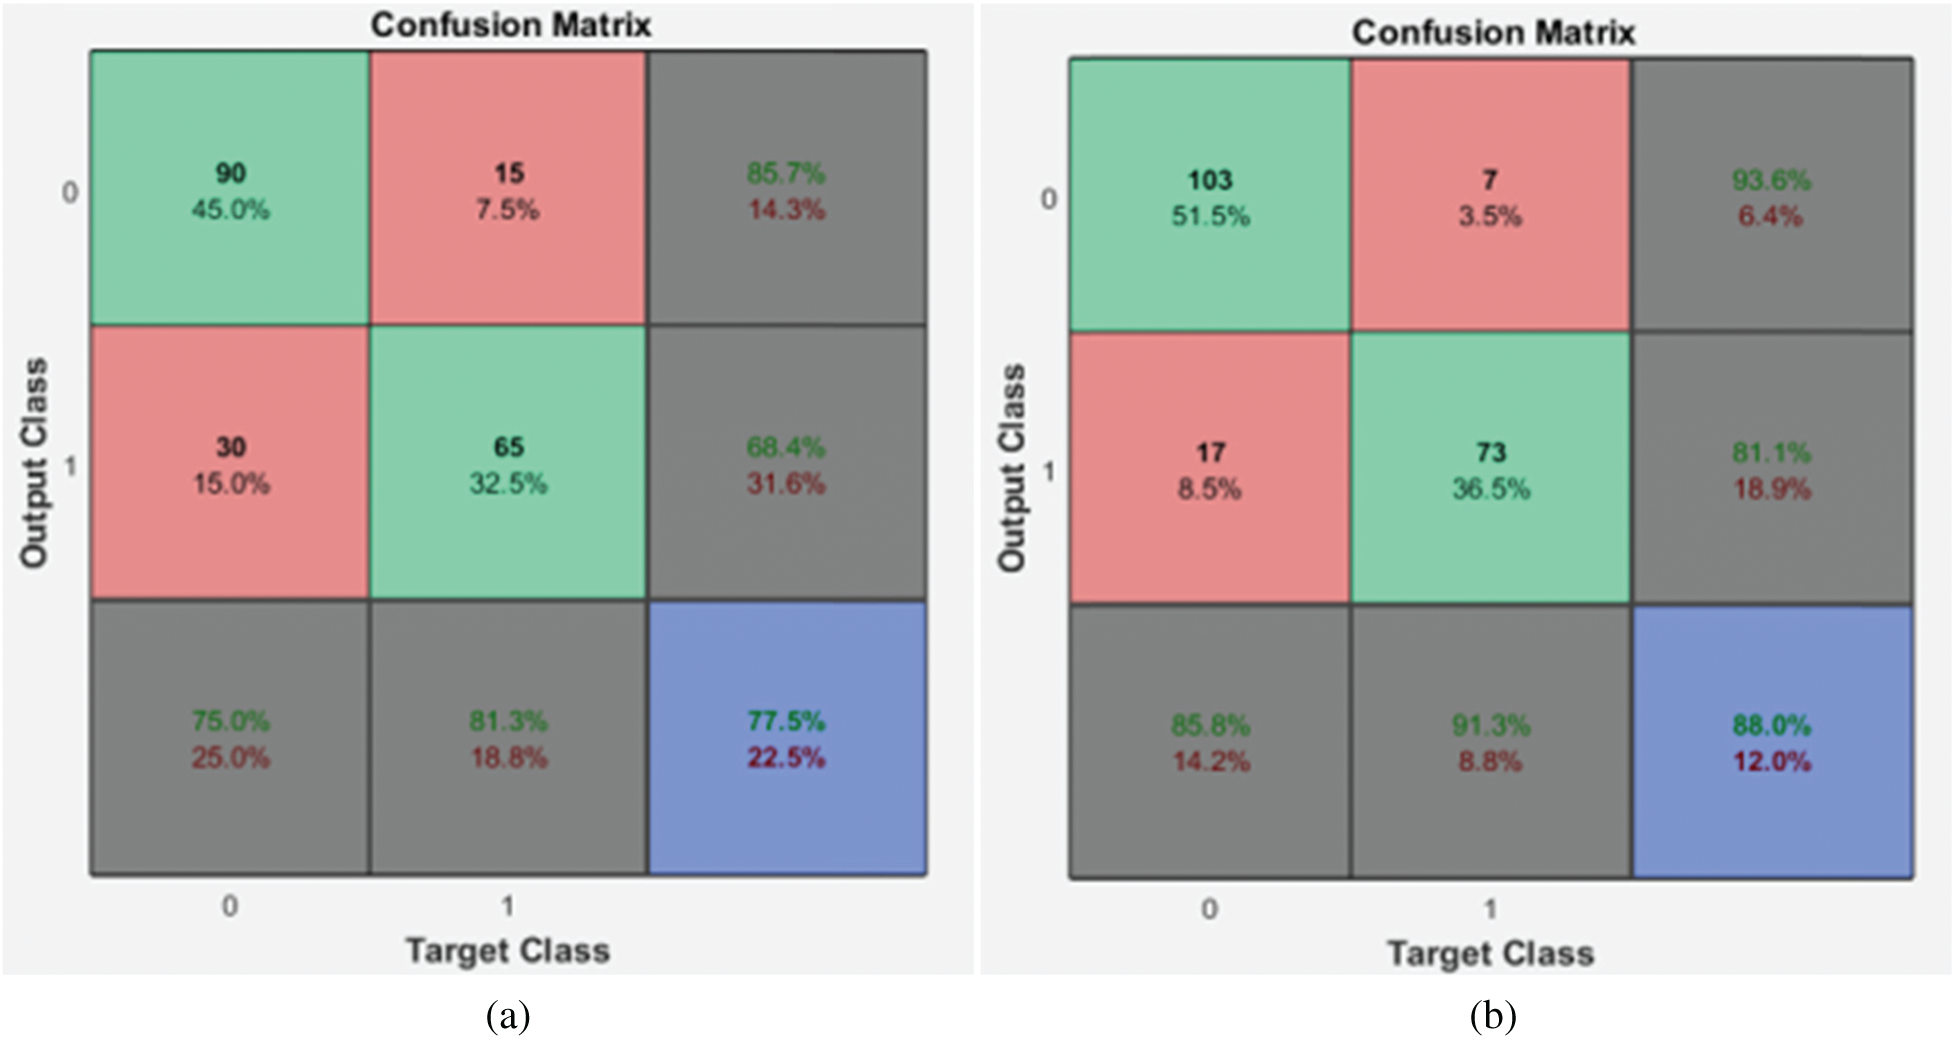
Figure 4: Confusion matrices of the 1st stage SMC system (a) local properties (b) DRLBP
It is evident from the Fig. 4 that the DRLBP features provide better performance than local properties of dermoscopic images. This is because DRLBP extracts spatial patterns that are available in the different classes of images effectively. It increases the performance by
Table 2: Performance of 1st stage SMC system using GARCH features with DWT
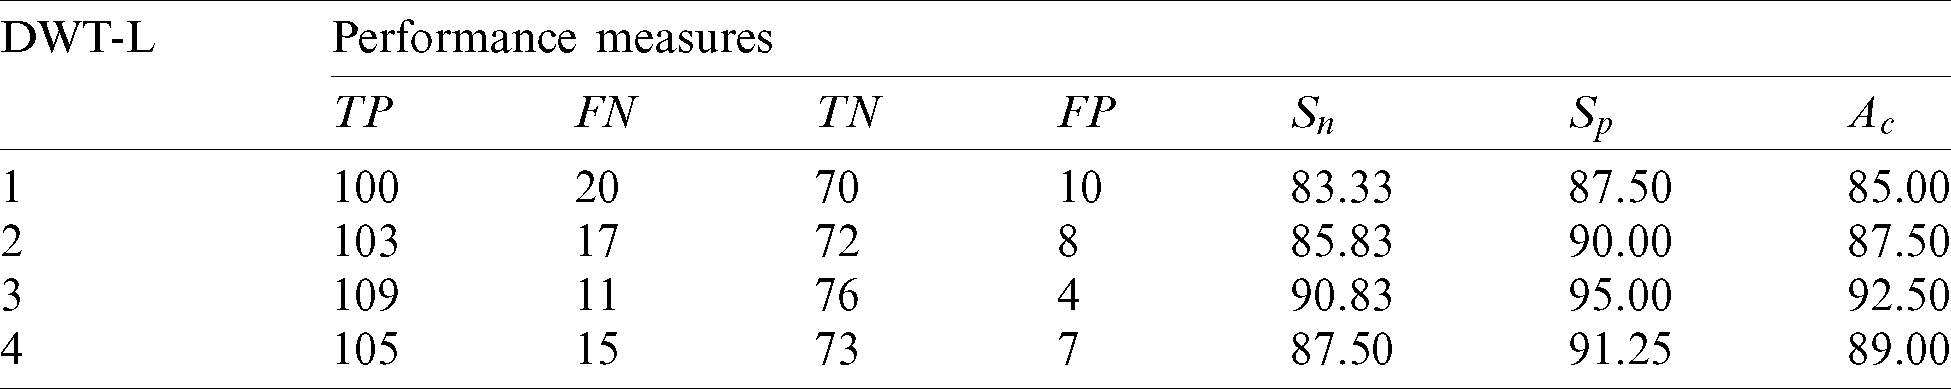
It is observed that over 90% of accuracy is obtained by GARCH parameters extracted from the sub-bands of 3rd level DWT. It is well known that more information can be obtained when increasing the resolution levels. However, the features obtained from higher resolution levels reduce the system’s accuracy due to the redundant data that can be seen at 4th level DWT features. Also, it is evident from Tab. 2 and Fig. 4, the GARCH features have better performance than others.
Applying the 1st stage SMC system is reasonable while using the features independently but insufficient in the medical field that requires more accuracy to decrease the mortality. The redundant features in each group, which affects the performance, are eliminated by a feature reduction approach to obtain more accuracy. Tab. 3 shows the performance of the 1st stage SMC system after the feature reduction approach.
Table 3: Performance of the 1st stage SMC system using after feature reduction
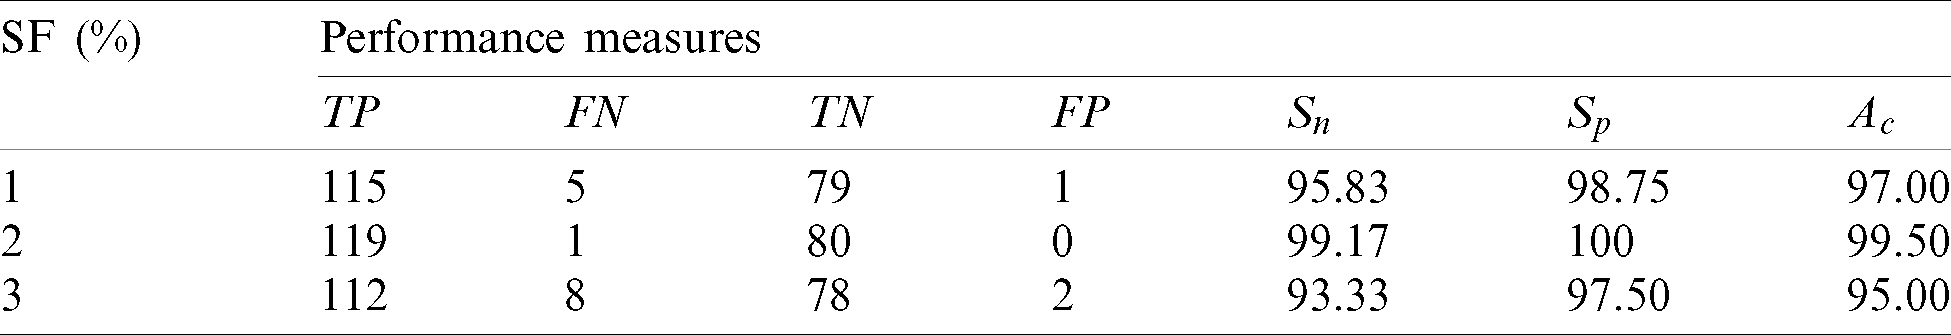
After feature reduction, the highest performance is 99.17% sensitivity and 100% specificity for 2% selected features. With more features, both performance measures are reduced and thus the system select only 2% features from the combination of features as the best set to classify abnormal images. Fig. 5 shows the SMC system’s accuracy for all possible feature set used in the 1st stage. Fig. 6 Confusion matrices of 2nd stage SMC system obtained using local properties and DRLBP respectively.
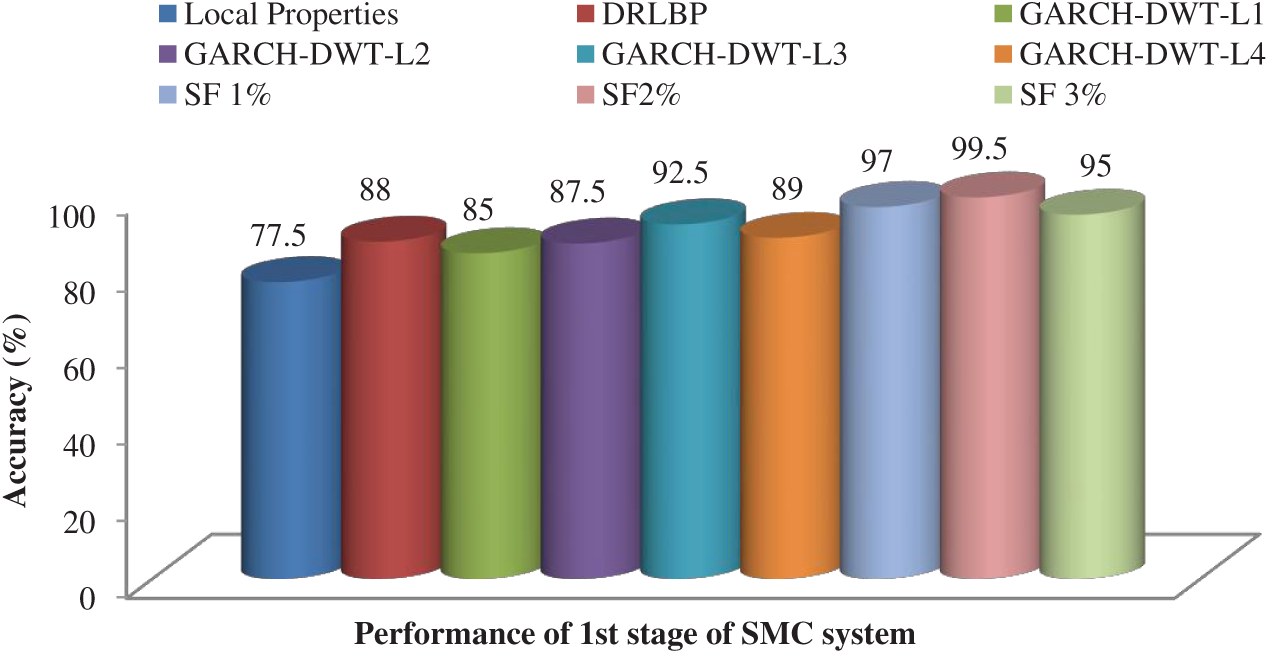
Figure 5: Accuracy of the SMC system for all possible feature set used in the 1st stage
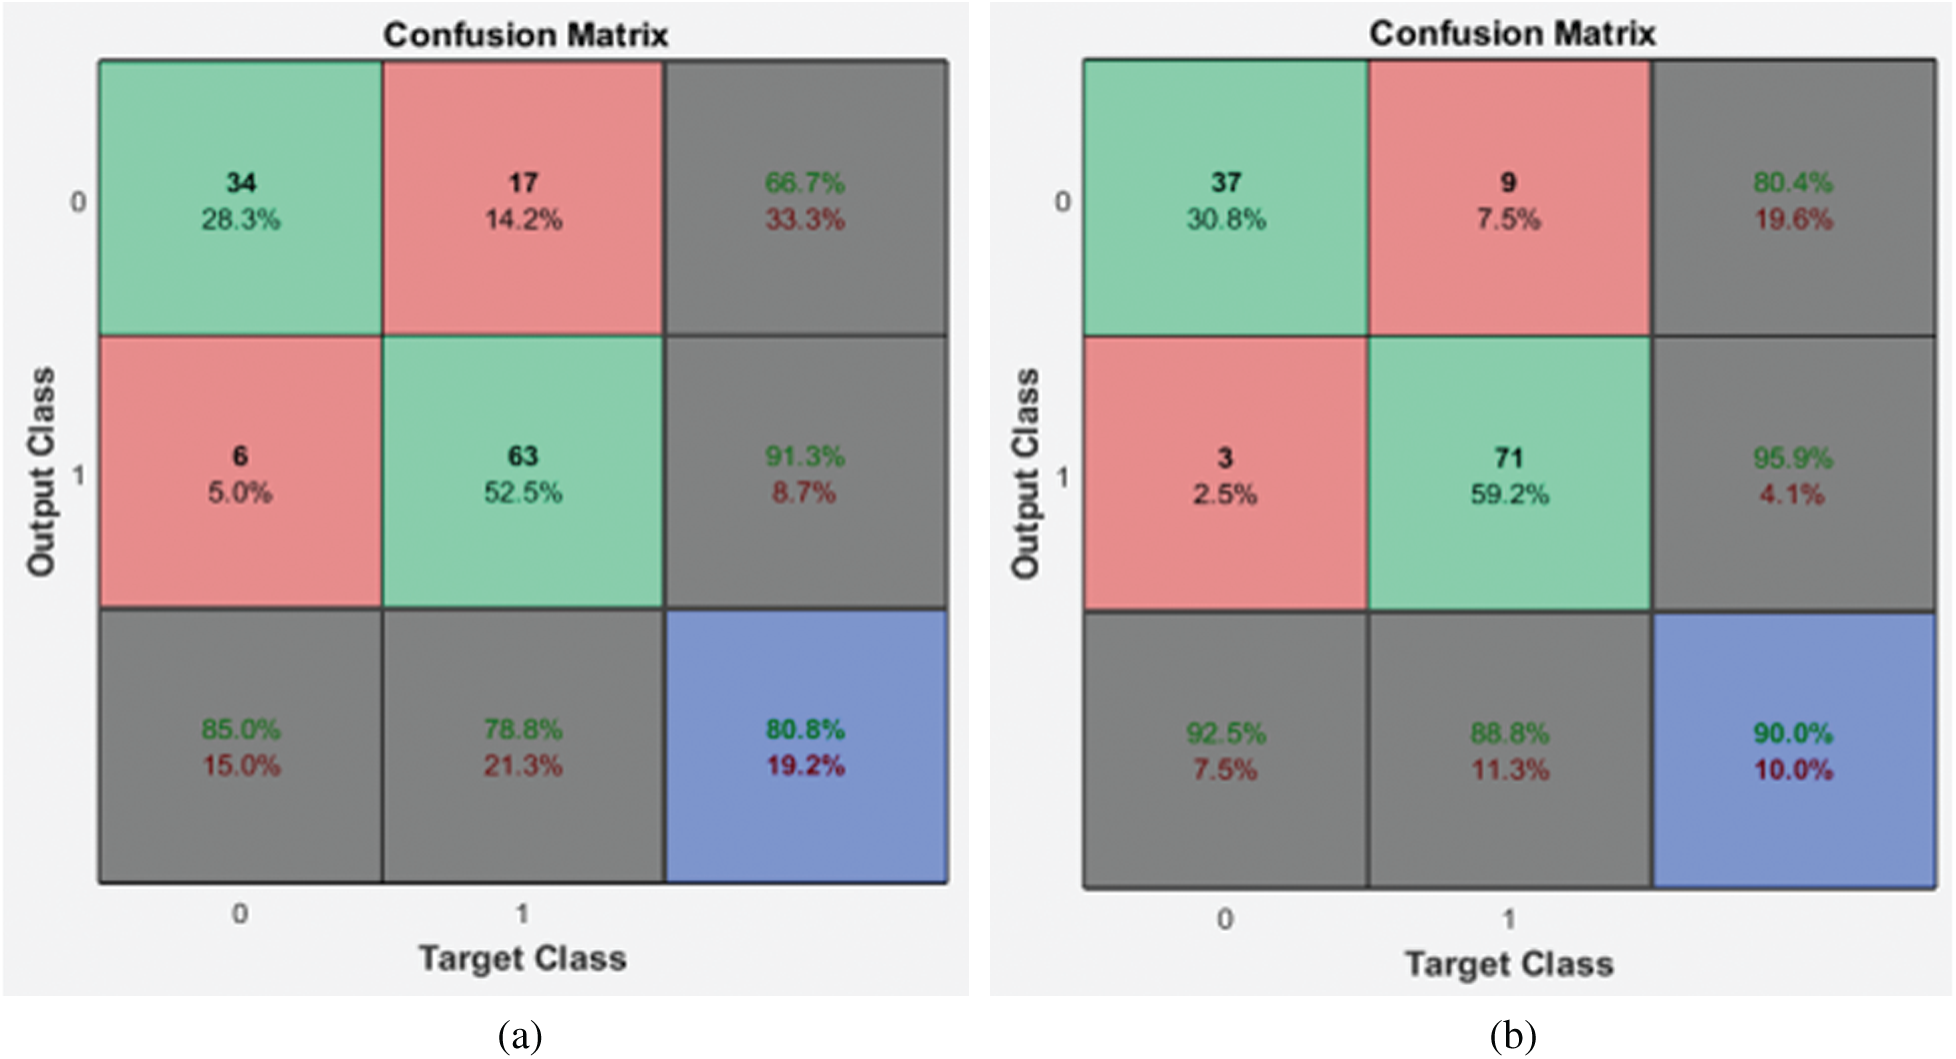
Figure 6: Confusion matrices of the 2nd stage SMC system (a) local properties (b) DRLBP
It is evident from the 2nd stage SMC system; DRLBP has a maximum specificity of 86.8% and sensitivity of 92.5%. Tab. 4 shows the performance of the 2nd stage SMC system using GARCH features with DWT levels.
Table 4: Performance of the 2nd stage SMC system using GARCH features with DWT
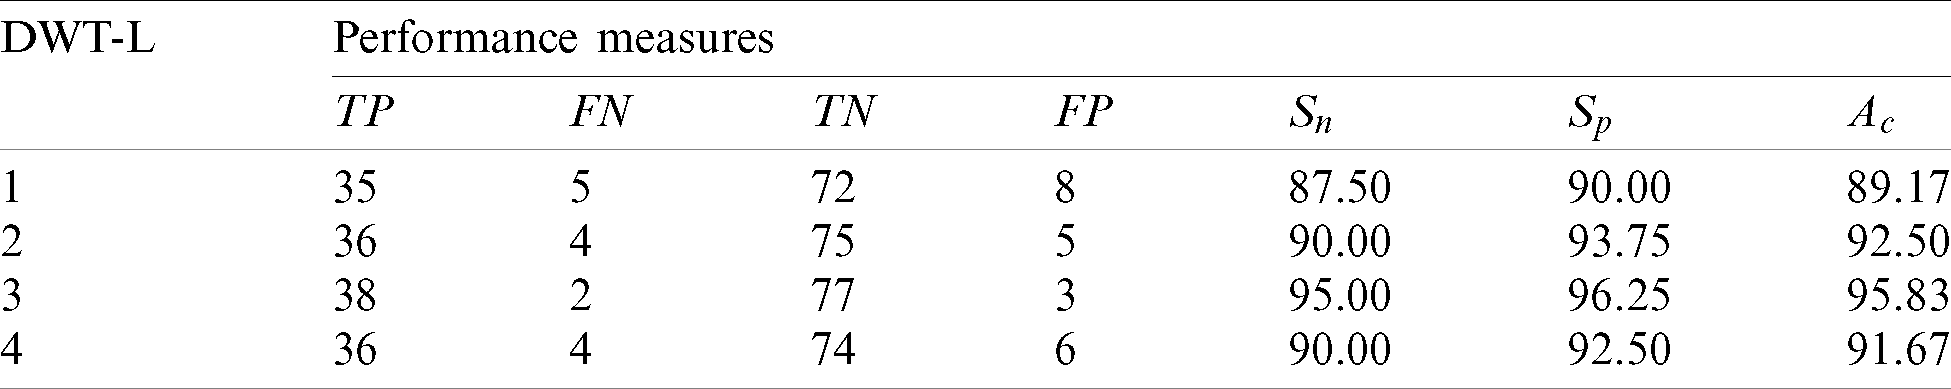
The best features which perform better than any other GARCH features are extracted from the 3rd level. The sensitivity of 3rd level GARCH features is increased
Table 5: Performance of the 2nd stage SMC system using after feature reduction
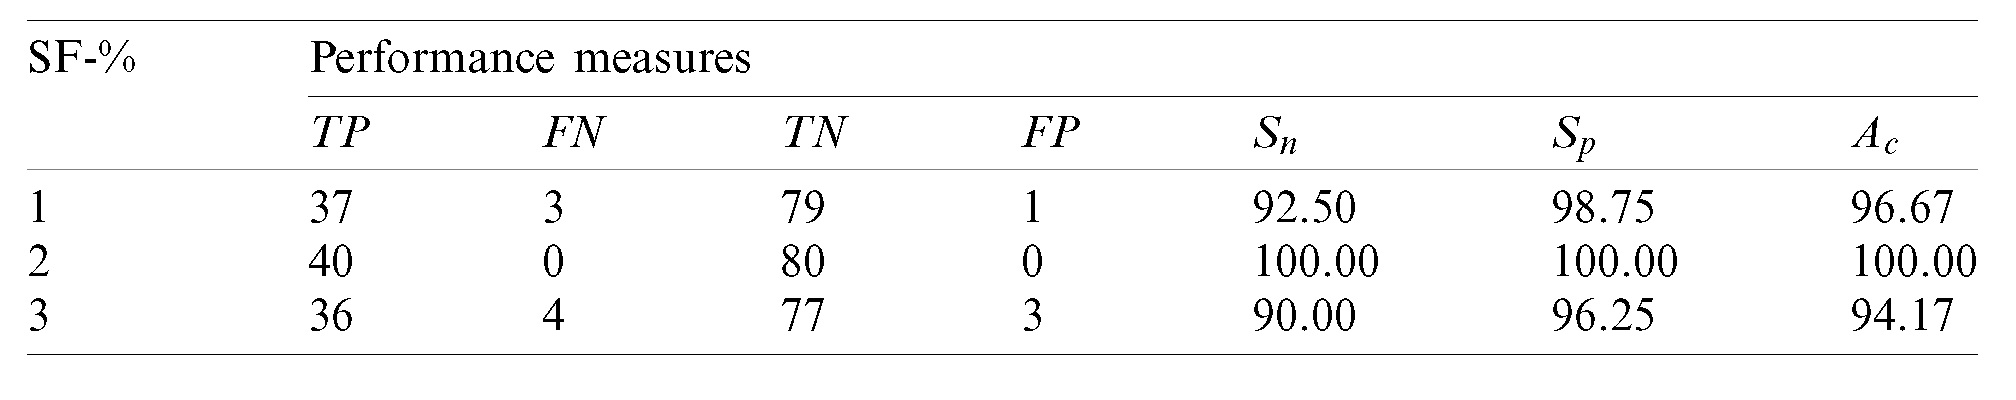
After feature reduction, the best performing features for 100% sensitivity and specificity are 2% features from the feature reduction approach. Fig. 7 shows the SMC system’s accuracy for all possible feature set used in the 2nd stage.
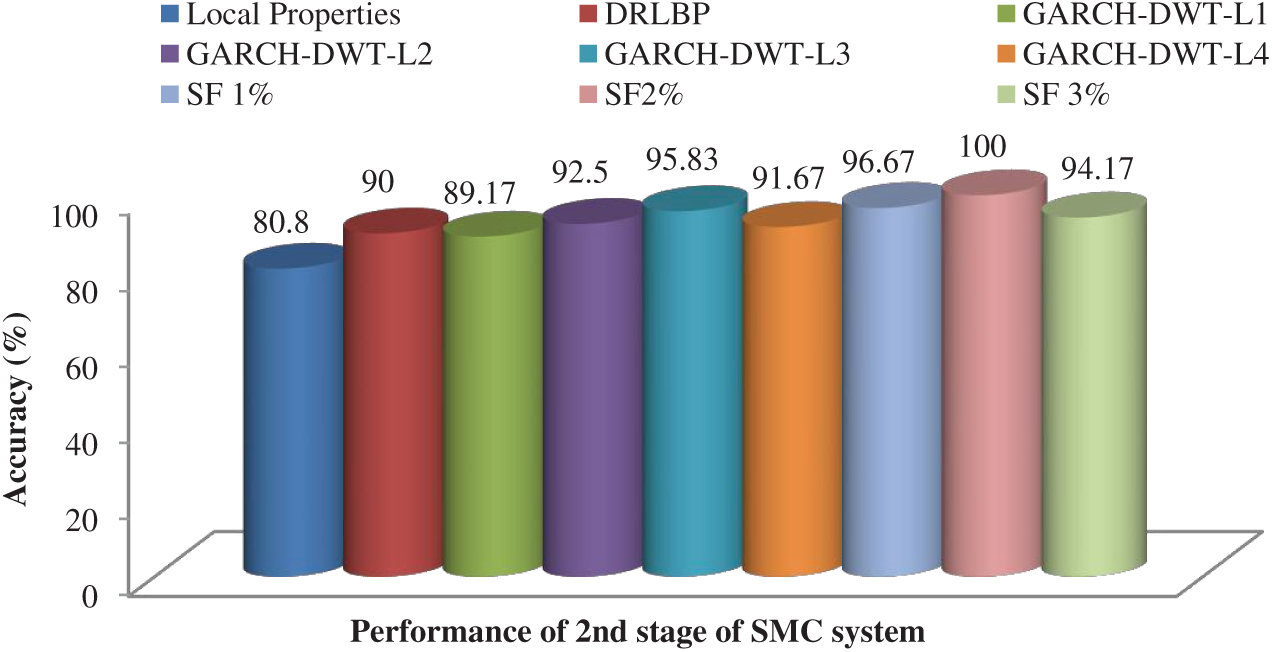
Figure 7: Accuracy of the SMC system for all possible feature set used in the 2nd stage
To visually analyze the SMC system, which uses three types of features and a combination of these features, ROC is used. Fig. 8 shows the ROCs of 1st and 2nd stage of SMC system. The classification is significantly better for the best-selected features (2% features) than others in both stages. The areas under the curve for the 1st stage and 2nd stage of SMC systems are 0.775 & 0.808 (Local properties), 0.88 & 0.9 (DRLBP), 0.925 & 0.9583 (GARCH of 3rd Level of DWT) and 0.99 & 1 (Best Selected Features) respectively.
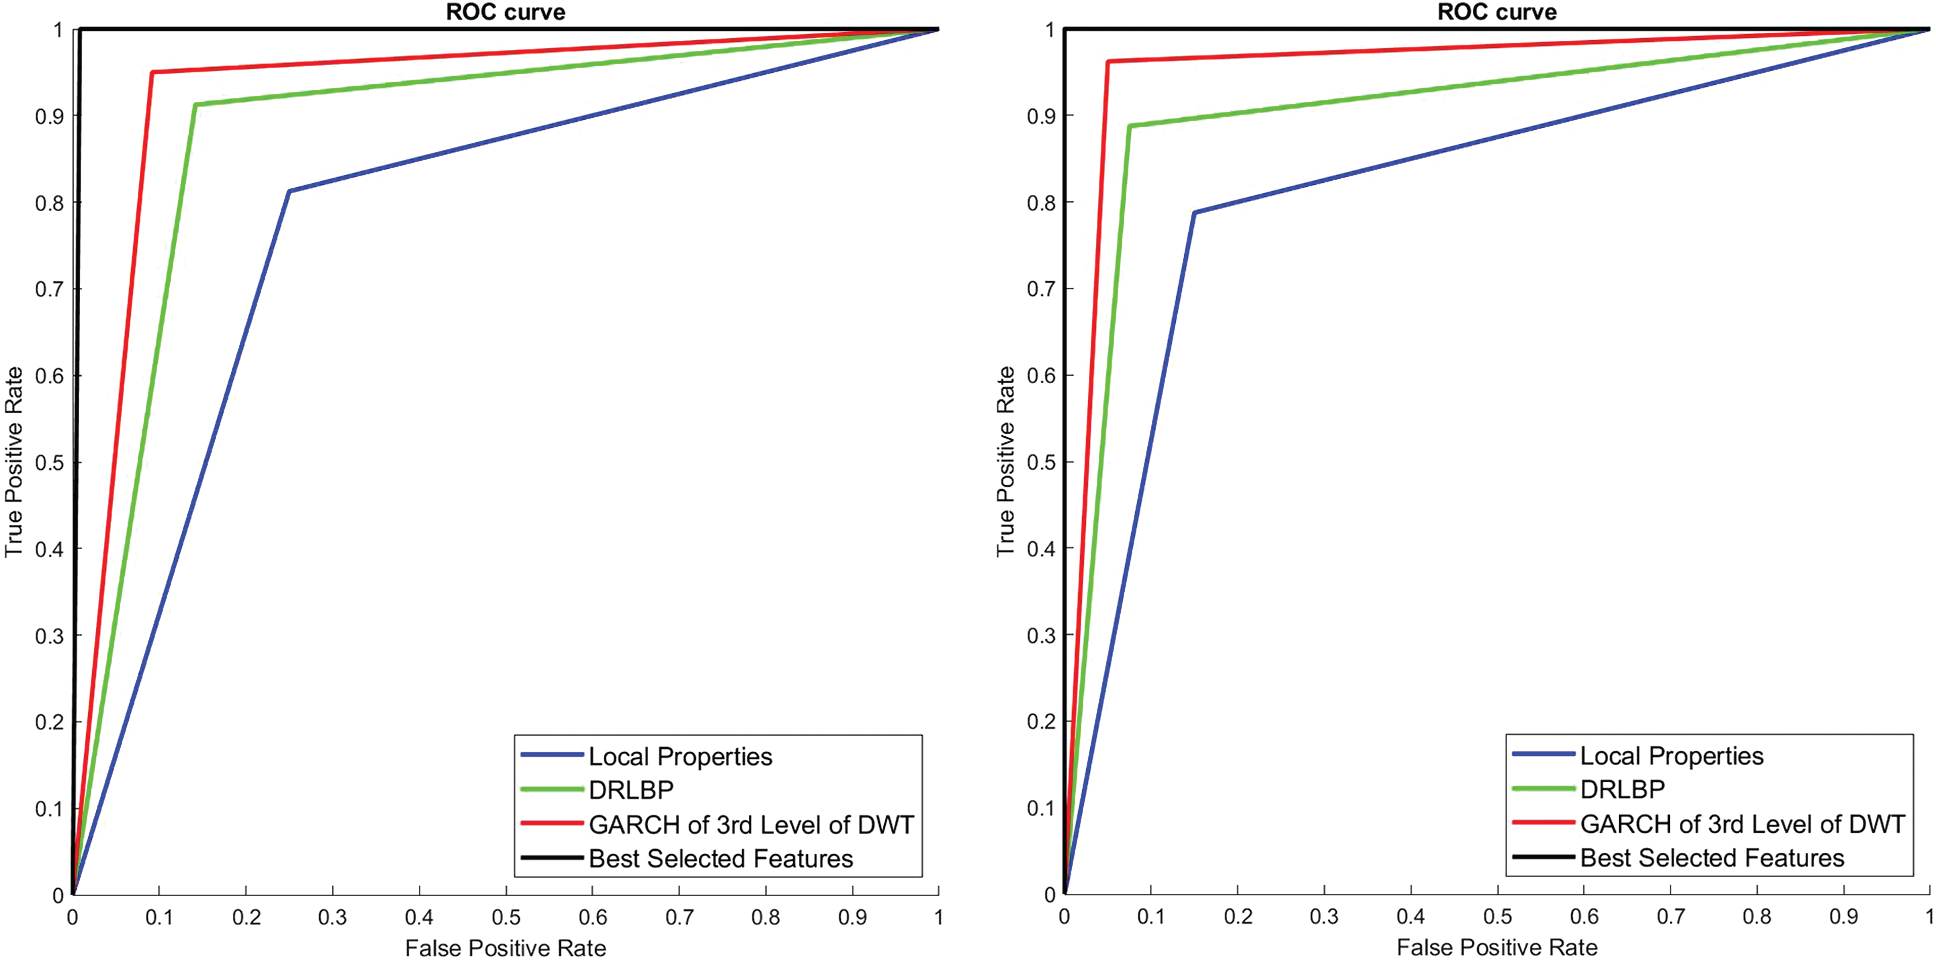
Figure 8: ROCs of 1st and 2nd stage SMC system
An efficient SMC system which combines segmentation, feature extraction, feature reduction and classification stages into one automated operation is developed and investigated for skin cancer diagnosis. The use of local properties, GARCH parameters from 3rd DWT level sub-bands and DRLBP to classify skin melanoma images is tested. Deep learning is tested using PH2 database images and gives almost near-ideal system performance in terms of accuracy, sensitivity and specificity. Also, it is found that GARCH modelling can indeed be used for skin cancer diagnosis, and there are indeed performance differences in these features. The sensitivity of 1st stage and 2nd stage of the SMC system are 99.17% and 100% respectively, with all normal images are perfectly classified. The greatest degree of success is achieved on PH2 database images using two stages of deep learning. It can be used as a pre-screening tool as it provides 100% accuracy for melanoma cases.
Funding Statement: The author(s) received no specific funding for this study.
Conflicts of Interest: The authors declare that they have no conflicts of interest to report regarding the present study.
1. W. Stolz, A. Riemann and A. Cognetta. (1994). “ABCD rule of dermatoscopy: A new practical method for early recognition of malignant melanoma,” European Journal of Dermatology, vol. 4, no. 7, pp. 521–527. [Google Scholar]
2. G. Argenziano, G. Fabbrocini and P. Carli. (1998). “Epiluminescence microscopy for the diagnosis of doubtful melanocytic skin lesions: Comparison of the ABCD rule of dermatoscopy and a new 7-point checklist based on pattern analysis,” Architecture of Dermatology, vol. 134, no. 12, pp. 1563–1570. [Google Scholar]
3. H. Pehamberger, A. Steiner and K. Wolff. (1987). “In vivo epiluminescence microscopy of pigmented skin lesions—I: Pattern analysis of pigmented skin lesions,” Journal of American Academy of Dermatology, vol. 17, no. 4, pp. 571–583. [Google Scholar]
4. O. Abuzaghleh, B. D. Barkana and M. Faezipour. (2014). “Automated skin lesion analysis based on color and shape geometry feature set for melanoma early detection and prevention,” in Proc. of IEEE Long Island System and Application Technology Conf., Farmingdale, NY, USA, pp. 1–6. [Google Scholar]
5. I. Maglogiannis and C. Doukas. (2009). “Overview of advanced computer vision systems for skin lesions characterization,” IEEE Transformation of Information Technology Biomedical, vol. 13, no. 5, pp. 721–733. [Google Scholar]
6. M. Celebi, H. Kingravi, B. Uddin, H. Iyatomi, Y. Aslandogan et al. (2007). , “A methodological approach to the classification of dermoscopy images,” Computing Medical Image Graphics, vol. 31, no. 6, pp. 362–373. [Google Scholar]
7. R. Haralick. (1979). “Statistical and structural approaches to texture,” Proc. of the IEEE, vol. 67, no. 5, pp. 786–804. [Google Scholar]
8. K. I. Laws. (1980). “Rapid texture identification,” Image Processing for Missile Guidance, vol. 238, pp. 376–381. [Google Scholar]
9. T. Ojala, M. Pietikäinen and D. Harwood. (1996). “A comparative study of texture measures with classification based on feature distributions,” Pattern Recognition, vol. 29, no. 1, pp. 51–59. [Google Scholar]
10. R. Walvick, K. Patel, S. Patwardhan and A. Dhawan. (2004). “Classification of melanoma using wavelet-transform-based optimal feature set,” Proc. of SPIE Medical Image: Image Processing, vol. 5370, pp. 944–951. [Google Scholar]
11. S. Kumarapandian. (2018). “Melanoma classification using multiwavelet transform and support vector machine,” International Journal of MC Square Scientific Research, vol. 10, no. 3, pp. 1–7. [Google Scholar]
12. R. Sonia. (2016). “Melanoma image classification system by NSCT features and Bayes classification,” International Journal of Advances in Signal and Image Sciences, vol. 2, no. 2, pp. 27–33. [Google Scholar]
13. D. Donoho and E. Candes. (2005). “Continuous curvelet transform: II Discretization and frames,” Applied and Computational Harmonic Analysis, vol. 19, no. 2, pp. 198–222. [Google Scholar]
14. G. Easley, D. Labate and W. Q. Lim. (2008). “Sparse directional image representations using the discrete shearlet transform,” Applied and Computational Harmonic Analysis, vol. 25, no. 1, pp. 25–46. [Google Scholar]
15. T. Bollerslev. (1986). “Generalized autoregressive conditional heteroskedasticity,” Journal of Econometrics, vol. 31, no. 3, pp. 307–327. [Google Scholar]
16. H. Ganster, P. Pinz, R. Rohrer, E. Wildling, M. Binder et al. (2001). , “Automated melanoma recognition,” IEEE Transaction of Medical Imaging, vol. 20, no. 3, pp. 233–239. [Google Scholar]
17. M. Wiltgen, A. Gergerb and J. Smolle. (2003). “Tissue counter analysis of benign common nevi and malignant melanoma,” International Journal of Medical Information, vol. 69, no. 1, pp. 17–28. [Google Scholar]
18. A. Mahbod, G. Schaefer, C. Wang, R. Ecker and I. Ellinge. (2019). “Skin lesion classification using hybrid deep neural networks,” in IEEE Int. Conf. on Acoustics, Speech and Signal Processing, Brighton, United Kingdom, pp. 1229–1233. [Google Scholar]
19. M. A. Albahar. (2020). “Skin lesion classification using convolutional neural network with novel regularizer,” IEEE Access, vol. 7, pp. 38306–38313. [Google Scholar]
20. D. Moldovan. (2019). “Transfer learning based method for two-step skin cancer images classification,” in E-Health and Bioengineering Conf., Iasi, Romania, pp. 1–4. [Google Scholar]
21. D. Arthur and S. Vassilvitskii. (2007). “k-means++: The advantages of careful seeding,” in Proc. of the Eighteenth Annual ACM-SIAM Symp. on Discrete Algorithms, New Orleans, Louisiana, pp. 1027–1035. [Google Scholar]
22. K. Hackmack, F. Paul, M. Weygandt, C. Allefeld and J. D. Haynes. (2012). “Multi-scale classification of disease using structural MRI and wavelet transform,” Neuroimage, vol. 62, no. 1, pp. 48–58. [Google Scholar]
23. H. Kalbkhani, M. G. Shayesteh and B. Zali-Vargahan. (2013). “Robust algorithm for brain magnetic resonance image (MRI) classification based on GARCH variances series,” Biomedical Signal Processing and Control, vol. 8, no. 6, pp. 909–919. [Google Scholar]
24. R. Mehta and K. Egiazarian. (2016). “Dominant rotated local binary patterns (DRLBP) for texture classification,” Pattern Recognition Letters, vol. 71, no. 2, pp. 16–22. [Google Scholar]
25. C. Srinivasan, S. Dubey and T. R. Ganeshbabu. (2015). “Complex texture features for glaucoma diagnosis using support vector machine,” International Journal of MC Square Scientific Research, vol. 7, no. 1, pp. 81–92. [Google Scholar]
26. S. Murugan, A. Bhardwaj and T. R. Ganeshbabu. (2015). “Object recognition based on empirical wavelet transform,” International Journal of MC Square Scientific Research, vol. 7, no. 1, pp. 74–80. [Google Scholar]
27. W. Zhu, X. Wang, Y. Ma, M. Rao, J. Glimm et al. (2003). , “Detection of cancer-specific markers amid massive mass spectral data,” Proc. of the National Academy of Sciences of the United States of America, vol. 100, no. 25, pp. 14666–14671. [Google Scholar]
28. I. Goodfellow, Y. Bengio and A. Courville. (2016). Deep Learning, Cambridge, MA, USA: MIT Press. [Google Scholar]
29. T. Mendonça, P. M. Ferreira, J. S. Marques, A. R. Marcal and J. Rozeira. (2013). “PH2-A dermoscopic image database for research and benchmarking,” in 35th Annual Int. Conf. on Engineering in Medicine and Biology Society, Osaka, Japan, pp. 5437–5440. [Google Scholar]
30. PH2 Database Link: [Online]. Available: https://www.fc.up.pt/addi/ph2%20database.html. [Google Scholar]
 | This work is licensed under a Creative Commons Attribution 4.0 International License, which permits unrestricted use, distribution, and reproduction in any medium, provided the original work is properly cited. |