DOI:10.32604/cmc.2021.015541
| Computers, Materials & Continua DOI:10.32604/cmc.2021.015541 | |
| Article |
Classification of COVID-19 CT Scans via Extreme Learning Machine
1Department of Computer Science, HITEC University, Taxila, 47040, Pakistan
2Department of Electrical Engineering, COMSATS University Islamabad, Wah Campus, Wah Cantt, Pakistan
3Department of Computer Science and Engineering, Soonchunhyang University, Asan, Korea
4Department of Mathematics and Computer Science, Faculty of Science, Beirut Arab University, Lebanon
5Department of Mathematics, University of Leicester, Leicester, UK
6College of Computer Science and Engineering, University of Ha’il, Ha’il, Saudi Arabia
*Corresponding Author: Yunyoung Nam. Email: ynam@sch.ac.kr
Received: 26 November 2020; Accepted: 23 January 2021
Abstract: Here, we use multi-type feature fusion and selection to predict COVID-19 infections on chest computed tomography (CT) scans. The scheme operates in four steps. Initially, we prepared a database containing COVID-19 pneumonia and normal CT scans. These images were retrieved from the Radiopaedia COVID-19 website. The images were divided into training and test sets in a ratio of 70:30. Then, multiple features were extracted from the training data. We used canonical correlation analysis to fuse the features into single vectors; this enhanced the predictive capacity. We next implemented a genetic algorithm (GA) in which an Extreme Learning Machine (ELM) served to assess GA fitness. Based on the ELM losses, the most discriminatory features were selected and saved as an ELM Model. Test images were sent to the model, and the best-selected features compared to those of the trained model to allow final predictions. Validation employed the collected chest CT scans. The best predictive accuracy of the ELM classifier was 93.9%; the scheme was effective.
Keywords: Coronavirus; classical features; feature fusion; feature optimization; prediction
The novel coronavirus pandemic disease that appeared in China has rapidly spread worldwide [1]. The World Health Organization (WHO) termed the disease caused by the virus COVID-19 on February 1, 2020 [2]. COVID-19 spread from Wuhan, China, to become a major global health problem [3]. The WHO has recorded 86,806 confirmed cases of COVID-19 in China, and 4634 deaths to date (16th December 2020) [4]. Many members of the coronavirus family cause disease. The virus that causes COVID-19 is termed the severe acute respiratory syndrome coronavirus 2 (SARS-CoV-2) [5]. The common symptoms of COVID-19 are fever and cough, and sometimes headache and fatigue [6]. The COVID-19 virus was first discovered in humans in 2019 and spread rapidly in respiratory droplets [7].
To date (19th December 2020), there are 76,186,444 confirmed COVID-19 cases worldwide, with 1,684,864 deaths, according to WHO. It shows that the global mortality rate is 6.9%. The USA’s confirmed COVID-19 cases are 17,899,267 and 321,025 deaths, which is top of the list in the world. Confirmed COVID-19 cases in India are 10,013,478, Brazil are 7,163,912, Russia are 2,819,429, France are 2,442,990, Turkey are 1,982,090, and UK are 1,977,167, respectively. In these countries, the number of deaths are 145,298, 185,687, 50,347, 60,229, 17,610, and 66,541, respectively to date (19th December 2020). And these cases are increasing day by day. Italy is another highly affecting country by this virus, and the positive reported cases are 1,921,778, and total deaths are 67,894. The Asian countries such as India is on the top, which is highly affected by this virus. In Pakistan, this rate is much slower as compared to other Asian Countries.
COVID-19 poses a major healthcare problem worldwide [8,9]. Early detection of infected patients would be helpful [10]. Many computer-aided diagnostic (CAD) systems allow physicians to recognize the stomach [11], lungs [12], and brain cancer [13], and COVID [14] infections. The existing COVID detection methods are slow and expensive. It is possible to use machine-learning algorithms to identify diseased lungs on computed tomography (CT) images. Most such algorithms feature supervised machine-learning. CAD systems automatically extract textural [15], geometric [16], and deep [17] features of chest CT images. However, not all extracted features are useful; higher-dimensionality data render diagnoses slow and compromise the results. Many medical researchers seek to develop feature selection methods [18] that transform high-dimensional features into simpler components. The algorithms select robust features and remove irrelevant information [19]. A robust feature set enhances CAD system performance in terms of both accuracy and time. The many methods of optimal feature selection include entropy-based approaches [20], Particle Swarm Optimization (PSO), and the so-called Grasshopper, and genetic algorithms (GAs) [21], to name a few [22]. In this work, we presented an automated technique for COVID19 classification using CT images. Our major contributions in this work are in the following steps: (i) Multi properties features are extracted in different directions from the CT images; (ii) Employed a parallel canonical correlation analysis approach for features fusion; (iii) GA is implemented for the best features selection, and (iv) ELM based classify the selected features.
The rest of the manuscript is organized as follows: The existing relevant studies are discussed in Section 2 (related work). The proposed methodology is described in Section 3, which includes dataset preparation, features fusion, and selection. Section 4 represents the experimental results, and finally, analysis and conclusion are presented in Section 5.
Recently, COVID-19 patients have been diagnosed by reference to their X-ray and CT images using computer vision (CV)-based machine-learning algorithms, principally, supervised learning and deep learning (DL) techniques. Apostolopoulos et al. [23] subjected X-ray image datasets to transfer learning using different convolutional neural network (CNN) models and evaluated their technique with the aid of two datasets that contained confirmed COVID-19, bacterial pneumonia, and normal cases. The maximum accuracies achieved by MobileNet V2 [24] were 96.78% (two-class) and 94.72% (three-class). Li et al. [25] developed a novel DL model (COVNet) to detect COVID-19 in chest CT images; the sensitivity was 90% and the specificity 96%. Shan et al. [26] implemented a neural network-based VB-Net model for segmentation of COVID-19-infected regions in CT images. The Dice similarity was
We develop automated prediction of positive COVID-19 pneumonia cases using CT scans. The positive cases are labeled via RT-PCR testing. The scheme features four steps. First, a database was prepared by collecting COVID-19 pneumonia-positive chest CT scans and normal scans from the Radiopaedia COVID-19 website (https://radiopaedia.org/cases). Next, the images were divided into training and test sets. Several features (the Dynamic Average LBP, the SFTA, the DWT, and the Reyni Entropy) were extracted from the training data. We used canonical correlation analysis (CCA) to fuse the features into single vectors; this enhanced the predictive power. We next implemented a GA using the fused feature vectors. The ELM classifier served as the GA fitness function. We used ELM loss to select the most discriminatory features and saved them as an ELM Model. Next, the test images were evaluated and the best-selected features compared to those of the trained model in terms of final predictions. A flow chart is shown in Fig. 1; 60% of the images were used to train the ELM Model and the remainder for testing.

Figure 1: A proposed architecture for prediction of COVID-19 positive chest CT scans using improved genetic algorithm based features selection
All images (58 patients) were collected from the Radiopaedia COVID-19 website. We downloaded data on 30 patients with COVID-19 pneumonia confirmed via RT-PCR. We gathered 3,000 COVID pneumonia-positive images and 2,500 control images (Fig. 2). All images were resized to

Figure 2: Sample images of COVID-19 positive and normal chest CT scans
3.2 Extraction of Classical Features
In terms of pattern recognition and machine-learning, features play pivotal roles in object representation. Many feature selection techniques for medical images are available [37]. However, some methods are better than others. Classical features are favored when data are lacking. We could not train an advanced machine-learning model such as a CNN; therefore, we extracted three features (the Dynamic Average LBP, the SFTA, and the DWT), and Entropy, as described below.
Dynamic Average LBP (DALBP) features are modifications of the original LBP features; averages are used rather than central values. As in the original LBP [38], the principal value is replaced by neighboring values based on a threshold but, in the improved version, an average value is computed based on the dynamic window size. First, we examined the original LBP features. Assume that
where pc denotes the central pixel value, pn the neighbor pixel values of pc, r the radius, and X the total number of neighbors. Suppose the central coordinates are
As the image dimensions are
where
Consider an image of dimensions
where
where
where the length of each final feature vector [
SFTA features, also termed textural features, are also used to extract discriminatory information. In the medical context, SFTA features are often used to describe organs. The principal textural descriptor is the GLCM, but the use thereof is very time-consuming. We used accurate SFTA features that can be rapidly extracted [40]. An image is initially decomposed into a binary image via two-threshold segmentation:
where
where
Discrete Wavelet Transform (DWT) is a well-known type of feature extraction that analyzes images at various scales and resolutions [41]. Let g(x) be a continuous square-integral function. Mathematically, this is:
where s1 and s2 are the scale and translation parameters of a real-valued
where
The Renyi entropy feature vector is computed in row coefficients; the output vector is of dimensions
All extracted features were fused employing canonical correlation analysis (CCA) [42]. The purpose was to enhance the learning capacity of each feature vector in terms of correct predictions of COVID-19-positive chest scans and normal scans. Suppose that
where
Next, Lagrange multipliers are used to solve the maximization problem between
Finally, the transformed features are combined as follows:
where
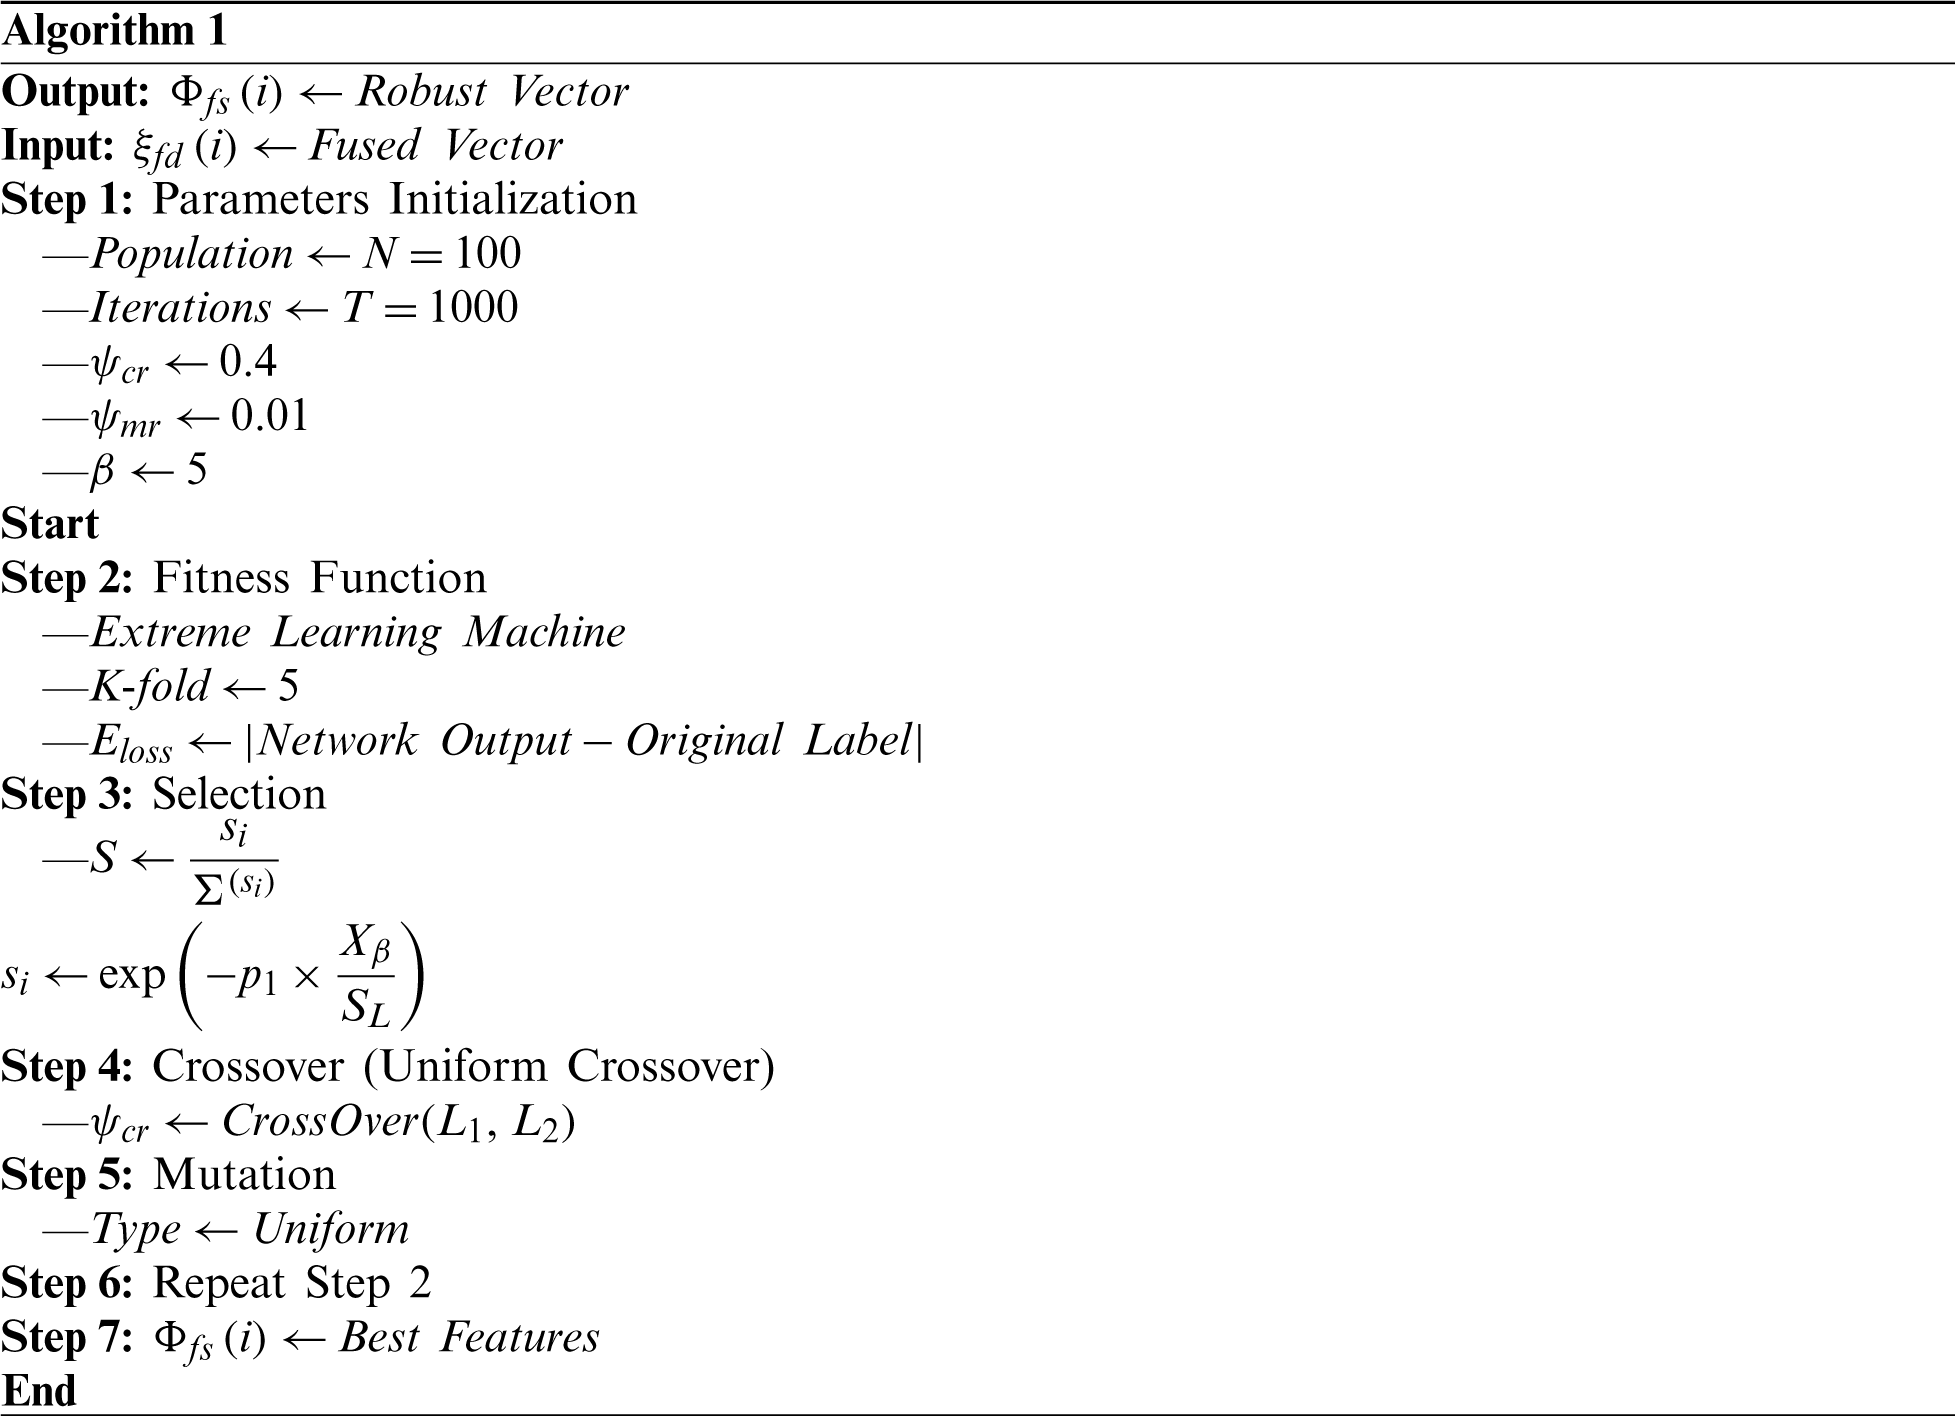
Feature selection involves selection of the best subset of input feature vectors based on a defined criterion. Use of a best subset improves learning and predictive accuracy, and reduces the computational time. We implemented a GA and an ELM fitness function. Most researchers use the Fine KNN and SVM for fitness calculations; however, we believe that the ELM is more efficient. The GA is Algorithm 1. The initial population size is 100, the number of iterations 1,000, the crossover rate (
3.5 The Extreme Learning Machine (ELM)
Given a robust feature vector after GA and appropriate labeling
(25)
where Hl denotes the hidden-layer, output weight matrix;
where
Based on this error, l = 1 and l = −1 are the outputs. l = 1 indicates COVID-19 pneumonia and l = −1 a healthy lung. The model is trained using 60% of the data and the test images then passed to the scheme to select the best features, The chosen features are compared to those of the trained ELM classifier and the predictive outputs are both labels and numerical values. A few labeled images are shown in Fig. 3; these are predictions made during ELM testing.

Figure 3: Proposed prediction results of ELM during the testing step
4 Experimental Setup and Results
We used publicly available chest CT images (Section 3.1). We extracted DALBP, SFTA, and DWT-plus-Entropy features, fused them using the CCA approach, employed a GA to select robust features, and delivered these to the ELM classifier for final predictions. We compared ELM performance to those of Logistic Regression, Q-SVM, Fine Gaussian, Fine Tree, and Cubic KNN in terms of accuracy, Precision, Recall, Specificity, and the F1 score. We used an Intel Core i7 8th generation CPU equipped with 16 GB of RAM and 8 GB of GPU running MATLAB 2019b software. We took a 60–40 approach with 10-fold cross-validation during both training and testing.
The predictions are presented in numerical form and as bar graphs. We explored the accuracies afforded by DALBP, SFTA, and DWT-plus-Entropy features; CCA fusion accuracy; and GA accuracy. For the DALBP features (Tab. 1) the highest accuracy was 84.52% using the Quadratic SVM classifier; the figure for the ELM classifier was 82.30%. The linear and Naïve Bayes accuracies were 82.42 and 81.49%. The accuracies were 80.20%, 81.21%, 80.14%, 81.63%, 79.38%, 81.52%, 78.12%, 79.68%, 80.72% and 76.71% respectively. For the SFTA textural features (Tab. 1), the accuracies were lower than the DALBP figures. The highest accuracy was 78.95%, and the accuracies afforded by the other listed classifiers were 75.27%, 73.78%, 71.62%, 71.96%, 77.52%, 75.06%, 72.94%, 77.52%, 74.22%, 74.36%, 79.42%, 73.21%, and 76.13% respectively. For the DWT-plus-Entropy features, the maximum accuracy was 82.60% (Naïve Bayes), higher than any SFTA figure. Thus, the DALBP features were optimal.
Table 1: Prediction accuracy of COVID-19 pneumonia and normal cases using separate features without fusion and selection

The CC-based fusion approach was then employed for prediction. The ELM classifier was best: 92.8% accuracy, 93.81% precision, 94% specificity, and an F1 score of 0.93. The worst classifier was the EBT (86.1% accuracy). All results are shown in Tab. 2. The classifier accuracies were 92.7%, 92.6%, 92.2%, 92.2%, 91.5%, 90.8%, 90.6%, 90.3%, 90.2%, 90.2%, 89.8%, 89.7%, and 86.1%. Thus, CCA-based fusion improved accuracy by about 10%. The fusion accuracies of ELM and LSVM are shown in Fig. 4 (a confusion matrix).
Table 2: Proposed prediction results of multi-type features fusion


Figure 4: Confusion matrix of LSVM and ELM after multi-type features fusion
We used an improved GA to select the best features for final prediction (Section 3.4 and Algorithm 1). The predictive performances of several classifiers are shown in Tab. 3. All improved after implementation of feature selection. The ELM classifier was robust (accuracy 93.9%, precision 93.14%, specificity 95%, recall 94%, and F1 Score 0.94) The next best classifier was the linear SVM (LSVM) (93.4% accurate). Fig. 5 shows the ELM/Linear SVM confusion matrix; feature fusion and selection improved performance. Fig. 6 shows the receiver-operator curves for prediction of healthy and COVID-19 pneumonia CT images; the AUCs were verified. In summary, selection of the best features afford excellent prediction of COVID-positive and normal chest CT scans.
Table 3: Proposed prediction results after best features selection using improved genetic algorithm and ELM


Figure 5: Confusion matrix of LSVM and ELM after best features selection using improved genetic algorithm

Figure 6: Representation of ELM performance based on ROC plots
Tab. 1 shows the predictive accuracies of various features prior to fusion and selection. The highest accuracies were 84.52, 78.95, and 82.60 for the DALBP, SFTA, and DWT-plus-Entropy features. After CCA-mediated fusion, the figures rose by 10%. The highest accuracy after fusion was 92.5% (Tab. 2). Accuracy was further improved by selection (Tab. 3 and Figs. 5 and 6). We analyzed the utility of selection by calculating standard errors of the mean (SEMs) (Tab. 4) for the ELM and the other three top classifiers. The minimum accuracy of ELM after 100 iterations was 92.76% and the highest accuracy 93.90%; the SEM was 0.4040. Thus, a minor change occurred after execution. The error bars (Fig. 7) are based on the SEMs and confidence levels; the scheme is scalable.
Table 4: Analysis of proposed selection features based prediction accuracy on ELM and three other top classifiers


Figure 7: Confidence interval of ELM after best features selection using improved GA
It is clear that fusion of multi-type features is valuable. This increases the number of predictors and enhances predictive accuracy. However, a few irrelevant features were added; if these are removed, accuracy is not compromised. Removal was effected via feature selection. We used an improved GA and an ELM to select the best features and improve predictive accuracy. In future work, we will seek a more efficient feature selection algorithm to improve accuracy further. Moreover, we will seek to build a larger image dataset that we will use to train a CNN.
Funding Statement: This research was supported by Korea Institute for Advancement of Technology (KIAT) grant funded by the Korea Government (MOTIE) (P0012724, The Competency Development Program for Industry Specialist) and the Soonchunhyang University Research Fund.
Conflicts of Interest: The authors declare that they have no conflicts of interest to report regarding the present study.
1. N. Zhu, D. Zhang, W. Wang, X. Li, B. Yang et al. (2020). , “A novel coronavirus from patients with pneumonia in China,” 2019 New England Journal of Medicine, vol. 328, no. 8, pp. 727–723. [Google Scholar]
2. A. E. Gorbalenya, S. C. Baker, R. Baric, R. J. d. Groot, C. Drosten et al. (2020). , “Severe acute respiratory syndrome-related coronavirus: The species and its viruses-a statement of the Coronavirus Study Group,”. [Google Scholar]
3. K. Roosa, Y. Lee, R. Luo, A. Kirpich, R. Rothenberg et al. (2020). , “Real-time forecasts of the COVID-19 epidemic in China from february 5th to february 24th,” 2020 Infectious Disease Modelling, vol. 5, no. 5, pp. 256–263. [Google Scholar]
4. C. Sohrabi, Z. Alsafi, N. O’Neill, M. Khan, A. Kerwan et al. (2020). , “World health organization declares global emergency: A review of the 2019 novel coronavirus (COVID-19),” International Journal of Surgery, vol. 76, pp. 71–76. [Google Scholar]
5. S. B. Stoecklin, P. Rolland, Y. Silue, A. Mailles, C. Campese et al. (2020). , “First cases of coronavirus disease 2019 (COVID-19) in France: Surveillance, investigations and control measures, January 2020,” Eurosurveillance, vol. 25, pp. 2000094. [Google Scholar]
6. W. Wang, J. Tang and F. Wei. (2020). “Updated understanding of the outbreak of 2019 novel coronavirus (2019-nCoV) in Wuhan,” China Journal of Medical Virology, vol. 92, no. 4, pp. 441–447. [Google Scholar]
7. L. Brunese, F. Mercaldo, A. Reginelli and A. Santone. (2020). “Explainable deep learning for pulmonary disease and coronavirus COVID-19 detection from X-rays,” Computer Methods and Programs in Biomedicine, vol. 196, no. 20, pp. 105608. [Google Scholar]
8. D. Dansana, R. Kumar, A. Bhattacharjee, D. J. Hemanth, D. Gupta et al. (2020). , “Early diagnosis of COVID-19-affected patients based on X-ray and computed tomography images using deep learning algorithm,” Soft Computing, vol. 5, pp. 1–9. [Google Scholar]
9. A. Ulhaq, J. Born, A. Khan, D. P. S. Gomes, S. Chakraborty et al. (2020). , “Covid-19 control by computer vision approaches: A survey,” IEEE Access, vol. 8, pp. 179437–179456. [Google Scholar]
10. A. Gupta, S. Gupta and R. Katarya. (2020). “InstaCovNet-19: A deep learning classification model for the detection of COVID-19 patients using Chest X-ray,” Applied Soft Computing, vol. 4, pp. 106859. [Google Scholar]
11. M. A. Khan, M. S. Sarfraz, M. Alhaisoni, A. A. Albesher, S. Wang et al. (2020). , “StomachNet: Optimal deep learning features fusion for stomach abnormalities classification,” IEEE Access, vol. 8, pp. 197969– 197981. [Google Scholar]
12. M. A. Khan, S. Rubab, A. Kashif, M. I. Sharif, N. Muhammad et al. (2020). , “Lungs cancer classification from CT images: An integrated design of contrast based classical features fusion and selection,” Pattern Recognition Letters, vol. 129, pp. 77–85. [Google Scholar]
13. M. A. Khan, I. Ashraf, M. Alhaisoni, R. Damaševičius, R. Scherer et al. (2020). , “Multimodal brain tumor classification using deep learning and robust feature selection: A machine learning application for radiologists,” Diagnostics, vol. 10, no. 8, pp. 565. [Google Scholar]
14. L. Lan, C. Ye, C. Wang and S. Zhou. (2019). “Deep convolutional neural networks for WCE abnormality detection: CNN architecture, region proposal and transfer learning,” IEEE Access, vol. 7, pp. 30017–30032. [Google Scholar]
15. V. Murugappan and R. Sabeenian. (2019). “Texture based medical image classification by using multi-scale gabor rotation-invariant local binary pattern (MGRLBP),” Cluster Computing, vol. 22, no. S5, pp. 10979–10992. [Google Scholar]
16. M. Sharif, M. Attique Khan, M. Rashid, M. Yasmin, F. Afza et al. (2019). , “Deep CNN and geometric features-based gastrointestinal tract diseases detection and classification from wireless capsule endoscopy images,” Journal of Experimental & Theoretical Artificial Intelligence, vol. 3, pp. 1–23. [Google Scholar]
17. A. Mahbod, G. Schaefer, I. Ellinger, R. Ecker, A. Pitiot et al. (2019). , “Fusing fine-tuned deep features for skin lesion classification,” Computerized Medical Imaging and Graphics, vol. 71, no. 4, pp. 19–29. [Google Scholar]
18. M. A. Khan, M. A. Khan, F. Ahmed, M. Mittal, L. M. Goyal et al. (2020). , “Gastrointestinal diseases segmentation and classification based on duo-deep architectures,” Pattern Recognition Letters, vol. 131, pp. 193–204. [Google Scholar]
19. M. I. Sharif, J. P. Li, M. A. Khan and M. A. Saleem. (2020). “Active deep neural network features selection for segmentation and recognition of brain tumors using MRI images,” Pattern Recognition Letters, vol. 129, no. 10, pp. 181–189. [Google Scholar]
20. M. A. Khan, T. Akram, M. Sharif, A. Shahzad, K. Aurangzeb et al. (2018). , “An implementation of normal distribution based segmentation and entropy controlled features selection for skin lesion detection and classification,” BMC Cancer, vol. 18, no. 1, pp. 638. [Google Scholar]
21. A. Majid, M. A. Khan, M. Yasmin, A. Rehman, A. Yousafzai et al. (2020). , “Classification of stomach infections: A paradigm of convolutional neural network along with classical features fusion and selection,” Microscopy Research and Technique, vol. 83, no. 5, pp. 562–576. [Google Scholar]
22. M. A. Khan, M. I. Sharif, M. Raza, A. Anjum, T. Saba et al. (2019). , “Skin lesion segmentation and classification: A unified framework of deep neural network features fusion and selection,” Expert Systems, vol. 3, pp. e12497. [Google Scholar]
23. I. D. Apostolopoulos and T. A. Mpesiana. (2020). “Covid-19: Automatic detection from x-ray images utilizing transfer learning with convolutional neural networks,” Physical and Engineering Sciences in Medicine, vol. 43, no. 2, pp. 1. [Google Scholar]
24. A. G. Howard, M. Zhu, B. Chen, D. Kalenichenko, W. Wang et al. (2017). , “Mobilenets: Efficient convolutional neural networks for mobile vision applications,” arXiv preprint arXiv: 1704.04861. [Google Scholar]
25. L. Li, L. Qin, Z. Xu, Y. Yin, X. Wang et al. (2020). , “Artificial intelligence distinguishes COVID-19 from community acquired pneumonia on chest CT,” Radiology, vol. 296, no. 2. [Google Scholar]
26. F. Shan, Y. Gao, J. Wang, W. Shi, N. Shi et al. (2020). , “Lung infection quantification of covid-19 in ct images with deep learning,” arXiv preprint arXiv: 2003.04655. [Google Scholar]
27. N. Tsiknakis, E. Trivizakis, E. E. Vassalou, G. Z. Papadakis, D. A. Spandidos et al. (2020). , “Interpretable artificial intelligence framework for COVID-19 screening on chest X-rays,” Experimental and Therapeutic Medicine, vol. 20, no. 2, pp. 727–735. [Google Scholar]
28. A. Narin, C. Kaya and Z. Pamuk. (2020). “Automatic detection of coronavirus disease (covid-19) using X-ray images and deep convolutional neural networks,” arXiv preprint arXiv: 2003.10849. [Google Scholar]
29. E. E. D. Hemdan, M. A. Shouman and M. E. Karar. (2020). “Covidx-net: A framework of deep learning classifiers to diagnose covid-19 in x-ray images,” arXiv preprint arXiv: 2003.11055. [Google Scholar]
30. V. Rajinikanth, S. Kadry, K. P. Thanaraj, K. Kamalanand and S. Seo. (2020). “Firefly-algorithm aupported scheme to detect COVID-19 lesion in lung CT scan images using shannon entropy and markov-random-field,” arXiv preprint arXiv: 2004.09239. [Google Scholar]
31. S. Wang, B. Kang, J. Ma, X. Zeng, M. Xiao et al. (2020). , “A deep learning algorithm using CT images to screen for Corona Virus Disease (COVID-19),” MedRxiv, vol. 57, no. 7, pp. 1451. [Google Scholar]
32. A. Jaiswal, N. Gianchandani, D. Singh, V. Kumar and M. Kaur. (2020). “Classification of the COVID-19 infected patients using DenseNet201 based deep transfer learning,” Journal of Biomolecular Structure and Dynamics, pp. 1–8. [Google Scholar]
33. W. M. Shaban, A. H. Rabie, A. I. Saleh and M. Abo-Elsoud. (2020). “A new COVID-19 patients detection strategy (CPDS) based on hybrid feature selection and enhanced KNN classifier,” Knowledge-Based Systems, vol. 205, no. 1, pp. 106270. [Google Scholar]
34. W. M. Shaban, A. H. Rabie, A. I. Saleh and M. Abo-Elsoud. (2020). “Detecting COVID-19 patients based on fuzzy inference engine and deep neural network,” Applied Soft Computing, vol. 99, no. 1, pp. 106906. [Google Scholar]
35. M. J. Horry, S. Chakraborty, M. Paul, A. Ulhaq, B. Pradhan et al. (2020). , “COVID-19 detection through transfer learning using multimodal imaging data,” IEEE Access, vol. 8, pp. 149808–149824. [Google Scholar]
36. M. F. Aslan, M. F. Unlersen, K. Sabanci and A. Durdu. (2020). “CNN-based transfer learning-BiLSTM network: A novel approach for COVID-19 infection detection,” Applied Soft Computing, vol. 98, no. 1, pp. 106912. [Google Scholar]
37. A. Rehman, M. A. Khan, Z. Mehmood, T. Saba, M. Sardaraz et al. (2020). , “Microscopic melanoma detection and classification: A framework of pixel-based fusion and multilevel features reduction,” Microscopy Research and Technique, vol. 83, no. 4, pp. 410–423. [Google Scholar]
38. T. Ojala, M. Pietikainen and T. Maenpaa. (2002). “Multiresolution gray-scale and rotation invariant texture classification with local binary patterns,” IEEE Transactions on Pattern Analysis and Machine Intelligence, vol. 24, no. 7, pp. 971–987. [Google Scholar]
39. T. Tuncer, E. Aydemir and S. Dogan. (2020). “Automated ambient recognition method based on dynamic center mirror local binary pattern: DCMLBP,” Applied Acoustics, vol. 161, pp. 107165. [Google Scholar]
40. A. F. Costa, G. Humpire-Mamani and A. J. M. Traina. (2012). “An efficient algorithm for fractal analysis of textures,” in 2012 25th SIBGRAPI Conf. on Graphics, Patterns and Images, Ouro Preto, Brazil, pp. 39–46. [Google Scholar]
41. D. R. Nayak, R. Dash and B. Majhi. (2016). “Brain MR image classification using two-dimensional discrete wavelet transform and AdaBoost with random forests,” Neurocomputing, vol. 177, no. 8, pp. 188–197. [Google Scholar]
42. Q.-S. Sun, S.-G. Zeng, Y. Liu, P.-A. Heng and D.-S. Xia. (2005). “A new method of feature fusion and its application in image recognition,” Pattern Recognition, vol. 38, no. 12, pp. 2437–2448. [Google Scholar]
43. H. Dai, J. Cao, T. Wang, M. Deng and Z. Yang. (2019). “Multilayer one-class extreme learning machine,” Neural Networks, vol. 115, no. 12, pp. 11–22. [Google Scholar]
 | This work is licensed under a Creative Commons Attribution 4.0 International License, which permits unrestricted use, distribution, and reproduction in any medium, provided the original work is properly cited. |