DOI:10.32604/cmc.2021.015590
| Computers, Materials & Continua DOI:10.32604/cmc.2021.015590 | |
| Article |
Colouring of COVID-19 Affected Region Based on Fuzzy Directed Graphs
1Department of Applied Mathematics with Oceanology and Computer Programming, Vidyasagar University, Midnapore, 721102, India
2Department of Mathematics, Tamralipta Mahavidyalaya, Tamluk, 721636, India
3Division of Applied Mathematics, Wonkwang University, Iksan-Si, Jeonbuk, 54538, Korea
4School of Engineering, RMIT University, Melbourne, 3001, Australia
5School of Computer Science, University of Sydney Sydney, 2006, Australia
6Department of Computer Science & Engineering, Birla Institute of Applied Sciences (BIAS), Bhimtal, Uttarakhand, 263136, India
*Corresponding Author: Jeong-Gon Lee. Email: jukolee@wku.ac.kr
Received: 29 November 2020; Accepted: 08 February 2021
Abstract: Graph colouring is the system of assigning a colour to each vertex of a graph. It is done in such a way that adjacent vertices do not have equal colour. It is fundamental in graph theory. It is often used to solve real-world problems like traffic light signalling, map colouring, scheduling, etc. Nowadays, social networks are prevalent systems in our life. Here, the users are considered as vertices, and their connections/interactions are taken as edges. Some users follow other popular users’ profiles in these networks, and some don’t, but those non-followers are connected directly to the popular profiles. That means, along with traditional relationship (information flowing), there is another relation among them. It depends on the domination of the relationship between the nodes. This type of situation can be modelled as a directed fuzzy graph. In the colouring of fuzzy graph theory, edge membership plays a vital role. Edge membership is a representation of flowing information between end nodes of the edge. Apart from the communication relationship, there may be some other factors like domination in relation. This influence of power is captured here. In this article, the colouring of directed fuzzy graphs is defined based on the influence of relationship. Along with this, the chromatic number and strong chromatic number are provided, and related properties are investigated. An application regarding COVID-19 infection is presented using the colouring of directed fuzzy graphs.
Keywords: Graph colouring; chromatic index; directed fuzzy graphs
The best way to represent the relations/links among objects is graphs. Edges in crisp graphs represent the linkage between two objects, but edges in fuzzy graphs measure the degree of connectedness by using some membership values varying from [0, 1]. Kaufmann [1] introduced the fuzzy graph in 1973, and Rosenfeld [2] developed it in 1975. Samanta et al. [3,4] proposed various types of fuzzy graphs and its applications. When representing some particular types of social networks, directed graphs are more relevant than undirected graphs. For example, on Twitter, some users are following some selected popular users. Here, users are considered as nodes of graphs. Here, if two users are just connected in the network, there exists an undirected edge. Again, if one user is following another, there exists a directed edge. So, these networks can be designed by a directed graph. Thus both types of edges occur in a graph simultaneously. The measure of influences is captured/calculated only by fuzzy membership values. Today, COVID-19 [5] is the most significant problem in the world. WHO declared COVID-19 outbreak as a world health emergency on 30th January 2020 [6–8]. They first detected this virus in Wuhan, China, in December 2019. After that, this virus spread globally. Within April 2020, almost all the countries were affected by this virus. Here, all the countries are considered as nodes of networks, and there exists a directed edge between two countries if one country is affected by the virus carried from another country. So, we get a directed graph [9]. The amount of influence can also be measured by some membership value. In this study, we are going to introduce a new class of fuzzy graph.
Graph colouring is one of the oldest problems. Samanta et al. [10] introduced fuzzy colouring in fuzzy graphs. Hansen et al. [11] and Sotskov et al. [12] introduced the mixed graph colouring. Mahapatra et al. [13–23] introduced the edge colouring of a fuzzy graph and radio k colouring in fuzzy graphs. In this article, the colouring of directed fuzzy graphs is also proposed.
Definition 1 A fuzzy graph [1]
The effectiveness of an edge (a, b) is defined by
Samanta et al. [10] defined fuzzy colours as the mixing of colours as follows
Definition 2 Let’s assume
Definition 3
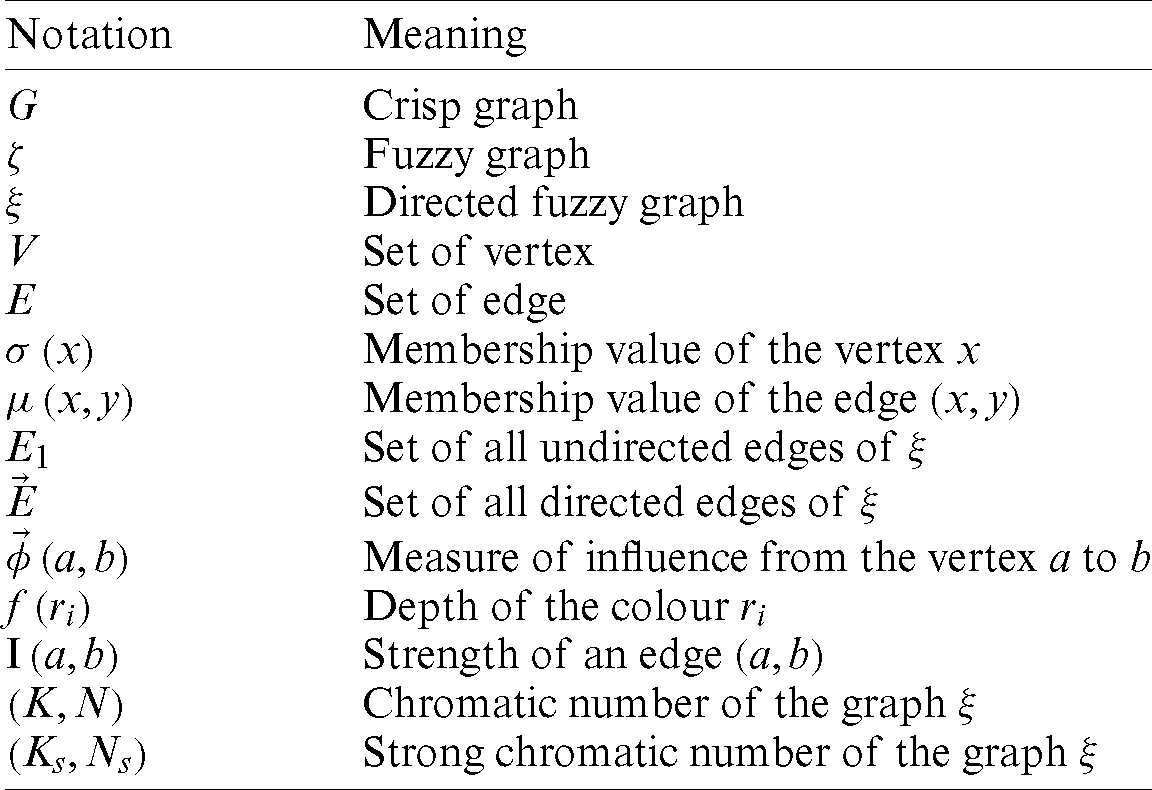
Some basic notations are shown in Tab. 1.
3 Measure of Influence of a Directed Fuzzy Graph
Sometimes two nodes of a network are connected by an edge, and their relationship may not be useful, but the amount of influence is significant. For example, the relationship between a student and a teacher may not always be good. Still, the student is influenced by the teacher. This concept is used here to measure the amount of influence. Now, we are introducing the term “the measure of influence” which can be used to measure the amount of influence between two vertices of a directed fuzzy graph. It can be formally defined In the following way:
Definition 4 Let’s assume V is a non-empty set.
Example 1 Fig. 1, shows a directed fuzzy graph and
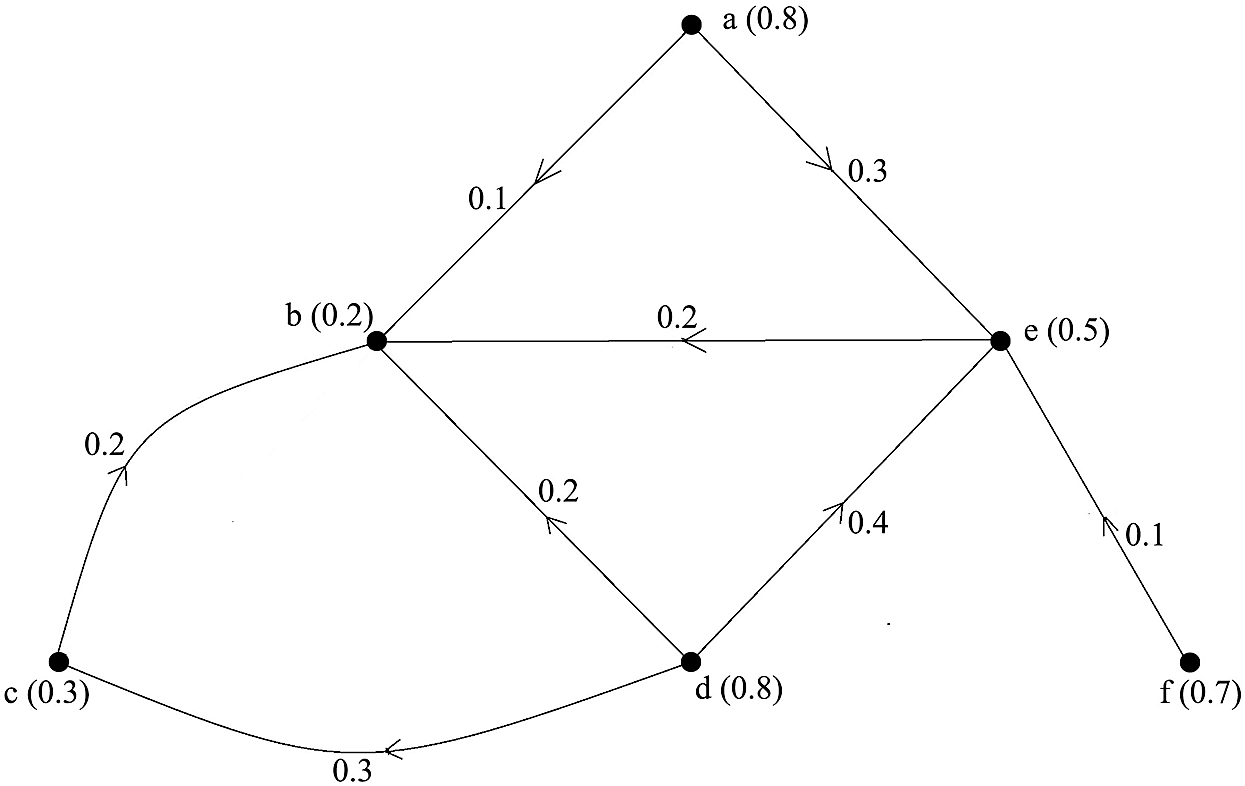
Figure 1: Fuzzy directed graph
Table 2: Vertex membership value of Fig. 1
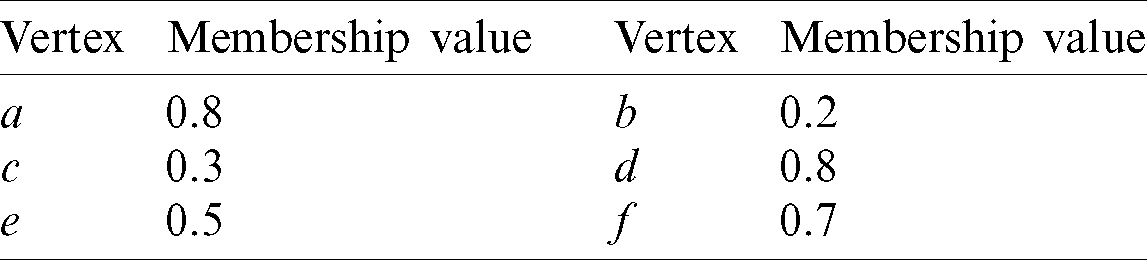
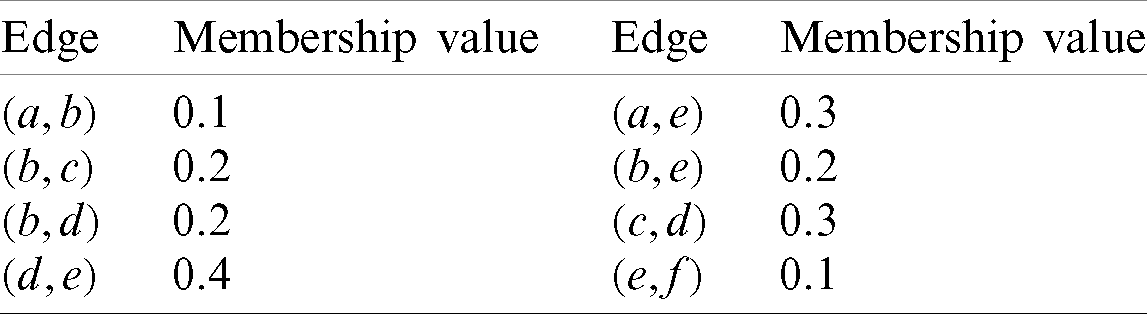
Table 3: Edges membership value of Fig. 1
3.1 Complete Directed Fuzzy Graph
Let’s assume
Fig. 2 shows a complete directed fuzzy graph.
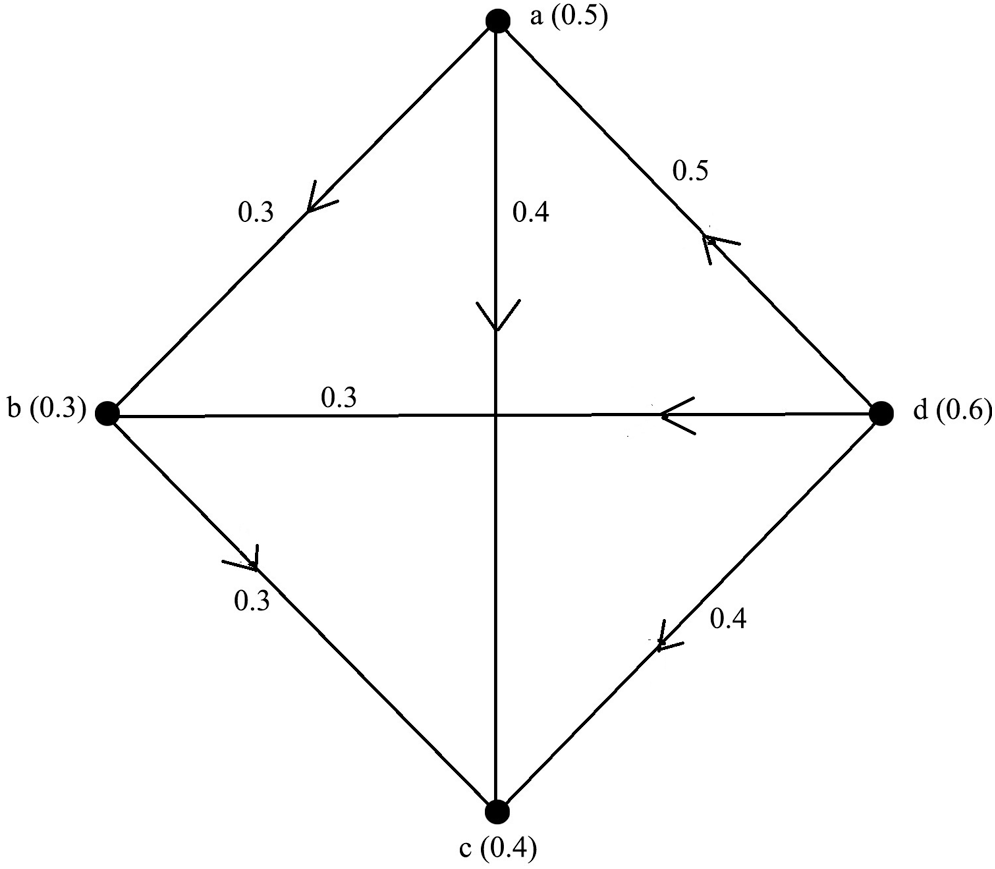
Figure 2: Complete directed fuzzy graph
Lemma 1 Let’s assume
Proof.
Theorem 1 Let’s assume
Proof.
3.2 Colouring of Directed Fuzzy Graph
In crisp graph colouring, two adjacent vertices have to have two different colours. Same colours in two adjacent vertices will create problems. Here, we use fuzzy colour to mark the directed fuzzy graph. Suppose, red, blue, green etc. are considered the basic colours, and (red, 0.6) is the fuzzy colour, where red is the basic colour, and 0.6 is the depth of the colour. Here, we use fuzzy colour to mark the directed fuzzy graph as follows-
Let’s assume
3.3 Chromatic Index of Directed Fuzzy Graph
The minimum number of basic colours needed to colour a directed fuzzy graph is called the chromatic index of a directed fuzzy graph.
Suppose, such minimum number of basic colours is K. Now, this crisp chromatic index is not sufficient to mention the vertex’s nature or weight. Hence, the chromatic index is associated with some weight. So, the chromatic index of a directed fuzzy graph is denoted by (K, N), where K is the number of the basic colours used to colour the directed fuzzy graph, and N is the weight. The weight N is defined by
3.4 Algorithm to Colour the Directed Fuzzy Graph
Input: A directed fuzzy graph
Output: Complete coloured, directed fuzzy graph.
Step 1: All the vertices are labelled as
Step 2: Vertex “1” is assigned a colour (ri, f(ri)), where ri are the basic colour and the f(ri) is the depth of the basic colour. Then,
Step 3: All the directly connected vertices of “1” are labelled as
Step 4: The formula does the calculation of the strength of all directly connected edges with “1”
Step 5: Basic colours, different from what is given to “1”, are alloted to all the adjacent vertices of “1” and whose
Step 6: Steps 3–5 are repeated until all of this directed graph’s vertices have been coloured.
Step 7: Calculation is done for the chromatic index of this directed fuzzy graph (K, N) where K is the number of the basic colours used to mark the directed fuzzy graph, and N is the weight. N is calculated by the formula
Example 2 In Fig. 1 a directed fuzzy graph has been considered, and the vertices membership values are considered in Tab. 2, and the edges membership values are considered in Tab. 3. Also, the amount of influences is considered in Tab. 4. Also, the strength of all edges of this graph is shown in Tab. 5. Now, the coloured directed fuzzy graph of Fig. 1 has been shown in Fig. 3. Here, three basic colours are used to colour this directed fuzzy graph. Also, the strength of all edges is greater than or equal to 0.5 except the edge (e, f) and the influence between the vertex
Table 4: Amount of influence between two vertices of Fig. 1
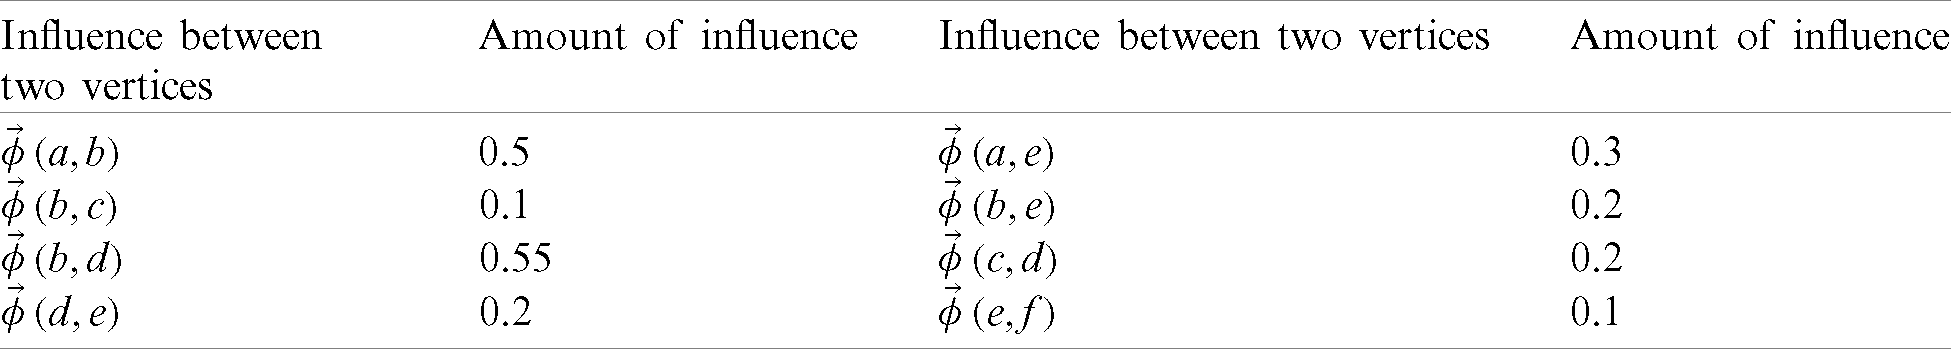
Table 5: Strength of all edges of Fig. 1
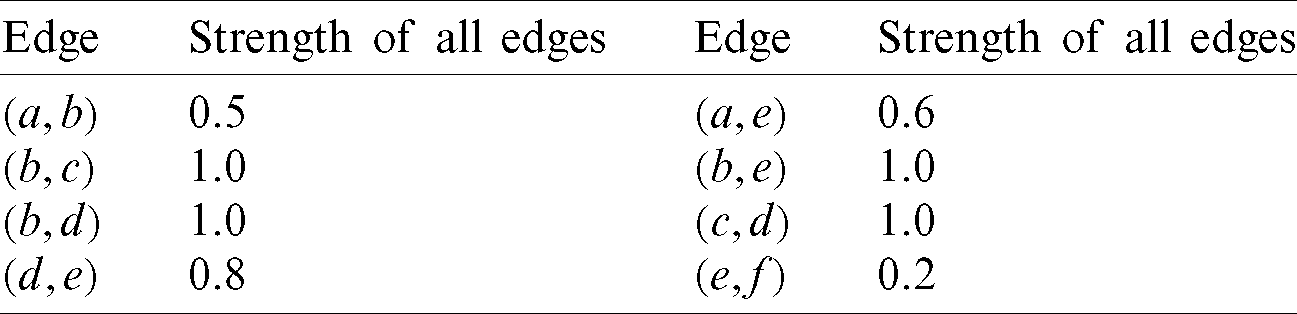
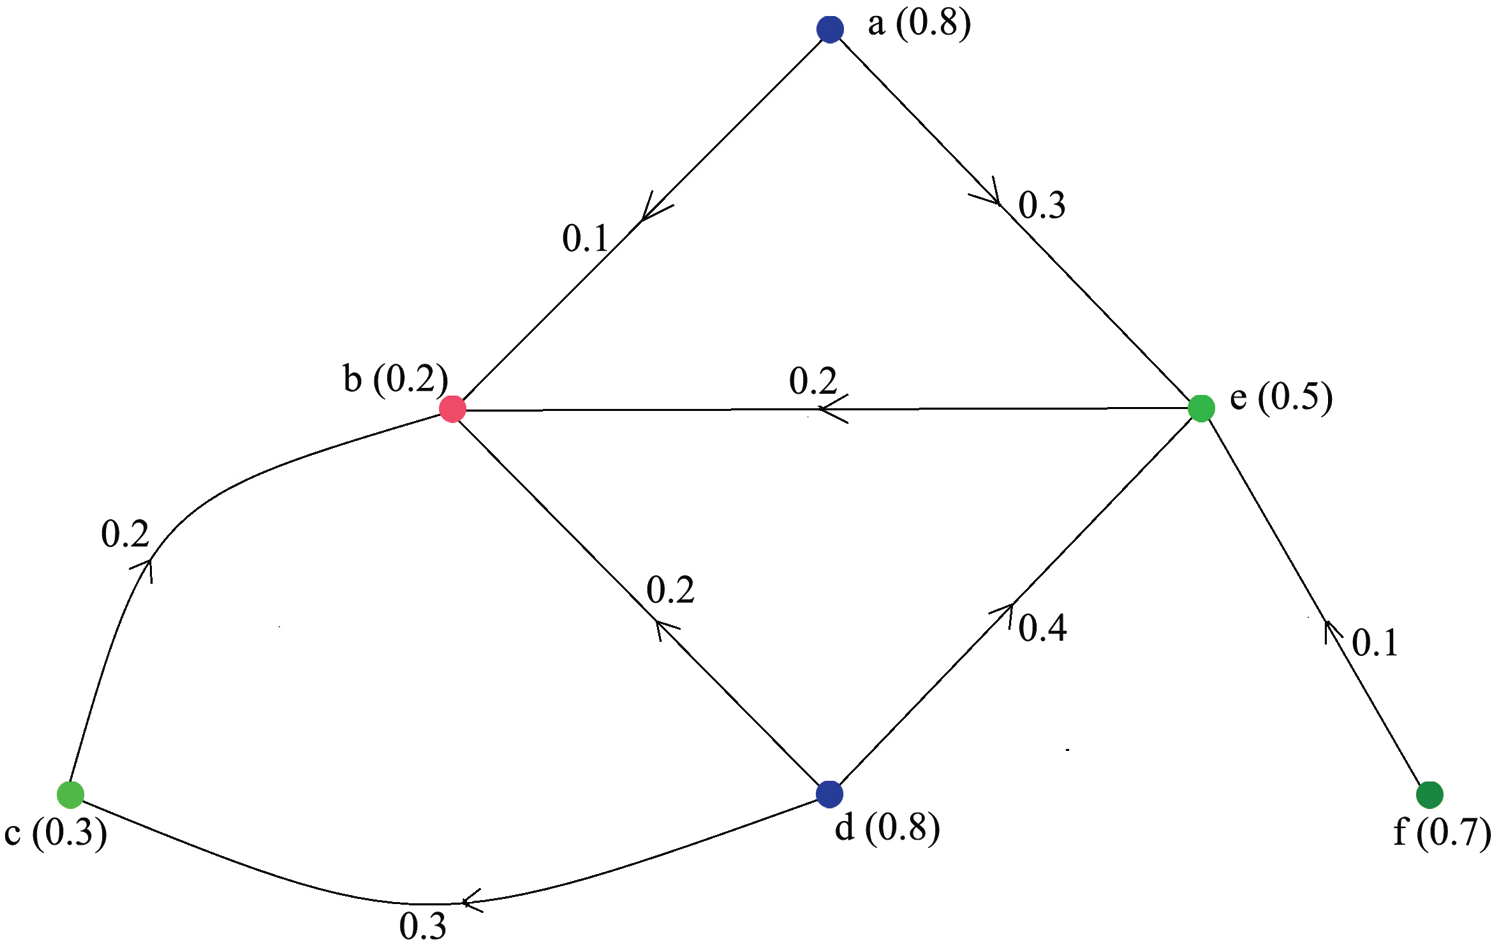
Figure 3: Colouring of directed fuzzy graph
Lemma 3 If the chromatic index of a directed fuzzy graph is (K, N),
Proof. Let’s assume
3.5 Strong Chromatic Index of Directed Fuzzy Graph
Let’s assume
Example 3 A colouring in the directed fuzzy graph has been shown in Fig. 3. Here, the red colour is given in the vertices b with membership values 0.2. The green colour is assigned to the vertices c, e, f with membership value 0.3, 0.5, 0.7 respectively. The blue colour is given to the vertices a, d with membership value 0.8, 0.8 respectively. So, the value of Ks is 2 and the weight Ns = 0.8+0.7 = 1.5. Thus, the strong chromatic index of this directed fuzzy graph is (2, 1.5).
Theorem 3 Let’s assume
Proof. Let’s assume
Again, if some of the basic colours are strong, then K > Ks. Then N is the sum of the maximum membership value of each basic colour and Ns is the sum of all the maximum membership values of all strong basic colours. So, in this case, N > Ns.
Lastly, none of the basic colours is strong. So, it is obvious that Ks = 0 and K > Ks. Also, Ns = 0 and N > Ns. So from these three cases, it is concluded that
Lemma 5
Proof. Let’s assume
Theorem 4 Let’s assume
Proof. Let’s assume
So, the minimum value of strong weight is
Lemma 6
Proof. Let’s assume
Hence,
4 Application of Colouring of Directed Fuzzy Graph
Graph colouring and fuzzy graphs have many real-life applications. Today, COVID-19 is a major threat to human lives. So people are conscious of tracking the places where the majority of the COVID-19 infected patients have been found. Many websites are providing live updates about COVID-19. These websites use the tool of the colouring of maps. But they are not maintaining graph colouring techniques. In this section, to capture uncertainty and direction of links of COVID19, the colouring of the directed fuzzy graphs is used to colour such infected regions.
This virus was first detected in Wuhan, China, in December 2019. Since then, it has been spreading globally. Within April 2020, almost all countries were affected by this virus. The transmission is happening due to the inter-links among countries. Here, we have considered a graph of top 10 COVID-19 affected countries. Data are taken from the website (https://www.worldometers.info/coronavirus/) dated 4th April. These countries are assumed as vertices of a directed fuzzy graph. Also, there exists an edge if any two (vertices) countries have been affected by the COVID-19.
In Tab. 6 and Fig. 4, the top ten affected countries and the number of affected patients by COVID-19 have been shown. Here, all countries are considered nodes of the concerned network. There is a directed edge between two countries (vertex) if there is any travel history between them because they are affected by another. So, we get a directed graph and Fig. 5 has shown this directed graph.
Table 6: Top ten affected counties by COVID-19 and no. of cases
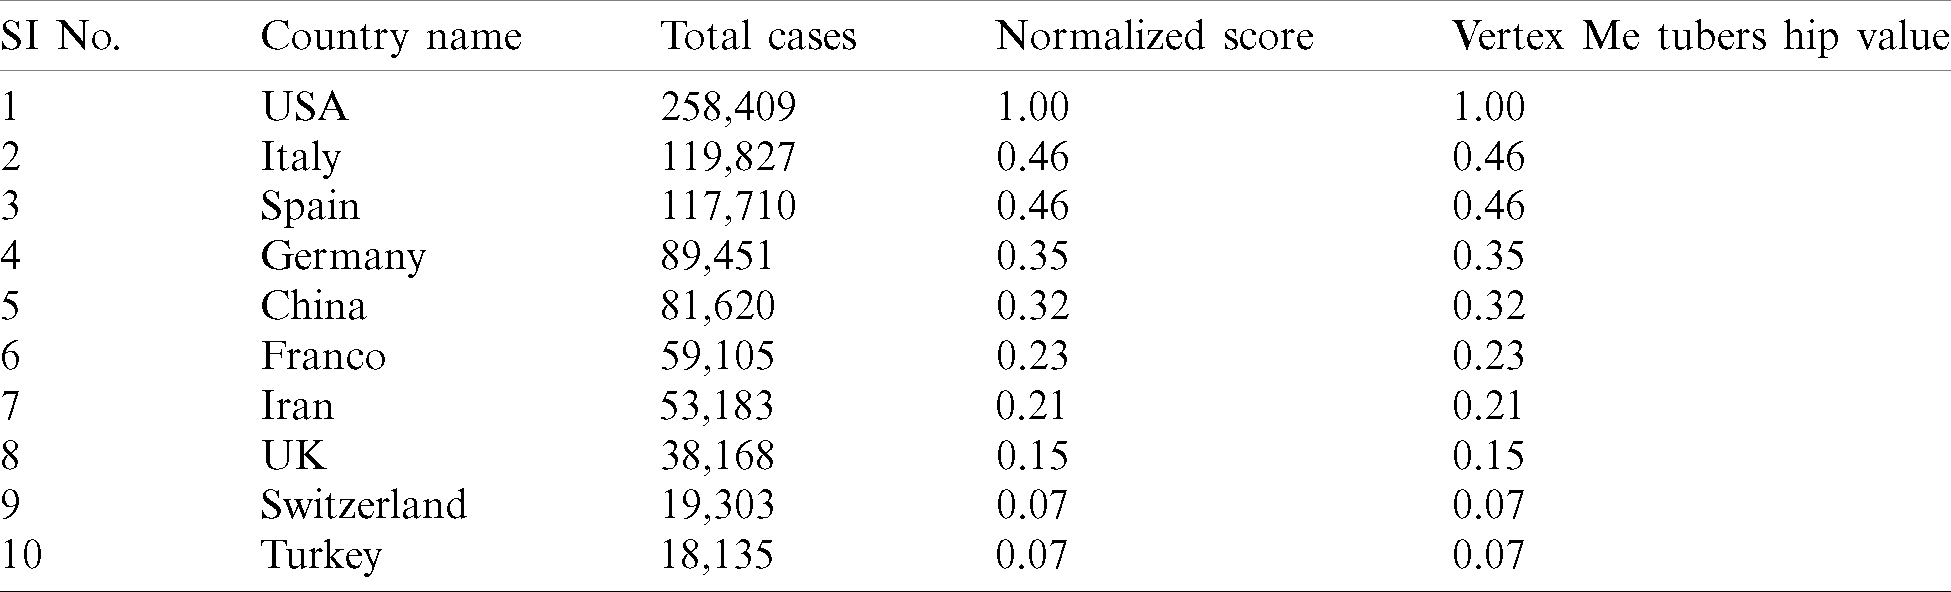
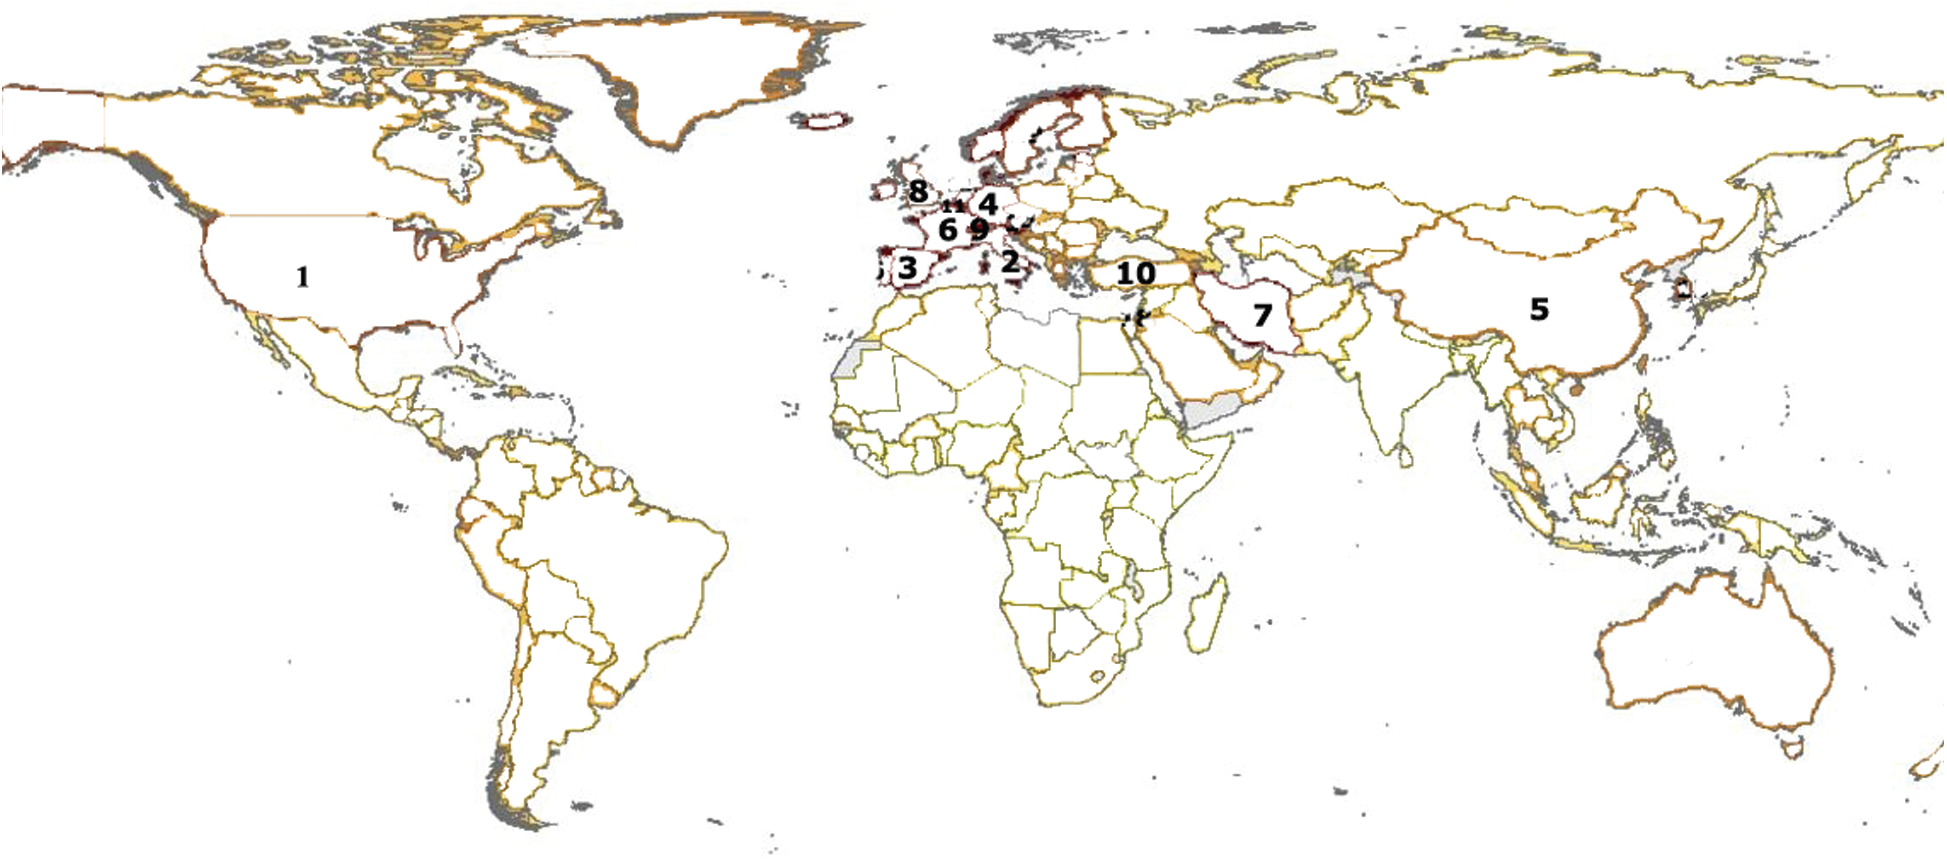
Figure 4: Top ten affected counties in a world map
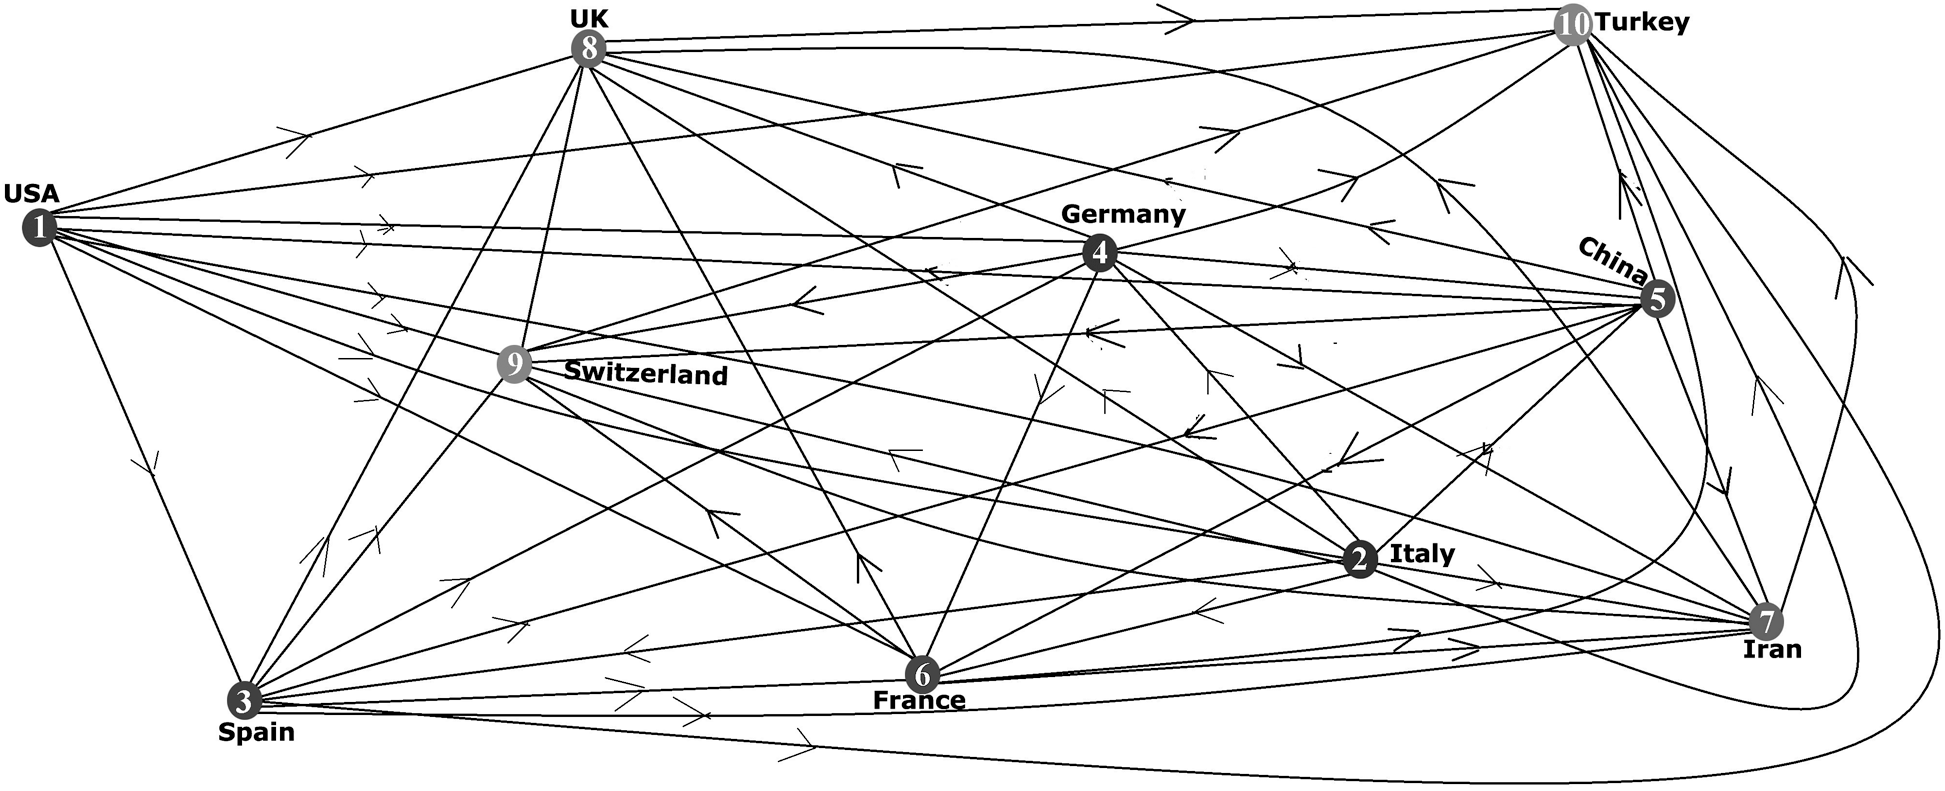
Figure 5: Directed graph of top ten affected counties by COVID-19
The normalized score is considered as a vertex membership value, and Tab. 6 has shown it. Tab. 7 has shown the travel history between the two countries last year. Here, the edge membership value of an edge = “normalized score of travel history between two counties
Table 7: Travel history between the two countries last year
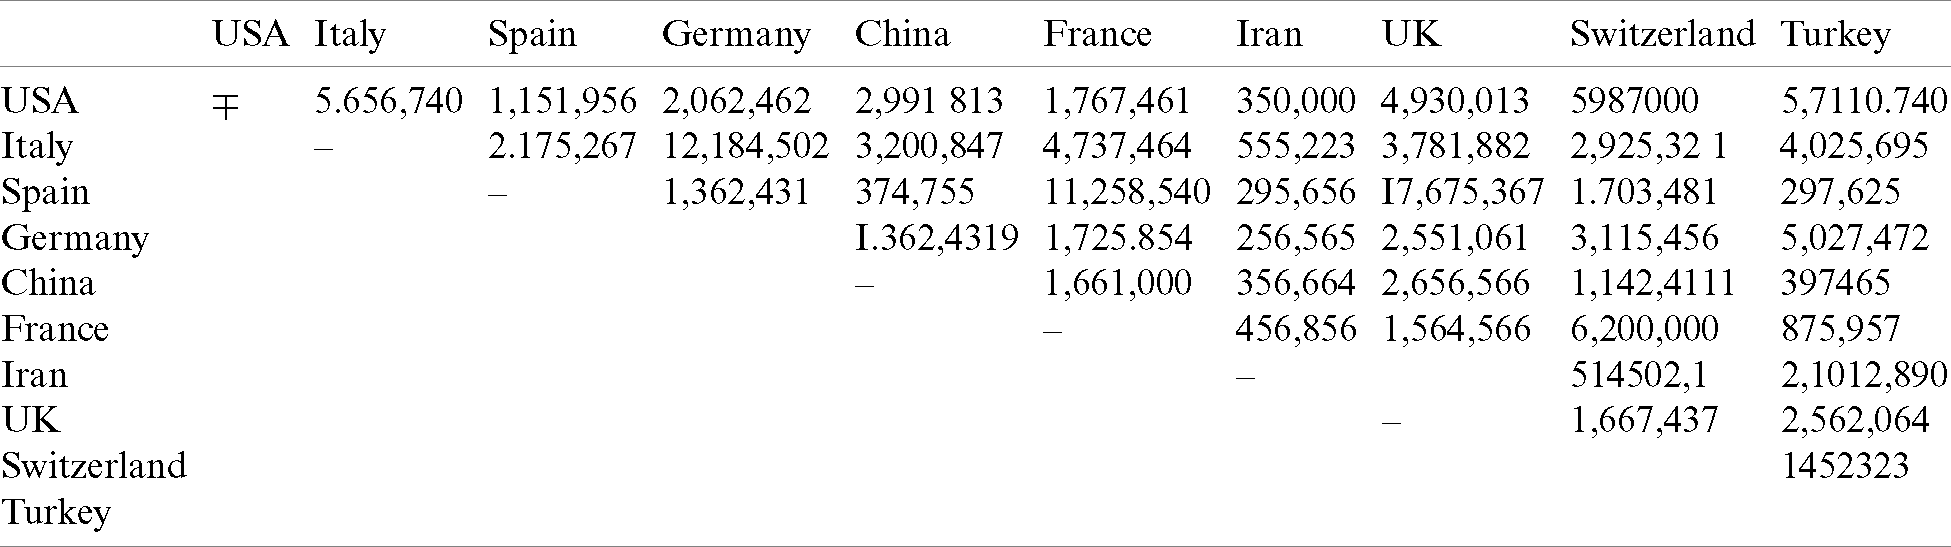
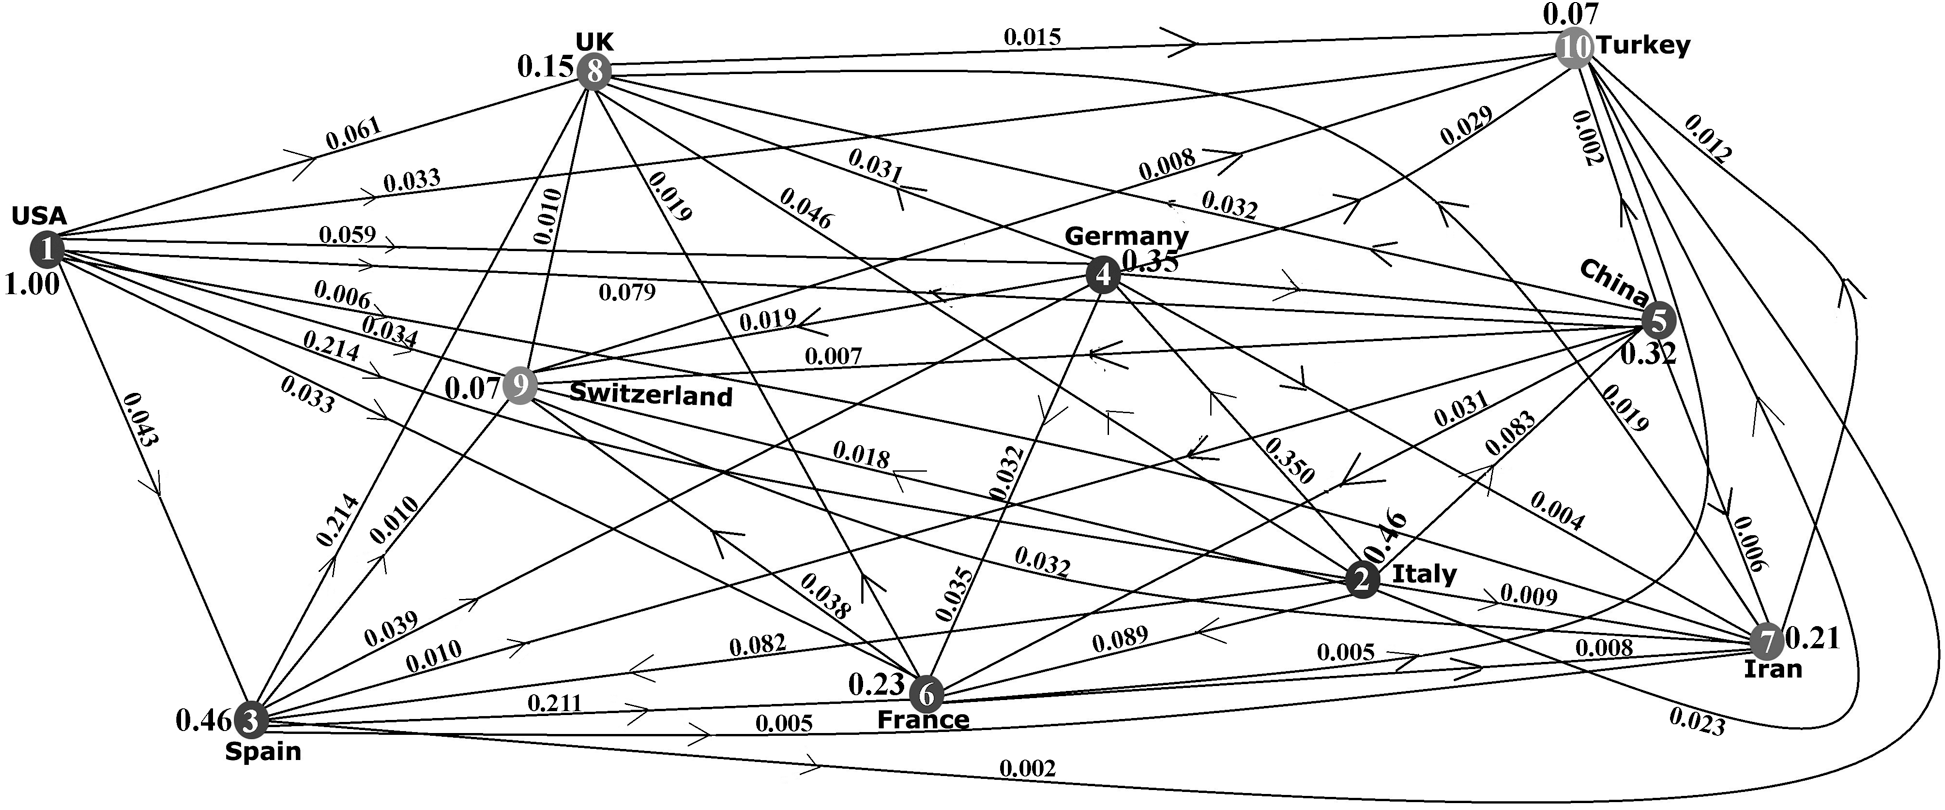
Figure 6: Directed fuzzy graph
Table 8: Measure of influence between the two vertices
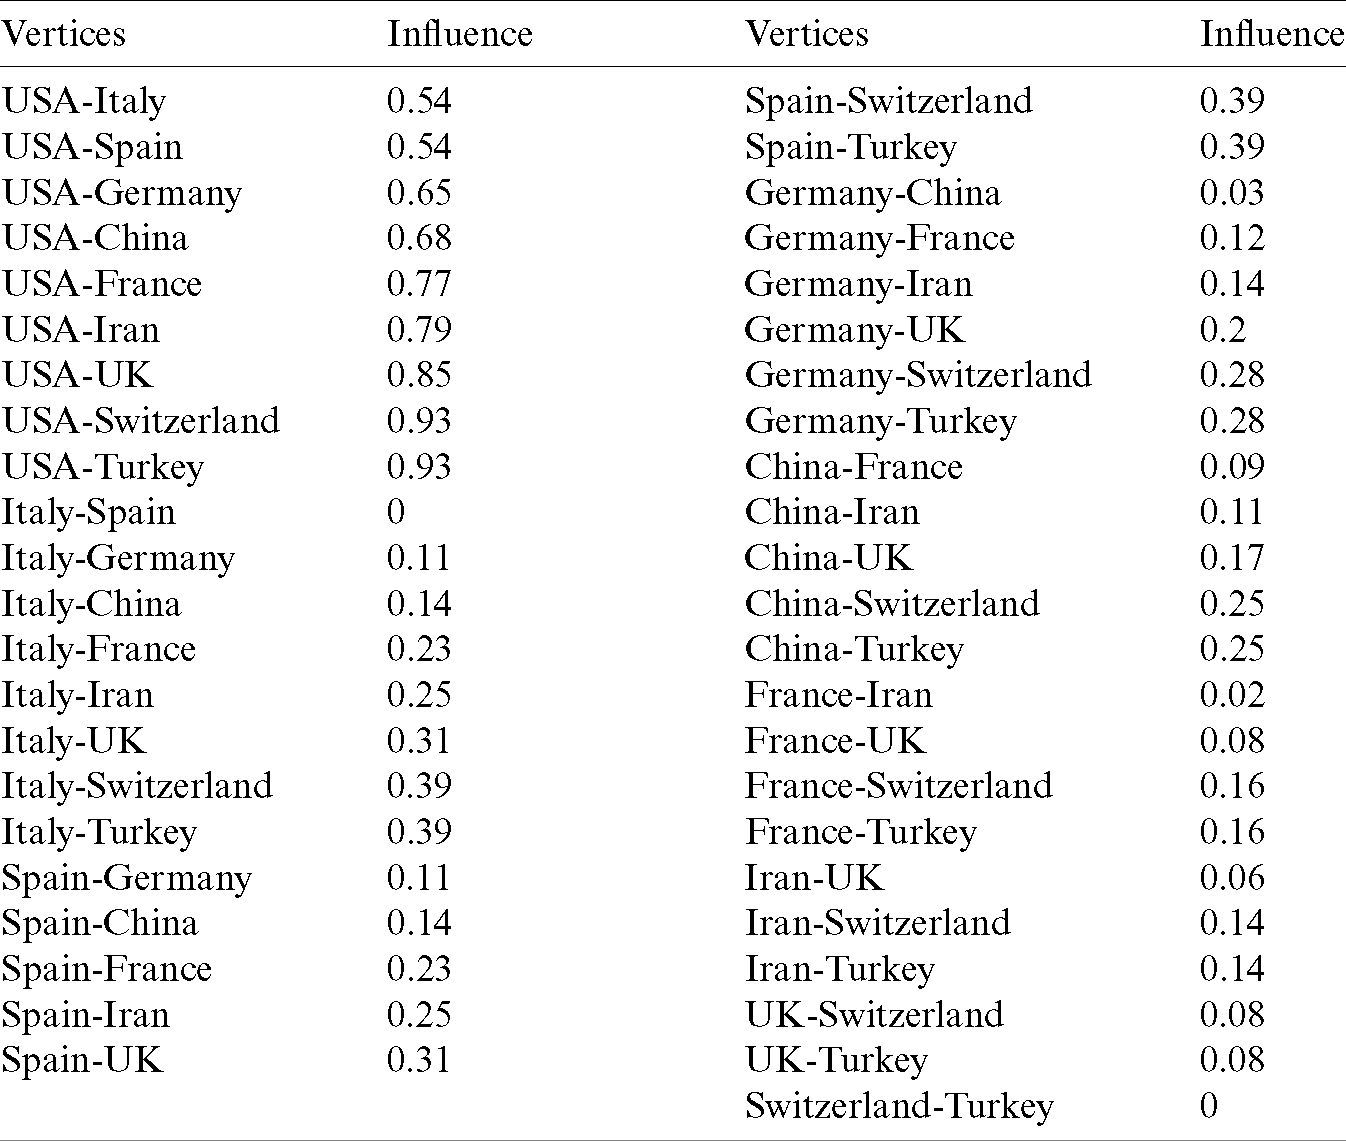
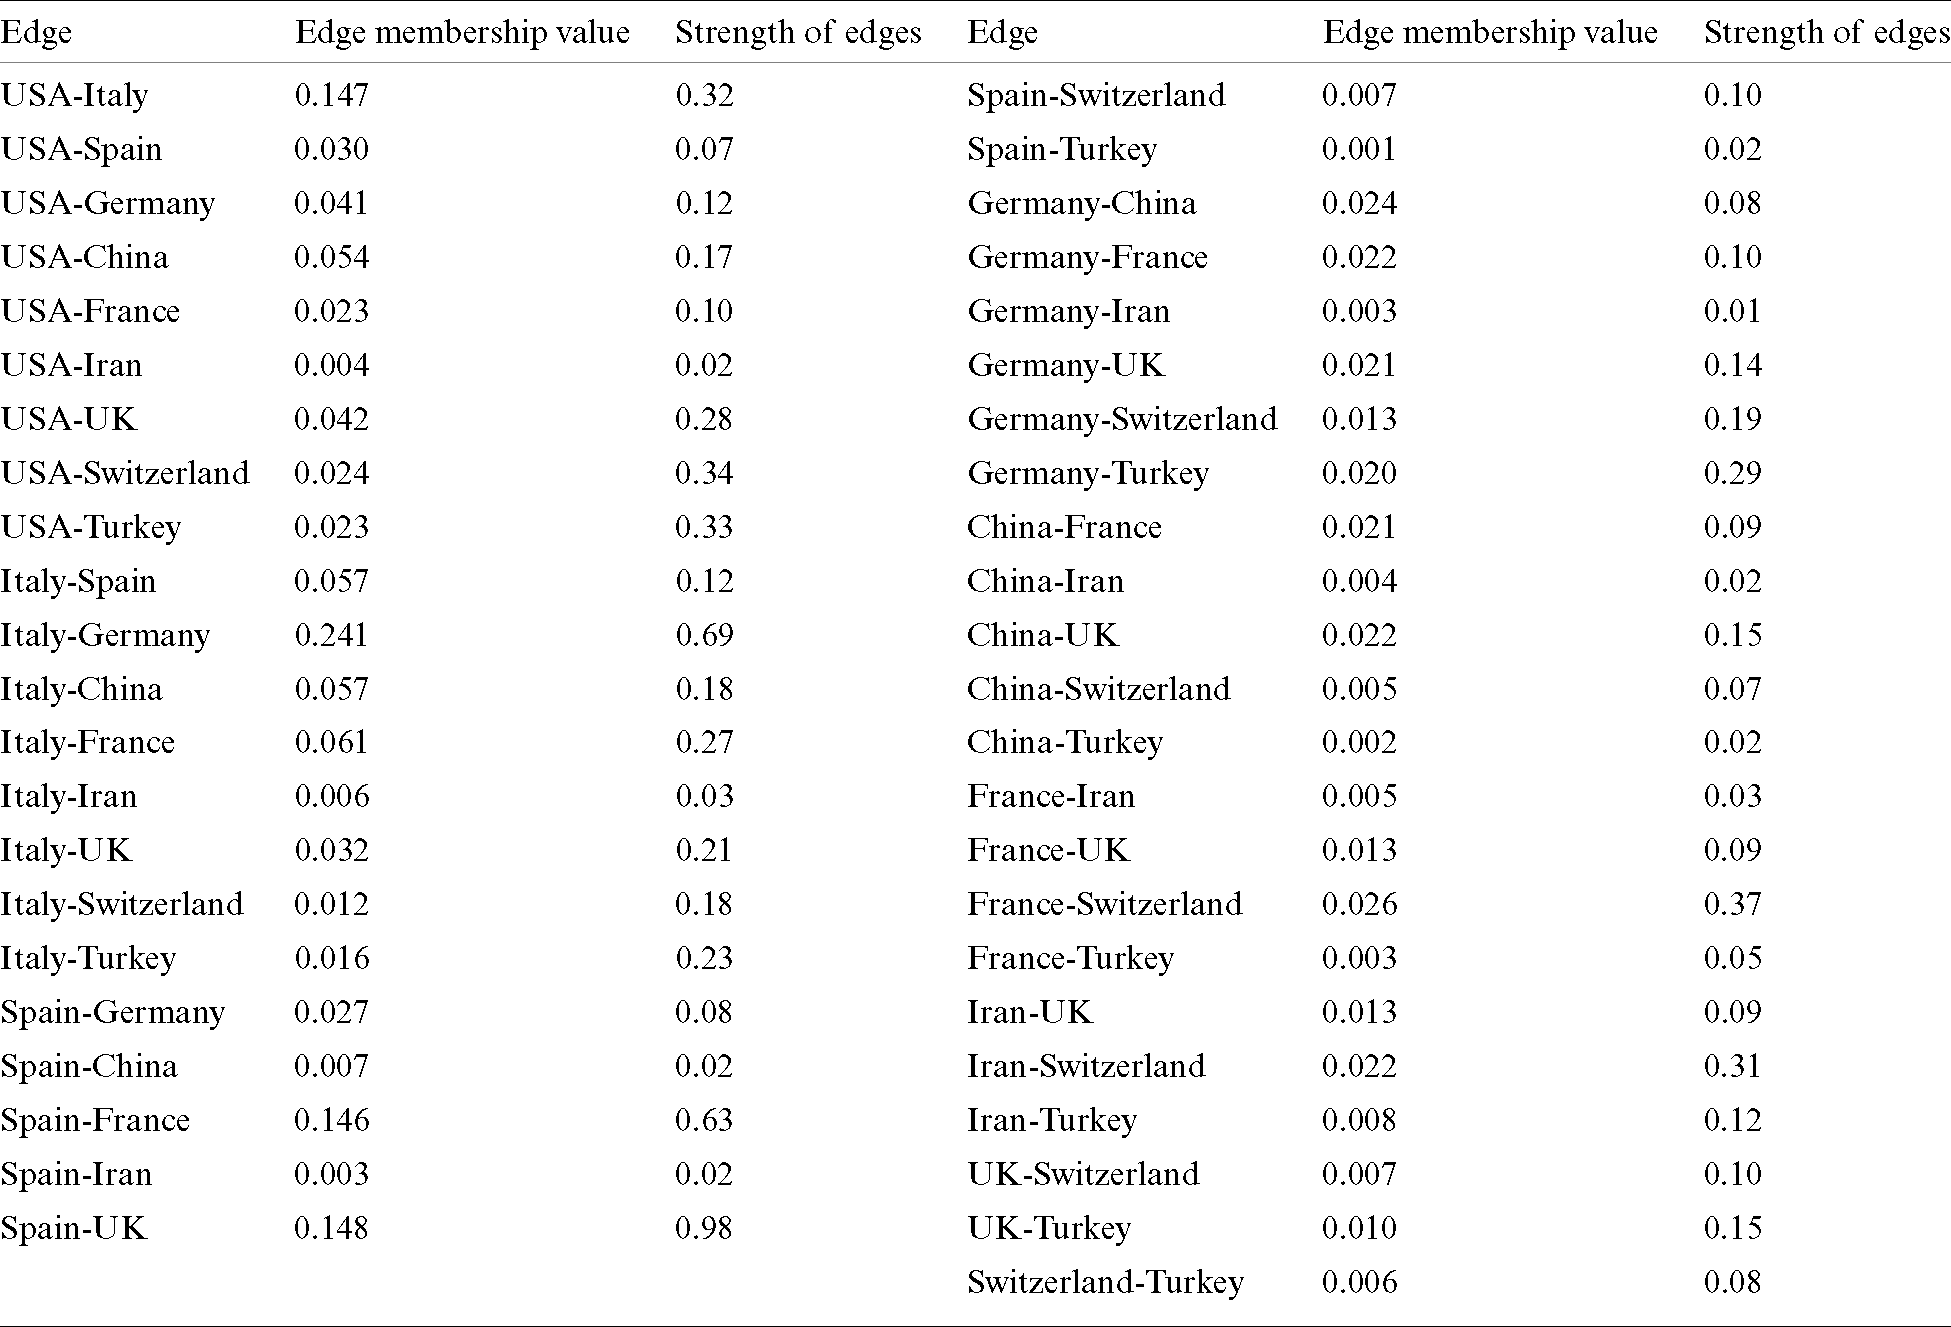
Table 9: Edge membership value of the directed fuzzy graph of Fig. 6
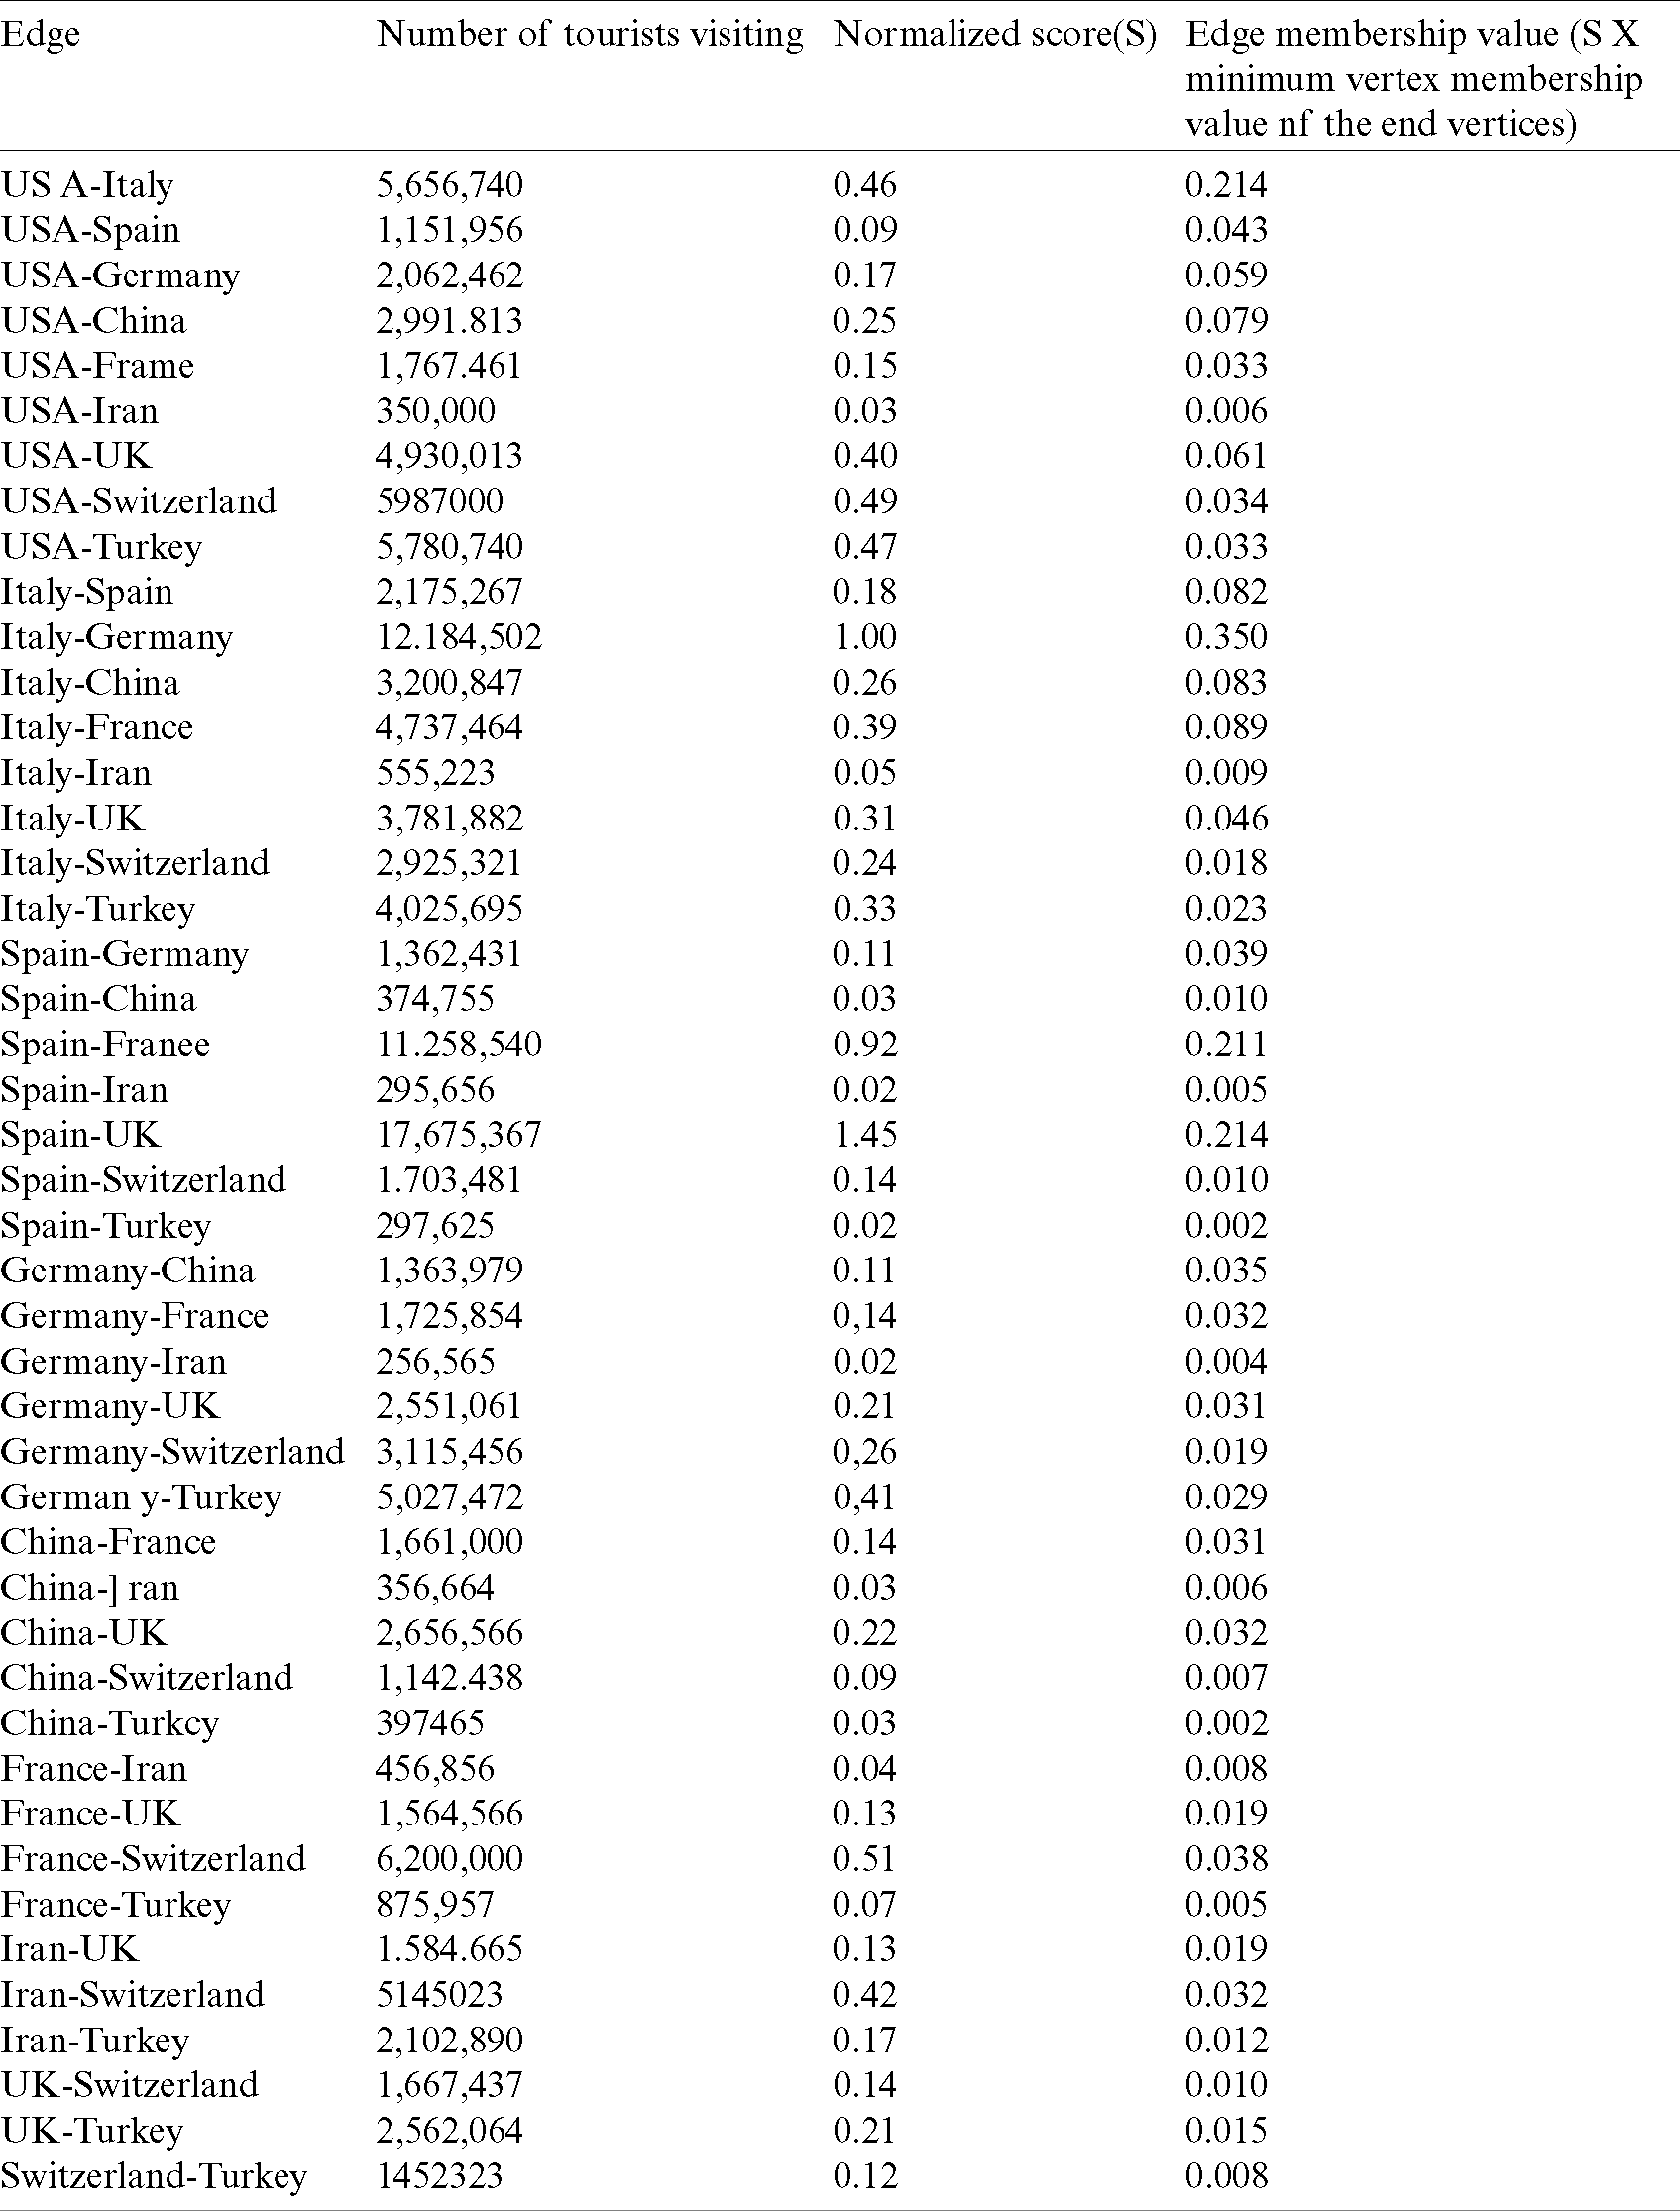
Table 10: Strength of all edges of the directed graph of Fig. 5
Now, two vertices are assigned different basic colours if they are connected by a directed edge whose effectiveness is
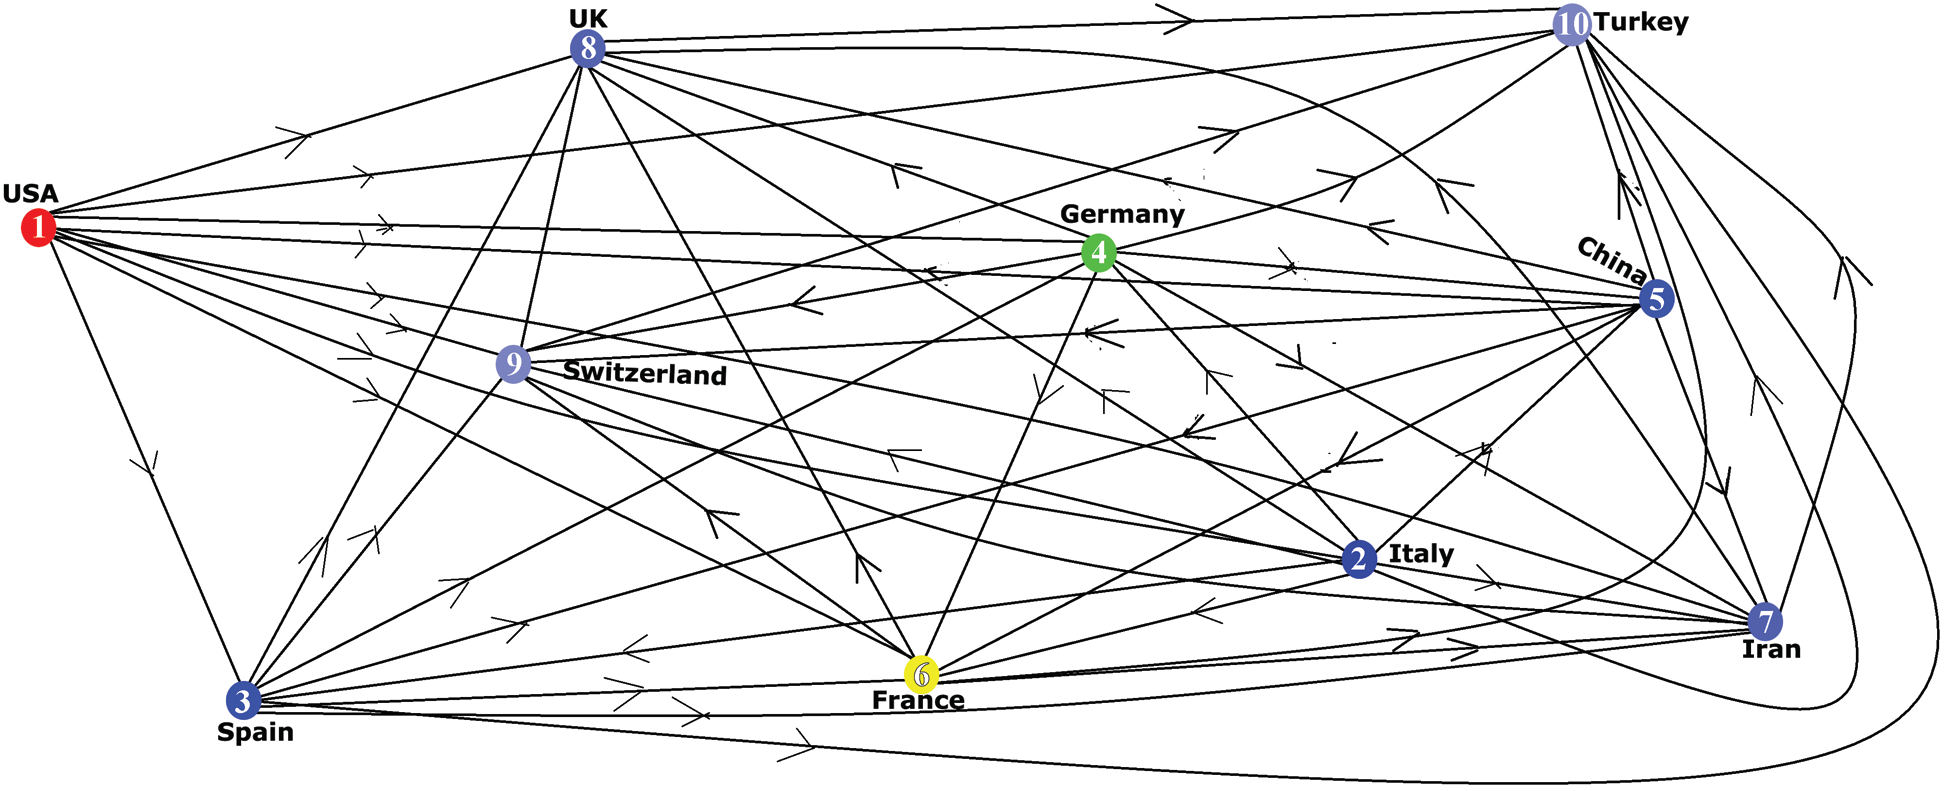
Figure 7: Colouring of the directed fuzzy graph
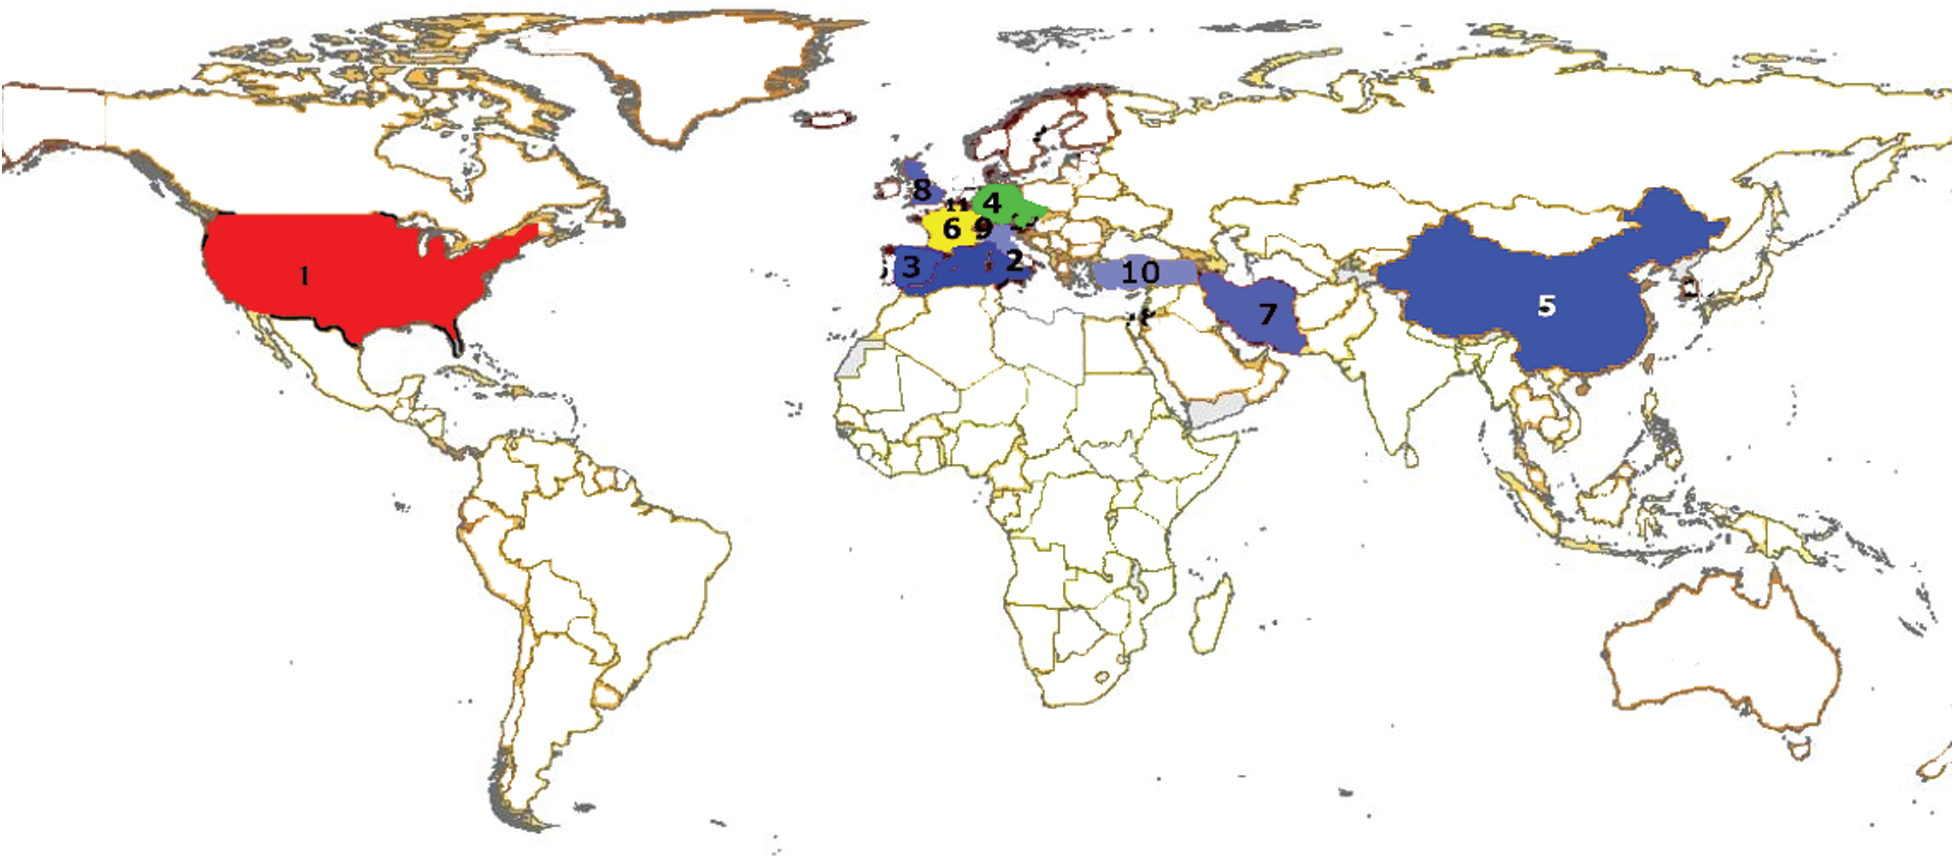
Figure 8: World map colouring using the fuzzy directed fuzzy graph colouring
Fig. 8 shows that four basic colours have been used. In this colouring technique, two nodes are given different colours, if there exists a directed edge between them whose effectiveness is
In this paper, a new technic of a fuzzy graph colouring based on edges’ influence value has been introduced. Moreover, the term, chromatic index and strong chromatic index are defined differently. By this directed graph colouring we have represented this COVID-19 outbreak all over the world. There is one limitation of this study too. The data relating to the travellers who have been wandering across the borders has not been fully detailed.This can be made possible if the data is collected on a larger basis. Due to the limitation of the fund, the collection is not feasible for this study, but capturing the exact figure will be done in the future. Besides, the literature on directed fuzzy graphs will be explored on the basics of this article.
Funding Statement: This research was supported and funded by the Basic Science Research Program through the National Research Foundation of Korea (NRF) funded by the Ministry of Education (2018R1D1A1B07049321).
Conflicts of Interest: The authors unanimously declare that they have no interest in reporting the present study.
1. A. Kauffman. (1973). Introduction a la Theorie des Sous-Emsembles Flous, Paris: Masson et Cie Editeurs. [Google Scholar]
2. A. Rosenfeld. (1975). “Fuzzy graphs,” In: L. A. Zadeh, K. S. Fu, M. Shimura (Eds.) Fuzzy Sets and Their Applications, New York: Academic Press, pp. 77–95. [Google Scholar]
3. S. Samanta. and M. Pal. (2015). “Fuzzy planar graphs,” IEEE Transaction on Fuzzy Systems, vol. 23, no. 6, pp. 1936–1942. [Google Scholar]
4. S. Samanta and M. Pal. (2013). “Fuzzy k-competition graphs and p-competition fuzzy graphs,” Fuzzy Information and Engineering, vol. 5, no. 2, pp. 191–204. [Google Scholar]
5. H. Lu, C. W. Stratton and Y. W. Tang. (2020). “Outbreak of pneumonia of unknown etiology in Wuhan, China: The mystery and the miracle,” Journal of Medical Virology, vol. 92, no. 4, pp. 401–402. [Google Scholar]
6. Q. Li, P. Wu X.Guan, X. Wang and L. Zhou. (2020). “Early transmission dynamics in Wuhan, China, of novel coronavirus–infected pneumonia,” New England Journal of Medicine, vol. 382, no. 13, pp. 1199–1207. [Google Scholar]
7. A. E. Gorbalenya, S. C. Baker, R. S. Baric, R. J. Groot and C. Drosten. (2020). “The species severe acute respiratory syndrome-related coronavirus: Classifying 2019-nCoV and naming it SARS-CoV-2,” Nature Microbiology, vol. 5, no. 4, pp. 536–544. [Google Scholar]
8. N. Chen, X. Dong M.Zhou, J. Qu and F. Gong. (2020). “Epidemiological and clinical characteristics of 99 cases of 2019 novel coronavirus pneumonia in Wuhan, China: A descriptive study,” Lancet, vol. 395, no. 10223, pp. 507–513. [Google Scholar]
9. C. Dalfo. (2019). “A new general family of mixed graphs,” Discrete Applied Mathematics, vol. 269, no. 4, pp. 99–106. [Google Scholar]
10. S. Samanta, T. Pramanik and M. Pal. (2016). “Colouring of fuzzy graphs,” Afrika Matematica, vol. 27, no. 1, 2, pp. 37–50. [Google Scholar]
11. P. Hansen, J. Kuplinsky and D. de Werra. (1997). “Mixed graph colorings,” Mathematical Methods of Operations Research, vol. 45, no. 1, pp. 145–160. [Google Scholar]
12. Y. N. Sotskov, A. Dolgui and F. Werner. (2001). “Mixed graph coloring for unit-time job-shop scheduling,” International Journal of Mathematical Algorithms, vol. 2, pp. 289–323. [Google Scholar]
13. R. Mahapatra, S. Samanta and M. Pal. (2020). “Applications of edge colouring of fuzzy graphs,” Informatica, vol. 31, no. 2, pp. 313–330. [Google Scholar]
14. R. Mahapatra, S. Samanta, T. Allahviranloo and M. Pal. (2019). “Radio fuzzy graphs and assignment of frequency in radio stations,” Computational and Applied Mathematics, vol. 38, no. 3, pp. 1–20. [Google Scholar]
15. R. Mahapatra, S. Samanta, M. Pal and Q. Xin. (2019). “RSM index: A new way of link prediction in social networks,” Journal of Intelligent and Fuzzy Systems, vol. 37, no. 2, pp. 2137–2151. [Google Scholar]
16. R. Mahapatra, S. Samanta, M. Pal and Q. Xin. (2020). “Link prediction in social networks by neutrosophic graph,” International Journal of Computational Intelligence Systems, vol. 13, no. 1, pp. 1699–1713. [Google Scholar]
17. U. Naseem, S. K. Khan, I. Razzak and I. A. Hameed. (2019). “Hybrid words representation for airlines sentiment analysis,” in Australasian Joint Conf. on Artificial Intelligence, Adelaide, SA, Australia, pp. 381–392. [Google Scholar]
18. U. Naseem, S. K. Khan, M. Farasat and F. Ali. (2020). “Abusive language detection: A comprehensive review,” Indian Journal of Science and Technology, vol. 12, no. 45, pp. 1–13. [Google Scholar]
19. U. Naseem, M. Khushi, S. K. Khan, N. Waheed, A. Mir, et al. (2020). , “Diabetic retinopathy detection using multi-layer neural networks and split attention with focal loss,” in Int. Conf. on Neural Information Processing, Bangkok, Thailand, pp. 26–37. [Google Scholar]
20. S. K. Khan, U. Naseem, M. Farasat and F. Ali. (2019). “Link-level performance modelling for next-generation uav relay with millimetre-wave simultaneously in access and backhaul,” Indian Journal of Science and Technology, vol. 12, no. 39, pp. 1–9. [Google Scholar]
21. S. K. Khan, U. Naseem, M. Farasat and F. Ali. (2020). “Performance evaluation of next-generation wireless (5G) UAV relay,” Wireless Personal Communications, vol. 113, no. 2, pp. 945–960. [Google Scholar]
22. S. K. Khan, U. Naseem, A. Sattar, N. Waheed, A. Mir, et al. (2020). , “UAV-aided 5G Network in Suburban, Urban, Dense Urban, and High-rise Urban Environments,” in 2020 IEEE 19th Int. Symp. on Network Computing and Applications, Cambridge, MA, USA, IEEE, pp. 1–4. [Google Scholar]
23. R. Mahapatra, S. Samanta and M. Pal. (2020). “Generalized neutrosophic planar graphs and its application,” Journal of Applied Mathematics and Computing, vol. 65, pp. 693–712. [Google Scholar]
 | This work is licensed under a Creative Commons Attribution 4.0 International License, which permits unrestricted use, distribution, and reproduction in any medium, provided the original work is properly cited. |