DOI:10.32604/cmc.2021.015976
| Computers, Materials & Continua DOI:10.32604/cmc.2021.015976 | |
| Article |
Ensemble Machine Learning Based Identification of Pediatric Epilepsy
1Department of Computer Science, College of Computer Science and Information Technology, Imam Abdulrahman Bin Faisal University, Dammam, 31441, Saudi Arabia
2Faculty of Computing, Riphah School of Computing & Innovation, Riphah International University, Lahore, Pakistan
*Corresponding Author: Muhammad Adnan Khan. Email: adnan.khan@riphah.edu.pk
Received: 16 December 2020; Accepted: 18 January 2021
Abstract: Epilepsy is a type of brain disorder that causes recurrent seizures. It is the second most common neurological disease after Alzheimer’s. The effects of epilepsy in children are serious, since it causes a slower growth rate and a failure to develop certain skills. In the medical field, specialists record brain activity using an Electroencephalogram (EEG) to observe the epileptic seizures. The detection of these seizures is performed by specialists, but the results might not be accurate due to human errors; therefore, automated detection of epileptic pediatric seizures might be the optimal solution. This paper investigates the detection of epileptic seizures by applying supervised machine learning techniques. The techniques applied on the data of patients with ages seven years and below from children’s hospital boston massachusetts institute of technology (CHB-MIT) scalp EEG database of epileptic pediatric signals. A group of Naïve Bayes (NB), Support vector machine (SVM), Logistic regression (LR), k-nearest neighbor (KNN), Linear discernment (LD), Decision tree (DT), and ensemble learning methods were applied to the classification process. The results demonstrated the outperformance of the present study by achieving 100% for all parameters using the Ensemble learning model in contrast to state-of-the-art studies in the literature. Similarly, the SVM model achieved performance with 98.3% for sensitivity, 97.7% for specificity, and 98% for accuracy. The results of the LD and LR models reveal the lower performance i.e., the sensitivity at 66.9%–68.9%, specificity at 73.5%–77.1%, and accuracy at 70.2%–73%.
Keywords: Pediatric epilepsy; ensemble learning; machine learning; SVM; EEG data
According to the international league against epilepsy (ILAE) statement, quoted in 2014, epilepsy is a transient occurrence of signs and symptoms due to abnormal, excessive, or synchronous neuronal activity in the brain [1]. Epilepsy can be diagnosed by three main symptoms: at least two seizures have occurred over 24 h, reflex seizures have occurred twice or more over 10 years, and/or epilepsy syndrome [1]. Epileptic seizure is the most common symptom [2], that is caused by a disrupting episode with the brain’s activities, and not all epileptic patients have seizures [3]. Approximately 50 million people over the world have epilepsy [4], that is 1% of the overall population. According to the Saudi epilepsy society, 0.654% of people in Saudi Arabia suffer from this disease. Epilepsy affects all ages, however, the symptoms and signs differ by age group. For example, in newborns, the symptoms involve a lack of oxygen during delivery and/or abnormal brain development. In infants symptoms are brain tumors and/or genetic disorders [5]. Therefore, an accurate diagnosis is important. As childhood is the stage of brain formation, epilepsy occurs more dynamically in the nervous system and may interfere with the brain development. That could affect the individual in several ways, such as the failure to develop skills, a slower growth rate, and the possibility of losing previously developed skills [6]. Every 4.8/1000 children worldwide suffer from epilepsy. In the US, 0.94/1000 children under 18 suffer from epilepsy [7]. In recent years, epilepsy diagnosis in infants and children has been improved, and investigation of new methods has become hot topic for researchers. EEG signals can reflect the state of temporal brain activities. It is a complex and nonlinear interconnection between a billion neurons [8]. In addition, it is common to diagnose epilepsy by analyzing the EEG data; in this regard, several studies have focused on aiding epileptic patients to find suitable treatments. Moreover, it involves EEG signal processing prior to application of the identification methods. Hence, the accuracy of the system also depends on the way the EEG signals are processed. In this regard, time and transform domain (frequency transform, wavelet transform etc.) signal processing techqniues have been investigated in the literature [9]. Efficacy of the signal processing technique greatly enhances the efficiency of epilyptic pediatric identification approaches. So to identify such a critical disease at the early stages, there is a dire need for investigating the machine learning (ML) techniques. Current study aims to investigate the ensamable based ML techniques for pediatric epilyse identification.
The organization of the paper is as follows: Section 2 contains a literature review, proposed methods are given in Section 3, Section 4 contains results and discussion while Section 5 concludes the paper.
ML has countless applications in almost every field of study and human life. However, in the medical sector, its significance is matchless. Other than pediatric epilepsy, ML has been investigated for detection and prediction of several fatal diseases like COVID19 [10], cardio diseases [11], diabetes [12], Parkinson [13], and many others. In [14,15], the researchers applied the SVM algorithm to classify seizure onset in pediatric epilepsy patients. The dataset from the CHB-MIT [16]contained 23 patient’s files of EEG recording and all patients under eighteen years. It is consisted of eighteen channels containing 163 seizures that were separated into records of one hour each. In [17], the authors designed an advanced seizure prediction via preictal relabeling (ASPPR) algorithm to predict epileptic pediatric seizures. The model achieved 96.30% accuracy for predicting seizures between 1 to 6 mins, 96.13% accuracy for 8 to 13 mins, 94% accuracy for 14 and 19 mins, and 94.2% accuracy for 20 and 25 mins. In [18], the authors proposed a technique to extract features from the epileptic pediatric dataset from the CHB-MIT EEG database. In their proposed method, EEG signals are mapped into 2D space that leads to texture image and the gray-level image domain. Furthermore, they compared their results with other methods and achieved 97.74% accuracy using the SVM classifier with linear kernels.
The data mining of EEG signals was analyzed by using a time series approach, which calculated peak points (the lowest point in a part of the signals) and valley points (the highest point in a part of the signals) and then calculated the distances between them. The study consisted of three experiments; all of them predicted onset seizures early with minimum latency. Identifying seizures in children is different than in adults because the seizures in children have lacked the characteristics of EEG features. The study in [19] aimed to find the difference between the type of spike called Rolandic in two groups of epilepsy, patients with benign focal epilepsy and patients with structure focal epilepsy, the author used an algorithm with three stages: spike detection, determination parameters, and classification. The proposed method achieved 75% with an Artificial neural network (ANN). Some studies that focused on newborn data, proposed alternative methods for detecting seizures [20–25] and achieved a high-level accuracy compared with previous studies. The number of electrodes may affect pediatric seizure detection. In [26], authors proposed a collective network of binary classifiers (CNBC) using multi-dimensional particle swarm optimization (MD PSO). The proposed method achieved 93% accuracy and it was applied on long-term EEG data for seizures extraction. The authors in [27] detected cognitive impairment in children with epilepsy by using network analysis, and their proposed method achieved 85% accuracy.
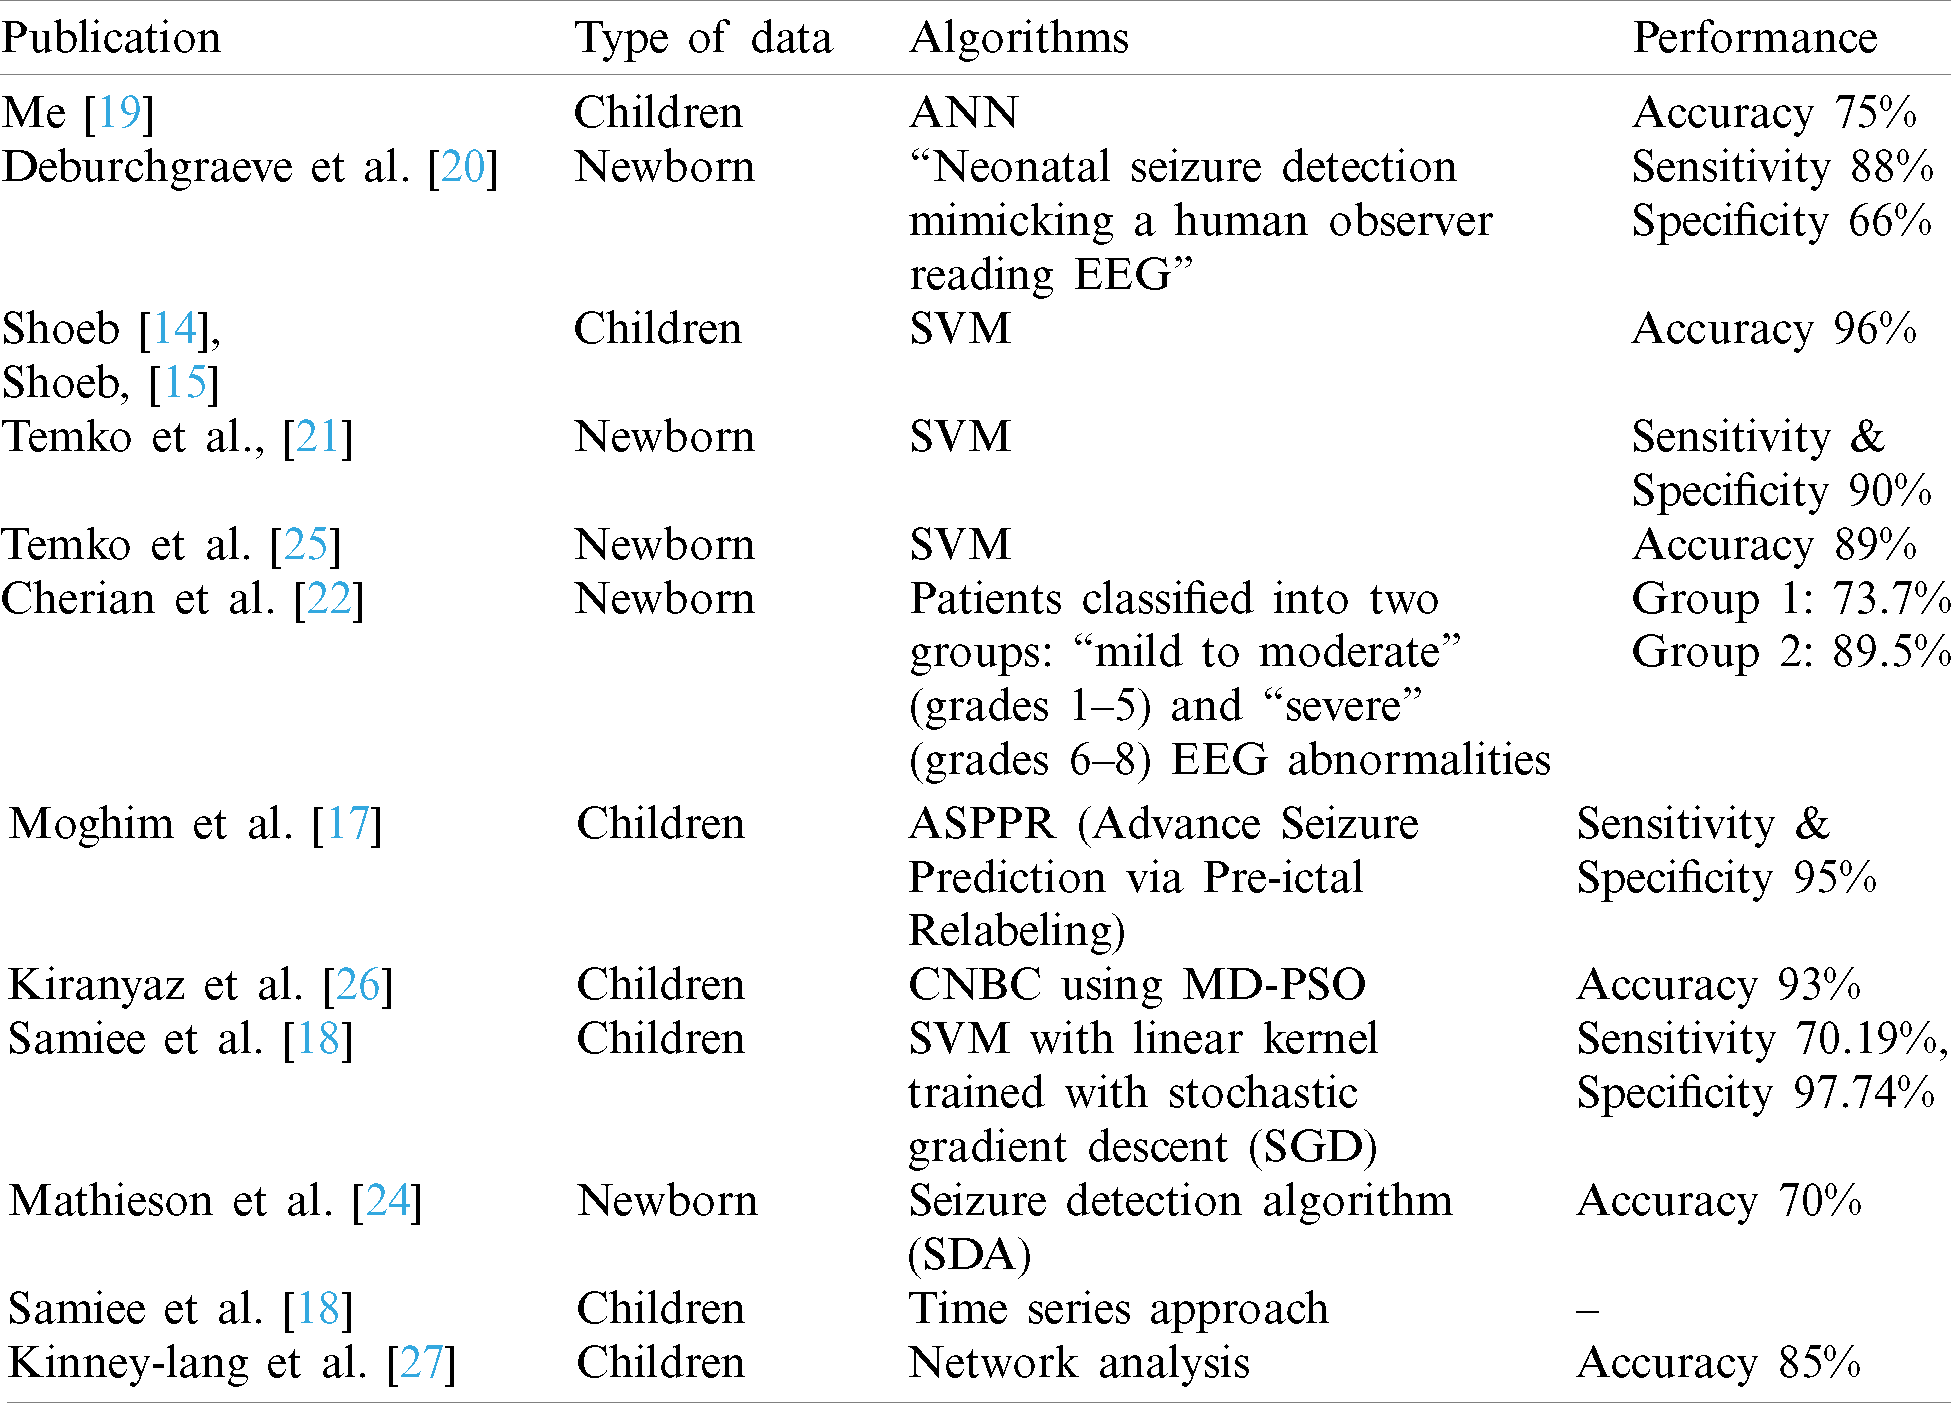
Summary of the state-of-the-art ML related techniques in detection of epilepsy in babies and children are enlisted in Tab. 1. According to the comprehensive and systematic literature review, many studies in detecting pediatric epilepsy are done, but the performance still needs to be improved. The highest achieved accuracy of 96% is claimed by [14,15] for the CHB-MIT EEG database. Apart from the detection/prediction accuracy, there is another challenge to identify the right candidate ML algorithm for future and advance prediction of pediatric epilepsy. Since there is a variety of ML algorithms with their own strengths and weaknesses against various application domains. To answer these questions, the current study is performed. The study aims to investigate several ML and ensemble learning algorithms to potentially enhance the performance of EEG data classification. For evaluation of these techniques, several performance metrics are targeted including accuracy, sensitivity (true positive rate) and specificity (true negative rate), etc.
Table 1: Summary of ML techniques in pediatric epilepsy
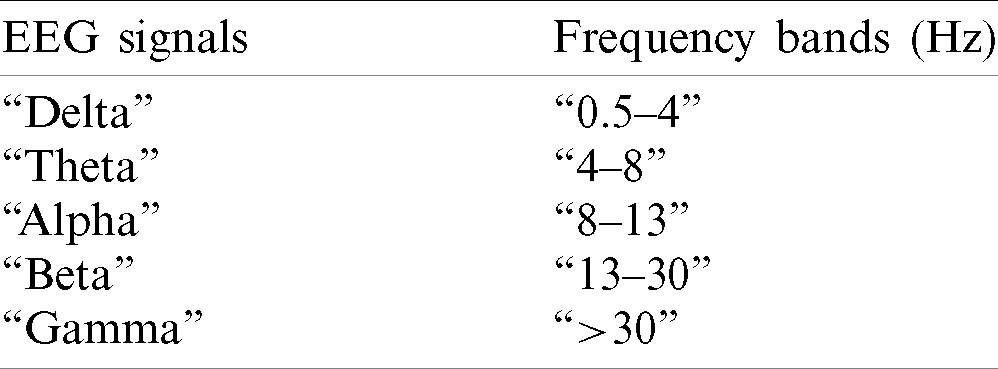
Original EEG signals contain noise from two environments, the first is external environments, such as electrode displacement and cable movement, and the second is internal sources, such as muscle movements and eyes blink [28]. These noises affect the signal and as a result the signals may incorrectly classified. Therefore, preprocessing the EEG signals prior to classification is essential and inevitable. The EEGLAB is an open-source toolbox for preprocessing EEG data [29]. It is compatible with MATLAB and is used to remove all noises and artifacts from the EEG signals. EEG signals are comprised of five sub-band frequencies: “delta” (0.5–4 Hz), “theta” (4–8 Hz), “alpha” (8–13 Hz), “beta” (13–30 Hz), and “gamma” (> 30 Hz), given in Tab. 2. The higher frequencies are considered as abnormal [30]. These five frequency bands present accurate information regarding brain signals. Therefore, using specific techniques to decompose signals to classify them is an optimal method, and the wavelet transform is a famous technique for this purpose [30].
Table 2: Frequency bands of EEG signals
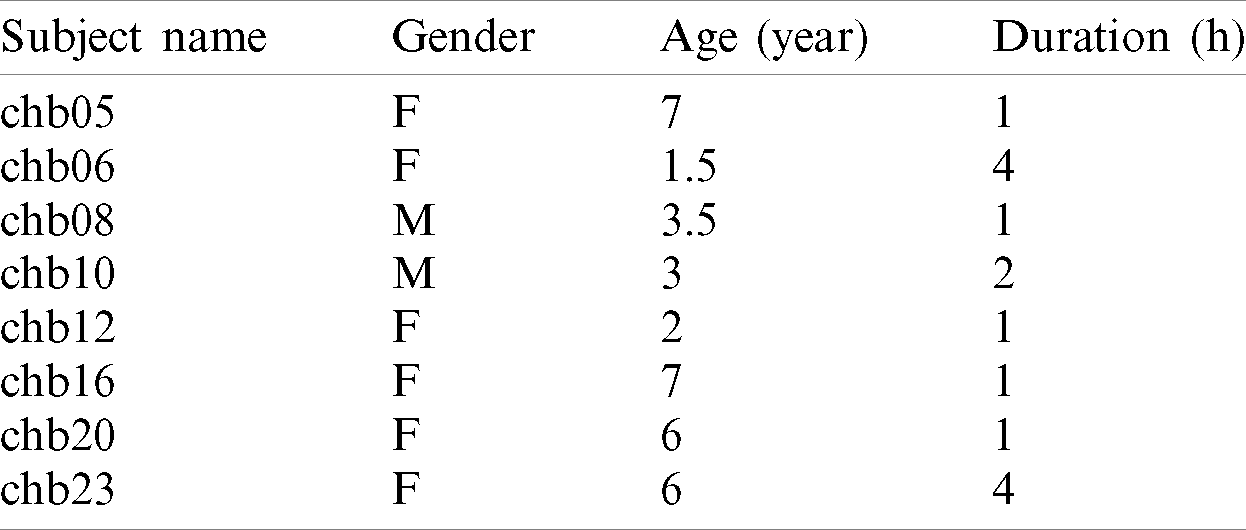
The EEG dataset is comprised of signals that need to be processed and transformed into a specific format so that the ML algorithms can be applied. A public CHB-MIT scalp EEG database from Physionet.org was used for the experiment Since the current study focused on children, the patients with age seven and less in the CHB-MIT scalp EEG database were selected as shown in Tab. 3. Two files from each patient were used; the first file had no seizure as a “non-seizure” record, while the second had seizures as a “seizures” record.
Table 3: CHB-MIT scalp EEG database information for age ¡= 7
Feature extraction is a process that represents specific information about the given input [31]. In biomedical signals, feature extraction represents specific behavior about signals, and it reduces the dimensionality or compresses the data to analyze it. EEG signals are in time-domain that could not provide the useful information. Wavelet transforms convert the time domain signals into the frequency domain, and this technique works well with non-stationary signals such as EEG signals. There are two types of wavelet tranform namely continuous wavelet transform (CWT) and discrete wavelet transform (DWT). CWT matches the signal with the wavelet basis function at continuous-time and frequency growing, and the data must be digitized. The equation of the wavelet function [32] is described as follows:
where
3.3 Machine Learning Algorithm
In the current work, the following ML techniques are used:
• Logistic Regression (LR)
• Decision Tree (DT)
• Naïve Bayes (NB)
• Support vector machine (SVM)
• K-Nearest Neighbor (KNN)
• Ensemble Learning
• Linear Discriminant (LD)
These algorithms are good candidates for classification problems [35–37]. In the current study, these algorithms were tested on an “Intel (R) Core (TM) i7-5500” with a CPU speed of 2.40 GHz and RAM of 16 GB; the system type was 64-bit, running on Windows 8. Seven algorithms including LR, DT, LD, NB, SVM, k-NN, and ensemble learning were employed, and their performance was measured.
The first step in EEG signal processing is to remove artifacts. To do so, specific software must be used, such as MATLAB or Python. Then, the feature from the signals data must be extracted using feature extraction methods, such as wavelet transform. When features are extracted, the signals are ready to be classified by the ML techniques. Finally, the results compared with recent studies to evaluate it. The pipeline processing of this study is illustrated in Fig. 1.

Figure 1: Processing pipeline steps
To remove artifacts from signals, a finite impulse response (FIR) filter was applied. The FIR filter consisted of “high-pass” and “low-pass” filters. The “high-pass” filter was used to “allow frequencies higher than the border to pass through it while blocking low frequencies,” and the “low-pass” filter was used to allow frequencies lower than the border to pass through it while blocking high frequencies.
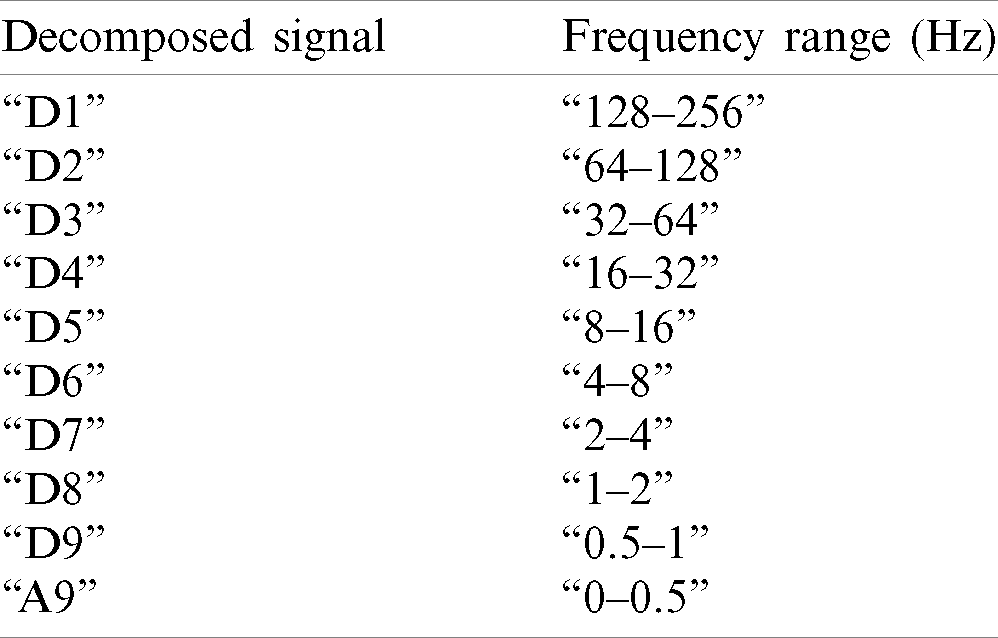
In this paper, the high-pass filter border was 0.5 Hz, and the low-pass filter border was 40 Hz. These boundary frequencies were selected because 0.5 to 40 Hz represents the range of the five frequency bands, from delta to gamma. However, any frequencies lower than 0.5 Hz and higher than 40 Hz are regarded as noisy signals. Since the EEG data is comprised of non-stationary signals, DWT is suitable since it captures features in both the “time domain” and “frequency domain.” The Daubechies family with order 9 is applied. To select a convenient level of decomposition in the Daubechies family, wavelet decomposition spilled the original signal into a different band of frequencies called the A’s and D’s, which are approximations and details of the coefficient information, respectively and they complement each other [38–40]. With this information related to high-pass and low-pass frequencies, this procedure is presented in Fig. 2 by sampling the EEG at Nyquist rate [41]. In each stage, two types of coefficients exist: details as high-pass frequencies and approximations as low-pass frequencies, together with the number for the level (e.g., in level one there are D1 and A1). This procedure is repeated on the approximation side until it reaches the low-pass frequency. Fig. 3 presents the full decomposition levels of a single signal at level 9. The band corresponding to nine levels of EEG signal decomposition are presented in Tab. 4, and the signals are decomposed into D1 to D9 and A9.

Figure 2: Wavelet decomposition tree of level 9

Figure 3: Decomposition levels of single signal at level 9
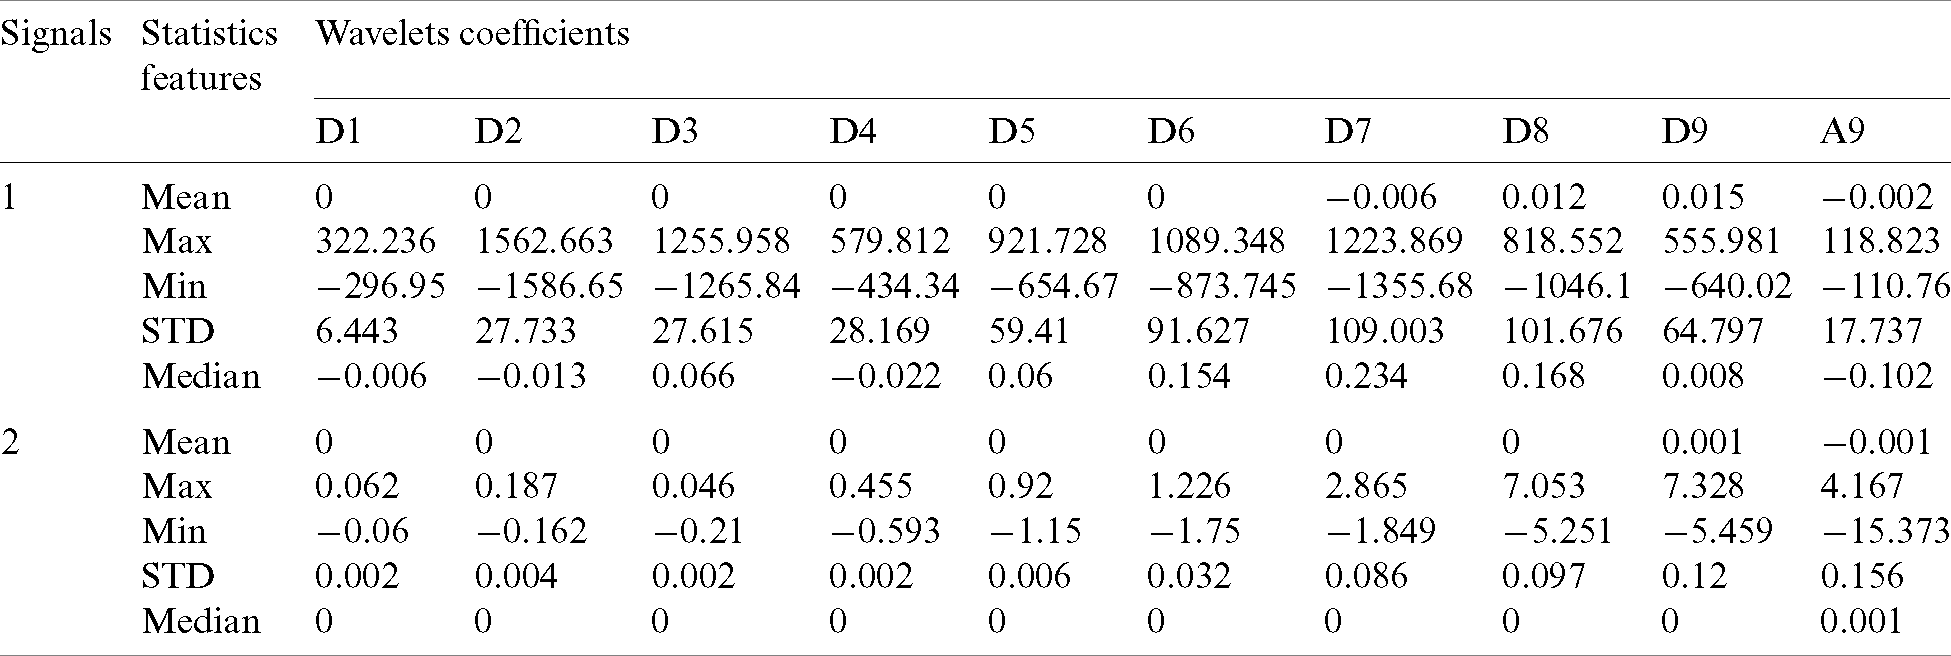
Statistics over the sets of coefficients are used to decrease the dimensionality of the extracted feature vectors and to represent the time-frequency distribution of the EEG signals. The statistical features selected in this study are “maximum,” “minimum,” “mean,” “median,” and “standard deviation (STD)” of the wavelet coefficients in each original signal. Based on the feature extraction, 9-dimensional feature sets (from D1 to D9 and A9) over the five statistics are calculated. Consequently, average of the statistical features of the wavelet coefficients for each channel is calculated. As an example, Tab. 5 presents the extracted features in five statistics sets of two signals in the various decomposition levels for patient 16. The coefficients are calculated by the signal processing toolbox of Matlab.
Table 5: Statistical features of wavelet coefficients of two signals in patient 16
To classify the features, as shown in Tab. 5 with statistical features as rows and the 9 levels of wavelet decomposition as columns were produced and imported into the classification learner toolbox of Matlab to apply the proposed ML techniques. In this study, three performance parameters were used to evaluate the proposed model, namely, accuracy, sensitivity, and specificity according to the following equations [42]:
Where, “TP/FP” is a “true/false” positive, and “TN/FN” is a “true/false” negative class after testing the model. The accuracy is a common method used to measure the classifier performance by dividing the number of correct classes by the number of all classes multiply by 100. Whereas the sensitivity and the specificity are statistical measures for classification performance. Sensitivity measures the true positive value and specificity measures true negative value [43].
After extracting useful features from the EEG signals, seven algorithms were applied to classify the data into “epileptic” and “non-epileptic” seizures, and the performance parameters were calculated to evaluate the model. This section presents the results as well as a comparison of the study with previous studies that used the same dataset. The data were divided into two sets: training and testing, with 90% and 10% division, respectively for each classifier. Then, the sensitivity, specificity, and accuracy for each classifier were calculated for the entire dataset and averaged. The results of the performance measurement parameters for all patients equal and less than 7 years old are presented in Tab. 6 and depicted in Fig. 4 as well. It can be observed that the best performance was achieved with Ensemble learning which achieved 100% accuracy overall and indicating that the model predicted all classes successfully. SVM achieved good accuracy which is 98% overall. The lowest accuracies were achieved with LD and LR, with 70.2% and 73% overall, respectively. NB, KNN, and DT classifiers achieved satisfactory accuracies with 87.5%, 90.2%, and 92.3%, respectively. In the KNN model, the number of neighbors (K) that achieved the best accuracy was 3 (while 1 and 2 achieved the same accuracy but lower than 3). When the ensemble learning model was applied, the bagged tree method was used to solve the classification problems and the DT was used for building the learner type of ensemble classifier.
Table 6: Performance results for all patients
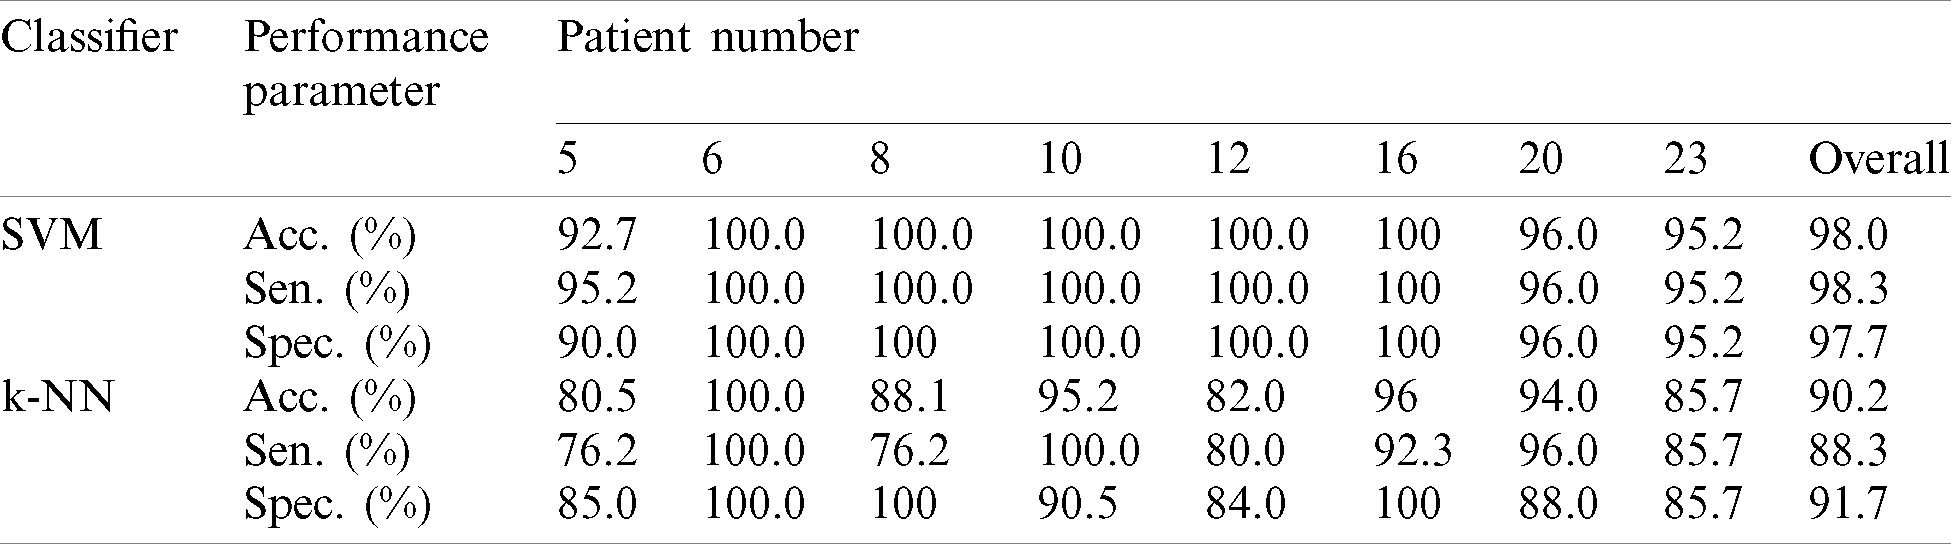
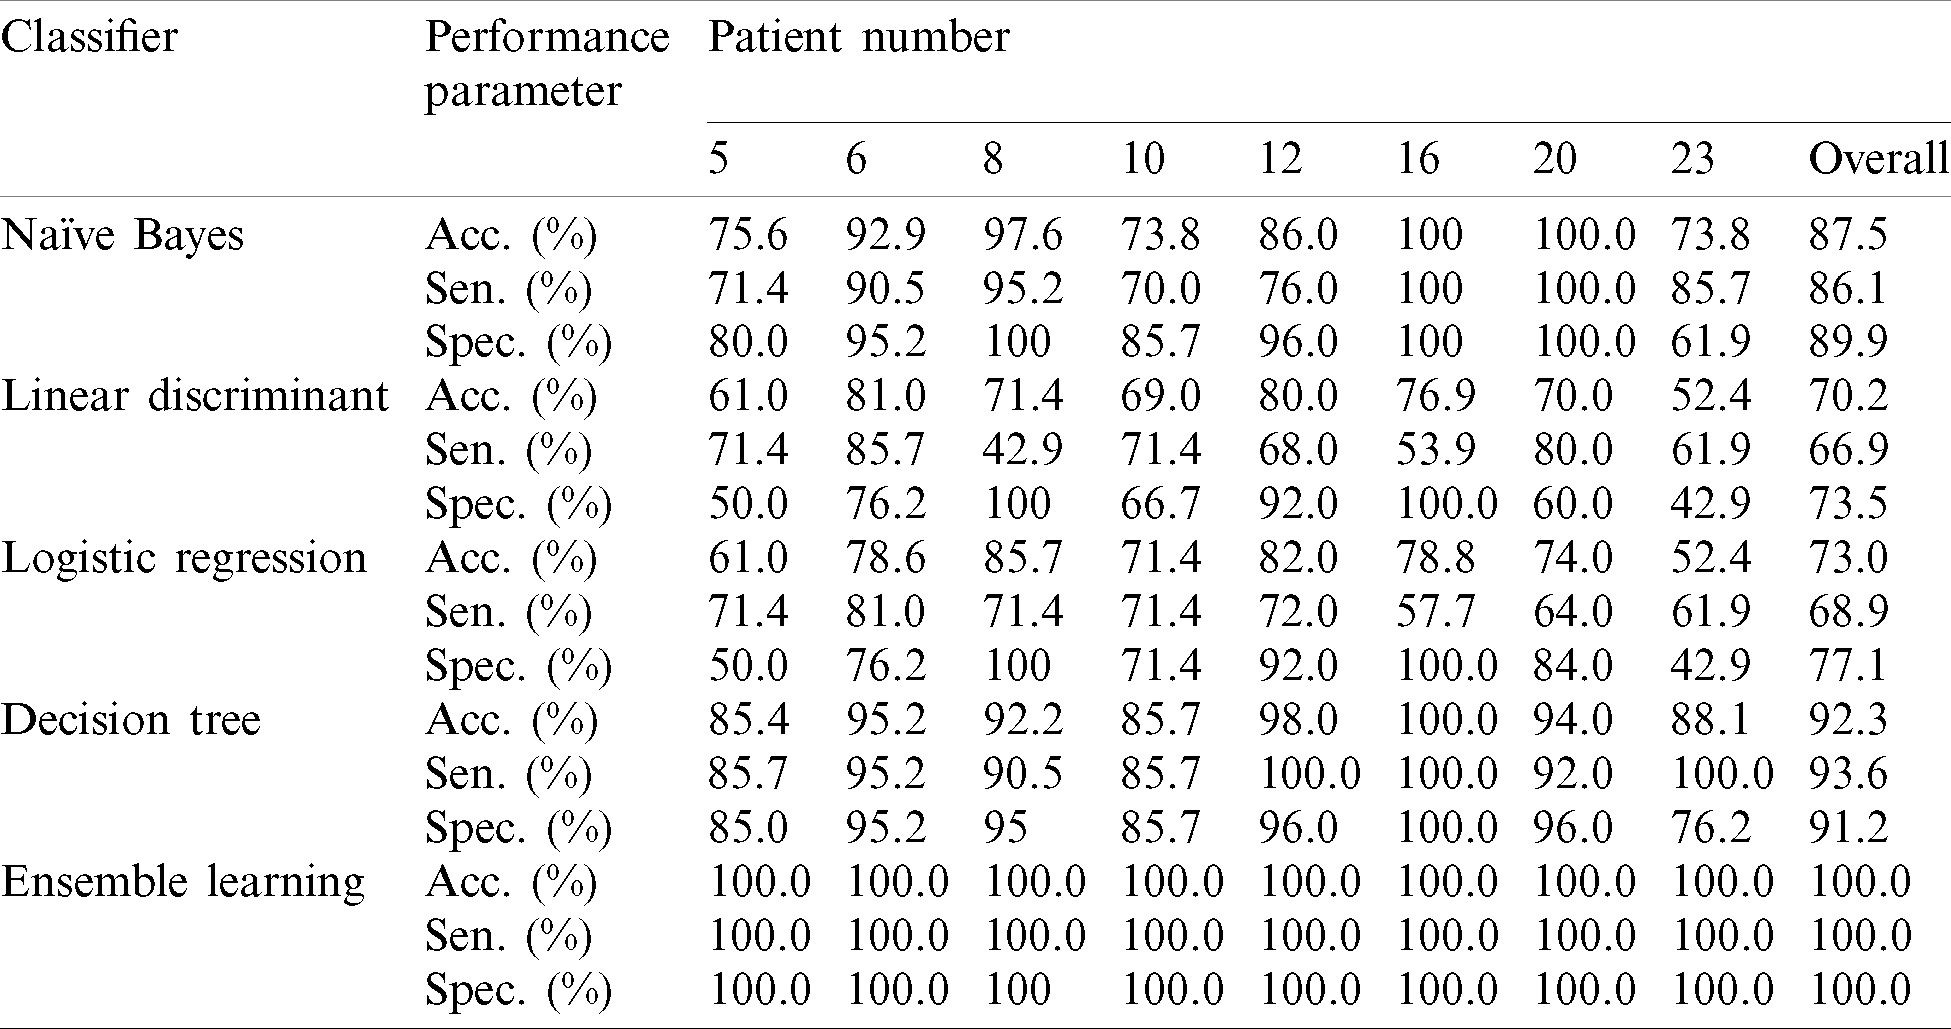

Figure 4: The chart of aggregate performance results
There are various ways to assess classifier performance like scatter plots, confusion matrices, and receiver operation characteristic (ROC) curves. Presented below are the three assessment methods as an example for patient 16. The scatter plot of the LD model is presented in Fig. 5. Further, the classifier result after training the data is presented, in which the correct and incorrect classes are denoted with a dot and as X, respectively, while the different colors refer to different classes. For the LD model, confusion matrix is presented in Fig. 6 as an example and the classifier performance for each class is presented. The rows present the predicted classes, while the columns display the actual classes. The blue cells denote that the classifiers are performing well, while the red cells denote that they are not. The classifier predicted the true negative classes correctly and predicted twelve of the false-negative classes incorrectly. It appears that the classifier peforms well in the true classes and vice versa.

Figure 5: Scatter plot of the LD model

Figure 6: Confusion matrix of the LD model
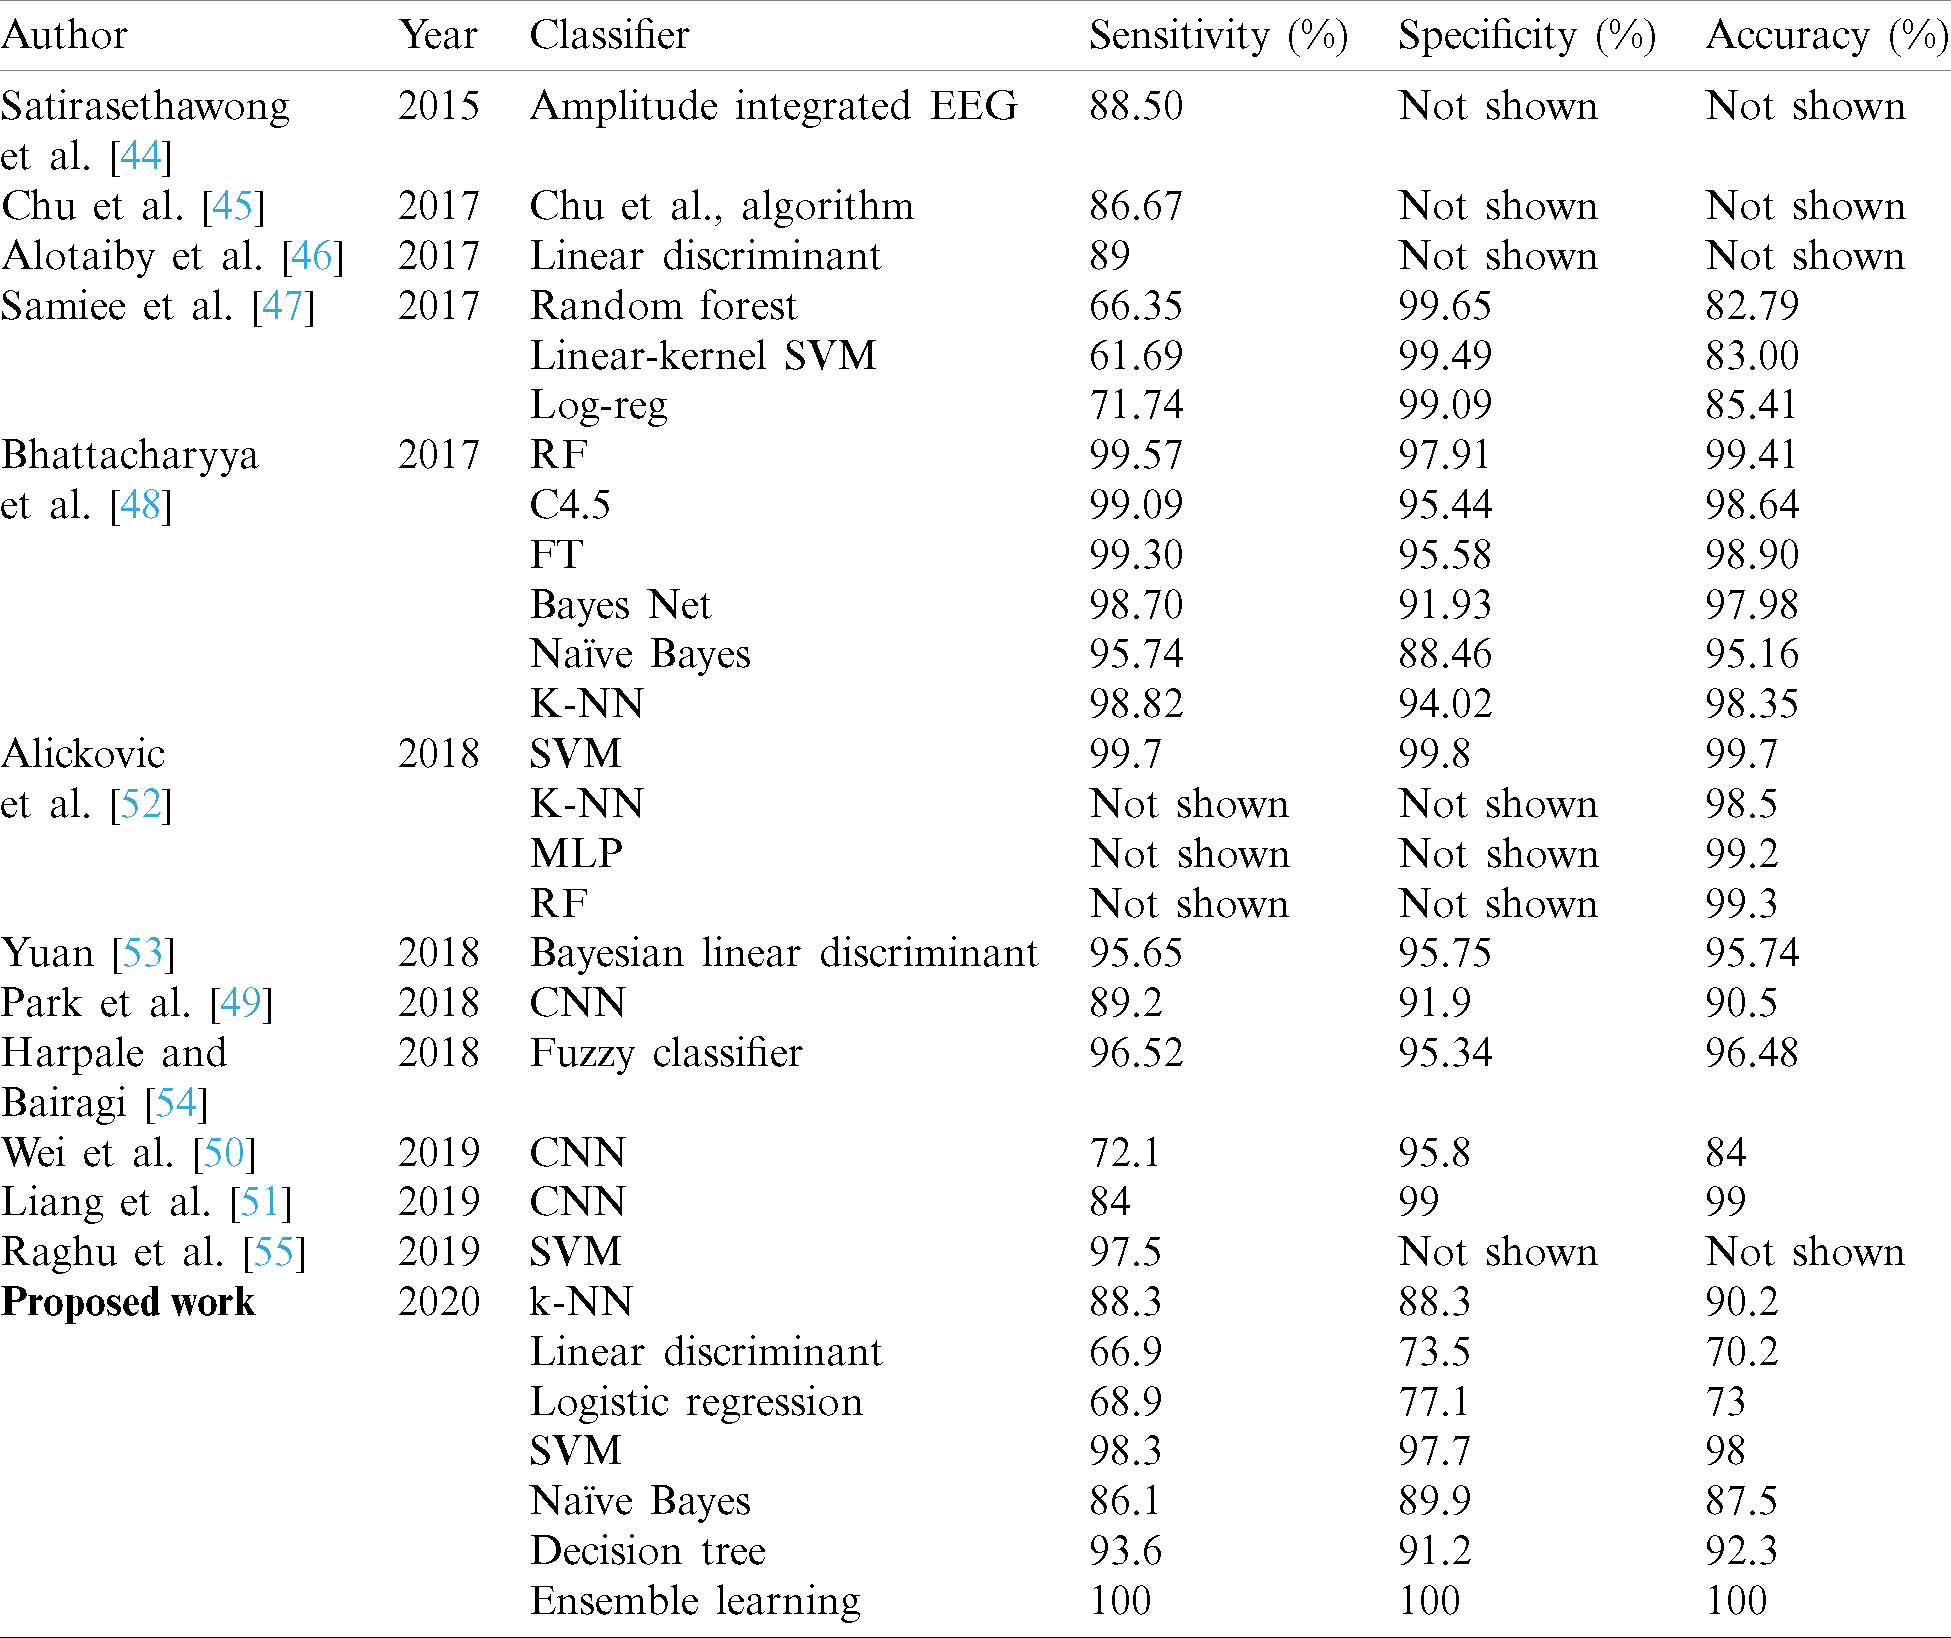
The ROC curve is another method to assess model performance. It provides the TP rate versus the FP rate of the classifier in the chart. For example, Fig. 7 illustrates the ROC curve of the NB model for patient 16 as an example. The red marker displays the value of the “true positive” and “false positive” of the classifier. The blue area under the curve indicates the quality of the classifier. A larger area under the curve indicates better performance and vice versa. The accuracies of the seven models were satisfactory, indicating that the proposed method worked well on the EEG data. Ensamble learning and SVM model achieved high accuracies overall with 100% and 98%, respectively. Based on the previous studies presented in the literature review, the SVM classifier demonstrated high performance. From the experiment, it is observed that the outperformed accuracies were obtained by the Ensemble learning model, which achieved 100% overall which is the highest accuracy achieved among the seven models. On the other hand, the LD and LR models achieved the lowest accuracies among the algorithms, with 70.2% and 73% for LD and LR overall, respectively. In comparing the results with other studies that used the same EEG dataset the Ensemble learning method produced better sensitivity, specificity, and accuracy, at 100%. According to Tab. 7, proposed model significantly outperformed recent studies, and with lesser complexity. Satirasethawong et al. [44] proposed an algorithm for evaluating their methods of epileptic seizure classification. This algorithm was developed based on static methods. They used one performance parameter, namely sensitivity (in [45,46] they also used only the sensitivity as a performance parameter), and it achieved good results, at 88.50%. The results in [47] were superior to those of [48], and the KNN performed well at 98%. Compard to the proposed work, no methods achieved 100%, but overall, their results were satisfactory. In [49–51], the authors used a Convolutional neural network (CNN) classifier, and this demonstrated a significant performance reach to 99% in [51] but with a huge complexity. Nonetheless, complexity of the proposed method is adequate enough for the application at hand. Because major time investment is required for processing of EEG signals. Once it is done, identification task is of moderate complexity and appropriate for such the soft real time application. Moreover, the techniques are applied on offline dataset.

Figure 7: ROC curve of the NB model
Table 7: Comparison of performance of different classifiers in recent studies
Epilepsy is a neurological disease that affects approximately 1% of the world’s population. Seizures are a common symptom of epilepsy, and recently they have been used to diagnose the disease in computer science research by using machine learning techniques. To observe the seizures, the brain activity is recorded EEG signals, which is used as data in epilepsy classification processes. The goal of this work is to enhance the performance of detecting pediatric epilepsy by analyzing EEG data and classifying it into “epileptic” and “non-epileptic” seizures by applying various machine learning techniques as well as ensamble learning technique. To achieve this goal, the patients with 7 years old and less from the EEG CHB-MIT scalp database were analyzed by using EEGLAB (a toolbox in MATLAB) to remove the artifacts from the EEG signals. DWT with Daubechies family order was used since the signals were non stationary. In the current study, seven algorithms were used: KNN, DT, LD, SVM, ensemble learning, NB, and LR. The Ensemble learning and SVM models in this work outdo the performance over other models in diagnosing epileptic seizures in the literature. Future work could include creating a new method and tools to analyze signals accurately and easily. This would assist in diagnosing epileptic seizures and other neurological diseases in a shorter time and with fewer processing steps. In addition, further advanced algorithms could be applied, including deep learning and extreme learning machines, etc. More importantly, the research should be carried out on the detection of various types of seizures rather than just presence or absense.
Acknowledgement: This research is acknowledged to the children suffering from epilyptic disease.
Funding Statement: Authors received no specific funding for this study.
Conflicts of Interest: Authors declare that they have no conflicts of interest to report regarding the study.
1. J. J. F. Walter, I. E. Sche and R. S. Fisher. (2018). “The new definition and classification of seizures and epilepsy,” Epilepsy Research, vol. 139, no. 1, pp. 73–79. [Google Scholar]
2. World Health Organization. (2006). “Neurological disorders: Public health challenges,” in World Health Organization, pp. 218, . ISBN: 9789241563369. https://apps.who.int/iris/handle/10665/43605. [Google Scholar]
3. R. Fox, R. Heartshorne, C. Kobylecki and C. Murphy. (2015). “An unusual cause of seizures,” Practical Neurology, vol. 15, no. 2, pp. 145–147. [Google Scholar]
4. L. Orosco and E. Laciar. (2013). “Review: A survey of performance and techniques for automatic epilepsy,” Journal of Medical, Biology and Engnieering, vol. 33, no. 6, pp. 526–537. [Google Scholar]
5. J. R. Gavvala and S. U. Schuele. (2016). “Epilepsy,” Jama Network, vol. 316, no. 24, pp. 2686–2697. [Google Scholar]
6. M. L. Smith. (2010). “Neuropsychology in epilepsy: Children are not small adults,” Epilepsia, vol. 51, no. 1, pp. 68–69. [Google Scholar]
7. P. Sharma, A. Hussain and R. Greenwood. (2019). “Precision in pediatric epilepsy,” Faculty Reviews, vol. 8, no. 1, pp. 1–15. [Google Scholar]
8. T. Wen and Z. Zhang. (2017). “Effective and extensible feature extraction method using genetic algorithm-based frequency-domain feature search for epileptic eeg multi-classification,” Medicine, vol. 96, no. 19, pp. 1–17. [Google Scholar]
9. A. Rahman. (2020). “GRBF-NN based ambient aware realtime adaptive communication in DVB-S2,” Journal of Ambient Intelligence and Humanized Computing, vol. 2020, no. 12, pp. 1–11. [Google Scholar]
10. F. Khan, M. A. Khan, S. Abbas, A. Athar, S. Y. Siddiqui et al. (2020). , “Cloud-based breast cancer prediction empowered with soft computing approaches,” Journal of Healthcare Engineering, vol. 2020, pp. 1–11. [Google Scholar]
11. M. A. Khan, S. Abbas, A. Atta, A. Ditta, H. Alquhayz et al. (2020). , “Intelligent cloud-based heart disease prediction system empowered with supervised machine learning,” Computers, Materials & Continua, vol. 65, no. 1, pp. 139–151. [Google Scholar]
12. A. Rehman, A. Athar, M. A. Khan, S. Abbas, A. Saeed et al. (2020). , “Modelling, simulation, and optimization of diabetes type II prediction using deep extreme learning machine,” Journal of Ambient Intelligence and Smart Environments, vol. 12, no. 2, pp. 125–138. [Google Scholar]
13. S. Dash, A. Abraham and A. Rahman. (2018). “Kernel based chaotic firefly algorithm for diagnosing parkinson’s disease,” in Int. Conf. on Hybrid Intelligent Systems, Porto, Portugal, pp. 176–188. [Google Scholar]
14. A. H. Shoeb. (2009). “Application of machine learning to epileptic seizure onset detection and treatment,” in 27th Int. Conf. on Machine Learning, Haifa, Israel, pp. 157–162. [Google Scholar]
15. A. H. Shoeb and J. Guttag. (2010). “Application of machine learning to epileptic seizure detection,” Seizure, vol. 10, pp. 975–982. [Google Scholar]
16. A. Goldberger, L. Amaral, L. Glass, J. Hausdorff, P. C. Ivanov, et al. (2019). “CHB-MIT Scalp EEG Database—PhysioBank, PhysioToolkit, and PhysioNet: Components of a new research resource for complex physiologic signals,” Circulation, vol. 101, no. 23, pp. e215–e220. [Google Scholar]
17. N. Moghim and D. W. Corne. (2014). “Predicting epileptic seizures in advance,” PLoS One, vol. 10, no. 3, pp. 1–17. [Google Scholar]
18. K. Samiee, S. Kiranyaz, M. Gabbouj and T. Saramäki. (2015). “Expert systems with applications long-term epileptic eeg classification via 2D mapping and textural features,” Expert System Applications, vol. 42, no. 20, pp. 7175–7185. [Google Scholar]
19. T. Me. (2019). “Algorithm for automatic eeg classification according to the epilepsy type: Benign focal childhood epilepsy and structural focal epilepsy,” Biomedical Signal Processing and Control, vol. 48, no. 1, pp. 118–127. [Google Scholar]
20. W. Deburchgraeve, P. J. Cherian, R. M. Swarte, M. D. Vos, P. Govaert et al. (2008). , “Clinical Neurophysiology Automated neonatal seizure detection mimicking a human observer reading EEG,” Clinical Neurophysiology, vol. 119, no. 11, pp. 2447–2454. [Google Scholar]
21. A. Temko, E. Thomas, W. Marnane, G. Lightbody and G. B. Boylan. (2011). “Clinical neurophysiology performance assessment for EEG-based neonatal seizure detectors,” Clinical Neurophysiology, vol. 122, no. 3, pp. 474–482. [Google Scholar]
22. P. J. Cherian, W. Deburchgraeve, R. M. Swarte, M. D. Vos, P. Govaert et al. (2011). , “Clinical neurophysiology validation of a new automated neonatal seizure detection system: A clinician’s perspective,” Clinical Neurophysiology, vol. 122, no. 8, pp. 1490–1499. [Google Scholar]
23. N. J. Stevenson, L. Lauronen and S. Vanhatalo. (2018). “Clinical neurophysiology the effect of reducing eeg electrode number on the visual interpretation of the human expert for neonatal seizure detection,” Clinical Neurophysiology, vol. 129, no. 1, pp. 265–270. [Google Scholar]
24. S. R. Mathieson, N. J. Stevenson, E. Low, W. P. Marnane, J. M. Rennie et al. (2016). , “Clinical neurophysiology validation of an automated seizure detection algorithm for term neonates,” Clinical Neurophysiology, vol. 127, no. 1, pp. 156–168. [Google Scholar]
25. A. Temko, E. Thomas, W. Marnane, G. Lightbody and G. Boylan. (2011). “Clinical neurophysiology eeg-based neonatal seizure detection with support vector machines,” Clinical Neurophysiology, vol. 122, no. 3, pp. 464–473. [Google Scholar]
26. S. Kiranyaz, T. Ince, M. Zabihi and D. Ince. (2014). “Automated patient-specific classification of long-term Electroencephalography,” Journal of Biomedical Information, vol. 49, no. 2, pp. 16–31. [Google Scholar]
27. E. Kinneylang, M. Yoong, M. Hunter, K. K. Tallur, J. Shetty et al. (2019). , “Epilepsy and behavior analysis of eeg networks and their correlation with cognitive impairment in preschool children with epilepsy,” Epilepsy and Behavior, vol. 90, no. 6, pp. 45–56. [Google Scholar]
28. F. Manajemen, D. I. Puskesmas and L. Kabupaten. (2013). “FASTER: Fully automated statistical thresholding for EEG artifact rejection,” Journal of Neuroscience Methods, vol. 192, no. 1, pp. 152–162. [Google Scholar]
29. A. Delorme and S. Makeig. (2004). “Eeglab: An open-source toolbox for analysis of single-trial EEG dynamics including independent component analysis,” Journal of Neuroscience Methods, vol. 134, no. 1, pp. 9–21. [Google Scholar]
30. D. Gajic, Z. Djurovic, S. D. Gennaro and F. Gustafsson. (2014). “Classification of EEG signals for detection of epileptic seizures based on wavelets and statistical pattern recognition,” Biomedical Engineering: Applications, Basis and Communications, vol. 26, no. 2, pp. 1450021-1–1450021-13. [Google Scholar]
31. S. Krishnan and Y. Athavale. (2018). “Biomedical signal processing and control trends in biomedical signal feature extraction,” Biomedical Signal Processing and Control, vol. 43, no. 5, pp. 41–63. [Google Scholar]
32. H. Adeli, Z. Zhou and N. Dadmehr. (2003). “Analysis of EEG records in an epileptic patient using wavelet transform,” Journal of Neuroscience Methods, vol. 123, no. 1, pp. 69–87. [Google Scholar]
33. I. Daubechies. (1988). “Orthonormal bases of compactly supported wavelets,” Communications on Pure and Applied Mathematics, vol. 41, no. 1, pp. 909–996. [Google Scholar]
34. A. Rahman, M. Mahmud, K. Sultan, N. Aldhafferi, A. Alqahtani et al. (2018). , “Medical image watermarking for fragility and robustness: A chaos, ECC and RRNS based approach,” Journal of Medical Imaging and Health Informatics, vol. 8, no. 6, pp. 1192–1200. [Google Scholar]
35. A. Rahman, S. Dash, A. K. Luhach, N. Chilamkurti, S. Baek et al. (2019). , “A neuro-fuzzy approach for user behavior classification and prediction,” Journal of Cloud Computing, vol. 8, no. 17, pp. 1–9. [Google Scholar]
36. A. T. Sohaib. (2012). An Empirical Study of Machine Learning Techniques for Classifying Emotional States from EEG Data, Karlskrona Sweden: School of Computing Blekinge Institute of Technology. [Google Scholar]
37. K. Abualsaud, M. Mahmuddin, M. Saleh and A. Mohamed. (2015). “Ensemble classifier for epileptic seizure detection for imperfect EEG data,” Scientific World Journal, vol. 2017, no. 6, pp. 1–15. [Google Scholar]
38. P. Jahankhani, V. Kodogiannis and K. Revett. (2006). “EEG signal classification using wavelet feature extraction and neural networks,” in IEEE John Vincent Atanasoff Int. Symp. on Modern Computing, Los Alamitos, USA, pp. 120–124. [Google Scholar]
39. A. Kandaswamy, C. S. Kumar, R. Pl and S. Jayaraman. (2004). “Neural classification of lung sounds using wavelet coefficients,” Computers in Biology and Medicine, vol. 34, no. 6, pp. 523–537. [Google Scholar]
40. W. Ting. (2008). “EEG feature extraction based on wavelet packet decomposition for brain computer interface,” Measurement, vol. 41, no. 6, pp. 618–625. [Google Scholar]
41. I. Omerhodzic, S. Avdakovic, A. Nuhanovic and K. Dizdarevic. (2010). “Energy distribution of EEG signals: EEG signal wavelet-neural network classifier,” World Academy of Science Engineering and Technology, vol. 4, no. 1, pp. 1083–1088. [Google Scholar]
42. M. Mahmud, A. Rahman, M. Lee and J. Choi. (2020). “Evolutionary-based image encryption using rna codons truth table,” Optics & Laser Technology, vol. 121, no. 1, pp. 1–8. [Google Scholar]
43. A. Taher and A. Shaimaa. (2014). “Performance analysis of support vector machines classifiers in breast cancer mammography recognition,” Neural Computing and Applications, vol. 24, no. 1, pp. 1163–1177. [Google Scholar]
44. C. Satirasethawong, A. L. Uthai, K. Chomtho and A. Processing. (2015). “Amplitude-integrated EEG processing and its performance for automatic seizure detection,” in IEEE Int. Conf. on Signal Image Processing and Applications, Kuala Lumpur, Malaysia, pp. 551–556. [Google Scholar]
45. H. Chu, C. Kee, W. Jeong and K. Cho. (2017). “Predicting epileptic seizures from scalp EEG based on attractor state analysis,” Computer Methods and Programs in Biomedicine, vol. 143, no. 4, pp. 75–87. [Google Scholar]
46. T. N. Alotaiby, S. A. Alshebeili, F. M. Alotaibi and S. R. Alrshoud. (2017). “Epileptic seizure prediction using CSP and LDA for scalp EEG signals,” Computational Intelligence and Neuroscience, vol. 2017, no. 6, pp. 1–11. [Google Scholar]
47. A. Bhattacharyya and R. B. Pachori. (2017). “A multivariate approach for patient-specific EEG seizure detection using empirical wavelet transform,” IEEE Transactions on Biomedical Engineering, vol. 64, no. 9, pp. 2003–2015. [Google Scholar]
48. K. Samiee, P. Kovács and M. Gabbouj. (2017). “Epileptic seizure detection in long-term EEG records using sparse rational decomposition and local gabor binary patterns feature extraction,” Knowledge Based Systems, vol. 118, no. 4, pp. 228–240. [Google Scholar]
49. C. Park, G. Choi, J. Kim, S. Kim, T. J. Kim et al. (2018). , “Epileptic seizure detection for multi-channel EEG with deep convolutional neural network,” in Proc. Int. Conf. on Electronics, Information, and Communication, Honolulu, Hawaii, USA, pp. 1–5. [Google Scholar]
50. Z. Wei, J. Zou, J. Zhang and J. Xu. (2019). “Automatic epileptic EEG detection using convolutional neural network with improvements in time-domain,” Biomedical Signal Processing and Control, vol. 53, no. 3, pp. 101551. [Google Scholar]
51. W. Liang, H. Pei, Q. Cai and Y. Wang. (2019). “Scalp EEG epileptogenic zone recognition and localization based on long-term recurrent convolutional network,” Neurocomputing, vol. 396, no. 5, pp. 569–576. [Google Scholar]
52. E. Alickovic, J. Kevric and A. Subasi. (2018). “Performance evaluation of empirical mode decomposition, discrete wavelet transforms, and wavelet packed decomposition for automated epileptic seizure detection and prediction,” Biomedical Signal Processing and Control, vol. 39, no. 1, pp. 94–102. [Google Scholar]
53. S. Yuan. (2018). “The earth mover’s distance and Bayesian linear discriminant analysis for epileptic seizure detection in scalp EEG,” Biomedical Engineering Letter, vol. 8, no. 4, pp. 373–382. [Google Scholar]
54. V. Harpale and V. Bairagi. (2018). “An adaptive method for feature selection and extraction for classification of epileptic EEG signal in significant states,” Journal of King Saud University-Computer Information Science, . https://doi.org/10.1016/j.jksuci.2018.04.014. [Google Scholar]
55. S. Raghu, N. Sriraam and P. L. Kubben. (2019). “Automated detection of epileptic seizures using successive decomposition index and support vector machine classifier in long-term EEG,” Neural Computer and Applications, vol. 32, no. 1, pp. 8965–8984. [Google Scholar]
 | This work is licensed under a Creative Commons Attribution 4.0 International License, which permits unrestricted use, distribution, and reproduction in any medium, provided the original work is properly cited. |