DOI:10.32604/cmc.2021.016131
| Computers, Materials & Continua DOI:10.32604/cmc.2021.016131 | |
| Article |
Multimodal Medical Image Registration and Fusion for Quality Enhancement
1Department of Electronic Engineering, The Islamia University of Bahawalpur, 63100, Pakistan
2Department of Telecommunication Engineering, The Islamia University of Bahawalpur, 63100, Pakistan
3Department of Computer Science, National University of Computer and Emerging Sciences, Chiniot, 35400, Pakistan
4Institute of Software Development and Engineering, Innopolis University, Innopolis, 420500, Russia
*Corresponding Author: Khan Bahadar Khan. Email: kb.khattak@gmail.com
Received: 24 December 2020; Accepted: 24 January 2021
Abstract: For the last two decades, physicians and clinical experts have used a single imaging modality to identify the normal and abnormal structure of the human body. However, most of the time, medical experts are unable to accurately analyze and examine the information from a single imaging modality due to the limited information. To overcome this problem, a multimodal approach is adopted to increase the qualitative and quantitative medical information which helps the doctors to easily diagnose diseases in their early stages. In the proposed method, a Multi-resolution Rigid Registration (MRR) technique is used for multimodal image registration while Discrete Wavelet Transform (DWT) along with Principal Component Averaging (PCAv) is utilized for image fusion. The proposed MRR method provides more accurate results as compared with Single Rigid Registration (SRR), while the proposed DWT-PCAv fusion process adds-on more constructive information with less computational time. The proposed method is tested on CT and MRI brain imaging modalities of the HARVARD dataset. The fusion results of the proposed method are compared with the existing fusion techniques. The quality assessment metrics such as Mutual Information (MI), Normalize Cross-correlation (NCC) and Feature Mutual Information (FMI) are computed for statistical comparison of the proposed method. The proposed methodology provides more accurate results, better image quality and valuable information for medical diagnoses.
Keywords: Multimodal; registration; fusion; multi-resolution rigid registration; discrete wavelet transform; principle component averaging
Medical imaging modalities such as X-rays, Computed Tomography (CT), Magnetic Resonance Imaging (MRI), Single Photon Emission Computed Tomography (SPECT), and Positron Emission Tomography (PET) are the most important imaging sources used by medical experts for medical investigations. Each of the imaging modality contains unique and useful information for diagnoses of various health disorders. In medical imaging, a single imaging modality is not sufficient to provide all anatomical and functional information required for diagnoses of the normal and abnormal structures. Single imaging modality has limited information, for example, anatomical information about bones can be acquired from X-rays and CT scan images whereas functional and soft tissue information can be attained from MRI images. Similarly, body functional and cancerous cell information can be extracted from PET and SPECT images. All the functional and anatomical information can be achieved on a single platform by using a multimodal approach. Multimodal medical imaging requires two or more than two imaging sources to give extended medical information that cannot be visible from a single imaging modality. The detection of the lesion, fractures, cancerous cells, brain hemorrhage, and tumors are more visible from multimodal medical imaging [1–3]. To achieve a resultant image that contains maximum information can be possible by multimodal image registration and fusion. Many diseases like Alzheimer’s, neoplastic, Coronary Artery Disease (CAD), etc. cannot be diagnosed properly in the early stages from a single imaging modality. To overcome this limitation, registration and fusion techniques are used to diagnose such diseases more accurately [4–6]. Image registration is the first step to align geometrical coordinates of two images and match their intensities values followed by the image fusion to overlap two images without any loss of medical information. Then, the resultant fused image will contain both anatomical and functional information [7,8]. The research trend of multimodal approaches can be seen in Fig. 1, which reflects that the research happening in this area is increasing tremendously. The statistical results shown in Fig. 1 are collected from PubMed which is an online medical database [9]. It is observed that the number of publications is increasing each year. Fig. 1, represents published articles from 1990 to third-quarter year Q3, 2020.
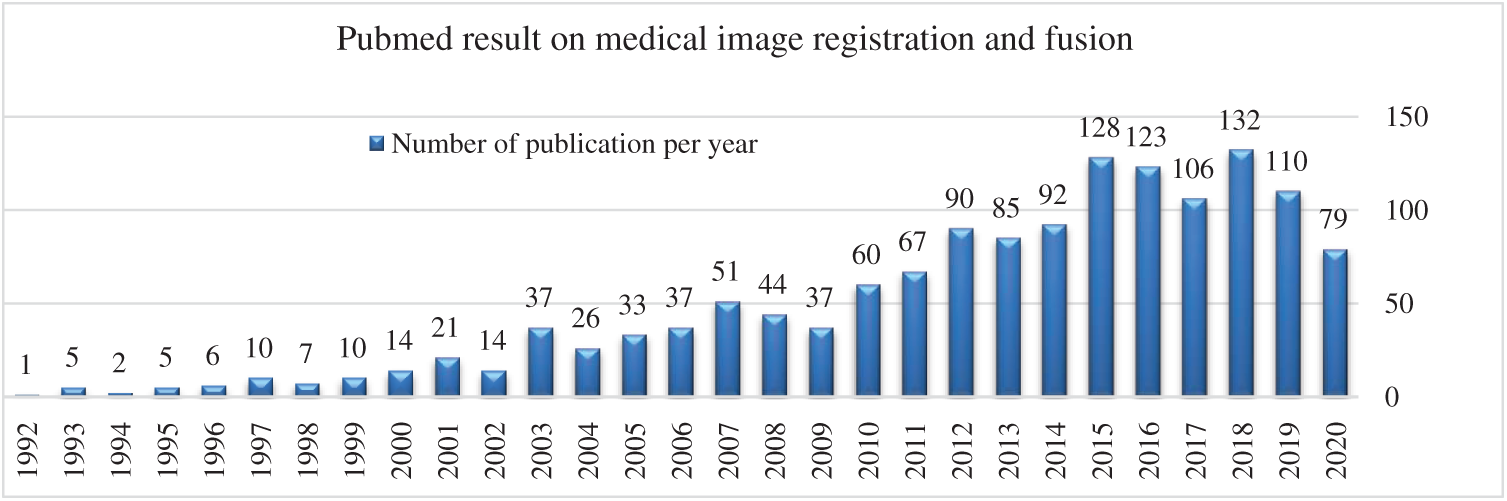
Figure 1: Multimodal image registration and fusion publications per year [PubMed: 1990–2020]
The general block diagram of multimodal medical image registration and fusion techniques used for image information enhancement is shown in Fig. 2, which consists of two major steps: Image registration and fusion.

Figure 2: General block diagram of the multimodal registration and fusion
In this research article, a multimodal medical image registration and fusion technique is presented. The main motivation of this research work to diagnose brain diseases at early stages with the help of registration and fusion techniques. The surgeons and medical experts can perform surgery more precisely using multi-modality. The contribution of the proposed methodology to visualize the brain anatomical and functional information more effectively on a single modality. The remaining section of this paper is arranged as follows: Section 2 contained the related works. The proposed methodology is discussed in Section 3. The dataset and experimental details are discussed in Section 4. The results and discussion of the proposed methodology are elaborated in Section 5. The last Section 6 concludes the research work.
Many multimodal medical image registration and fusion approaches are presented in the literature. Das et al. [10] used the affine MRR technique for multimodal image registration. CT and MRI images of the human brain were used as an input. The registered images were obtained by maximizing the correlation function between the two input images. Particle Swarm Optimization (PSO) and Genetic Algorithm (GA) were used to maximize the value of the similarity function between the two input images. The dataset utilized contained MRI-T1, MRI-T2, and CT images. The correlation similarity was used as a performance parameter to compare the results before and after registration. In this work better accuracy and robustness were achieved with PSO rather than GA. Joshi et al. [11] performed a rigid registration of the CT and MRI images using GA. Mean Square Difference (MSD) similarity metric was computed for statistical comparison. Leng et al. [12] proposed a novel approach based on interpolation that works on multi-resolution registration. In this method, the whole image registration steps were divided into two stages: Registration of medical images and intensity interpolation. The bicubic B-spline vector-valued transformation function was used for feature-based registration between the two input medical images. The control points of the B-spline were evaluated on each resolution registration for better-featured matching. In the second step, the intensity values of input images were matched using linear/cubic interpolation. The experimental result proved that this approach was suitable for deformable medical images. The registration results were evaluated using the MSD quality assessment metric.
Mohammed et al. [13] implemented an intensity-based rigid registration and then Wavelet Transform was applied to fused CT and MRI images. The SRR method was easy to implement and time-efficient. The correlation coefficient similarity metric was used for matching both input images. The registration results were determined by the correlation function of images before and after registration. It was observed that the correlation value was high after registration. In the image fusion step, the third level decomposition was used to determine the coefficient of input images using eighth order Daubechies (db) wavelet. Nandish et al. [14] proposed a multimodal B-Spline deformable and MRR registration technique. The B-Spline method was implemented on 2D and 3D brain images. It was observed that the B-Spline method gives good results on 2D medical images but produced noise in 3D images. The multi-resolution technique was much better and produce less noise in 3D brain MRI and CT images. The spatial information from a source image to the target image determines and mapped on the target image using multi-resolution registration. In this method, the three-level multi-resolution approach was used. After registration, the fusion step takes place. The statistical performance of registration and fusion was determined using MI and visual results were verified from the radiologist feedback.
Palanivel et al. [15] proposed a novel method for a 3D multimodal medical image registration. In this methodology, the volume of input images was registered by volume multifractal characteristics. Multifractal characteristics of volume were used as features in 3D registration. This methodology was implemented on medical 3D brain images and synthetic phantom images. Brain CT and MRI images of seven different patients were used from the RIRE database. Initially, multifractality characteristics of Input CT and MRI images were derived using Holder exponents and Hausdorff dimensions. Presti et al. [16] proposed a local affine transformation rigid or non-rigid registration-based technique that works on the Empirical Mutual Information (EMI) similarity metric. The optimization algorithm based on gradient descent was used for maximizing the value of the similarity metric between two input images. This method was implemented on the brain and knee images. Cui et al. [17] presented a novel non-rigid registration technique based on multichannel. The authors used a novel parameter-reduced cost function to optimize the weighting parameter and also improved the inflexible solid boundary. The proposed method was implemented on multi-scale CT and SPECT lung images. In this article, the main focus of image registration was to diagnose chronic obstructive pulmonary disease (COPD) in the lungs.
Gaurav et al. [18] proposed a multimodal fusion algorithm based on the Directive Contrast NSCT. The NSCT based fusion technique decomposes the input mages into low and high-level frequency components. There were two fusion rules applied in this algorithm. The first fusion rule was directive contrast and the other was phase congruency to fuse low and high-frequency components of image level. Finally, the resultant fused image was obtained by taking inverse NSCT. The experiment results were obtained from the brain images of different persons having diseases like a tumor, Alzheimer’s, and brain stroke. Statistical results were verified based on the parameters like Edge Based Similarity Measure (ESM), Structure Similarity Index Metric (SSIM), and Normalize Mutual information (NMI).
Sahu et al. [19] implemented a multimodal brain image fusion using a Laplacian pyramid and Discrete Cosine Transform (DCT). As the level of the pyramid increases then the quality of fused images also increases when input images were decomposed. The visualization and statistical results showed that this method provided better image edges and contains maximum information. The methodology was compared with Daubechies complex wavelet transform (DCxWT). Bashir et al. [20] proposed a multimodal fusion method based on Stationary Wavelet Transform (SWT) and Principle Component Analysis (PCA). These two fusion methods were tested on satellite images, multimodal medical images, stereo images, and infrared visible images. Then, these two methods were compared with each other. The fusion image quality was determined by using image fusion quality metrics like entropy, MI, NCC, RMSE, etc. It was observed that SWT performed well on multimodal and multi-sensor images, while PCA performed well in the case of those multimodal images having higher contrast. He et al. [21] used PET and MRI brain images to fuse by applying Intensity-Hue-Saturation (IHS) technique and PCA. The advantage of these techniques was to maintain spatial information and acquire spatial features present in the input images with no loss of color disorder in the images.
Yuhui et al. [22] utilized a multi-wavelet transform fusion technique on the PET and CT chest images. The coefficients of images were decomposed by wavelet decomposition. The fusion results were evaluated by using different assessment metrics. Xu et al. [23] proposed a multimodal image fusion method based on adaptive Pulse Coupled Neural Network (PCNN). The optimization technique Quantum PSO (Q-PSO) was used for determining the maximum value of the similarity measure. Arif et al. [24] proposed a new fusion method based on Fast Curvelet Transform along with Genetic Algorithm (FCT-GA). The authors implemented their technique on CT, MRI, MRA, PET, and SPECT brain images. In this article, the dataset collected from CMH hospital Rawalpindi and other sets of the image were acquired from AANLIB freely available dataset. The statistical results were verified on eight different performance metrics. Maqsood et al. [25] presented a new technique that works on two-scale image decomposition using the sparse representation technique. The authors first decomposed input images into two layers: Base and detail layers. SSGSM method was used to extract the detail layers. CT and MRI brain images were used for testing the method.
There is some work related to deep learning done that include Bhattacharya et al. [26] presented a deep learning survey article that mainly focused on Covid-19 disease detection using deep learning. Gadekallu et al. [27] presented the PCA technique with a deep learning model, but this work was associated with tomato plant disease detection. In recent deep learning approaches are widely used but they vary from case to case study as Gadekallu et al. [28] used deep learning to predict retinopathy disease. Reddy et al. [29] recently implemented a deep neural network with a combination of Antlion resampling techniques to classified multimodal stroke brain imaging datasets, the primary focused of this dataset is to classify dataset stroke images taken from the Kaggle dataset. Many researchers already worked on fusion and registration methods but accurate registration of two different imaging modalities is still a challenging task due to different intensity variations. The image fusion for gathering useful medical information in a single imaging modality is another problem. Most of the existing work is either only based on registration or the fusion process, a limited number of researchers combined both for useful results. In the proposed methodology, the combination of registration and fusion process is used to enhance the medical information in a single imaging modality for ease of diagnosis. The typical SRR method is tested and compared with the MRR method followed by PCAv for fusion to improve the results significantly as discussed in Section 4.
The proposed method is based on MRR and DWT-PCAv techniques. The MRR technique is more accurate than single registration and then the DWT-PCAv fusion technique is applied for adding valuable details in the resultant image. Medical images: CT and MRI are used as input. The initial step of image registration is achieved by the application of the MRR technique to align the images and match their intensity values. It is noticed that the MRR technique gives better results as compared to SRR. The resultant image is best aligned and contains more valuable information for diagnosis purposes. After registration, the DWT-PCAv fusion technique is applied to fuse both images. The framework of the proposed method is shown in Fig. 3.
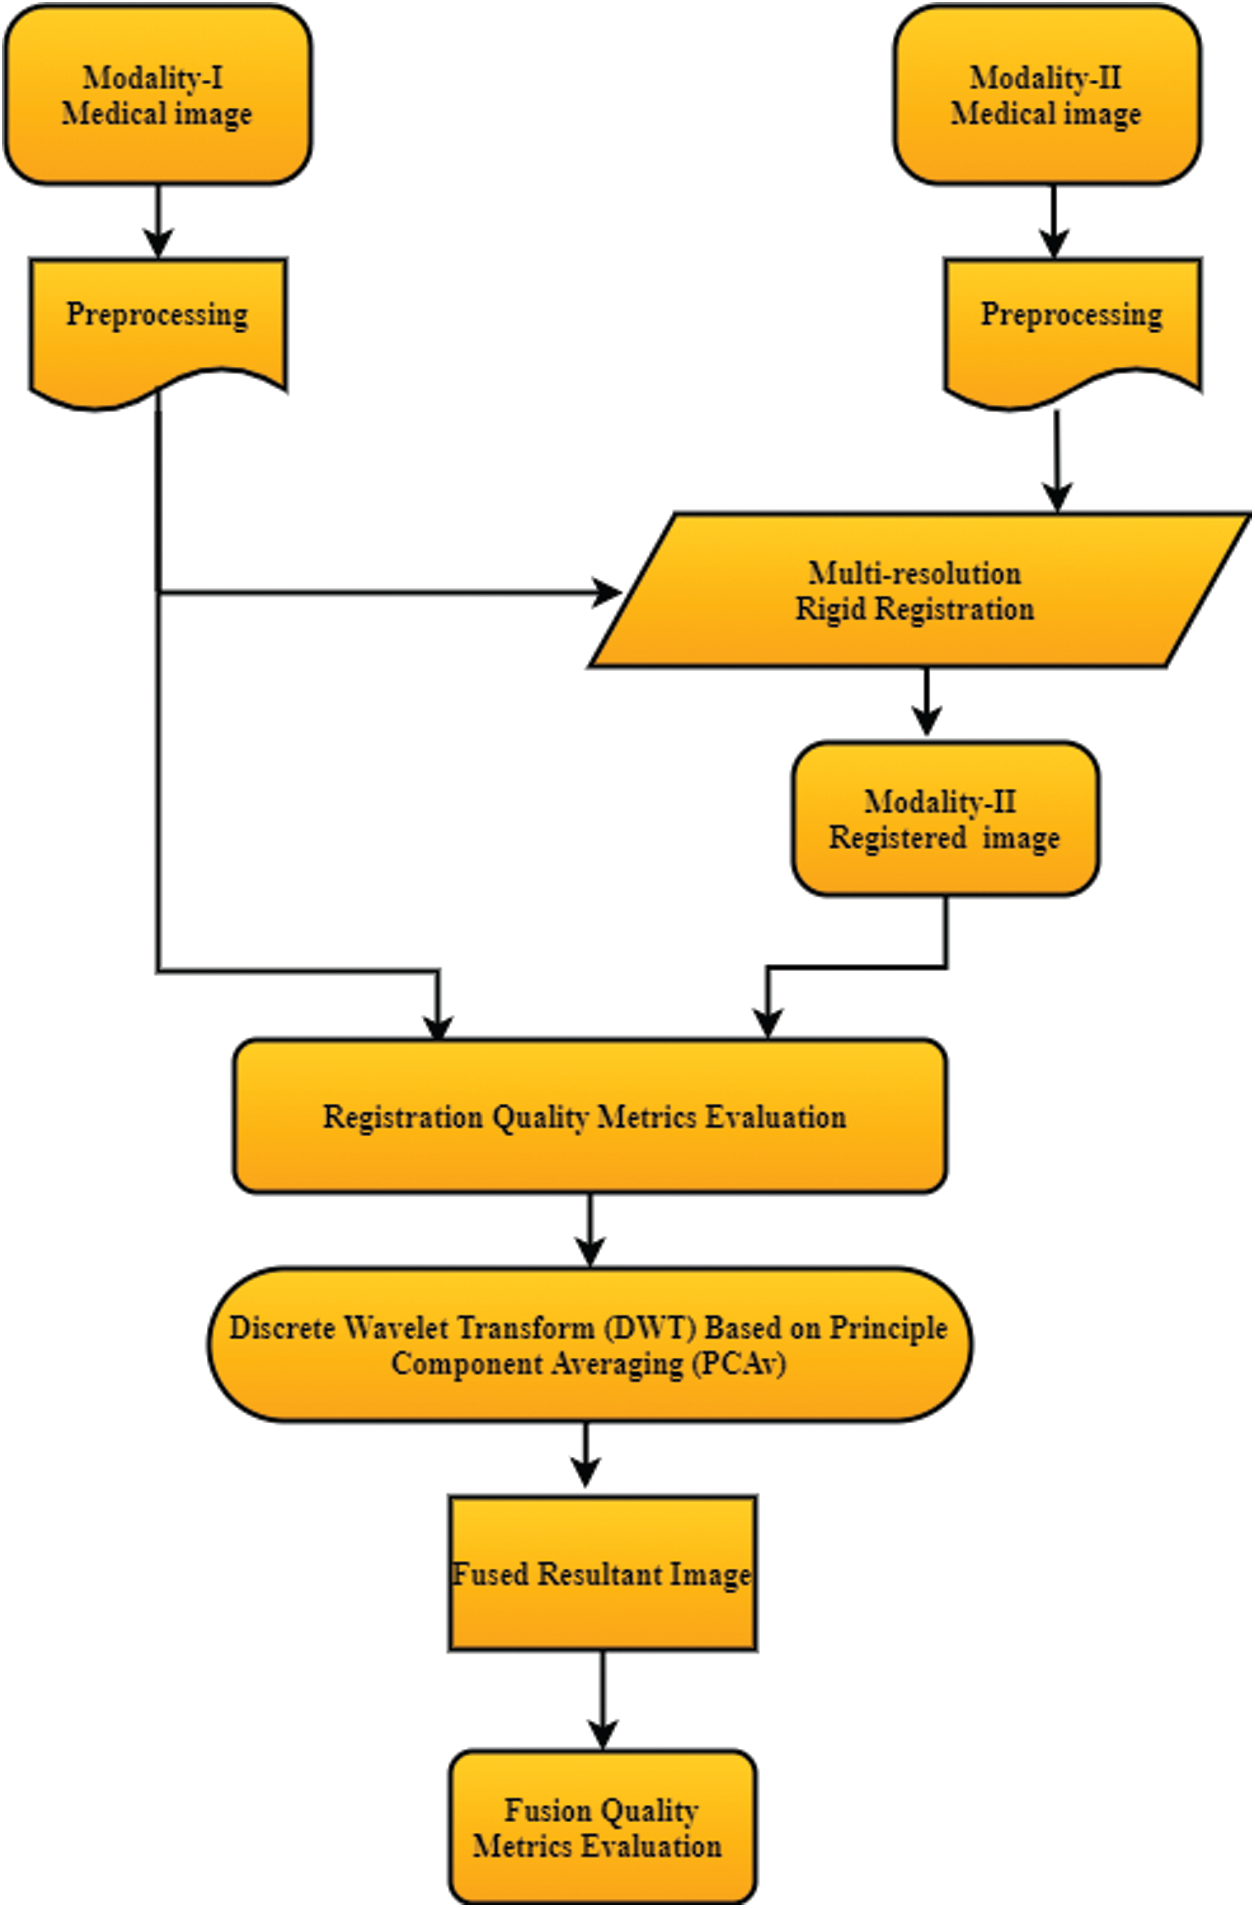
Figure 3: Block diagram of the proposed methodology
3.1 Multi-Resolution Rigid Registration (MRR)
During the proposed MRR technique, the input medical images are converted into multiple resolution levels. Fig. 4 shows the multi-resolution pyramid model for registration. Images are arranged in decreasing resolution as images go from the base of the pyramid to the top of the pyramid. The base image of the pyramid has a higher resolution than the top of an image of the pyramid which has the lowest resolution. Images are divided into multiple levels and on each level registration process will be performed. When input images are of the same sizes and different resolutions then the registration process will produce better results, which will help in diagnoses abnormalities. The original input images are at the base level of the pyramid and if these images are of size

Figure 4: Multi-resolution pyramid model for image registration
MRR is an iterative process via geometric transformation using a similarity metric that maximizes the similarity between source/moving and target/fixed image. The proposed MRR procedure is shown in Fig. 5.

Figure 5: Multi-resolution rigid registration procedure
In the proposed methodology, affine rigid registration geometric transformation is applied which includes scaling, rotation, and shearing of the images to best align the source image into the target image. There are many similar metrics but we choose the Cross-Correlation similarity metric due to its non-complex nature and time efficiency. Automatic multi-resolution registration will be done when a maximum similarity value is achieved between source and target images using the optimizer. The optimizer will continuously calculate the similarity value until the similarity between two images is maximized and both images become perfectly aligned. The similarity metric is a non-convex function. In the proposed methodology, a Gradient descent optimizer is utilized. The role of the interpolator is to determine the position and the value of each pixel and its neighbor’s pixel value from both moving and fixed images. The optimizer function is responsible for the correct registration of images by considering the similarity metric values. The similarity function is not smooth and contains multiple local optima values due to variation in intensities values of the images in the multimodal registration process. The images are best overlapped and registered when the global optima position is reached. The MRR technique takes more time as compared to SRR because this is an iterative procedure to register images. MRR registration requires multiple resolutions of images from a single input image. MRR matched intensities values of each image one by one and stoped when all the source and target split images perfectly matched. The final registered image has better geometrical alignment with the target image as it takes more time but it has better accuracy in terms of alignment. And more registration time reduces in the fusion process later because with the MRR technique the images are already registered with minimum alignment error.
After the MRR process, the input source images are first decomposed into different multi-scale resolutions and orientations using DWT. This method is used to visualize input images in different resolutions having each decomposed level with different information. After multi-scale decomposition, the principal components are performed on each image coefficients level. Then, the average of principal components is evaluated on each decomposed image level and some weights to each coefficient element of images are assigned for fusion rules. The input images are decomposed into different coefficient levels, such as Low–Low (LL), Low–High (LH), High–Low (HL), and High–High (HH). The LH, HL, and HH are detailed coefficient scale levels while LL is the approximate coefficients element. The LL coefficient elements taken from two source images are used as an input to the PCA. From the LL coefficients element, the highest principle components determine the new coefficient element m1 and m2. Similarly, other detailed coefficient elements are processed to calculate the principal components. Then, the average of approximation and detail coefficients principal components are taken to obtain m1 and m2 average components. These two average principal components are used to fuse the final image. The complete step-by-step fusion procedure is displayed in Fig. 6.

Figure 6: Block diagram of DWT-PCAv fusion process
The major steps can be summarized as follows:
• Initially, CT and MRI input images are decomposed into two or three levels by using DWT.
• Then, detailed coefficients components and approximation components are obtained by using PCA.
• Sort out every principle component of corresponding coefficient elements from both image sources.
• Evaluate average coefficients components using PCAv.
• Implemented principle component averaging fusion via mean and averaging of principle components.
• Evaluate the quality of the fused image using fusion quality assessment metrics.
• Consider if
where the value of i is from range
The mean of all pixel’s value can be calculated as follows
The two matrixes can be defined as D is a diagonal matrix that contains Eigenvalues and matrix E that contain Eigenvectors. These two matrixes are evaluated first then normalized components of m1 and m2 can be determined as described in the following equations. The n denotes the number of decomposition levels. If
Otherwise;
After computation of m1 and m2 from approximation coefficients, m1 and m2 are calculated from detail coefficients elements. When all the m1 and m2 components are calculated then the mean of these components is computed. In the final step, the PCAv is used to fuse the final medical image having useful diagnostic information.
4 Experimental Results and Discussion
This section consists of the details of the dataset and performance parameters used for validation of the proposed methodology. The visual and statistical results along with the discussion are also provided.
The proposed model is tested on the Harvard Atlas brain dataset obtained from (http://www.med.harvard.edu/AANLIB/home.html). The Harvard medical dataset is mainly classified into two categories: Normal and abnormal brain images. This dataset contains modalities includes MRI (MR, MR-T1, MR-T2, MRPD, MR-GAD), CT, and SPECT/PET brain images. In the normal brain images section, this dataset added new 3D anatomy brain structure images of MRI and PET modalities. This new dataset contains three different angles of images known as Transaxial plane, Sagittal, and Coronal plane. In the normal brain category, this dataset contains about a hundred brain structure parts with labeling Both normal and abnormal brain images of the selected dataset are incorporated in simulation to achieve statistical and visual results. This dataset intends to carry out a wide range of neuroanatomy, focusing on the anatomy of many emerging central nervous system diseases. A variety of brain abnormalities when working to show them. This dataset contains several substantial examples of some brain conditions and various combinations of imaging modalities and frequency of imaging. The Harvard dataset is further classified into four sets: Normal brain images, Cerebral Toxoplasmosis disease, cerebral hemorrhage diseased brain images, and acute stroke disease brain images.
The image quality assessment metrics such as Mutual information (MI), Peak Signal to Noise Ratio (PSNR), Structural Similarity Index Metric (SSIM), Feature Mutual Information (FMI), Root Mean Square Error (RMSE), and Normalize Cross-Correlation (NCC) are computed for validation of the proposed model. MI determines the mutual combination of information between source images and resultant registered or fused images [30]. The MI between source and resultant images will be zero if the source and result images are independent [31,32]. If the MI is higher, then more information present between source and resultant images. The formula to determine MI is given below.
where MIxy is the mutual information between source and resultant image, Hx is a joint entropy of image X and Hy is a joint entropy of image Y, Hxy is a joint entropy of image X and Y. Similarly, Eq. (7) describes MI of the fused image. PSNR is a quantitative measure based on the RMSE. PSNR computes the ratio of the number of intensities level in the medical images to the related pixels in the resultant image. A higher value of PSNR shows superior image fusion or registration.
where
FMI calculates features in the resultant fused image. It calculates the number of edges, curves, and other features transferred from source images to the resultant fused image. If the value of FMI is higher, then the quality of the resultant fused image is also higher. Mathematically, FMI can be expressed as follows [34].
where FMIF is the features of the resultant image transferred from source images X and Y. FMIFX and FMIFy are the features of image X and Y. RMSE computes the quality of the final fused image by comparing it with the ground truth image. For good fusion results, its value should be nearer to zero [35].
4.3 Multi-Resolution Rigid Registration (MRR) Results
The registration is an initial and important step after preprocessing. The quality of fusion also depends on registration. In multimodal image registration, intensity-based registration is suitable. The two registration methods: SRR and MRR are implemented on the CT and MRI brain images. The reason for selected these methods is that in SRR the time complexity is not an issue and complete image alignment is achieved in a very short time but image alignment and intensities matching are not so good. SRR method sacrifices with image registration quality. On the other hand, the MRR process significantly improves the image quality at the cost of time complexity. Both visual and statistical registration results are demonstrated for comparison and validations. In the fusion process, the MRR images are used as an input of the fusion method.
The visual and statistical results on each set of brain images are computed and evaluated. All the results of image registration and fusion are implemented in MATLAB 2018a software and HP pro-Book 430 G1 Intel Core i3 4010G, CPU 1.7 GHz, 4GB RAM. The MRR and SRR techniques are implemented on four sets of brain images as shown in Figs. 7–10. Each set is divided into a pair of moving and fixed images. In Fig. 7, image (a) contains MR-PD as a moving image and MR-T2 as a fixed image/target image of slice-20. Our target is to align and match different intensities of moving images onto the fixed image and achieved the target images (b) and (c). The image (b) is the resultant image of the SRR (left side) whereas an absolute difference image between resultant registered and fixed image (right side). If the difference of image is less then it means that the source and the target image are perfectly aligned and matched. If the difference is high then it means that the registered image is not perfectly aligned. Similarly, the image (d) contains a pair of MR-PD and MR-T2 slice-35, and the images (e) and (f) are resultant registered images of the SRR and MRR process, respectively. Similarly, the visualization results of single and multi-resolution of Cerebral Toxoplasmosis disease images are shown in Fig. 8.

Figure 7: Multimodal image rigid registration of the normal brain images: (a) Moving MR-PD [left] and fixed MR-T2 [right] Slice-20 brain images (b) SRR resultant [left] and difference image [right] (c) MRR resultant [left] and difference image [right] (d) moving MR-PD [left] and fixed MR-T2 [right] Slice35 (e) SRR resultant [left] and difference image [right] (f) MRR resultant [left] and different image [right]

Figure 8: Multimodal image rigid registration of Cerebral Toxoplasmosis brain disease: (a) Moving CT [left] and fixed MR-T1 [right] Slice-14 (b) SRR resultant [left] and difference image [right] (c) MRR resultant [left] and difference image [right] (d) moving CT [left] and fixed MR-T2 [right] Slice14 (e) SRR resultant [left] and difference image [right] (f) MRR resultant [left] and different image [right]

Figure 9: Multimodal medical image rigid registration of cerebral hemorrhage diseased brain images: (a) Moving MR-T1 [left] and fixed MR-T1 [right] Slice-10 brain image (b) SRR resultant [left] and difference image [right] (c) MRR resultant [left] and difference image [right] (d) Moving MR-T1 [left] and fixed MR-T2 [right] Slice12 (e) SRR resultant [left] and difference image [right] (f) MRR resultant [left] and different image [right]

Figure 10: Multimodal medical image rigid registration of stroke disease brain images: (a) Moving CT [left] and fixed MR-PD [right] Slice-10 (b) SRR resultant [left] and difference image [right] (c) MRR resultant [left] and difference image [right] (d) moving CT [left] and fixed MR-T2 [right] Slice-15 (e) SRR resultant [left] and difference image [right] (f) MRR resultant [left] and difference image [right] (g) moving MR-PD [left] and fixed MR-T2 [right] Slice-15 (h) SRR resultant [left] and difference image [right] (i) MRR resultant [left] and difference image [right]
The visualization results of an SRR and MRR approach on cerebral hemorrhage and acute stroke disease images are shown in Figs. 9, 10, respectively.
To analyze better registration results, the visual results of brain registered images with an absolute difference are shown and it is observed that these results are good for human perception. Besides, statistical results are also computed to show which technique performs better image registration. It is observed that the MRR performs better in most of the cases. Seven registration quality assessment metrics are selected which are MI, CC, SSIM, NCC, Peak SNR, SSD, and RMSE for validation. The computation time of both registration methods is also calculated. The value of MI, CC, SSIM, NCC, and PSNR should be high in case of better registration while the value of SSD, RMSE, and computation time should be lower for better quality image registration. The normal brain image registration statistical results are shown in Tab. 1.
Table 1: SRR and MRR methods comparison on normal brain images

The second set contains brain medical images of Cerebral Toxoplasmosis disease. The MRR method shows good image quality results while computation time is high due to the increase of the iteration level. Tab. 2 shows the statistical results of brain images having Cerebral Toxoplasmosis disease. Similarly, the third section (cerebral hemorrhage disease brain images) and the fourth section (stroke disease brain images) statistical results of the Harvard dataset are shown in Tabs. 3, 4, respectively. It is observed that MRR statistical results are more promising, but the computation time of the MRR method on each dataset is high as compared to the SRR method.
Table 2: SRR and MRR methods comparison on cerebral toxoplasmosis disease brain images

Table 3: SRR and MRR methods on cerebral hemorrhage disease brain images

Table 4: SRR and MRR methods comparison on stroke disease brain images

4.4 DWT-PCAv Image Fusion Results
In the fusion process, the MRR images are used as an input because the resultant image is more accurately registered with its source moving image. The DWT-PCAv method is utilized for the fusion process. The proposed fusion results are compared with recent fusion methods in literature such as Discrete Wavelet Transform using principle component Averaging (DWT-PCA) [36], Guided Image Filter based on Image Statistics (GIF-IS) [37], Fast Filtering Image fusion (FFIF) [34] and Non-Subsampled Contourlet Transform using Phase Congruency (pc-NSCT) [38]. It is observed that the proposed methodology produced better results, which is reflected in the visual and statistical results.
The visual fusion results of normal brain images are shown in Fig. 11. The image (a) is MR-PD and (b) is a registered input image. The image (c) is the different image of the source and registered image and (d)–(g) represent fusion methods that are visually compared with the proposed method. The image (h) shows the fusion result of the proposed method. Similarly, the visual results of set-2 are shown in Fig. 12 while set-3 and set-4 visual results are shown in Fig. 13, 14, respectively.

Figure 11: Visual results of different multimodal medical image fusion methods of pair MR-PD and MRT2 slice-20 (a) MRPD-20 (b) MRT2-20 (c) difference image (d) DWT-PCA [36] (e) GIF-IS [37] (f) FFIF [38] (g) PC-NSCT [39] (h) proposed method

Figure 12: Visual results of different multimodal medical image fusion methods of pair CT and MR-T1 slice 14, (a) CT-14 (b) MRT1-14 (c) difference image (d) DWT-PCA [36] (e) GIF-IS [37] (f) FFIF [38] (g) PC-NSCT [39] (h) proposed method

Figure 13: Visual results of different multimodal medical image fusion methods of pair MR-T1 and MR-T2 slice 10, (a) MRT1-10 (b) MRT2-10 (c) difference image (d) DWT-PCA [36] (e) GIF-IS [37] (f) FFIF [38] (g) PC-NSCT [39] (h) proposed method

Figure 14: Visual results of different multimodal medical image fusion methods of pair CT and MR-T2 slice 15, (a) CT-15 (b) MRT2-15 (c) difference image (d) DWT-PCA [36] (e) GIF-IS [37] (f) FFIF [38] (g) PC-NSCT [39] (h) proposed method
The visual results of the proposed method are better than other compared methods. In Tab. 5, the evaluation parameters: MIF, CC, SSIM, NCC, PSNR, and computation time are selected to compare the statistical results of the proposed method with state-of-the-art fusion methods. It is observed that the proposed methodology gives promising results in most of the cases.
Table 5: Image fusion quality assessment results of different multimodal fusion methods

The value of each fusion quality assessment metric should be high for better image fusion results except for computation time. The low value of computation time is required for better fusion. Most of the existing fusion techniques are computationally expensive. In the proposed methodology, the computation time is less when compared with other existing techniques. Tab. 6 shows the values of the computation time of four selected pairs of a dataset. The computation time required for performing the image fusion is represented in seconds. It depends on the specification of the hardware, software, and the parameters of the algorithm. The selected methods are tested on the same software and hardware.
Table 6: Values of the computation time of four selected pairs of a dataset

5 Conclusion and Future Direction
In the proposed methodology, MRR and DWT-PCAv techniques are presented. The proposed MRR overcomes the limitation of the SRR. The SRR is a time-efficient approach but having the drawback of a miss-registration. The registered image of MRR is used as an input of the fusion step. PCAv fusion technique improves the quality of an image by fusing two brain images with the preservation of valuable information. The other advantage of PCAv fusion is that it is time-efficient. The proposed methodology is implemented on four sets of brain images in which one set contains normal brain images while the other three sets contain abnormal brain images. The proposed methodology is compared with existing fusion methods. The image registration and fusion results are shown both visually and statistically. It is observed that the proposed methodology gives promising results as compared with other existing methods. The researchers can work further in this field on non-rigid registration and extend this work to other imaging modalities such as PET, SPECT, etc. Furthermore, researchers can diagnose many recent brain diseases to identify the patient’s condition at the early stages. This research work can be easily combined with machine learning models such as fast and compact 3-D Convolutaional Neural Networks [40] for obtaining better results. The state-of-the-art-work can be implemented in some current diseases such as COVID-19 and its impact on brain psychology.
Funding Statement: The authors received no specific funding for this study.
Conflicts of Interest: The authors declare that they have no conflicts of interest to report regarding the present study.
1. A. P. James and B. V. Dasarathy. (2014). “Medical image fusion: A survey of the state of the art,” Information Fusion, vol. 19, no. 3, pp. 4–19. [Google Scholar]
2. L. Yang, B. L. Guo and W. Ni. (2008). “Multimodality medical image fusion based on multiscale geometric analysis of contourlet transform,” Neurocomputing, vol. 72, no. 1–3, pp. 203–211. [Google Scholar]
3. R. Singh, M. Vatsa and A. Noore. (2009). “Multimodal medical image fusion using redundant discrete wavelet transform,” in Proc. 7th Int. Conf. Adv. Pattern Recognition, Kolkata, India, pp. 232–235. [Google Scholar]
4. O. B. Ahmed, J. B. Pineau, M. Allard, G. Catheline, C. B. Amar et al. (2017). , “Recognition of Alzheimer’s disease and mild cognitive impairment with multimodal image-derived biomarkers and multiple kernel learning,” Neurocomputing, vol. 220, no. 4, pp. 98–110. [Google Scholar]
5. M. Piccinelli, D. C. Cooke and E. V. Garcia. (2018). “Multimodality image fusion for coronary artery disease detection,” Annals of Nuclear Cardiology, vol. 4, no. 1, pp. 74–78. [Google Scholar]
6. K. Gurpreet, S. Singh and R. Vig. (2019). “Medical fusion of CLAHE images using SWT and PCA for brain disease analysis,” in Proc. of 2nd Int. Conf. on Communication, Computing and Networking, Singapore, Springer. [Google Scholar]
7. B. Rajalingam, R. Priya and R. Scholar. (2018). “Review of multimodality medical image fusion using combined transform techniques for clinical application,” International Journal of Scientific Research in Computer Science Applications and Management Studies, vol. 7, no. 3, pp. 1–8. [Google Scholar]
8. Q. Guihong, Z. Dali and Y. Pingfan. (2001). “Medical image fusion by wavelet transform modulus maxima,” Optics Express, vol. 9, no. 4, pp. 184. [Google Scholar]
9. PubMed, [Online]. Available: https://www.ncbi.nlm.nih.gov/pubmed [Accessed: 10 February 2020]. [Google Scholar]
10. A. Das and M. Bhattacharya. (2011). “Affine-based registration of CT and MR modality images of human brain using multiresolution approaches: Comparative study on genetic algorithm and particle swarm optimization,” Neural Computing and Applications, vol. 20, no. 2, pp. 223–237. [Google Scholar]
11. A. Joshi and V. Bhaskar. (2013). “Multi-resolution approach for medical image registration using genetic algorithm,” in Proc. of Int. Conf. of Communication and Single Processing, Melmaruvathur, India, pp. 612–616. [Google Scholar]
12. J. Leng, G. Xu and Y. Zhang. (2013). “Medical image interpolation based on multi-resolution registration,” Computers & Mathematics with Applications, vol. 66, no. 1, pp. 1–18. [Google Scholar]
13. H. A. Mohammed and M. A. Hassan. (2016). “The image registration techniques for medical imaging (MRI-CT),” American Journal of Biomedical Engineering, vol. 6, no. 2, pp. 53–58. [Google Scholar]
14. S. Nandish, G. Prabhu and K. V. Rajagopal. (2017). “Multiresolution image registration for multimodal brain images and fusion for better neurosurgical planning,” Biomedical Journal, vol. 40, no. 6, pp. 329–338. [Google Scholar]
15. D. A. Palanivel, S. Natarajan and S. Gopalakrishnan. (2019). “Multifractals based multimodal 3D image registration,” Biomedical Signal Processing and Control, vol. 47, pp. 126–136. [Google Scholar]
16. L. L. Presti and M. L. Cascia. (2018). “Multi-modal medical image registration by local affine transformations,” in Proc. 7th Int. Conf. Pattern Recognit. Appl. Methods, Funchal, Portugal, pp. 534–540. [Google Scholar]
17. Z. Cui, S. Mahmoodi, M. Guy, E. Lewis, T. Havelock et al. (2020). , “A general framework in single and multi-modality registration for lung imaging analysis using statistical prior shapes,” Computer Methods and Programs in Biomedicine, vol. 187, no. 2, pp. 105232. [Google Scholar]
18. B. Gaurav, Q. M. J. Wu and Z. Liu. (2013). “Directive contrast based multimodal medical image fusion in NSCT domain,” IEEE Transactions on Multimedia, vol. 15, no. 5, pp. 1014–1024. [Google Scholar]
19. A. Sahu, V. Bhateja, A. Krishn and Himanshi. (2014). “Medical image fusion with Laplacian pyramids,” in Int. Conf. Med. Imaging, m-Health Emerg. Commun. Syst. MedCom, Greater Noida, India, pp. 448–453. [Google Scholar]
20. R. Bashir, R. Junejo, N. N. Qadri, M. Fleury and M. Y. Qadri. (2019). “SWT and PCA image fusion methods for multi-modal imagery,” Multimedia Tools and Applications, vol. 78, no. 2, pp. 1235–1263. [Google Scholar]
21. C. He, Q. Liu, H. Li and H. Wang. (2010). “Multimodal medical image fusion based on IHS and PCA,” Procedia Engineering, vol. 7, no. 2, pp. 280–285. [Google Scholar]
22. L. Yuhui, J. Yang and J. Sun. (2010). “PET/CT medical image fusion algorithm based on multiwavelet transform,” in 2nd Int. Conf. on Advanced Computer Control, Shenyang, China, IEEE, pp. 264–268. [Google Scholar]
23. X. Xu, D. Shan, G. Wang and X. Jiang. (2016). “Multimodal medical image fusion using PCNN optimized by the QPSO algorithm,” Applied Soft Computing, vol. 46, no. 3, pp. 588–595. [Google Scholar]
24. M. Arif and G. Wang. (2020). “Fast curvelet transform through genetic algorithm for multimodal medical image fusion,” Soft Computing, vol. 24, no. 3, pp. 1815–1836. [Google Scholar]
25. S. Maqsood and U. Javed. (2020). “Multi-modal medical image fusion based on two-scale image decomposition and sparse representation,” Biomedical Signal Processing and Control, vol. 57, no. 2, pp. 101810. [Google Scholar]
26. S. Bhattacharya, P. K. R. Maddikunta, Q. V. Pham, T. R. Gadekallu, S. R. Krishnan et al. (2020). , “Deep learning and medical image processing for coronavirus (COVID-19) pandemic: A survey,” Sustainable Cities and Society, vol. 65, pp. 102589. [Google Scholar]
27. T. R. Gadekallu, D. S. Rajput, M. P. K. Reddy, K. Lakshmanna, S. Bhattacharya et al. (2020). , “A novel PCA-whale optimization-based deep neural network model for classification of tomato plant diseases using GPU,” Journal of Real-Time Image Processing, vol. 12, pp. 1–14. [Google Scholar]
28. T. R. Gadekallu, N. Khare, S. Bhattacharya, S. Singh, P. K. R. Maddikunta et al. (2020). , “Deep neural networks to predict diabetic retinopathy,” J. Ambient Intell. Humaniz. Comput., vol. 7, pp. 1–14. [Google Scholar]
29. T. Reddy, S. Bhattacharya, P. K. R. Maddikunta, S. Hakak, W. Z. Khan et al. (2020). , “Antlion re-sampling based deep neural network model for classification of imbalanced multimodal stroke dataset,” Multimedia Tools and Applications, vol. 9, pp. 1–25. [Google Scholar]
30. M. Meenu and R. Sharma. (2016). “A novel method of multimodal medical image fusion using fuzzy transform,” Journal of Visual Communication and Image Representation, vol. 40, pp. 197–217. [Google Scholar]
31. F. Maes, D. Vandermeulen and P. Suetens. (2003). “Medical image registration using mutual information,” Proc. of the IEEE, vol. 91, no. 10, pp. 1699–1722. [Google Scholar]
32. S. D. Ramlal, J. Sachdeva, C. K. Ahuja and N. Khandelwal. (2019). “An improved multimodal medical image fusion scheme based on hybrid combination of nonsubsampled contourlet transform and stationary wavelet transform,” International Journal of Imaging Systems and Technology, vol. 29, no. 2, pp. 146–160. [Google Scholar]
33. X. L. Zhang, Z. F. Liu, Y. Kou, J. B. Dai, Z. M. Cheng et al. (2010). , “Quality assessment of image fusion based on image content and structural similarity,” in 2nd Int. Conf. Inf. Eng. Comput. Sci.—Proc., Wuhan, China. [Google Scholar]
34. M. B. A. Haghighat, A. Aghagolzadeh and H. Seyedarabi. (2011). “A non-reference image fusion metric based on mutual information of image features,” Computers & Electrical Engineering, vol. 37, no. 5, pp. 744–756. [Google Scholar]
35. L. F. Zoran. (2009). “Quality evaluation of multiresolution remote sensing images fusion,” UPB Sci. Bull Series C Electr. Eng., vol. 71, no. 3, pp. 37–52. [Google Scholar]
36. R. Vijayarajan and S. Muttan. (2015). “Discrete wavelet transform based principal component averaging fusion for medical images,” AEU—International Journal of Electronics and Communications, vol. 69, no. 6, pp. 896–902. [Google Scholar]
37. D. P. Bavirisetti, V. Kollu, X. Gang and R. Dhuli. (2017). “Fusion of MRI and CT images using guided image filter and image statistics,” International Journal of Imaging Systems and Technology, vol. 27, no. 3, pp. 227–237. [Google Scholar]
38. K. Zhan, Y. Xie, H. Wang and Y. Min. (2017). “Fast filtering image fusion,” Journal of Electronic Imaging, vol. 26, no. 6, pp. 1. [Google Scholar]
39. Z. Zhu, M. Zheng, G. Qi, D. Wang, Y. Xiang et al. (2019). , “A phase congruency and local laplacian energy-based multi-modality medical image fusion method in NSCT domain,” IEEE Access, vol. 7, pp. 20811–20824. [Google Scholar]
40. M. Ahmad, A. M. Khan, M. Mazzara, S. Distefano, M. Ali et al. (2020). , “A fast and compact 3-D CNN for hyperspectral image classification,” IEEE Geoscience and Remote Sensing Letters, pp. 1–5, . https://doi.org/10.1109/LGRS.2020.3043710. [Google Scholar]
 | This work is licensed under a Creative Commons Attribution 4.0 International License, which permits unrestricted use, distribution, and reproduction in any medium, provided the original work is properly cited. |