DOI:10.32604/cmc.2021.016264
| Computers, Materials & Continua DOI:10.32604/cmc.2021.016264 | |
| Article |
Developing a Recognition System for Classifying COVID-19 Using a Convolutional Neural Network Algorithm
1College of Computer Science and Information Technology, King Faisal University, Al-Ahsa, Saudi Arabia
2Community College of Abqaiq, King Faisal University, Al-Ahsa, Saudi
3Deanship of E-Learning and Distance Education King Faisal University Saudi Arabia, Al-Ahsa, Saudi Arabia
*Corresponding Author: Theyazn H. H. Aldhyani. Email: taldhyani@kfu.edu.sa
Received: 28 December 2020; Accepted: 10 February 2021
Abstract: The COVID-19 pandemic poses an additional serious public health threat due to little or no pre-existing human immunity, and developing a system to identify COVID-19 in its early stages will save millions of lives. This study applied support vector machine (SVM), k-nearest neighbor (K-NN) and deep learning convolutional neural network (CNN) algorithms to classify and detect COVID-19 using chest X-ray radiographs. To test the proposed system, chest X-ray radiographs and CT images were collected from different standard databases, which contained 95 normal images, 140 COVID-19 images and 10 SARS images. Two scenarios were considered to develop a system for predicting COVID-19. In the first scenario, the Gaussian filter was applied to remove noise from the chest X-ray radiograph images, and then the adaptive region growing technique was used to segment the region of interest from the chest X-ray radiographs. After segmentation, a hybrid feature extraction composed of 2D-DWT and gray level co-occurrence matrix was utilized to extract the features significant for detecting COVID-19. These features were processed using SVM and K-NN. In the second scenario, a CNN transfer model (ResNet 50) was used to detect COVID-19. The system was examined and evaluated through multiclass statistical analysis, and the empirical results of the analysis found significant values of 97.14%, 99.34%, 99.26%, 99.26% and 99.40% for accuracy, specificity, sensitivity, recall and AUC, respectively. Thus, the CNN model showed significant success; it achieved optimal accuracy, effectiveness and robustness for detecting COVID-19.
Keywords: Machine-learning algorithm; recognition system; COVID-19; convolutional neural network
Coronaviruses comprise a large number of virus species that may cause diseases in animals and humans (see Fig. 1). A number of these viruses cause respiratory infections in humans, ranging from common colds to more severe diseases, such as Middle East Respiratory Syndrome (MERS) and Severe Acute Respiratory Syndrome (SARS). The recently discovered infectious disease known as COVID-19, which emerged in an outbreak in Wuhan, China, in December 19, has spread throughout the world [1] and is regarded as a significant threat to global health.
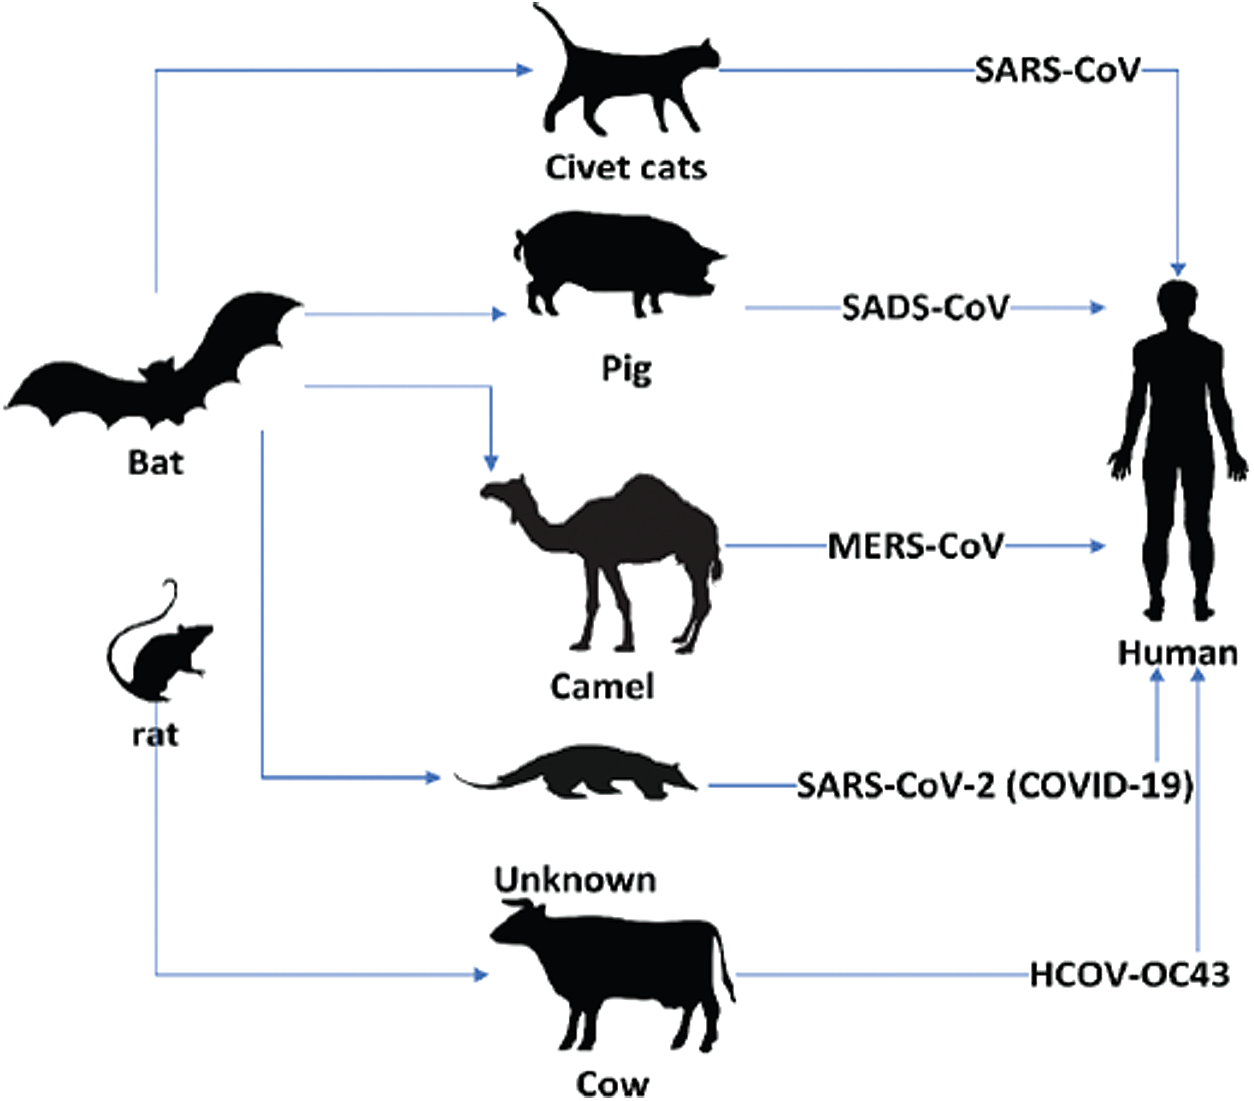
Figure 1: Transmission of coronaviruses from animals to humans
The most common symptoms of COVID-19 are fever, fatigue and dry cough. Some patients may also experience pain, nasal congestion, chills, sore throat and/or diarrhea, while some may become infected with the virus without showing any symptoms. The symptoms of COVID-19 are usually mild and develop gradually, and most people (80%) are likely to recover from the disease without the need for special treatment. Approximately one in six people infected with COVID-19 develop severe symptoms.
People can become infected with COVID-19 via physical contact with other infected people. The disease is transmitted from one person to another via small droplets that become airborne when the infected person coughs or sneezes. These droplets fall on objects and surfaces surrounding the infected person, and people who touch these objects or surfaces and then touch their eyes, nose or mouth can become infected with COVID-19. People can also develop COVID-19 if they inhale airborne droplets.
Numerous machine learning algorithms have been implemented to enhance the healthcare system’s recognition of diseases. Biomedical images from different devices, such as X-ray, computed tomography (CT), magnetic resonance imaging (MRI) and positron emission tomography (PET) provide important information [2] differentiating normal and abnormal patients. This information is extracted from the images, and then machine learning algorithms are used to identify diseases and infections based on the information.
Deep learning has been applied in modeling, pattern recognition, signal processing [3], computer vision [4], speech recognition [5], language recognition [6,7], audio recognition [8] and face recognition [9]. Researchers have used machine learning and deep learning to develop healthcare systems, such as health informatics systems [10]; one-dimensional systems for biosignal analysis [11]; systems that predict health events, such as seizures [12] and cardiac diseases [13], by using historical data; computer-aided detection systems [14]; diagnosis systems [15]; and drug detection systems [16].
For example, Kayaer et al. [17] developed a diabetes diagnostic system using various artificial neural networks (ANN), radial basis function (RBF) and a general downward neural network (GRNN). The GRNN performance was high compared to that of the A multilayer perceptron (MLP) and RBF. Timurtas et al. [18] designed a BD diagnostic system with multilayer neural network architecture by employing the Levenberg–Marquardt (LM) algorithm and a neural network structure to distinguish people with diabetes from those who are healthy. They used the cross-checking method to validate their proposed system. Polat et al. [19] designed a two-stage diagnostic system with an accuracy of 89.47%. In the first stage, input features are reduced by a specific algorithm in order to analyze the main components. In the second stage, an adaptive neuromodulator system is used to diagnose chronic diseases. Sagir et al. [20] proposed an intelligent system for diagnosing diabetes using a mysterious network inference system. Humar et al. [21] introduced a hybrid neural network system to develop a system for predicting DBD, while Kemal et al. [22] utilized generalization discriminant analysis (GDA) and least square support vectors machine (LS-SVM) to diagnose diabetes. The present study aimed to detect and classify COVID-19 automatically using machine learning and a convolutional neural network (CNN). Three machine learning algorithms and a deep learning algorithm were used to develop a system to detect COVID-19. The novelty of the research was as follows:
1. Developing system that can detect COVID-19, and recognition for helping the official health.
2. Determining the appropriate algorithms to detect COVID-19.
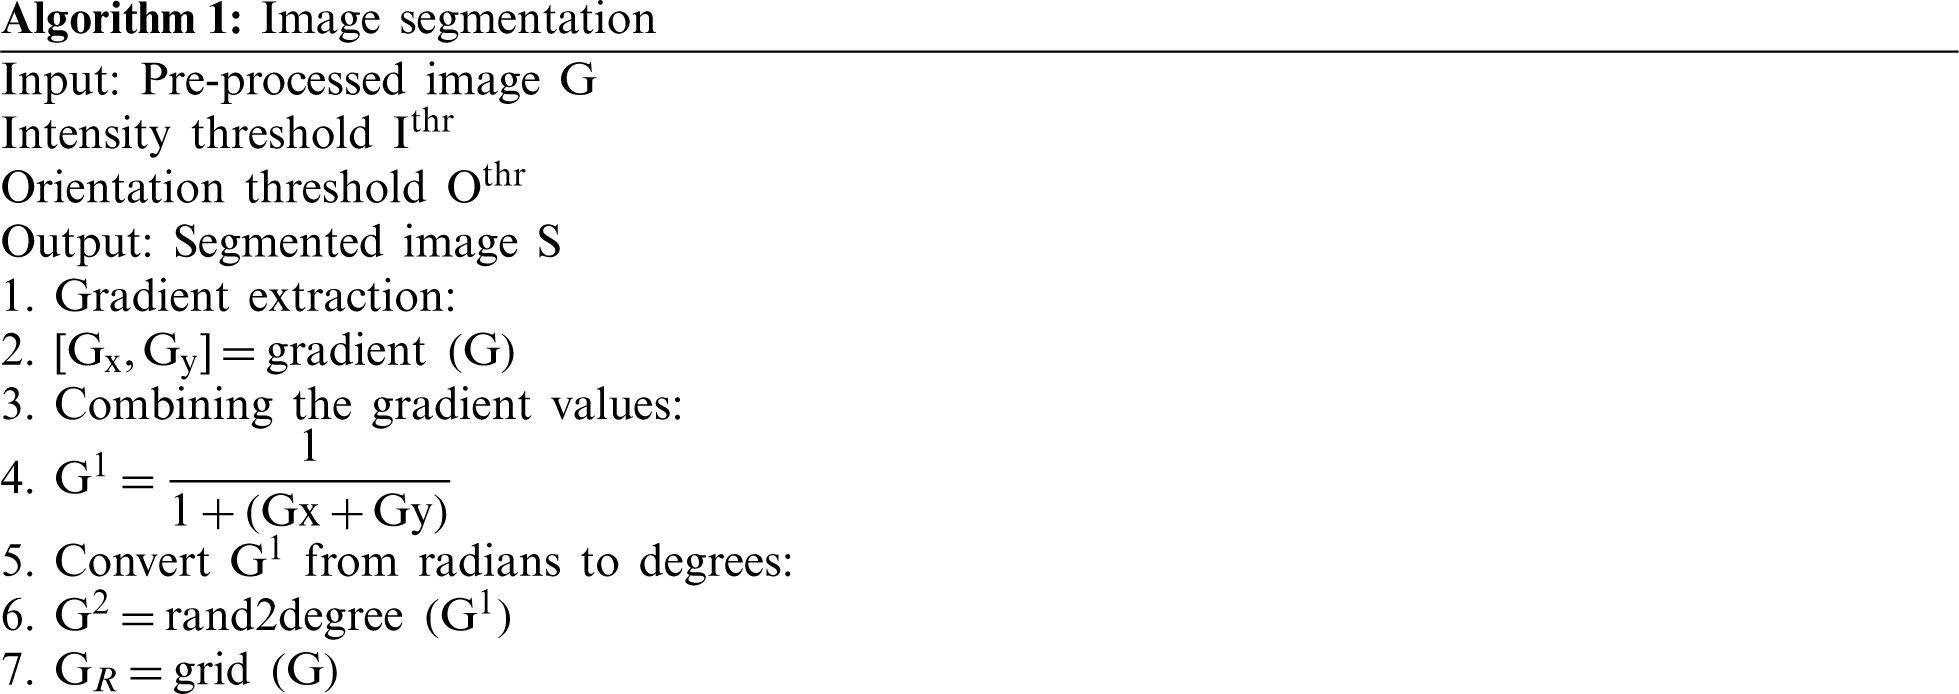
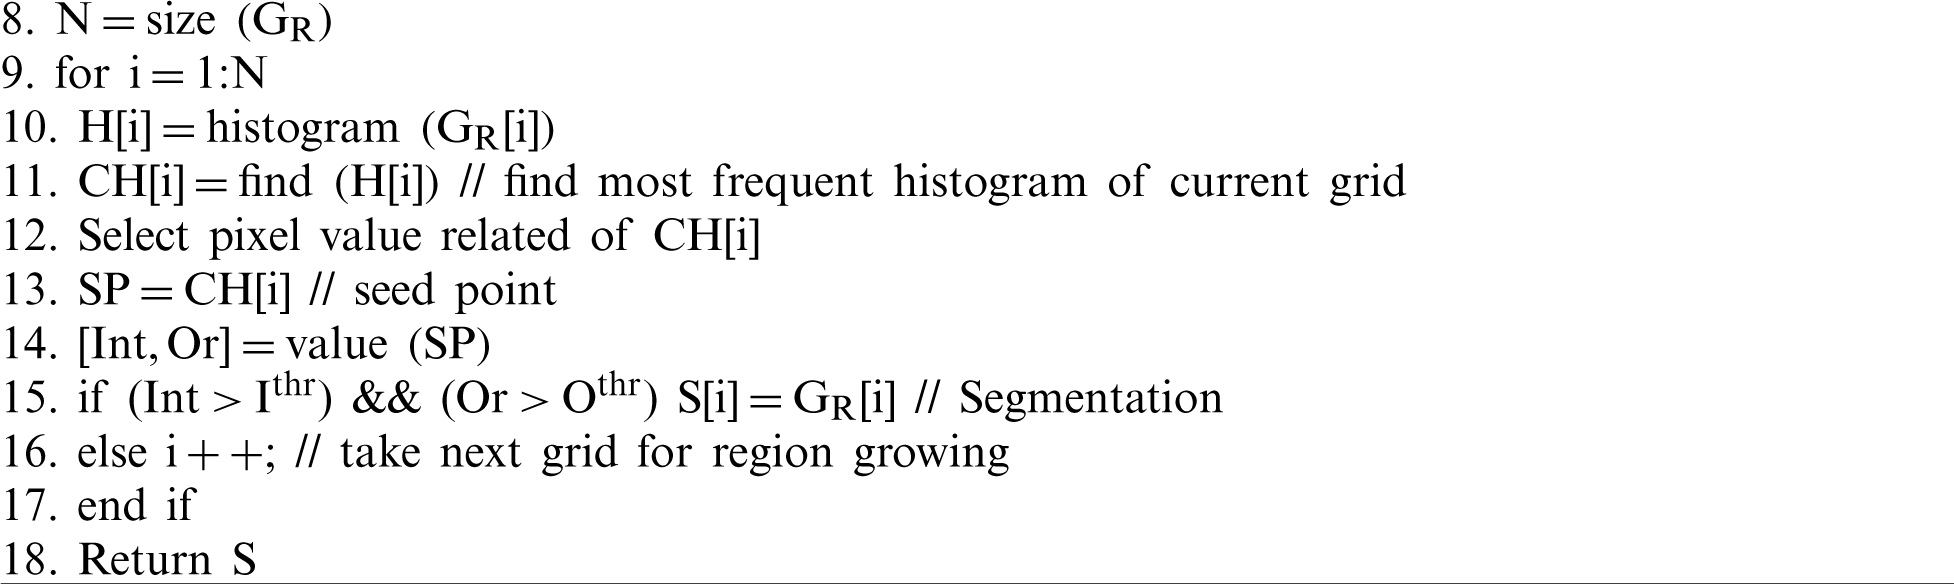
Fig. 2 displays the framework of the proposed system for detecting and classifying COVID-19. Standard datasets for patients diagnosed with COVID-19, those diagnosed with SARS, and normal patients were gathered. The Gaussian filter was applied to eliminate noise from the COVID-19 images. The proposed study was based on two scenarios. In the first scenario, the region-growing algorithm was used to segment the region of interest (ROI) from the COVID-19 images. Then, a hybrid-feature extraction namely, gray level co-occurrence matrix (GLCM), gradient and wavelet transform methods was implemented to extract significant features. These features were then processed by classifying algorithms (SVM and k-nearest neighbour [K-NN]). In the second scenario, a deep learning algorithm (CNN) was implemented to classify COVID-19.
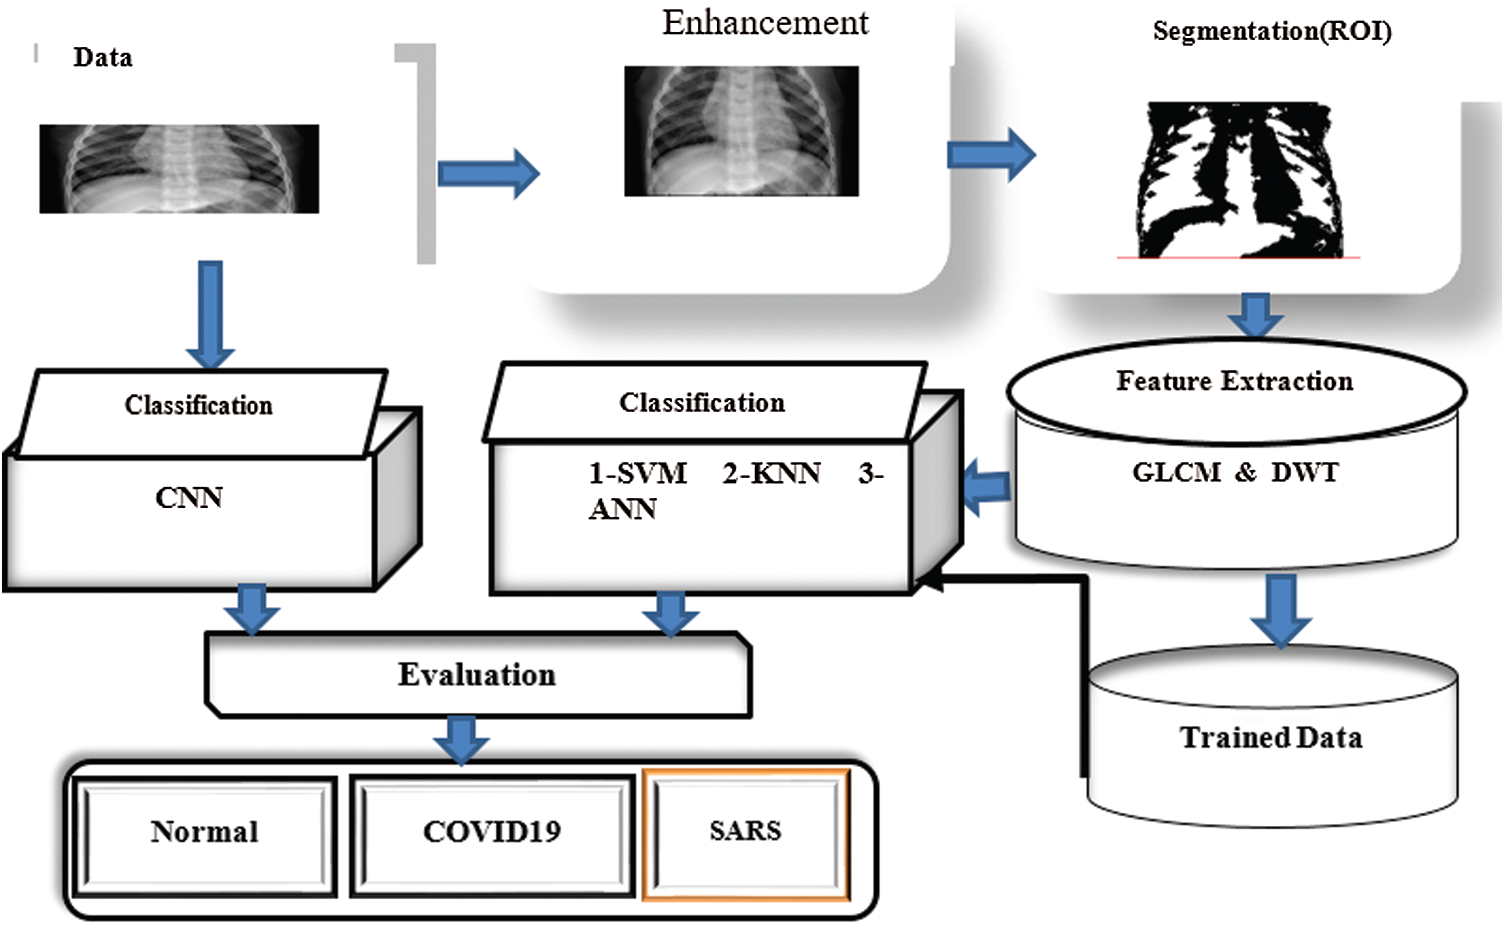
Figure 2: Framework of proposed system
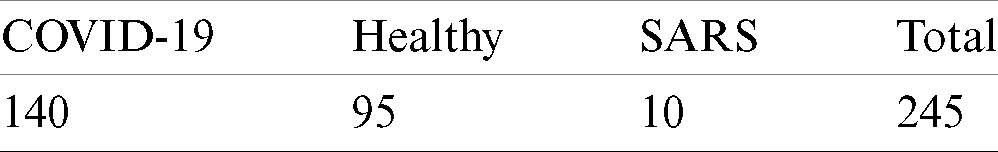
The experiments were performed on the chest X-ray/CT images of 140 COVID-19 patients, 10 SARS patients and 95 normal patients. The datasets of COVID-19 and SARS images were sourced from sourced from GitHub, where they were uploaded by Dr. Joseph Cohen, while the normal images were obtained from a Kaggle repository called “Chest X-Ray Images (Pneumonia)” [21]. Tab. 1 summarizes the research datasets, and Fig. 3 provides a sample of the dataset images.
The primary purpose of the preprocessing stages was to suppress any distortions in the images, thereby improving the ability to obtain significant features. Furthermore, the preprocessing steps were important for improving poor contrast and high noise levels. A detailed description of these preprocessing stages is given below.
The Gaussian filter technique was used to enhance the quality of the images by removing the distortions and blurring. The Gaussian function was computed using Eq. (1), as follows:
where x is the distance from the origin in the horizontal axis, y is the distance from the origin in the vertical axis, and
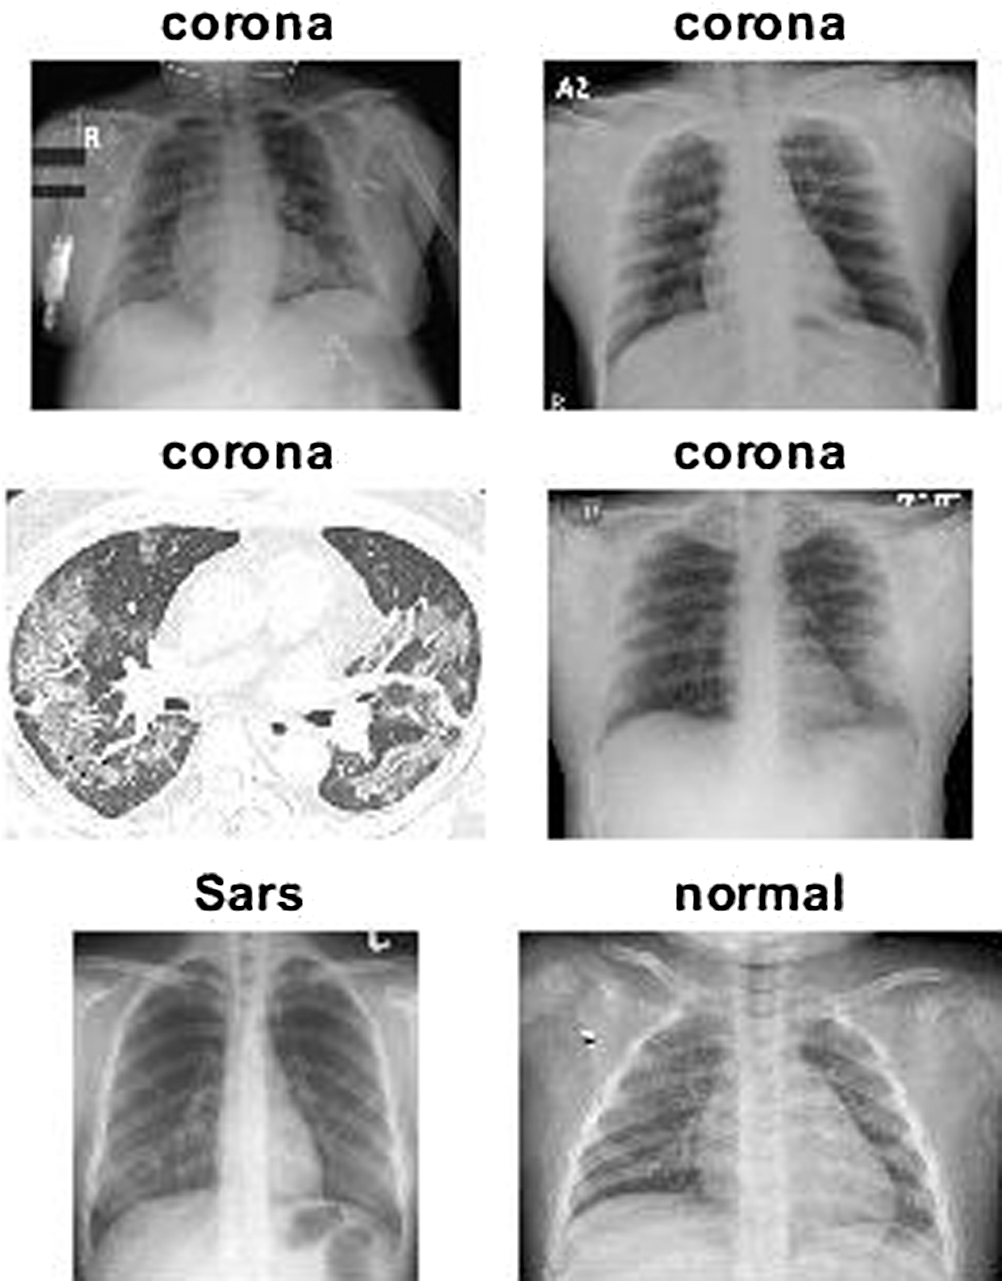
Figure 3: Sample of standard datasets
Morphological segmentation was used to enhance the quality of the segmentation. When COVID-19 images are segmented, small blobs that are not skin lesions are left behind. To obtain the appropriate information from the images, these small blobs must be removed. Morphological segmentation, or over-segmentation, avoids confusion between isolated artifacts and objects of interest by preventing the detection of tremendously small non-lesions. Thus, morphological segmentation was used to remove extremely small objects from the binary COVID-19 images while preserving the shape and size of the larger objects. Fig. 3 shows the stages of the segmentation method through which the morphological method extracts and isolates the shape with the largest area.
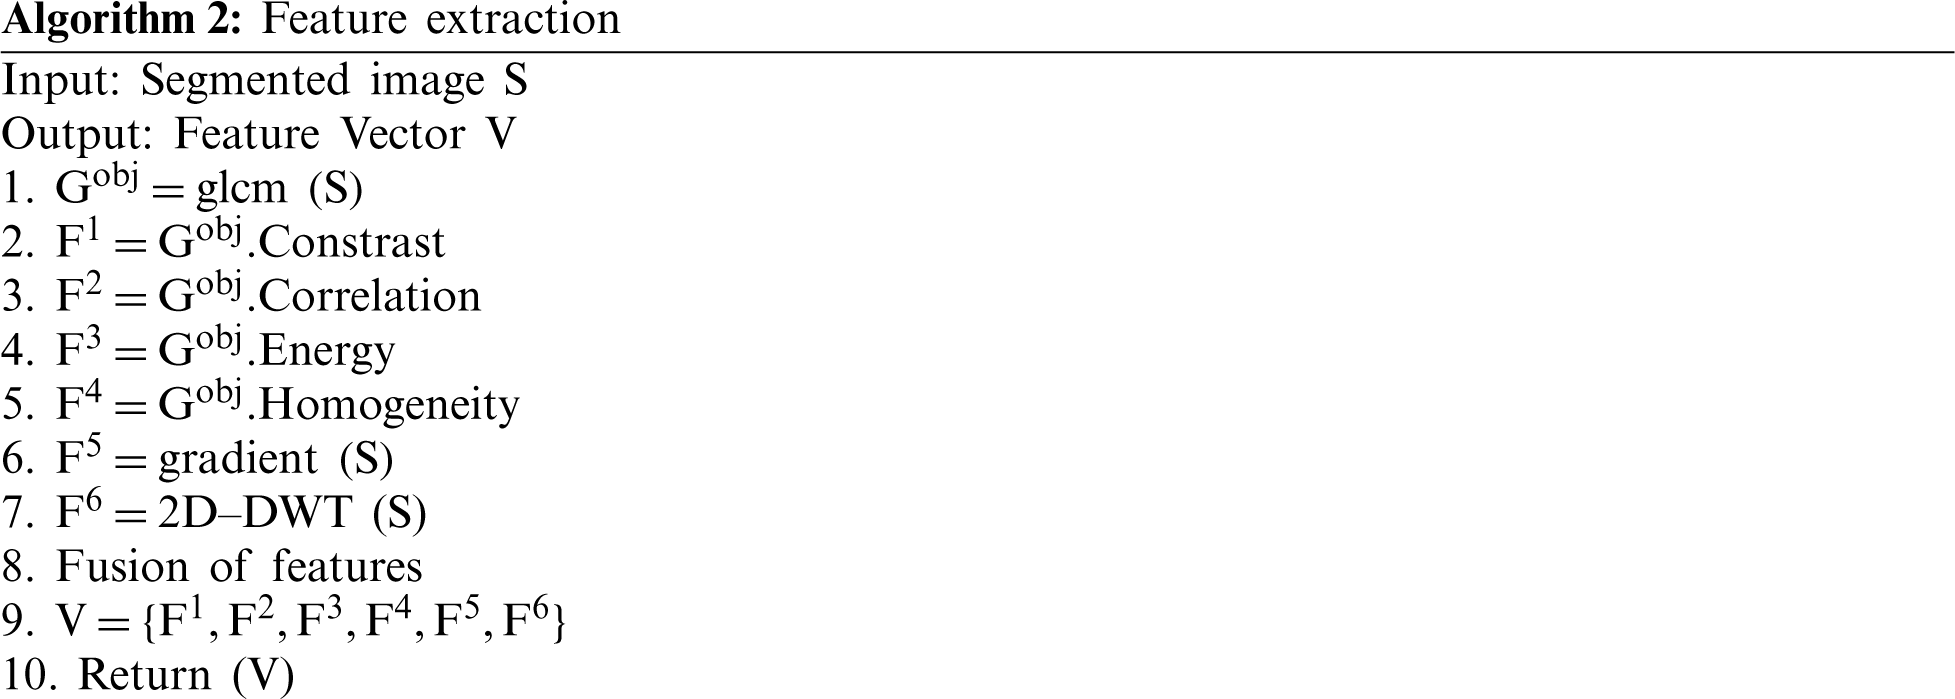
2.3 Features Extraction Methods
2.3.1 Gray Level Co-Occurrence Matrix (GLCM)
GLCM is a feature extraction method that uses statistical analysis to extract the significant features from biomedical images; it was used in this study to extract texture features from the COVID-19 images. Five statistical analysis methods—contrast, correlation, energy, homogeneity and mean were used to obtain the important features. Mean was used to measure the average intensity of the COVID-19 images’ pixels and was defined as follows:
Energy was used to normalize the histogram of the COVID-19 image pixels using Eq. (3):
Contrast was used to measure the local intensity variance of the COVID-19 image pixels, as follows:
Homogeneity was utilized to measure the uniformity of COVID-19 image pixels, as defined by Eq. (5):
Correlation was used to measure the gray level dependency distribution, as follows:
where x and y are the location of pixels in the cell; m and n are the number of columns and rows, respectively;
:
The gradient is a vector quantity comprised of magnitude and direction; gradient is computed by applying the gradient method, its derivations both horizontally and vertically. A Prewitt operator was used to detect the edge for extracting the vector values (Fig. 4). This operator employs the external values of the gray variations of each point around the images’ pixels to detect the edge.
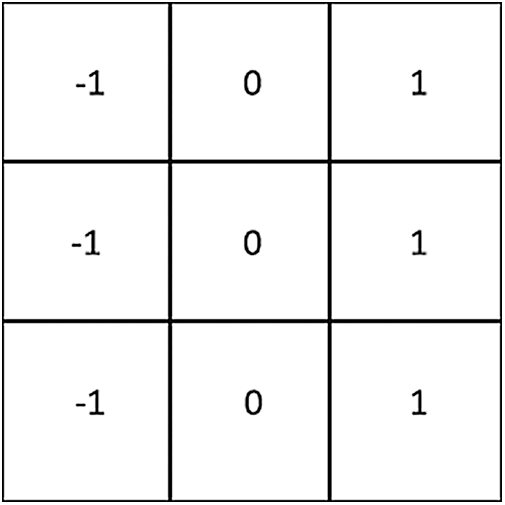
Figure 4: The Prewitt operator mask
If p is the original image,
2.4.1 Discrete Wavelet Transform (DWT) Method
Accounting for the dyadic dimensions and positions, the DWT method is more efficient of the wavelet transform. Fig. 5 shows the wavelet decomposition procedures, with 4 sub-band images (HH, HL, LL and LH) representing each size of data. For the present study, the LL sub-band was the destination for extracting image features. This sub-band is the estimation component, whereas HH, H and HL consider the specific elements of an image. Level 3 decomposition of Harr wavelets was used to extract features from the images.
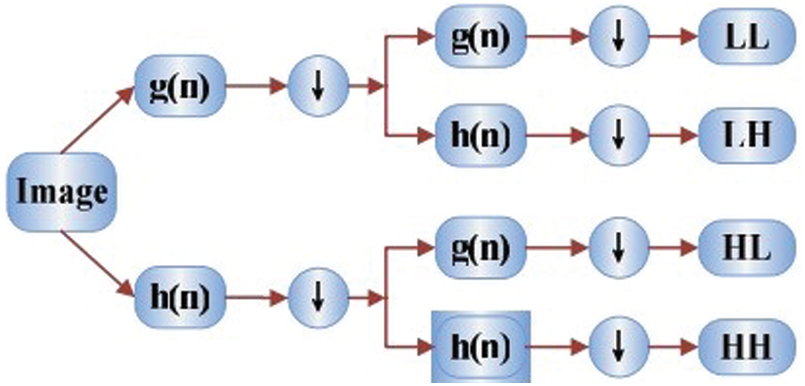
Figure 5: Wavelet decomposition procedures
:
In this section, classification algorithms are presented.
2.5.1 Support Vector Machine (SVM)
The SVM algorithm, a powerful machine learning algorithm used for classification and regression, was introduced by Vapnik [23]. The SVM algorithm is used for dichotomist classification, such as binary classification with two classes or with multiple classes. The algorithm is applied to the training dataset to derive a classification model that allows an optimal decision function; it maps the non-linear separable data from a lower dimension into a higher dimensional space. The SVM algorithm classifies the data by finding the hyper-plane that differentiates two classes of the data.
When a large margin is set, the SVM algorithm achieves a lower error rate. In the current study, three classifications COVID-19, SARS and normal were adopted to develop the proposed model to detect COVID-19. All types of kernel functions were applied to classify the chronic disease datasets; of these, RBF and the kernel function obtained high accuracy.
where
2.5.2 K-Nearest Neighbor (K-NN) Classification Algorithm
K-NN is a non-parametric algorithm and is known as a “lazy algorithm” because of its low complexity compared to other classification algorithms. The K-NN algorithm uses its nearest neighbor features to classify the data. The algorithm employs the Euclidean distance method to find the closest point between the features, as follows:
where
Part of machine learning, deep learning is concerned with techniques that simulate the neural system of the human brain. Using algorithms, deep learning simulates inference and data extraction, and it contains hidden layers of mathematical functions that analyze specific patterns in particular data [24]. Deep learning has gained importance in classifying and detecting images and videos and has a variety of uses, both in the medical field (for X-ray recognition) and in computer vision applications. Applications of deep learning in the medical field improve image quality and the prediction of different types of diseases [25,26]. Tab. 2 presents some of the most important contributions of the neural network in deep learning [27].
Convolutional neural networks (CNN) are a type of ANN [28] and are the most common deep learning algorithm; they are feed-forward ANN that possess a number of functions (1) [29]. For example, CNN and CNN have been implemented in various fields, including science [30], agriculture [31], geology [32], manufacturing [33], transportation [34], civil engineering [35] and construction [36,37]. For signal and image processing, such methods are commonly used to classify objects and perform ROI detection and segmentation. A CNN consisting of four layers—the input, convolution, polling, and connected layers—was used to extract features from the COVID-19 images. The structure of the CNN is shown in Fig. 6.
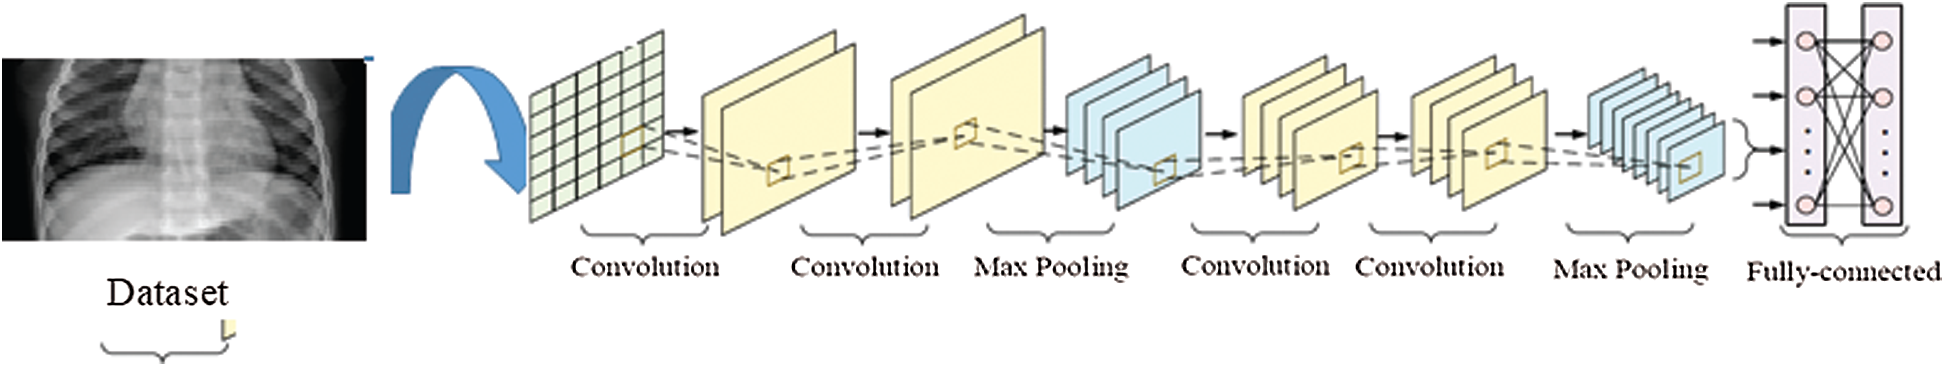
Figure 6: Structure of the convolutional neural network (CNN)
The operation of the CNN was as follows:
a) Input layer: This layer was used for inputting the COVID-19 images and extract the label of the images from the dataset. It also normalized data scaling to speed up the training dataset. This layer was used as a preprocessing step to increase accuracy.
b) Convolution layer: This layer was used to map the features from the convolution layer nonlinearly into the multilayer network layer to obtain better results. This layer used an activation function called the rectified linear unit (ReLU) that was applied to the output of the previous layer. The ReLU function was defined as the positive part of its argument, as follows:
c) MaxPooling layer: This layer was important for improving the training data by decreasing the dimensionality and compression of the data, thereby increasing the accuracy of the classification. This layer performed down-sampling along the spatial dimensionality of the given input, which reduced the number of parameters within that activation.
d) Fully connected layer: This layer computed the output of neurons related to local parts of the input by computing a dot product between their weights and a small region that connected them to the input volume. ReLU was applied to the output of the previous layer’s activation.
CNN have various transfer models, such as Alexnet, Googlenet, ResNet 18 and ResNet 50, that are used to train data. The current study used two transfer layers to predict COVID-19, including ResNet 50.
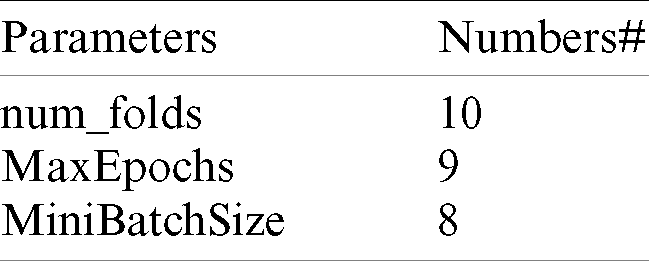
The ResNet models developed by He et al. [38] are powerful for transferring the learning models of CNN for classification, and these models have good convergence and compelling accuracy. These models were built with different numbers of layers—18, 34, 50, 101, 152 and 1202. These layers provide the ResNet more efficiency and accuracy. ResNet transfer learning models are similar to VGG net [39] but are eight times deeper [40–45]; the ResNet 50 consists of 49 convolutional layers and a fully-connected layer at the end of the network and was more appropriate for classifying COVID-19. Tab. 2 shows the parameters of the ResNet 50 that were significant for developing a system to predict COVID-19.
Table 2: Parameters of ResNet 50 parameters
Statistical analysis metrics were used to evaluate the suggested model for classification and detection of COVID-19. Evaluation metrics (i.e., accuracy, specificity, sensitivity and recall) were employed and were computed as follows:
where TP is the true positive, TN is the true negative, FP is the false positive, and FN is the false negative.
The image processing toolbox in MATLAB was used to evaluate the system. The simulation was conducted with an I5 processor and 4 GB RAM. To develop the machine learning algorithm, the data were divided into a training group (80%) and a test group (20%). CNN K-Fold cross validation was utilized to test the proposed model. Two experiments were performed.
This section demonstrates the findings of the two machine learning algorithms (i.e., SVM and KNN) that were used to recognized and detect COVID-19 in significant features of images extracted by GLCM, gradient and DWT. Tab. 3 and Fig. 7 summarize the results. The KNN classifier showed the worst performance for accuracy, with an accuracy, sensitivity, specificity and recall of 88%, 83.33%, 90.63% and 90.63%. Comparatively, the accuracy, sensitivity, specify and recall of the SVM were 80%, 66.67%, 89.66% and 89.66 %, respectively. Thus, the results of the machine learning algorithms were satisfactory.
Table 3: Empirical results of the proposed system
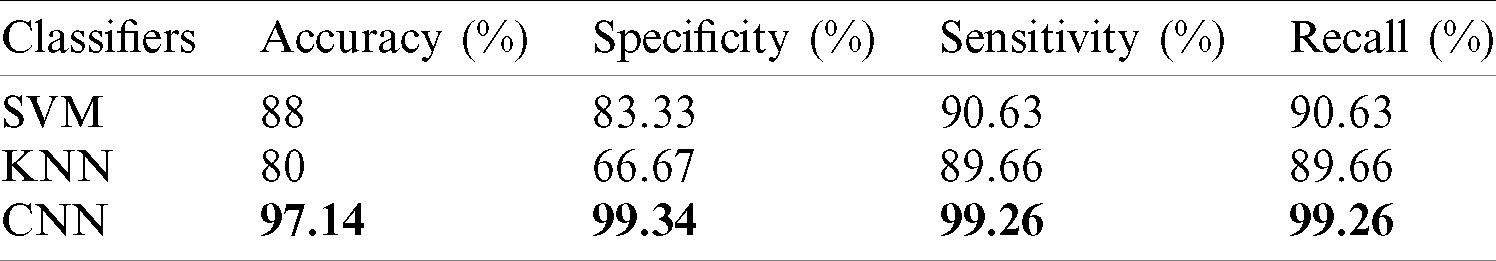
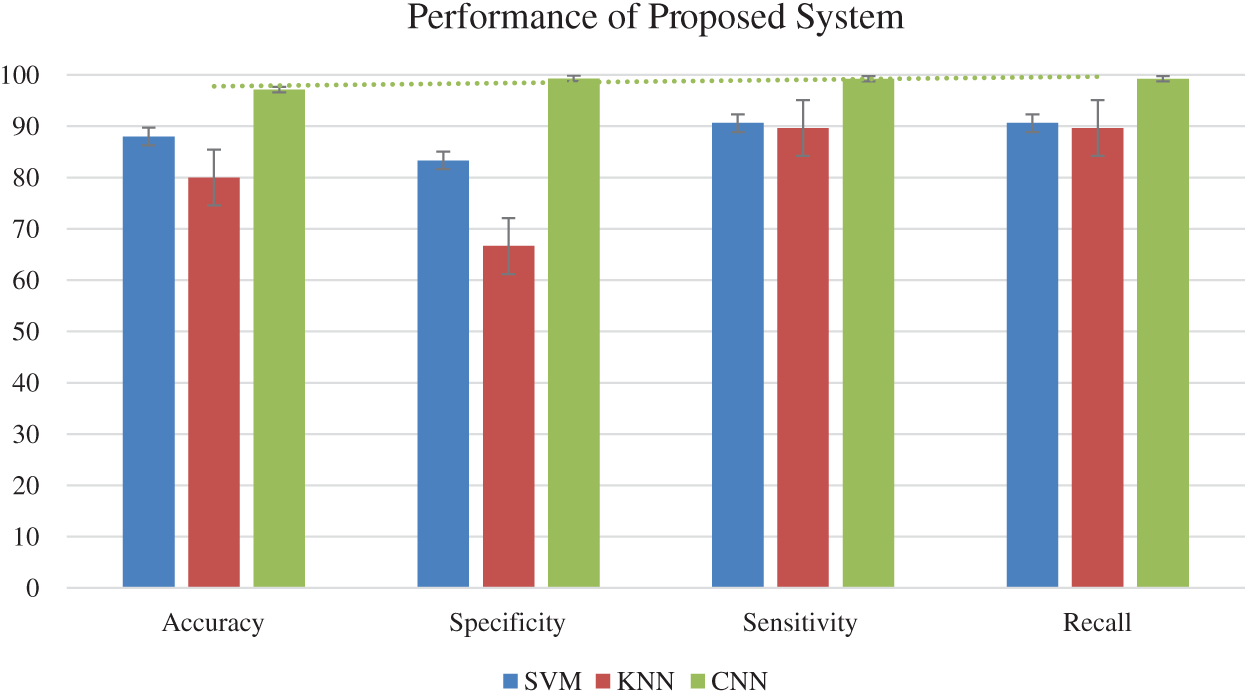
Figure 7: Performance of the proposed system
Fig. 8 shows the confusion metric of the ResNet 50 CNN transfer model. The ResNet 50 CNN provided the best performance in predicting COVID-19. To evaluate its performance in classifying COVID-19 images, 10 K-Fold cross validations were used. The results of the CNN ResNet 50 were 97.14% accuracy, 99.34% sensitivity, 99.26% specificity and 99.26% recall. Thus, the results were satisfactory, and the ResNet 50 CNN also had higher accuracy, effectiveness and efficiency than the traditional machine learning algorithms. Of 10 SARS images, 9 were correctly classified, and of 140 COVID-19 images, 134 were correctly classified. Furthermore, out of 95 normal images, 94 were correctly classified. These results indicated that the ResNet50 was the appropriate transfer model for detecting COVID-19.
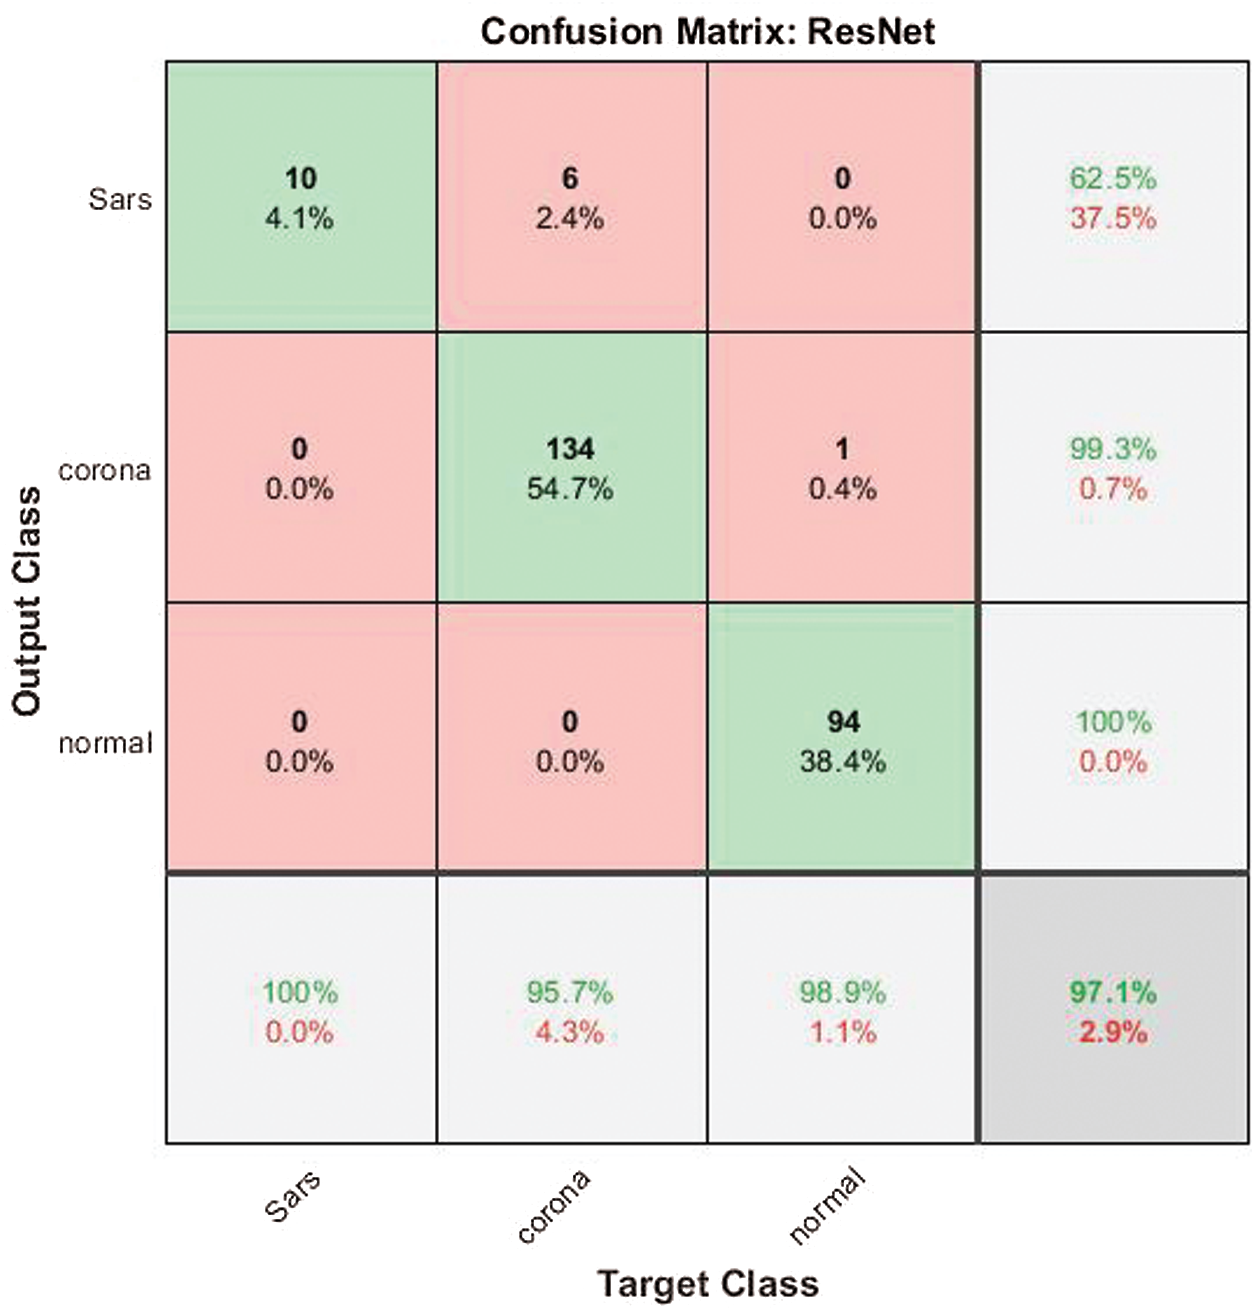
Figure 8: Confusion matrix of the ResNet 50
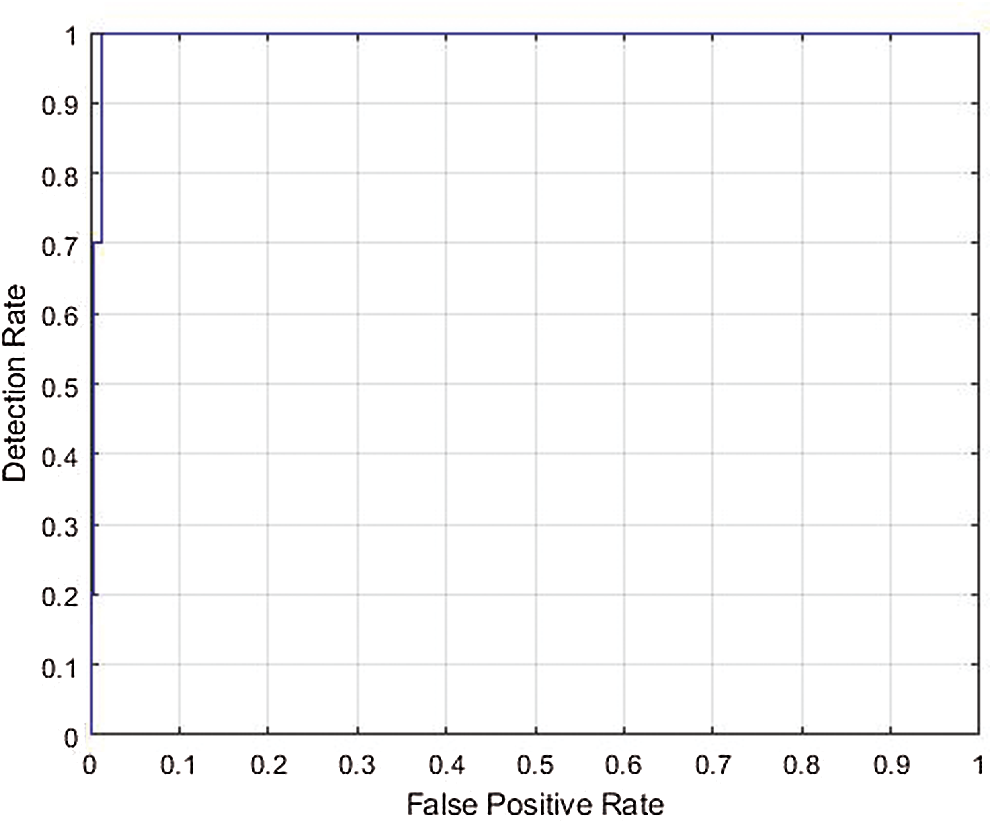
Figure 9: ROC curve for the AUC of ResNet 50
Fig. 9 displays the ROC curve for the AUC stands metric of cross validation 5; as seen in the image, the false positive rate was very low. The blue line shows the detection rate, which was high for the recognition of COVID-19. Thus, the multiclass ROC curve showed that the ResNet 50 model was outstanding, attaining a statistically significant AUC value of 99.40%. This performance indicated that the proposed system provided the most accurate classification, with a false positive (misclassification) rate of only 0.60. Thus, the ResNet 50 CNN can improve the classification of COVID-19 images.
Early detection of COVID-19, before it spreads throughout the human body, is necessary. Therefore, this study simulated and evaluated a proposed model for detecting COVID-19 with three different classifiers: SVM, KNN and CNN. COVID-19, SARS and normal images were collected to test the proposed model, and the study utilized two scenarios to develop the system. In the first, the novel image was presented with a processing-based method for early prediction of COVID-19 using efficient methods, such as pre-processing, region-growing segmentation and deep learning classification. After segmentation, a hybrid feature extraction of DWT, geometric and texture features was applied. The classification was then performed by SVM and KNN learning algorithms. In the second scenario, a CNN algorithm developed using the ResNet 50 transfer model was applied to the classification of COVID-19. Overall, the CNN showed a more efficient performance. The approximate classification for the CNN-based method was 97.14%, which was significantly higher than that of the machine learning approaches. Thus, the findings of this study provide hope that the proposed system will help healthcare systems detect COVID-19.
Funding Statement: The authors received no specific funding for this study.
Conflicts of Interest: The authors declare that they have no conflicts of interest to report regarding the present study.
1. M. A. Mohammed, K. H. Abdulkareem, A. S. Al.Waisy, S. A. Mostafa, S. Alfahdaw et al. (2020). , “Benchmarking methodology for selection of optimal COVID-19 diagnostic model based on entropy and TOPSIS methods,” IEEE Access, vol. 8, no. 1, pp. 99115–99131. [Google Scholar]
2. M. Loey, F. Smarandache and M. Khalifa. (2020). “The lack of chest COVID-19 X-ray dataset: A novel detection model based on gan and deep transfer learning,” Symmetry, vol. 12, no. 14, pp. 1–19. [Google Scholar]
3. T. H. H. Aldhyani, M. Alrasheedi, A. A. Alqarni, M. Y. Alzahrani and A. M. Bamhdi. (2020). “Intelligent hybrid model to enhance time series models for predicting network traffic,” IEEE Access, vol. 8, pp. 130431–130451. [Google Scholar]
4. Y. Bao, Z. Tang and H. Li. (2018). “Computer vision and deep learning-based data anomaly detection method for structural health monitoring,” Struct Health Monit, vol. 18, no. 2, pp. 401–421. [Google Scholar]
5. A. Humayun, M. Hameed, A. Ibrahim, M. Shah, S. H. Khan et al. (2019). “Regularized urdu speech recognition with semi-supervised deep learning,” Applied Sciences, vol. 9, no. 9, pp. 39. [Google Scholar]
6. J. Imran and J. B. Raman. (2020). “Deep motion templates and extreme learning machine for sign language recognition,” Visual Computer, vol. 36, no. 6, pp. 1233–1246. [Google Scholar]
7. S. Ravi, M. Suman, P. V. V. Kishore, K. Kumar and A. Kumar. (2019). “Multi modal spatio temporal co-trained CNNs with single modal testing on RGB-D based sign language gesture recognition,” Computer Languages, vol. 52, no. 1, pp. 88–102. [Google Scholar]
8. S. Al-Emadi, A. A. Ali and A. Mohammad. (2019). “Audio based drone detection and identification using deep learning,” in Proc. of the Int. Wireless Communications & Mobile Computing Conf., Tangier, Morocc, pp. 459. [Google Scholar]
9. P. S. Prasad, R. Pathak, V. K. Gunjan and H. V. R. Rao. (2019). Deep Learning Based Representation for Face Recognition, vol. 570. Berlin, Germany: Springer, pp. 419–424. [Google Scholar]
10. D. Ravi, C. Wong, F. Deligianni, M. Berthelot, J. Andreu-Perez et al. (2017). , “Deep learning for health informatics,” Biomed Health Inform, vol. 21, no. 1, pp. 4–21. [Google Scholar]
11. N. Ganapathy, R. Swaminathan and T. Deserno. (2018). “Deep learning on 1-D biosignals: A taxonomy-based survey,” Yearbook of Medical Informatics, vol. 27, no. 1, pp. 98–109. [Google Scholar]
12. L. Kuhlmann, K. Lehnertz, M. P. Richardson, B. Schelter and H. P. Zaveri. (2018). “Seizure prediction–ready for a new era,” Nature Reviews Neurology, vol. 14, no. 10, pp. 618–630. [Google Scholar]
13. J. M. Kwon, Y. Lee, S. Lee and J. Park. (2018). “An algorithm based on deep learning for predicting in-hospital cardiac arrest,” Journal of the American Heart Association, vol. 13, no. 7, pp. e008678. [Google Scholar]
14. H. C. Shin, H. Roth, L. Lu M.Gao, Z. Xu, I. Nogues et al. (2016). , “Deep convolutional neural networks for computer-aided detection: CNN architectures, dataset characteristics and transfer learning,” IEEE Transaction Medical Imaging, vol. 35, no. 5, pp. 1285–1298. [Google Scholar]
15. K. S. Daniel, M. Goldbaum, W. Cai, C. C. S. Valentim, H. Liang et al. (2018). , “Identifying medical diagnoses and treatable diseases by image-based deep learning,” Cell, vol. 172, no. 5, pp. 1122–1131. [Google Scholar]
16. J. Jimènez, C. M. Skali, G. Martínez-Rosell and G. D. Fabritiis. (2018). “K deep: Protein-ligand absolute binding affinity prediction via 3D nonvolutional neural networks,” Journal of chemical information and modeling, vol. 58, no. 2, pp. 287–296. [Google Scholar]
17. T. H. Aldhyani, A. S. Alshebami and M. Y. Alzhahrani. (2020). “Alzahrani Soft computing model to predict chronic diseases,” Information Science and Engineering, vol. 36, no. 2, pp. 365–376. [Google Scholar]
18. H. Temurtas, N. Yumusak and F. Temurtas. (2009). “A comparative study on diabetes disease diagnosis using neural networks,” Expert Systems with Applications, vol. 36, no. 4, pp. 8610–8615. [Google Scholar]
19. K. Polat and S. S. Güne. (2017). “An expert system approach based on principal component analysis and adaptive neuro-fuzzy inference system to diagnosis of diabetes disease,” Digital Signal Processing, vol. 17, no. 4, pp. 702–710. [Google Scholar]
20. A. M. Sagir and S. Sathasivam. (2017). “Design of a modified adaptive neuro fuzzy inference system classifier for medical diagnosis of pima Indians diabetes,” AIP Conf. Proc., vol. 1870, no. 1, pp. 40048. [Google Scholar]
21. H. Kahramanli and N. Allahverdi. (2008). “Design of a hybrid system for the diabetes and heart diseases,” Expert Systems with Applications, vol. 35, no. 2, pp. 82–89. [Google Scholar]
22. K. Polat, S. S. Güne and A. A. Arslan. (2008). “Cascade learning system for classification of diabetes disease: Generalized discriminant analysis and least square support vector machine,” Expert Systems with Applications, vol. 34, no. 1, pp. 482–487. [Google Scholar]
23. G. Eraslan, Z. Avsec, J. Gagneur and F. J. Theis. (2019). “Deep learning: New computational modelling techniques for genomics,” Nature Reviews Genetics, vol. 20, no. 7, pp. 389–403. [Google Scholar]
24. J. Riordon, D. Sovilj, S. Sanner, D. Sinton and E. W. K. Young. (2019). “Deep learning with microfluidics for biotechnology,” Trends in Biotechnology, vol. 37, no. 3, pp. 310–324. [Google Scholar]
25. A. S. Lundervold and A. Lundervold. (2019). “An overview of deep learning in medical imaging focusing on MRI,” Zeitschrift für Medizinische Physik, vol. 29, no. 2, pp. 102–127. [Google Scholar]
26. A. Maier, C. Syben, T. Lasser and C. Riess. (2019). “A gentle introduction to deep learning in medical image processing,” Zeitschrift für Medizinische Physik, vol. 29, no. 2, pp. 86–101. [Google Scholar]
27. A. Shrestha and A. Mahmood. (2019). “Review of deep learning algorithms and architectures,” IEEE Access, vol. 7, no. 1, pp. 53040–53065. [Google Scholar]
28. T. H. Aldhyani, A. S. Alshebami and M. Y. Alzahrani. (2020). “Soft clustering for enhancing the diagnosis of chronic diseases over machine learning algorithms,” Healthcare Engineering, vol. 2020, no. 4984967, pp. 16. [Google Scholar]
29. D. Rong, L. Xie and Y. Ying. (2019). “Computer vision detection of foreign objects in walnuts using deep learning,” Computers and Electronics in Agriculture, vol. 162, no. 2, pp. 1001–1010. [Google Scholar]
30. O. Durr and B. Sick. (2016). “Single-cell phenotype classification using deep convolutional neural networks,” Journal of Biomolecular Screening, vol. 21, no. 9, pp. 998–1003. [Google Scholar]
31. D. I. Patrício and R. Rieder. (2018). “Computer vision and artificial intelligence in precision agriculture for grain crops: A systematic review,” Computers and Electronics in Agriculture, vol. 153, no. 1, pp. 69–81. [Google Scholar]
32. N. Li, H. Hao, O. Gu, D. Wang and X. Hu. (2017). “A transfer learning method for automatic identification of sandstone microscopic images,” Computers & Geosciences, vol. 103, no. 2, pp. 111–121. [Google Scholar]
33. J. Reis and G. M. Goncalves. (2018). “Laser seam welding optimization using inductive transfer learning with artificial neural networks,” in Proc. of the Emerging Technologies and Factory Automation, Turin, Italy, pp. 646–653. [Google Scholar]
34. A. Zhang, K. C. P. Wang, B. L. E. Yang, X. Dai, Y. Peng et al. (2017). , “Automated pixel-level pavement crack detection on 3d asphalt surfaces using a deep-learning network,” Computer-Aided Civil and Infrastructure Engineering, vol. 32, no. 10, pp. 805–819. [Google Scholar]
35. Y. Xue and Y. Li. (2018). “A fast detection method via region-based fully convolutional neural networks for shield tunnel lining defects,” Computer-Aided Civil and Infrastructure Engineering, vol. 33, no. 8, pp. 638–654. [Google Scholar]
36. L. Ding, W. Fang, H. Luo, P. E. D. Love and B. Zhong. (2018). “A deep hybrid learning model to detect unsafe behavior: Integrating convolution neural networks and long short-term memory,” Automation in Construction, vol. 86, no. 2, pp. 118–124. [Google Scholar]
37. W. Fang, B. Zhong, N. Zhao, P. E. D. Love, H. Luo et al. (2019). , “A deep learning-based approach for mitigating falls from height with computer vision: Convolutional neural network,” Advanced Engineering Informatics, vol. 39, no. 1, pp. 170–1779. [Google Scholar]
38. K. He, X. Zhang, S. Ren and J. Sun. (2016). “Deep residual learning for image recognition,” in Proc. of the IEEE Conf. on Computer Vision and Pattern Recognition, Las Vegas, NV, USA, pp. 770–778. [Google Scholar]
39. T. H. M. Alrasheed, M. H. Al-Adaileh, A. A. Alqarni, M. Y. Alzahraniet al. (2021). “Deep learning and holt-trend algorithms for predicting COVID-19 pandemic,”Computers, Materials & Continua, vol. 67, no. 2, pp. 2141–2160. [Google Scholar]
40. E. C. Too, L. Yujian, S. Njuki and L. Yingchun. (2019). “A comparative study of fine-tuning deep learning models for plant disease identification,” Computers and Electronics in Agriculture, vol. 161, no. 2, pp. 272–279. [Google Scholar]
41. O. I. Khalaf, K. A. Ogudo and M. A. Singh. (2021). “Fuzzy-based optimization technique for the energy and spectrum efficiencies trade-off in cognitive radio-enabled 5G network,” Symmetry, vol. 13, no. 1, pp. 47. [Google Scholar]
42. O. I. Khalaf, F. Ajesh, A. A. Hamad, G. N. Nguyen and D. N. Le. (2020). “Efficient dual-cooperative bait detection scheme for collaborative attackers on mobile ad-hoc networks,” IEEE Access, vol. 8, pp. 227962–227969. [Google Scholar]
43. X. Xiang, Q. Li S. Khana and O. I. Khalaf. (2021). “Urban water resource management for sustainable environment planning using artificial intelligence techniques,” Environmental Impact Assessment Review, vol. 86, no. 19, pp. 106515. [Google Scholar]
44. T. H. H. Aldhyani, M. Al-Yaari, H. Alkahtani and M. Maashi. (2020). “Water quality prediction using artificial intelligence algorithms,” Applied Bionics and Biomechanics, vol. 2020, no. 66593, pp. 14. [Google Scholar]
45. H. Alkahtani, T. H. H. Aldhyani and M. Al-Yaari. (2020). “Adaptive anomaly detection framework model objects in cyberspace,” Applied Bionics and Biomechanics, vol. 2020, no. 6660489, pp. 14. [Google Scholar]
 | This work is licensed under a Creative Commons Attribution 4.0 International License, which permits unrestricted use, distribution, and reproduction in any medium, provided the original work is properly cited. |