DOI:10.32604/cmc.2021.016738
| Computers, Materials & Continua DOI:10.32604/cmc.2021.016738 | |
| Article |
Toward Optimal Cost-Energy Management Green Framework for Sustainable Future Wireless Networks
1Department of Electrical Engineering, College of Electronics and Information Engineering, Sejong University, Seoul, 05006, Korea
2Department of Electrical and Computer Engineering, University of Ottawa, Ottawa, K1N 6N5, ON, Canada
3Department of Electronics and Communications Engineering, A’Sharqiyah University, Ibra, 400, Oman
4School of Telecommunication Engineering, Suranaree University of Technology, Nakhon Ratchasima, Thailand
5College of Computer Engineering and Sciences, Prince Sattam bin Abdulaziz University, Alkharj, 11942, Saudi Arabia
6Department of Mechatronics, Faculty of Engineering and Architecture, Istanbul Gelisim University, Istanbul, 34310, Turkey
*Corresponding Author: Peerapong Uthansakul. Email: uthansakul@sut.ac.th
Received: 07 January 2021; Accepted: 10 February 2021
Abstract: The design of green cellular networking according to the traffic arrivals has the capability to reduce the overall energy consumption to a cluster in a cost-effective way. The cell zooming approach has appealed much attention that adaptively offloads the BS load demands adjusting the transmit power based on the traffic intensity and green energy availability. Besides, the researchers are focused on implementing renewable energy resources, which are considered the most attractive practices in designing energy-efficient wireless networks over the long term in a cost-efficient way in the existing infrastructure. The utilization of available solar can be adapted to acquire cost-effective and reliable power supply to the BSs, especially that sunlight is free, available everywhere, and a good alternative energy option for the remote areas. Nevertheless, planning a photovoltaic scheme necessitates viability assessment to avoid poor power supply, particularly for BSs. Therefore, cellular operators need to consider both technical and economic factors before the implementation of solar-powered BSs. This paper proposed the user-centric cell zooming policy of solar-powered cellular base stations taking into account the optimal technical criteria obtained by the HOMER software tool. The results have shown that the proposed system can provide operational expenditure (OPEX) savings of up to 47%. In addition, the efficient allocation of resource blocks (RBs) under the cell zooming technique attain remarkable energy-saving performance yielding up to 27%.
Keywords: Wireless networks; beyond 5G; green communications sustainability; OPEX; communication systems
The energy consumption rate of information and communication technology (ICT) has increased rapidly over the last few decades owing to the excessive demand for multimedia services. Wireless networks are considered one of the main sources of energy consumption in the ICT arena [1]. Among the wireless network components, base stations (BSs) are considered a paramount source of energy consumption, accounting for 57% of the total energy used [2]. In the last decade, wireless network operators are focused on providing a high data transfer rate with large radio coverage to satisfy the demand of subscribers. Therefore, wireless network operators have largely increased the BS numbers to deliver a high data rate to enormous wireless devices and access point nodes. Consequently, both the energy consumption and operational expenditure (OPEX) have notably increased i.e., linearly scaled with the augmentation of intensive user requirements [3]. Recently, the massive connectivity of IoT devices incorporated with wireless access networks led to tremendous energy consumption; it is expected to increases enormously in the future due to the diverse type of IoT applications [4]. Thus, the primary focuses of wireless network operators are became provisioning a high data rate with attention to energy-efficient issue simultaneously. Moreover, the increasing concerns of the wireless network operators about energy consumption not only to increase savings in OPEX but also due to the growing awareness of global warming issues and ecological concerns [5]. Therefore, the researchers and experts are endeavoring to determine the optimum approaches to diminish the energy consumption rate notably for the wireless networks while persisting with desired data services.
Researchers are focused on numerous distinctive approaches to reduce the energy consumption into wireless networks such as energy-efficient hardware components, selective operation of components, efficient use of radio transmission process, deploying heterogeneous cells, and implementing renewable energy resources (RESs) [6]. RESs are considered the most attractive practices in designing energy-efficient wireless networks over the long term in a cost-efficient way in the existing infrastructure [7]. Nonetheless, the commissioning of RES-powered BSs is based on the availability of wind profile/solar irradiation that hinges on the latitude, seasonal disparities, and ecological circumstances. Besides, cannot ignore the amount of energy that is wasted due to the lack of efficient utilization of resources. Whereas, the infrastructures of the BSs have been designed to support daytime traffic i.e., (peak time). However, the traffic loads during the daytime differ from those during the night [8]. Therefore, the BSs must effectively deal with the resources to achieve efficient energy utilization and better saving.
Considering all these inferences, researchers have insufficient descriptions for the total OPEX savings including optimum extent efficient solution of RESs. Therefore, this study examines as a major contribution achieve a balance between network performance and energy efficiency via examines the feasibility of incorporating solar-powered BSs technique with a dynamic cell zooming strategy according to the traffic load conditions in Korea to determine the net OPEX savings. The contributions of this work are summarized as follows:
• To propose and determine the technical feasibility of an adaptive standalone solar power solution incorporating a dynamic cell zooming strategy based on resource susceptibility to obtain a long-tenure energy balance.
• To investigate the optimal solution of harvested green energy for the considered cellular architecture endeavoring to minimum net present cost as well as OPEX savings.
• To examine the technical viability in terms of energy yield, cost-effectiveness in accordance with optimum system design. Thereafter, the suggested framework is compared to other techniques for further validation.
The rest of this work is organized as follows; Section 2 presents the cell zooming concept and performance metrics. Section 3 block diagram of BS hardware elements and mathematical modeling. Section 4 shows the proposed solar power system and mathematical formulations. The cost optimization formula is given in Section 5. Section 6 presents the simulation configurations. Then, results and discussion are described in Section 7; and the economic feasibility of the proposed solar system is discussed. Lastly, Section 8 concludes the work by highlighting the attained results.
2 Cell Zooming and Performance Metrics
The principle cell zooming strategy depends on the capability of allowing for the adjustment of the size of the cell according to the traffic load. When congestion occurs in a cell due to an increase in the number of users, the congested cell could “zoom-in,” while neighboring cells with a smaller amount of traffic could “zoom-out” to provide coverage for the users that cannot be served by the congested cell [9]. The incoming traffic arrival intensity depends on the tempo-spatial domains as it changes over time and space owing to the user mobility. For example, the commercial area experiences high traffic demand whereas, lower in the residential area particularly in the day time. The scenarios are getting reverse during the evening period. Cell zooming is an effective method for improving energy efficiency by adjusting traffic load. The centralized control server coordinates traffic demand and make zooming out decision accordingly. If the traffic intensity of the considered BS is higher than the threshold value, the control server sends information to zoom in the cell size. On the other hand, the BS under test moves to sleep mode if UEs are shifted to neighboring BSs or when the traffic intensity becomes much lower. Under this case, the surrounding BSs zooms out to serve new incoming users via a control server through cooperation. Thereby, the sleep mode provision governed by the cell zooming technique enables to reduce of additional energy consumption. Fig. 1 summarises the proposed cell zooming strategy. The infrastructures of the cellular networks have been designed to support daytime traffic i.e., (peak time). However, the traffic loads during the daytime differ from those during the night, as shown in Fig. 2. Thus, the BSs must effectively deal with the traffic load to achieve efficient energy utilization and better saving.

Figure 1: Cell zooming concept in cellular networks; (a) Original size; (b) Central cell zooms in when the load increases; (c) Central cell zooms out when the load decreases

Figure 2: The daily traffic load pattern of a BS
If the traffic density in a particular BS is below the threshold value, then the particular BS shifts its loads to the neighboring BSs according to their current traffic status and the BS goes into sleep mode to reduce energy consumption. In such a case, the accepting BSs can zoom out to serve the new arrivals in a cooperative manner. Note that the provision of sleep mode is appropriate for low traffic density under off-peak duration. However, the neighboring BSs can only serve the incoming BSs based on their unoccupied resource blocks and green energy availability without sacrificing its own performance. In other words, the acceptor BSs adjust their transmit power to extend the coverage distances allowing the low-density BSs to enter dormant conditions. On the other hand, the BSs experiencing high traffic demand exceeding their capacity will share the load to surrounded low densified BSs according to the proposed heuristic algorithm. The two different heuristic cell zooming algorithms are described in the following.
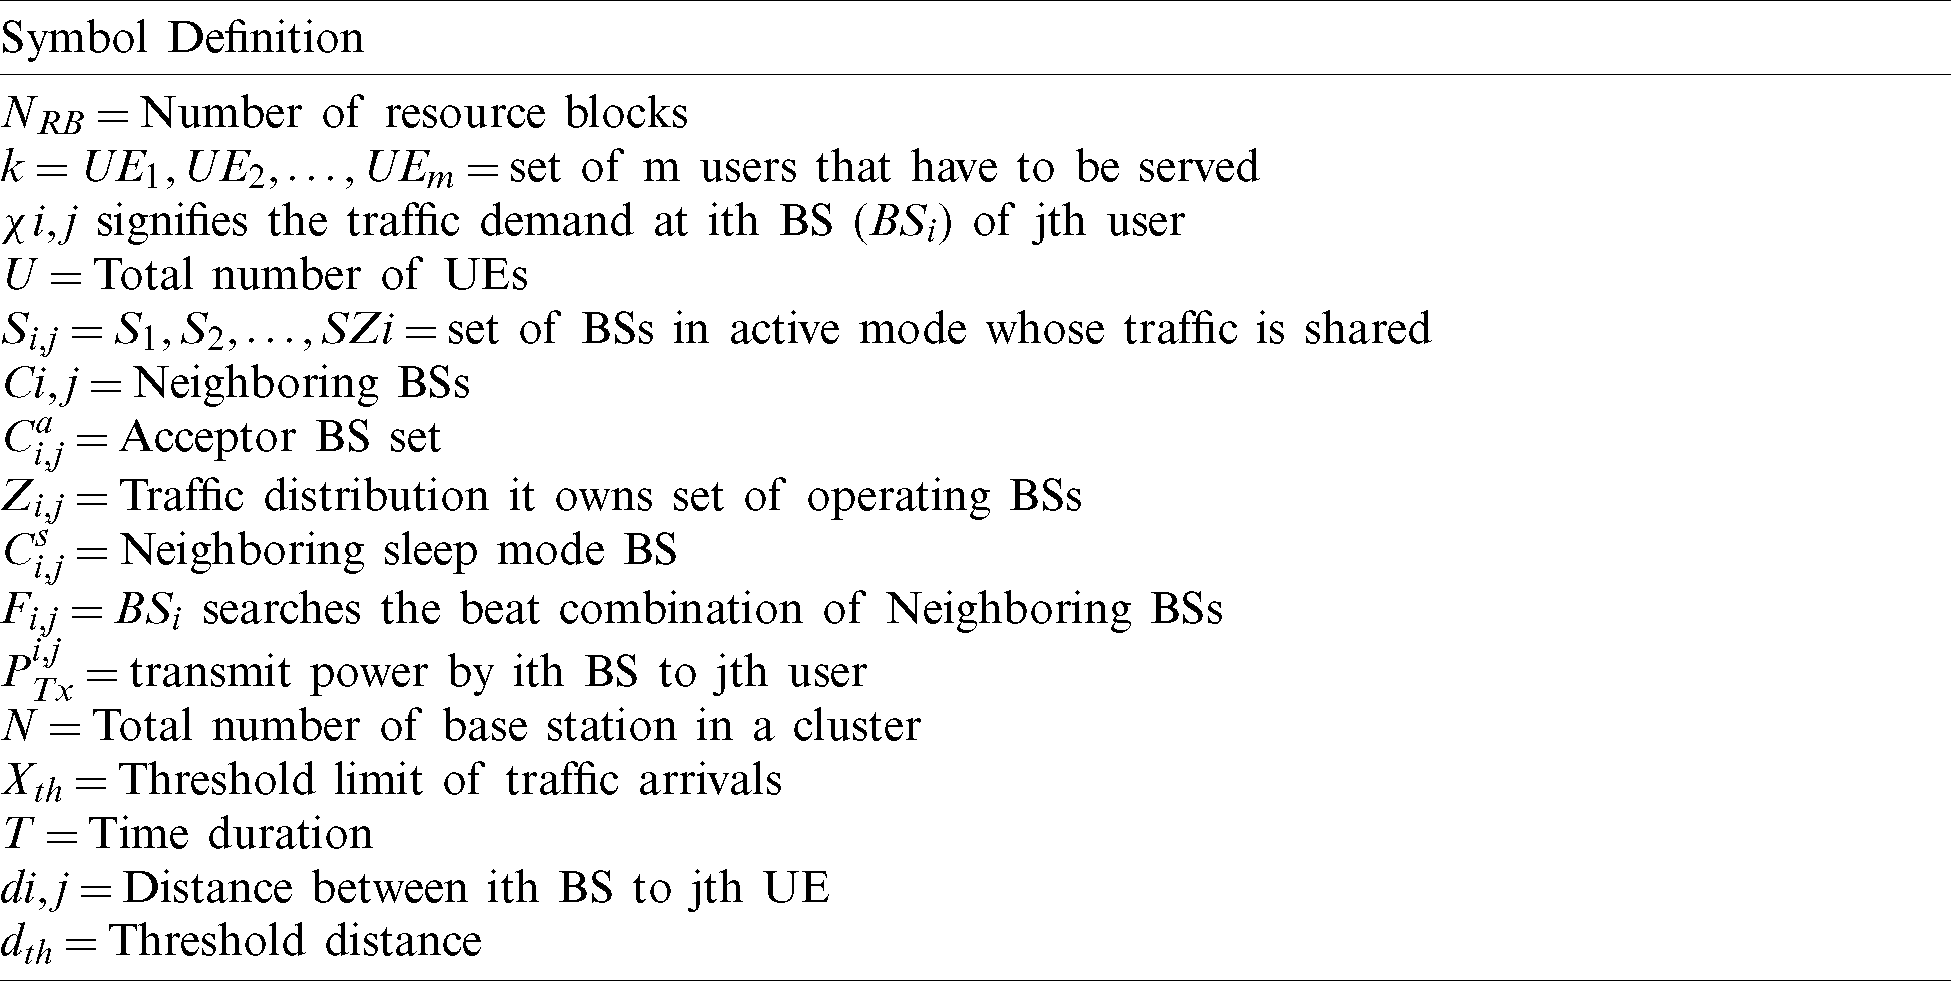
• Distance-traffic aware: sort the BSs in a cluster in ascending order based on the traffic arrivals (
Set of m users
In the cell zooming algorithm,
• Green energy-aware: likewise, user traffic variations, the generation of green energy is heavily dependent on the time and space domain owing to the different factors. Therefore, renewable energy production is highly variable over the geographical location. Arrange the BSs in accordance with the green energy availability in a descending manner in a certain period. According to the algorithm, the highest energy available BSs zooms out through extending the transmit power to cover surrounding new demand arrivals from the donor BSs. It is worthy to mention that the surplus electricity during peak RE generation is stored in the battery bank and can be used in the night-time. It is obvious that the green energy aware scheme exhibit inferior performance in the counterpart as it cannot have guaranteed the continuous power supply over a day or during unavailability of RE generation.

Figure 3: UE_BS distance-based traffic relocation cell zooming algorithm
Table 1: Summary of research investigations on renewable energy powered cellular BSs
Energy Consumption Gain (ECG): ECG metrics accounts the energy required for sending requested data transmission over a particular duration. ECG in green communications can be defined as the ratio of the ECR metrics of the proposed system to the reference schemes under the specified network settings. For instance, the network architecture without cell zooming is considered as a reference baseline and cell zooming enabled green-powered cellular system is the proposed scheme recognized as a more energy-efficient architecture.
A system with lower ECG identified as more energy efficient as it consumes low power to transmit the same amount of data transmission.
However, ECR is an equipment level standard that evaluates the achievable throughput of the entire radio access network per given power expenditure. On the other hand, ERG metrics are sometimes preferable for energy efficiency analysis in the area of green cellular networking. The ERG can be expressed as
Energy Saving Index (ESI): ESI metric measures the energy-saving gain introducing the cell zooming concept under different zoom out range. It can define as
where
Load factor (
A RB is the least unit of physical resource allocation assigned to every user. Resource block allocation decide the number of simultaneous users connected to the LTE base stations. In LTE, one physical RB occupied 10 kHz bandwidth, having 12 subcarriers (each 15 kHz) and 14 symbols over 1 msec duration. Typically, 10% RBs are kept reserved in LTE system in order to avoid overlapping issue.
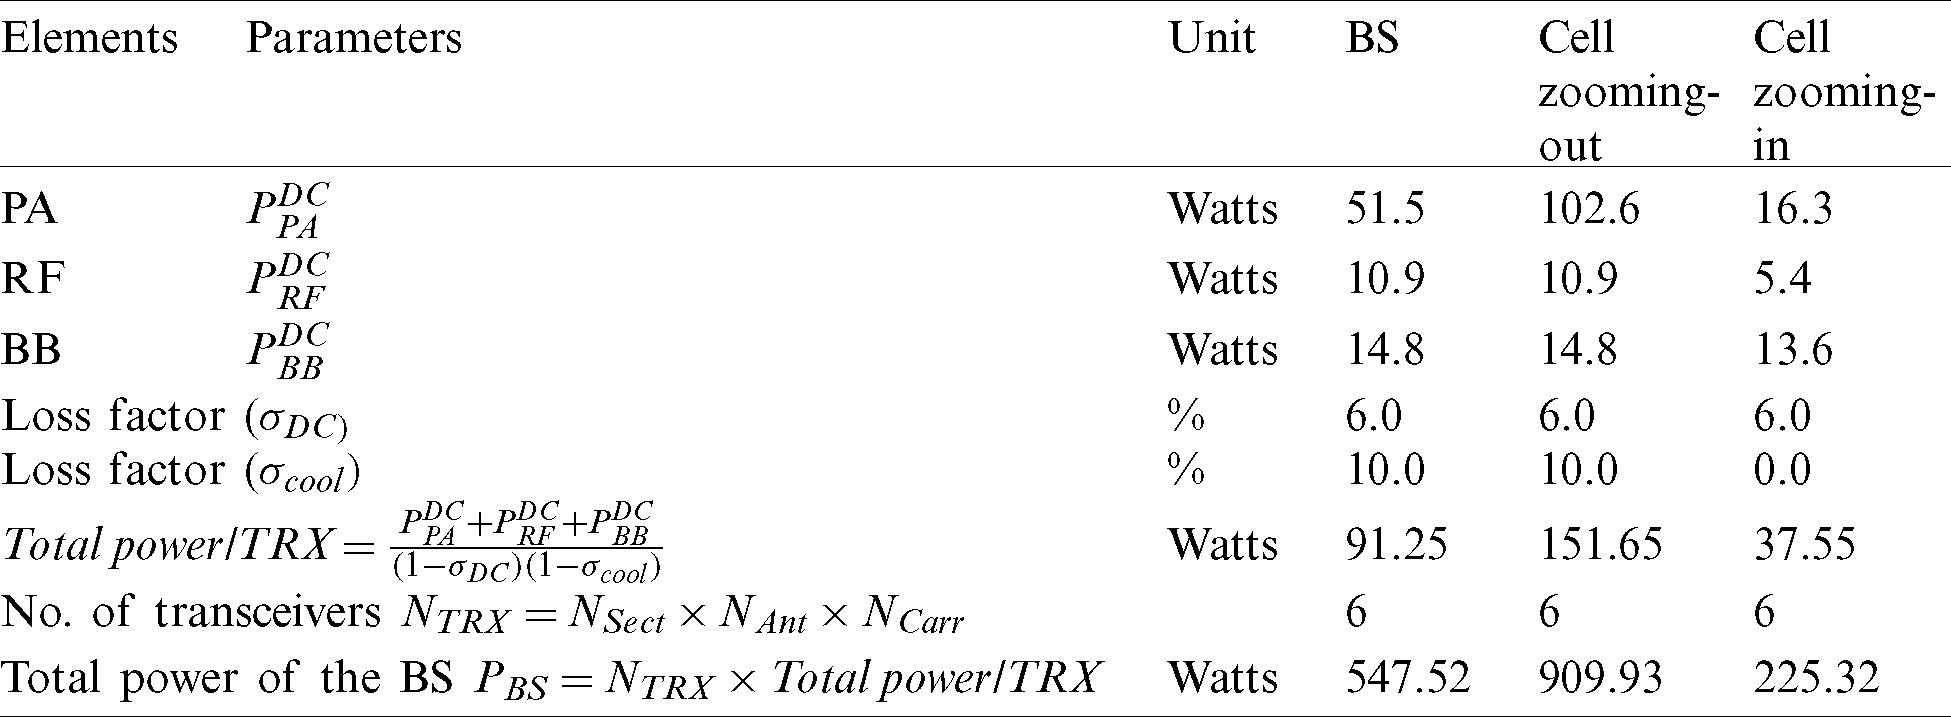
The cellular BS consists of various equipment that can be used to communicate with mobile/cellular units. The backhaul network has the following sub-units: (i) multiple transceivers (TRXs), (ii) power amplifier (PA), (iii) radio-frequency (RF), (iv) baseband (BB), (v) DC–DC Power supply, and (vi) cooling systems. The TRXs comprise PA which amplifies the signal power coming from the BB unit. Besides, the BB is adapted for internal processing and coding, as shown in Fig. 4. A detailed discussion of the BS components can be seen in [2].
The net power consumption by the BS is derived through the following equation [10];
where NTRX denotes the number of transmitting/receiving antennas for individual sites, i.e., transceivers;

Figure 4: Block diagram of BS hardware elements
Tab. 2 presents the power consumption scale of different parts of the macro BS system with a
Table 2: The power consumption scale of different hardware elements at BW 10 MHz [10]
The proposed system comprises three segments such as sources, converters, and loads. PV panels which are arranged in series and parallel connection based on the voltage and current ratings. A battery bank or battery energy storage system (BESS) stores the energy from PV panels and ensures the reliability and power quality of the generated power. Furthermore, a DC/AC converter is used to convert the power to AC which supplies the power to the AC load (Air conditioner). Moreover, excess energy is stored in the BESS as a backup which can be utilized during non-sunny periods notably at night. The following subsections thoroughly demonstrate the architecture of a solar system.
The total annual energy extraction from the PV arrangement (EPV) is derived as [11],
where PCPV states a peak capacity of the PV array (kW); PSH denotes peak solar hour and is calculated based on the equivalent average daily solar irradiation. DFPV states a derating factor of PV array, considering the impact of dust, losses, temperature variations, and other potential factors that can distress the output power of the panel.
The BESS capacity of the BS merely depends on the depth of discharge (DOD) and must be evaluated before commissioning. It can be expressed as [11],
where SOCmin denotes the minimum state of charge (SOC). The computation of days of autonomy (
where the terms Nbatt and Vnom are the total number of battery units in the BESS and a nominal voltage of a single battery unit (V), respectively. The terms Qnom and Lprim, ave are the nominal capacity of a single battery (Ah) and average daily BS load (kWh), respectively.
The lifetime of the battery plays a crucial role. The lifetime of a battery can be predicted based on the operating conditions. More specifically, the DOD during each diurnal charge-discharge cycle displays a foremost role in the battery lifetime. It can be computed as [11],
where the term Qlifetime represents the lifetime throughput of a single battery in kWh, Qthrpt denotes the annual battery throughput in kWh per year, and the term Rbattf states a battery float life in years.
The total capacity of the inverter (Cinv) is calculated as [11],
where the term LAC represents the available maximum AC load;
The HOMER Micro-power optimization tool aids, to obtain an optimal solar system with low net present cost (NPC). The term NPC contains all incurred expenses and incomes throughout the project lifetime. The total annualized cost (CTAC) exemplifies the annual price of the complete scheme in the $/year that contains the initial capital (IC) costs (
The net present cost (CNPC) can also be described for annualized value and can be derived as
The term CRF denotes the recovery factor which converts a CNPC into a flow of equal annual costs over a definite period. It can be calculated based on the annual interest rate (i) and number of years (N), and it is computed using the following equation,
The CNPC symbolizes all the prices incurred within the project lifespan, but with impending cash flows cut-rate to the current discount ratio. The term NPC comprises the IC, replacement, O&M, and salvage costs. However, the total NPC value is notably reduced due to the salvage value at the end of the project lifespan. The computation of salvage value (S) can be carried out using the following equation;
wherein where Rcomp defines the lifespan of the component in years, Rrem denotes the remaining lifespan of the component in years, and the term Crep is the replacement rate of the component in $.
This study scrutinizes to minimize the total cost of the NPC for an optimal scheme of a stand-alone solar system based on various constraints. To attain system optimization, the objective function of the NPC can be derived using Eq. (15) and formulated as
The above-derived objective function is subjected to the following constraints;
To warrant a power balance between actual demand and energy production, the power production of the available sources (EPV and EBattery) must meet the demand of BS (EBS), also with losses (ELosses) as defined in Eq. (16.2).
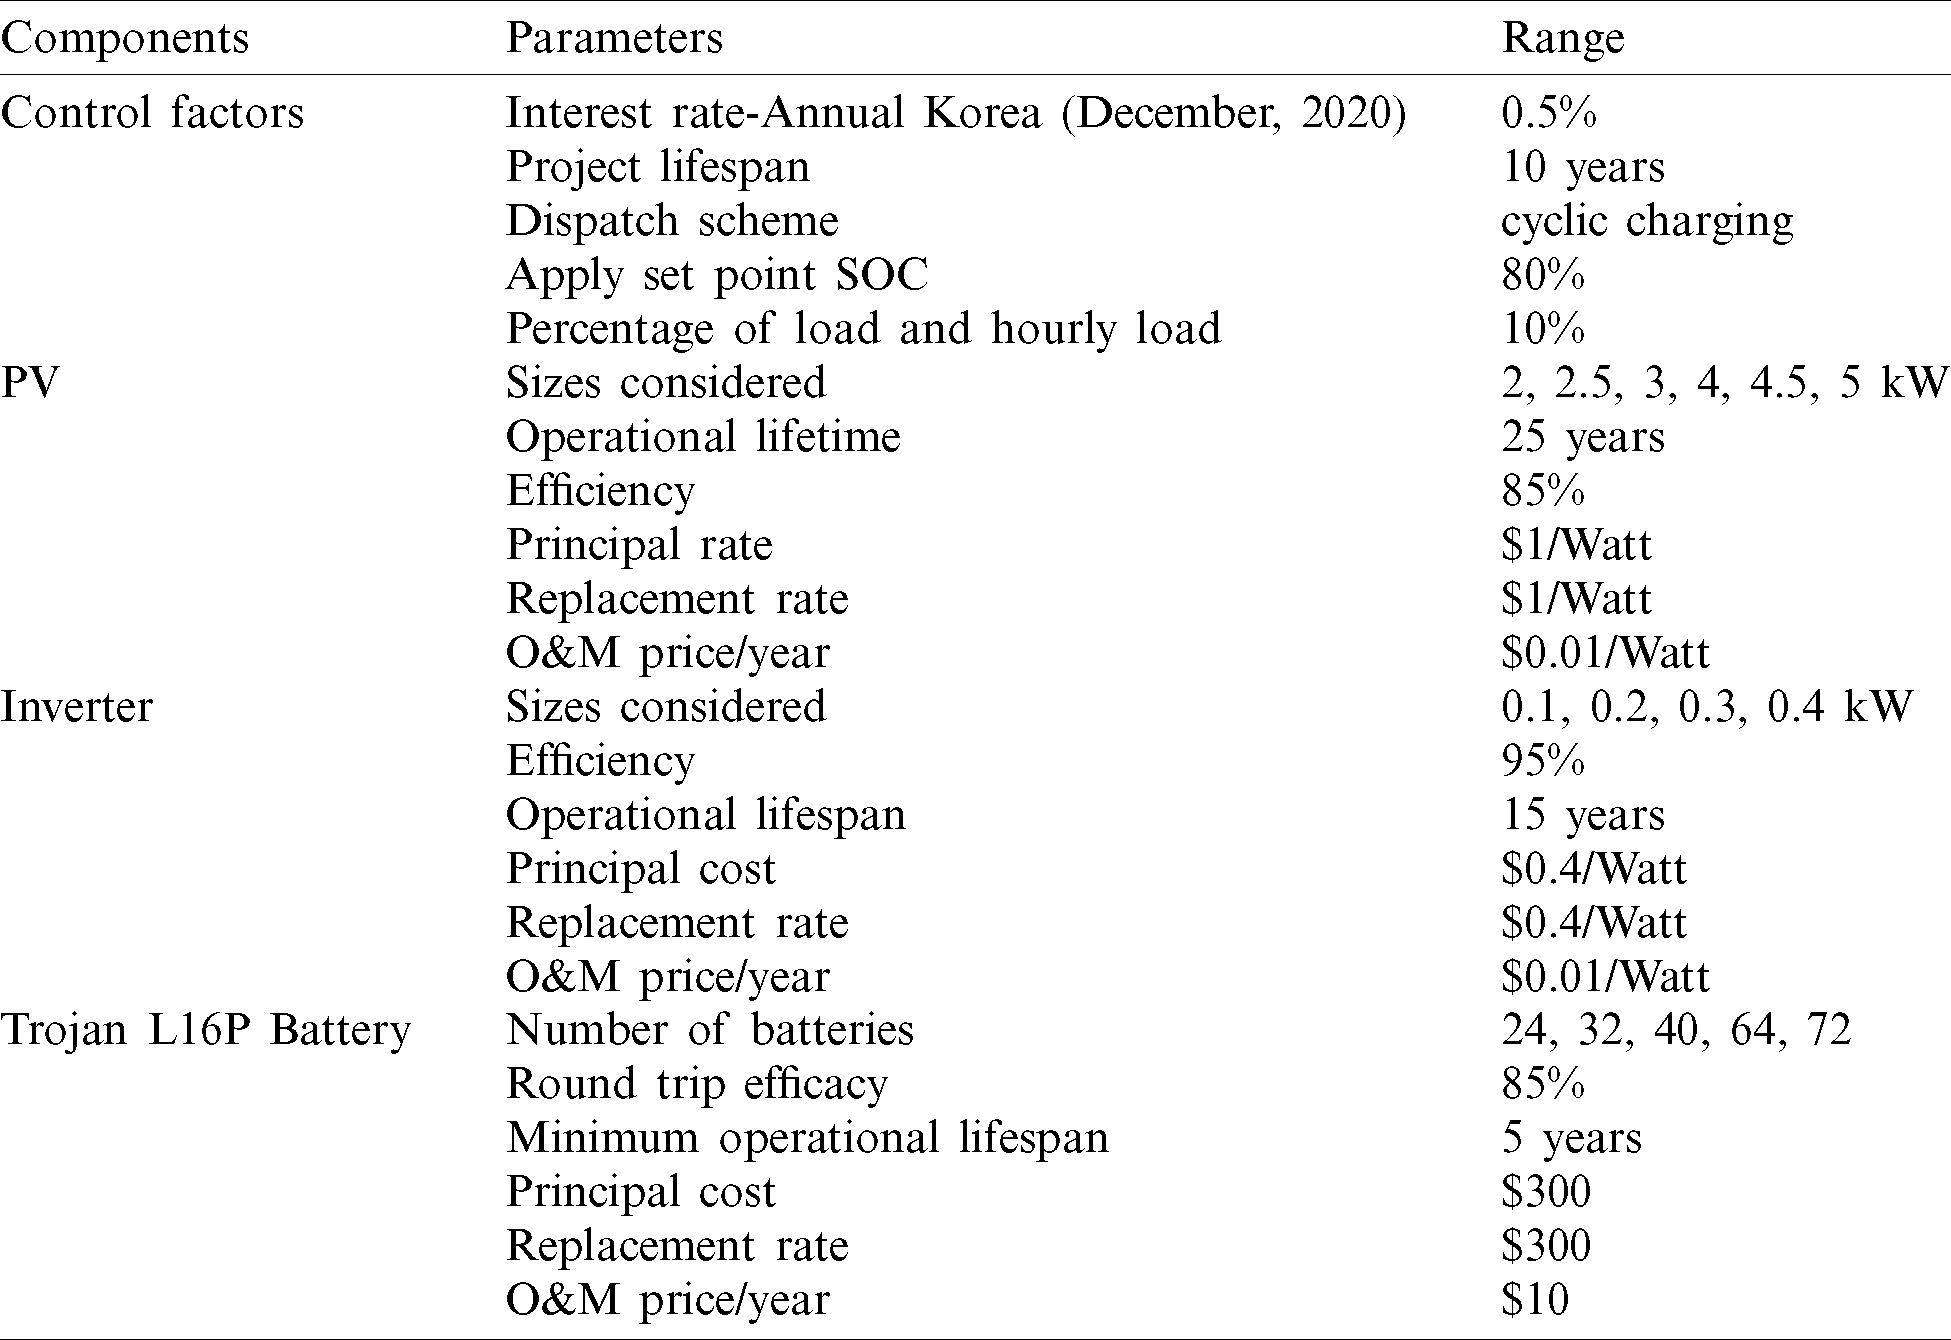
The monthly average solar irradiation values, as shown in Fig. 5. In addition, the economic value, system value, project lifespan, and interest rate (annual), as provided in Tab. 3.

Figure 5: Solar irradiance for Korea (Monthly average) [11]
Table 3: Simulation configuration
Most economically, the total NPC cost of solar-powered BS is $26,887 that comprises 2.5 kW rated PV panels and 64 numbers batteries which are connected in eight parallel strings along with a 0.1 kW inverter. Detailed discussions of the optimal size measures, energy harvest, and economic investigation of the proposed solar-powered BS are given in the following subsections.
The optimal capacity of the PV array, as determined by the HOMER, is 2.5 kW. The designed PV array has 10 Sharp modules, and each proposed module is rated at 250 W with a nominal voltage of 29.80 V, nominal current of 8.40 A, open-circuit voltage of 38.3 V, and short circuit current of 8.9 A. The yearly energy output of the PV is calculated using Eq. (7): the total energy output of the PV is calculated as 3180 kWh (2.5 kW
The ratios of annual energy output and input of the BESS, i.e., 2625 and 3077 kWh, respectively. Roughly, the BESS supplies the power to the load about 237 h, specifically during the malfunction of the PV array. The seasonal statistics that the maximum energy contribution of the BESS is in August, while the minimum energy contribution in April. Besides, the frequency histogram of the state of charge (SOC) shown that the state of charge stretched to 42%. The average hourly energy generation of the PV, BESS, unmet load, and excess electricity is presented in Fig. 6. It is observed that the lower rate of energy contribution from PV array is in August; therefore, the higher rate of energy contribution from the BESS is in the same period.

Figure 6: The average hourly energy generation of the PV, BESS, unmet load, and excess electricity
The net capacity of the inverter unit is 0.1 kW, and its efficiency is computed between the input (236 kWh) and output energy (224 kWh) annually and observed as 95%. The total operating hours are 8,759 h/year (24 h
A cash flow summary for Seoul city is presented in Fig. 7 (project lifespan). A detail of the breakdown of the cash flow summary is as follows.
• The size of the system is directly proportional to the IC cost invested during the commencement of the scheme. The total IC of the proposed scheme is $21,740 and its breakdown is as follows:
11.50% for PV array (2.5 kW (size)
• 88.32% for BESS (64 (units)
• 0.19% for inverter (0.1 kW (size)
The O&M cost of the system is considered to be $6660, and its breakdown is as follows:
a) For PV array (i.e., 2.5 kW (size)
b) For BESS (64 (units)
c) For inverter (0.1 kW (size)
Due to the short operational lifespan of the project (10 years), and the lifespan of the BESS, PV arrays, and inverter is 10, 25, 15 years respectively. There are no replacement costs.
The salvage value of each component at the end of the project lifespan has to be considered. With the help of Eq. (15), the salvage value of the PV array is computed and found to be $1500, which is the highest value among other components. The salvage value of the inverter is estimated at $13. The total salvage value at the end of the venture lifespan is $1513.
The net NPC is calculated by adding up the aggregated cash flows for each year and found to be $26,887 i.e., $21,740 (IC) + $6660 (O&M prices) − $1513 (salvage).

Figure 7: Summary of cash flow (project lifespan)
A quantitative comparison of the ECG identifying the impact of two different cell zooming techniques is clearly presented in Fig. 8. As expected, the performance of both schemes remains unchanged under no cell zooming conditions. As the cell zooms out more, less energy consumed by the entire RAN architecture. According to the definition, the distance-traffic based cell zooming scheme consumes less amount of power for the given value of zoom out level. As a consequence, the distance-traffic aware cell zooming method attains about 4.8% less energy consumption in comparison to the green energy aware as evident from the Fig. 8. On the other hand, the energy consumption is about 27% lower when the cell zooms out entirely than the 20% zooming level.

Figure 8: Percentage of ECG vs. percentage of cell zooming
Fig. 9 compares the ERG metric with the percentage of cell zooming under 10 MHz system bandwidth. Note that ERG performance can be derived with the help of ECG in accordance with the definition. ERG defines the reduction of total power consumption to transmit a single bit of information. Distance-traffic aware based cell zooming scheme shows improved performance by about 5% in comparison with green energy-based zooming technique.

Figure 9: Percentage of ERG vs. percentage of cell zooming
A detailed comparison of two different BS zooming options such as distance-traffic aware and green energy availability is demonstrated in Fig. 10. The distance-traffic aware scheme keeps its optimistic nature in terms of average energy. Further, Fig. 10 depicts that distance traffic-aware cell zooming mechanism achieve 6.5% more energy savings in their counterpart and exhibits superior performance for the higher level of zooming.

Figure 10: ESI vs. percentage of cell zooming
Figs. 11–13 depicted the average energy-saving performance comparing between the distance-traffic and green energy availability aware schemes with the BS sleeping hours per day, level of cell zooming, and percentage of shifted traffic to the collocated BSs respectively. As observed, the distance-traffic aware technique keeps its optimistic nature in all these three figures by means of a considerable amount of energy savings. Notably, the energy savings gap between the two aforementioned schemes of cell zooming is more apparent for the higher values of the zoom-out level, BS sleeping hours, and shifted load demand. On the other hand, the separation of energy-saving performance curves follows a similar pattern for the lower values of variable parameters. This is because, for the lower values of zooming level, shifted load, and sleep mode duration, the improvement of energy savings keep remains identical between the two methods. In contrast, the green energy aware technique shows inferior performance as the available energy at the on-site BS may not sufficient to guarantee all the traffic demand. Whereas, the distance-traffic aware demonstrates comparatively reliable performance for a prolonged period since this scheme does not depends solely on the green power supply. In a nutshell, owing to the random fluctuations of RE energy production on-site BSs, a solar energy-based cell zooming scheme is not a preferable choice for achieving a greater level of system performance.

Figure 11: Average energy savings vs. BS sleeping hours in a day under zoom out condition

Figure 12: Comparison of energy savings performance with cell zoom out level

Figure 13: Percentage of energy saving index vs. cell zooming level
Fig. 14 illustrates the percentage of energy-saving versus the resource blocks occupancy i.e., load factor. Both the curves follow the identical patterns to reach their least values with the increment of

Figure 14: Percentage of energy saving vs. load factor
7.4 Economic Feasibility of the Proposed System
The key priority of the mobile operators is to increase the profit with reduced OPEX in the cellular network. The economic viability with the PV system over conventional energy resources are as follows;
In remote areas, i.e., an off-grid station, the Diesel generator (DG) is usually employed to power the BS. The DG rating should be around 3.5 kW that can be figured between the ratio of maximum BS and 30% DG efficiency
• The IC costs are computed by multiplying the system size of 3.5 kW with its cost of about $660/kW.
• The O&M cost (annual) of the DG is approximately $4,150 (excluding fuel transportation cost). A breakdown of this cost is described as;
▪ The net maintenance cost of DG is $438/year, estimated using the product of DG maintenance cost ($0.05/h) with annual operational hours (8760 h).
• ▪ The total fuel cost is computed using the product of diesel price ($1.04/liter) with total diesel consumption (3,569 liter/year) and found to be $3,712. It is calculated based on specific fuel consumption (0.388 liter/kWh)
Every three years, a cellular operator has to replace the DG, i.e., a minimum of three DG replacements during the lifespan of the scheme. Therefore, the net replacement rate is equal to $6,930, i.e., 3
The net NPC of the solar system is approximately $26,887. Applying the proposed solar system, total OPEX savings $23,849 which is 47% compared with the conventional power sources.
In this work, the solar-powered BSs technique with a dynamic cell zooming strategy according to the traffic load conditions is suggested for the green wireless networks. The simulation results revealed that the proposed system can be achieved OPEX savings of up to 47%, and it can potentially meet the total demand of BS without any outage. Moreover, two different heuristic cell zooming algorithms are extensively compared to extract the best option by means of energy savings under optimal technical conditions. Results reveal that distance-traffic aware cell zooming scheme exhibits more energy-efficient yielding to 27%, 5%, 6.5% in terms of ECG, ERG, and ESI, respectively compared to the availability of renewable energy-based method.
Funding Statement: This research was supported by SUT Research and Development Fund. Also, this work was supported by the Deanship of Scientific Research at Prince Sattam bin Abdulaziz University, Saudi Arabia.
Conflicts of Interest: The authors declare that they have no conflicts of interest to report regarding the present study.
1. M. H. Alsharif and R. Nordin. (2017). “Evolution towards fifth generation (5G) wireless networks: Current trends and challenges in the deployment of millimetre wave, massive MIMO, and small cells,” Telecommunication Systems, vol. 64, no. 4, pp. 617–637. [Google Scholar]
2. M. H. Alsharif, J. Kim and J. H. Kim. (2017). “Green and sustainable cellular base stations: An overview and future research directions,” Energies, vol. 10, no. 5, pp. 587–607. [Google Scholar]
3. M. Aloqaily, A. Boukerche, O. Bouachir, F. Khalid and S. Jangsher. (2020). “An energy trade framework using smart contracts: Overview and challenges,” IEEE Network, vol. 34, no. 4, pp. 119–125. [Google Scholar]
4. M. H. Alsharif, A. Kelechi, J. Kim and J. H. Kim. (2019). “Energy efficiency and coverage trade-off in 5G for eco-friendly and sustainable cellular networks,” Symmetry, vol. 11, no. 3, pp. 408–428. [Google Scholar]
5. M. H. Alsharif, R. Nordin, N. Abdullah and A. Kelechi. (2018). “How to make key 5G wireless technologies environmental friendly: A review,” Transactions on Emerging Telecommunications Technologies, vol. 29, no. 1, pp. 617–637. [Google Scholar]
6. M. H. Alsharif. (2017). “Optimization design and economic analysis of energy management strategy based on photovoltaic/energy storage for heterogeneous cellular networks using the HOMER model,” Solar Energy, vol. 147, no. 1, pp. 133–150. [Google Scholar]
7. M. H. Alsharif, R. Nordin and M. Ismail. (2016). “Green wireless network optimisation strategies within smart grid environments for LTE cellular networks in Malaysia,” Renewable Energy, vol. 85, no. 3, pp. 157–170. [Google Scholar]
8. Z. Du. (2020). “Energy analysis of Internet of things data mining algorithm for smart green communication networks,” Computer Communications, vol. 152, no. 2, pp. 223–231. [Google Scholar]
9. A. R. Khamesi and M. Zorzi. (2017). “Energy harvesting and cell zooming in K-tier heterogeneous random cellular networks,” IEEE Transactions on Green Communications and Networking, vol. 2, no. 1, pp. 63–73. [Google Scholar]
10. G. Auer, V. Giannini, C. Desset, I. Godor, P. Skillermark et al. (2011). , “How much energy is needed to run a wireless network?,” IEEE Wireless Communications, vol. 18, no. 5, pp. 40–49. [Google Scholar]
11. M. H. Alsharif and J. Kim. (2016). “Optimal solar power system for remote telecommunication base stations: A case study based on the characteristics of South Korea’s solar radiation exposure,” Sustainability, vol. 8, no. 9, pp. 942–962. [Google Scholar]
 | This work is licensed under a Creative Commons Attribution 4.0 International License, which permits unrestricted use, distribution, and reproduction in any medium, provided the original work is properly cited. |