DOI:10.32604/cmc.2021.012231
| Computers, Materials & Continua DOI:10.32604/cmc.2021.012231 | |
| Article |
KSUTraffic: A Microscopic Traffic Simulator for Traffic Planning in Smart Cities
Computer Science Department, King Saud University, Riyadh, Saudi Arabia
*Corresponding Author: Najla Al-Nabhan. Email: nalnabhan@ksu.edu.sa
Received: 21 June 2020; Accepted: 13 October 2020
Abstract: Simulation is a powerful tool for improving, evaluating and analyzing the performance of new and existing systems. Traffic simulators provide tools for studying transportation systems in smart cities as they describe the evolution of traffic to the highest level of detail. There are many types of traffic simulators that allow simulating traffic in modern cities. The most popular traffic simulation approach is the microscopic traffic simulation because of its ability to model traffic in a realistic manner. In many cities of Saudi Arabia, traffic management represents a major challenge as a result of expansion in traffic demands and increasing number of incidents. Unfortunately, employing simulation to provide effective traffic management for local scenarios in Saudi Arabia is limited to a number of commercial products in both public and private sectors. Commercial simulators are usually expensive, closed source and inflexible as they allow limited functionalities. In this project, we developed a local traffic simulator “KSUtraffic” for traffic modeling, planning and analysis with respect to different traffic control strategies and considerations. We modeled information specified by GIS and real traffic data. Furthermore, we designed experiments that manipulate simulation parameters and the underlying area. KSUTraffic visualizes traffic and provides statistical results on the simulated traffic which would help to improve traffic management and efficiency.
Keywords: Simulation and modelling; smart cities; smart infrastructure; traffic management and planning; intelligent transportation
Simulation is a powerful tool that can mimic real situations with an aim of evaluating and analyzing the performance of new systems, or adjustment of current systems that helps to improve decision making. There are two types of simulation tools: Physical simulation and Computer-based simulation. Computer-based simulation is used in many fields and for different purposes such as designing and evaluating manufacturing systems, testing military weapons systems, analyzing economic systems as well as understanding and managing traffic systems. Simulating traffic is gaining an increased importance recently because of its ability to imitate traffic elements, demonstrate and simplify its complexity [1–5].
In real life, there are many types of vehicles that are driven according to different driving styles by different people which make traffic flow unpredictable. Unlike the other types of traffic simulators, microscopic simulation considers this variation requirement in simulating traffic as it allows each vehicle and element to be modeled separately. It also allows interaction between these different simulation elements during simulation. Furthermore, because of their increasing interest, the use of microscopic simulators has expanded from academic fields to industrial and professional fields by consultants, users, traffic companies, and researchers [1–5]. In Saudi Arabia, employing traffic simulators in both public and private sectors is limited to some commercial computer simulation products. Most of these commercial simulators are developed for a specific purpose and area. Therefore, they cannot be utilized to simulate other local areas. Furthermore, they may not allow changing local environmental variables.
This research focuses on developing Traffic Simulator for a local confined area in Riyadh City. Riyadh has many areas where traffic gets very congested such as universities, main roads, public hospitals, and shopping malls during specific peak periods. Nowadays, there are many changes undergoing in Riyadh, large urban development, and construction of a Riyadh Metro [6]. These rapid changes together with its large population are the reasons for traffic congestion. In Riyadh, there are several main roads that have a significant impact on the overall traffic of the city. For example, King Fahd road Makkah road, King Abdullah road, Imam Saud Bin Abdulaziz Bin Mohammed road, Al-Arouba road, Ring roads, Prince Turki Bin Abdulaziz Al-Awwal road, Takhassussi road, King Abdul Aziz road and Al-Olaya road.
As shown in Fig. 1a, King Saud University (KSU) is located at a junction between three main roads: King Khalid road, King Abdullah road, and Prince Turki Bin Abdulaziz Al-Awwal road. KSU contains KSU Stadium, students housing, faculty members housing, Medical City, King Salman Central Library, Boys’ Campus, and Girls’ Campus. Girls’ Campus as shown in Fig. 1b is located between the intersection of Prince Turki Al-Awwal with Imam Saud Bin Abdulaziz and King Abdullah roads. Girls Campus serves around 21500 female members (students, faculties and staff). With this large population, it is easy to experience traffic especially in peak hours. Morning peak hours are usually between 07:00 am and 09:00 am.
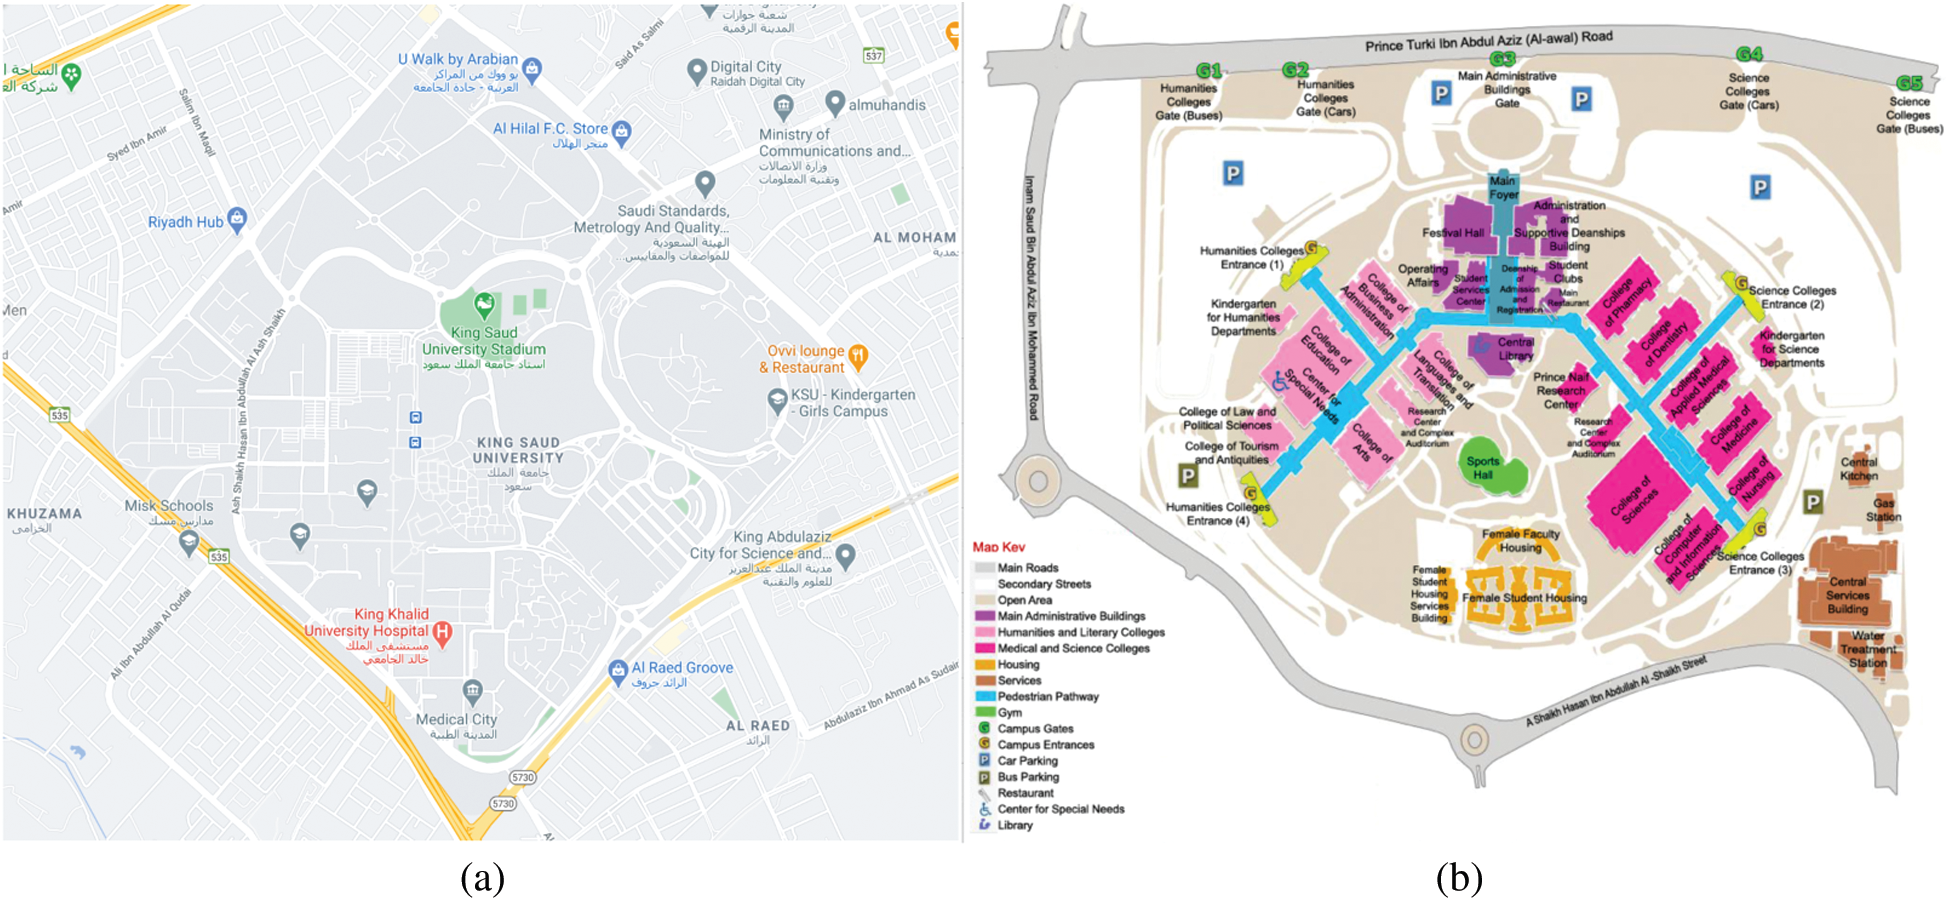
Figure 1: King Saud university and girls’ campus maps. (a) King Saud University (KSU) map, and (b) Girls’ campus map
Our simulator focuses on simulating Girls’ Campus. Additionally, as afternoon peak hours are less challenging than morning peak hours, almost 50%, we will focus on Morning peak hours and their related scenarios and statistics. This area represents an interesting zone for simulation, as it will help to propose solutions for junction points near to the intersection between Prince Turki bin Abdulaziz Al-Awwal road and Imam Saud bin Abdulaziz road which represents the most challenging traffic area. Our simulator will help in analyzing traffic flows in this important area and other areas inside and nearby Girls’ Campus. Accordingly, visualizing and analyzing traffic would help in proposing solutions that reduce traffic issues, achieve traffic control and smooth vehicles movements, minimize delay, reduce accident, and allow safe trips.
Using traffic simulators in smart cities is important because of the increasing number of vehicles. Traffic simulation can simulate movements of large and increasing numbers of vehicles. Moreover, traffic simulations can classify the improvements not only under normal traffic situations but also in overcrowded conditions that would be hard to produce in the real world. Traffic simulators are mainly classified into three different types. The first type is a Microscopic-based traffic simulation which attempts to analyze the flow of traffic by modeling driver-driver and driver-road interactions within a traffic stream. The second type is Macroscopic-based traffic simulation. It aggregates the representation of traffic flow and dimensions of effectiveness for example speed, flow and density. The third type is a Mesoscopic-based traffic simulation which represents traffic as a unit of homogenous of vehicles. Traffic simulators can be also classified into two categories: continuous or discrete. Continuous simulation describes the state variables change in a continuous way. Discrete simulation represents the state variables alteration only at a countable number of points in time [1–5]. Microscopic simulator continuously or discretely simulates the state of individual vehicle speed, simulation speed, junctions, strip width, demand, paths, number of links, and road dimensions. Microscopic traffic simulators can illustrate traffic flow in a realistic way. Each vehicle is modelled separately and allowed to interact locally with other vehicles. Simulation is based on data extracted from GIS files of the simulated area. GeoTools is one of the tools that are used for processing GIS files. GIS files allow constructing the underlying environment and customizing using the given parameters within simulation [1–4].
In this project, we developed a local event-driven microscopic traffic simulator “KSUtraffic” that used to model a real traffic scenario for a confined area. We simulate traffic within King Saud University Girls’ Campus and its nearby areas. We also simulate the actual traffic based on real traffic data. Our simulator is developed to use configuration files which describe links, junctions and routes as input then envision the traffic flow of simulator. The rest of this paper is organized as follows: Section 2 reviews the most relevant and recently published works in this area. Section 3 discusses the design of our simulator. In Section 4, we present experimental design and evaluation. Finally, in Section 5 we conclude our findings with future work.
In this section, we review and compare the most important and relevant traffic simulators in the literature.
2.1 Microscopic Traffic Simulator
Microscopic traffic simulators are powerful, efficient and versatile analysis tools that are globally used for planning in the transportation system. It simulates and models the behavior of each traffic element, such as vehicles and pedestrians, separately and independently which is more realistic. Because of its realistic model, using microscopic simulation for studying and real traffic can help in addressing traffic issues and proposing possible improvements [1–6].
Over the years, there were several traffic simulators developed to imitate real-world traffic. MITSIM [7] is a Microscopic traffic simulator which models traffic networks, evaluates traffic management systems, interacts with a surveillance module and can mimic lane-based homogeneous traffic. Moreover, it has dynamic guidance for the route and advances traffic surveillance system [7]. Another Microscopic traffic simulator is VISSIM, which is presented in [8]. VISSIM is an innovative tool for simulating and designing traffic-actuated control system. Moreover, it uses car following psychophysical model to lengthwise the vehicle movement and the algorithm used is a rule-based which utilizes sets of assertions using if-else statements that for literal movement. VISSIM model’s links, junctions and was designed for small networks at a high level of detail. VISSIM vision aims to be “a worldwide standard in software-based transport planning, traffic engineering and traffic simulation.” VISSIM is a multi-purpose 2D traffic simulator that analyzes and optimizes the traffic flow and dynamically distributes the vehicles among the routes available. Moreover, it allows any kind of pedestrians for crossing the roads and has priority rules modelling. It is also used as a component in the system to give either the analysis part or the simulation part. The parameters in this open source simulator can be edited and can take any scenario as input either as a real-time scenario with real data or any type of scenarios that can be parametrized, it also allows intentional and unintentional accident simulation [9–11].
A simulator called SIM-R [12] was developed for cold areas when roads are either dry or covered with snow to evaluate the structure of roads, by sectioning lanes into 2 types of the first one is a 2 lanes road and the other is 2+1 lane which is a road that has 2 lanes in the same way and one in the opposite. Therefore, SIM-R was created to measure and analyze the effectiveness and the difference between those two types of roads. For open source simulators, SUMO is an open source simulator for urban mobility It is also a microscopic traffic simulator that allows simulation of single vehicles moving through the given road network and modeling each vehicle explicitly. It supports multi-lane simulation with pedestrians. It simulates large road networks, and it is an event-driven real-time simulator [5]. Lastly, DhakkaSim [13] is a microscopic traffic simulator that simulates in 2D. It is an event-driven traffic simulator, it was developed as a non-lane based. It allows pedestrian, it represents vehicles as strips that indicates the size of the cars. It allows alteration of the parameters to fit any type of scenario and it also takes GIS maps as an input. It models roads as links and the junctions as nodes, so its analysis the trip of the vehicle from the start node to the destination node without neglecting the route and the crossed links and nodes.
2.2 Macroscopic Traffic Simulator
Macroscopic simulators are not widely used nowadays, because of the recent innovation of hybrid simulation. where those lacking specification are fellfield by adding the wanted features to TransModeler, such as the type of the input file or the visualization (2D or 3D). TransModeler [14] is one of the recently developed, and still used, macroscopic simulators is suitable for small and large networks with either with 2D or 3D visualization, it allows simulation of all types. In addition, it dynamically chooses the routs by a parameter that can be altered by the user. It allows hybrid simulation to add the wanted features by buying extra features and takes GIS maps as an input [14].
2.3 Mesoscopic Traffic Simulator
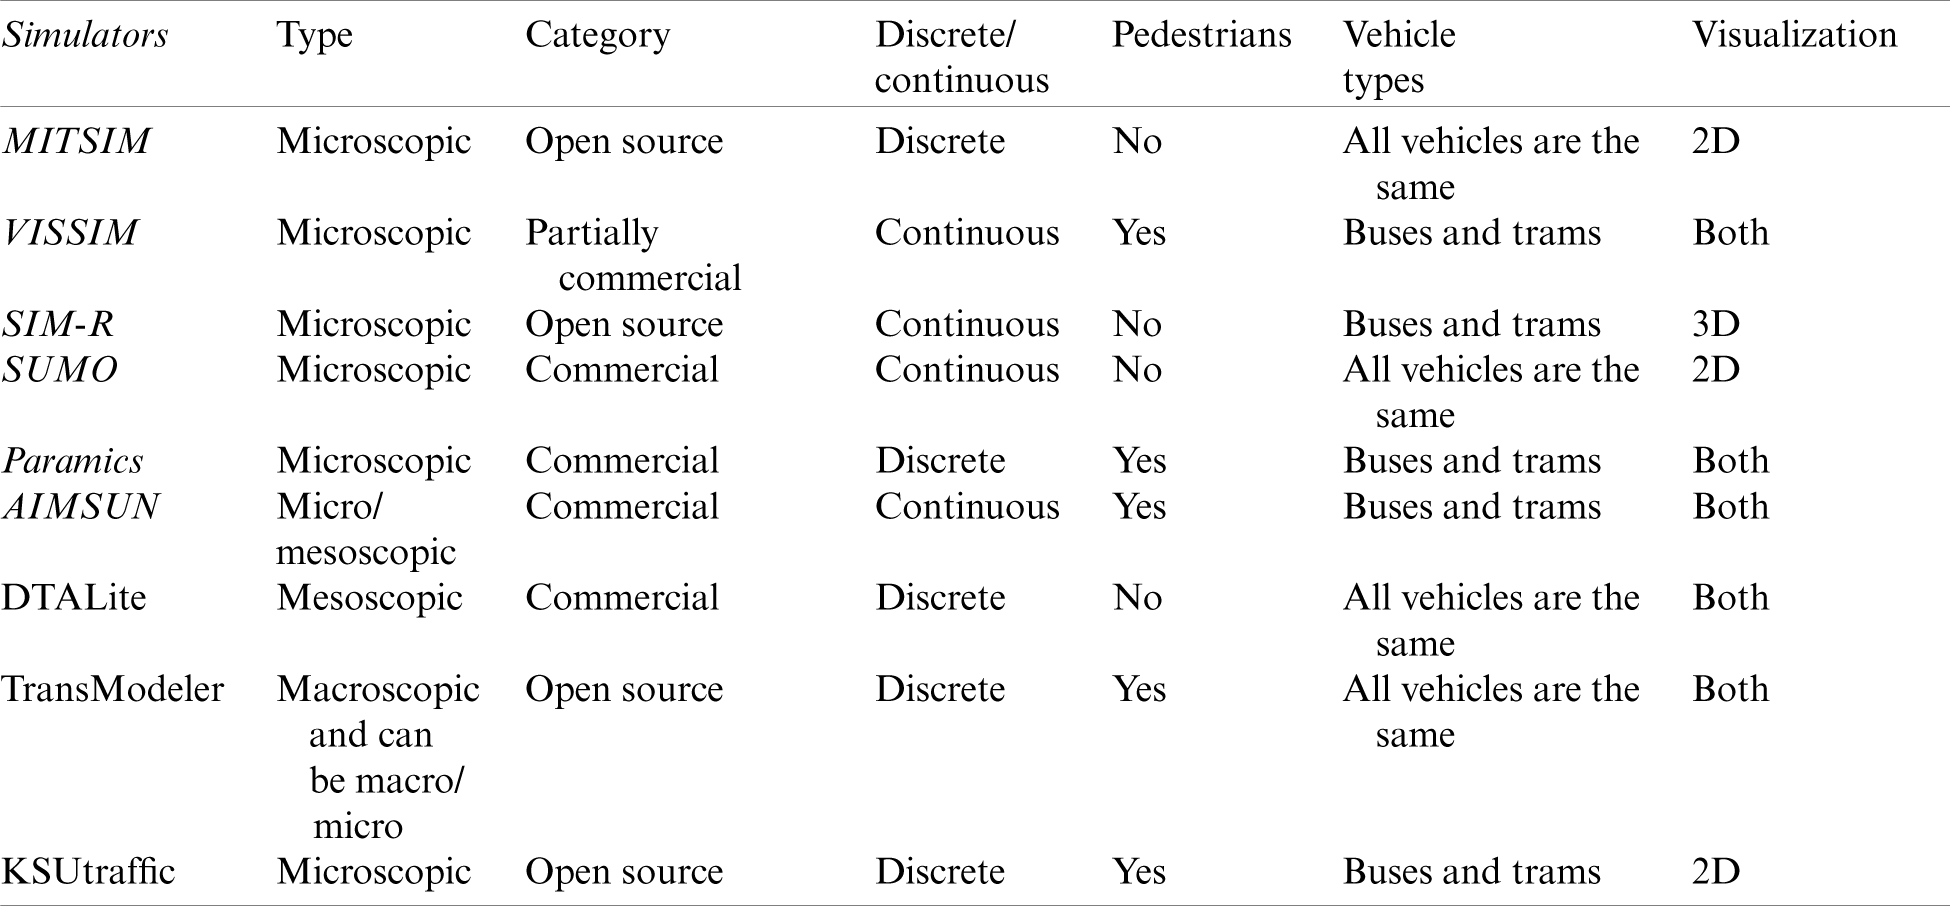
There are many mesoscopic traffic simulators in the literature. DTAlite an open-source mesoscopic DTA simulation package and one of the well-known mesoscopic traffic simulators [15]. It was developed to allow fast utilization to dynamic traffic analysis with shortest path finding. Simulating traffic in DTALite requires setting several parameters to describe the traffic flow, such as: inflow which is the number of vehicle that can enter the capacity or the road that’s being simulated, outflow is the number of vehicle allowed to exit from the simulated road, capacity of the road is the numbers of cars allowed to enter and the capacity of the storage constraints such as the distance between two vehicles or the speed of each vehicle. Tab. 1 concludes and summarizes our discussion of traffic simulators. It compares the presented approaches according to type, and support of GIS maps. In this research project, we aim at developing a microscopic traffic simulator that allows simulating confined local areas. Main features of our simulator are shown in Tab. 1. Furthermore, our simulator will accept GIS files as an input with pedestrians and vehicle of all types and choosing 2D as a visualization option. Additionally, we will customize it to simulate traffic for a confined local area. We decided to simulate KSU Girls’ Campus as an interesting area for traffic simulation because of its location, high traffic demand, and impact of nearby main roads.
Table 1: Summary of traffic simulators
The following subsections explain our approach. We first explain our assumptions on the underlying area then we present the implemented algorithms on each key component of our system. In this section, we will explain the design of our event-driven simulator. We will first explain how the real-world traffic problem and its related aspects are modeled for simulation. Then, we will present the different components (modules) for our simulator. Furthermore, we will also explain how each module works, and interoperability between the different modules. We also highlight how the design of our methodology is specified to meet the research goal and objectives.
In order to simulate traffic flows, real-life elements and their movements need to be appropriately modeled to suit computer-based simulation. In modeling traffic, we adapted a similar model to that presented in [15]. Our traffic model integrates several elements including links that are used to model roads and further modeled into segments and strips. Traffic elements also include nodes that are used to model intersections. These elements have specific attributes that are loaded to the simulator and considered to be constant. Constant elements include links, segments, strips and nodes. Values of constant elements are loaded to the simulator prior to the initialization phase using GIS file. Furthermore, our traffic model also integrates some elements that are considered to be dynamic, such as vehicles and pedestrians. Values of these dynamic elements are assigned based on real traffic statistics, randomly generated, or randomly altered based on a probabilistic model that fit the emergence of traffic. Links represents the real-world roads elements that we want to simulate. A link is a framework of transportation that connects between cities or facilitates. Links are specified using several attributes including length, x and y coordinates, an identifier, link type, the start and end nodes for each link, and list of segments that each link contains. Nodes represent the junction points where links are connected to allow the vehicle to travel from one link to another. The attributes of these intersections include coordinates of each node, an identifier, node type, and a list of links that are attached to.
In our model, each link is composed of a set of segments that are represented as a small block as shown in Fig. 2. Modeling links into segments allows a link to be curved to match real roads of the simulated area. The attributes of these segments include 2D coordinates, an identifier of each segment, an identifier of the link that contains the segment, list of strips that the segment contains, and the number of the accident that occurs in this segment. As explained earlier, roads are modelled and represented as links that are modelled into segments. Segments are further modelled into strips. In each segment, includes a specified number of strips, which specify the lanes. Lanes are used to determine vehicle location, pedestrian location, directions and path separation. The attributes that are associated with strips include: strip identifier, the identifier of the segment that contains the strip, list of vehicles and pedestrians that are currently crossing over it. In Fig. 2, we demonstrated the distribution and the relation between the previously mentioned constant elements. It shows how the real curvy roads are modeled into links, segments and strips to allow simulating the underlying area in our simulator.
Paths are considered as constant element in the simulation. A path specifies the trip taken by a vehicle between a given source and destination nodes. It composed of a set of links and intermediate nodes. The attributes of paths include source and destination nodes identifiers, and a list of links that the vehicle passes over to reach the destination. Vehicles are considered as dynamic elements. they move based on the paths specified in the input scenario. In our microscopic model, vehicles can be of different types and sizes to model the real-life vehicles that vary from small to very large cars. It also allows modeling their movements differently. The attributes of vehicles include: the identifier of the vehicle, type of the vehicle based on its size, the source and destination nodes, the 2D coordinates of each vehicle, vehicle speed, and an identifier that indicates whether or not a vehicle will be involved in an accident throughout the simulation. Pedestrians are walking objects along a road (link) or within a developed area. The attributes of pedestrians mainly include pedestrian 2D coordinates, pedestrian speed, and an identifier that indicates whether or not a pedestrian will be involved in an accident throughout the simulation.
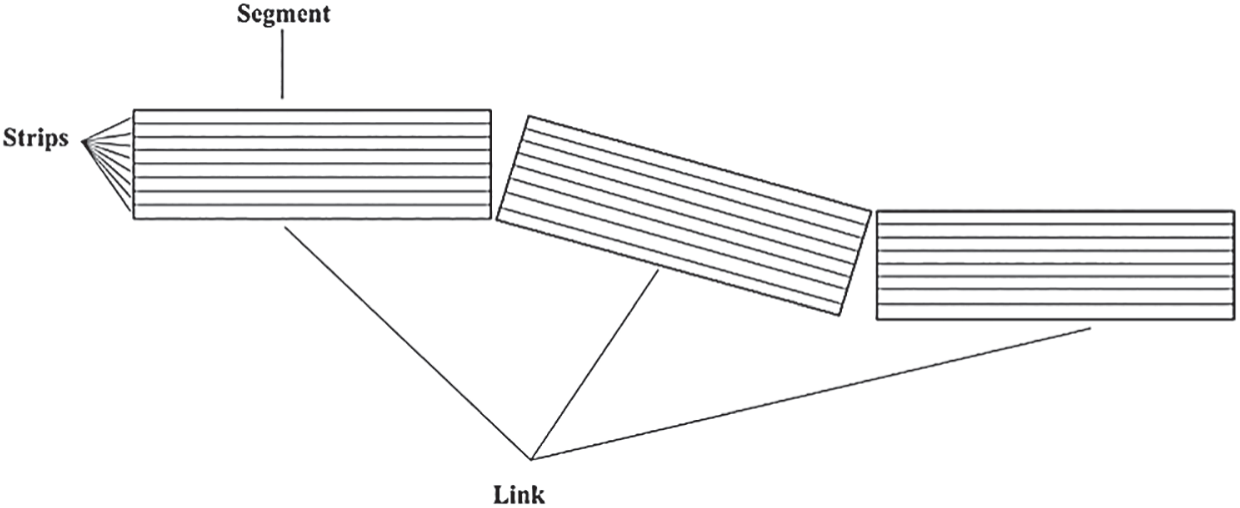
Figure 2: Road modelling in KSUTraffic
Based on the described model in Section 3.1, in this subsection, we present the design of our simulator and its main components.
3.2.1 General Architecture of KSUTraffic
The general architecture of KSUTraffic is composed of three major phases (modules): First phase is reading simulation input and initialization. Second phase is the execution of simulation different modules. Final phase is the calculation of simulation results and traffic statistics. Fig. 3 shows the flowchart representing the logic of our simulator. As the figure shows, the simulator first reads the GIS map, vehicles and pedestrian dataset as input. Then, it initializes the corresponding simulation objects and variables. After that, it will execute the vehicles module which handles the creation of new vehicles and the movements of existing vehicles in each iteration of the simulation. Furthermore, if simulator runs in pedestrians’ mode, it will execute the pedestrian module to deploy new pedestrian and handle movements of existing pedestrians. Simulator keeps executing the corresponding modules in each iteration of the simulation until the given simulation time ends or simulation ended by user. Finally, simulator calculates the simulation output variables including delay, number of accidents and average speed.
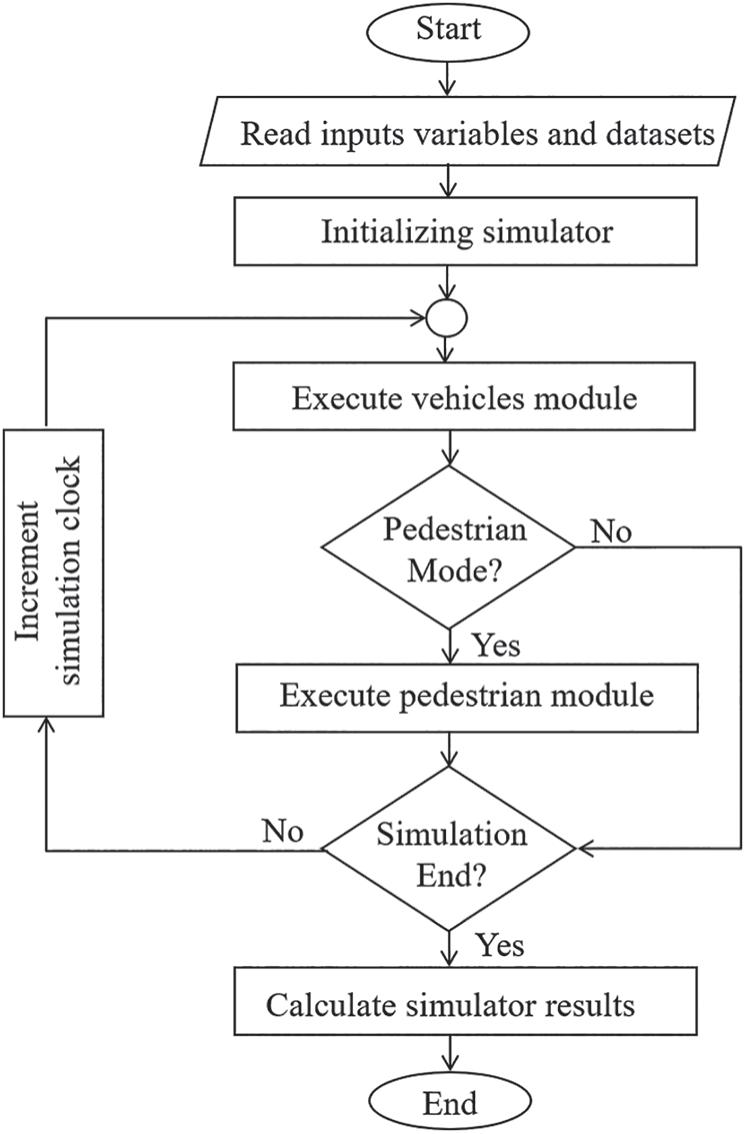
Figure 3: General architecture of KSUTraffic
Fig. 4a shows the flowchart of vehicle module. At the beginning of vehicle module, it checks the previously deployed vehicles stored in the list by using the variable i to walk through the list and keeps them moving between the links according to the predetermined path. Then, the module removes these vehicles that arrived at their final destination. In our simulator, vehicles are deployed based on the input scenario. The input scenario specifies the distribution of vehicles deployment over the simulation time. Furthermore, after executing the movements of the existing vehicles, vehicles module deploys new vehicles based on the timing specified in the scenario. In addition to moving and generating vehicles, this vehicles module handles the different scenarios of moving vehicles from one link to another especially when vehicles are moving through congested points.
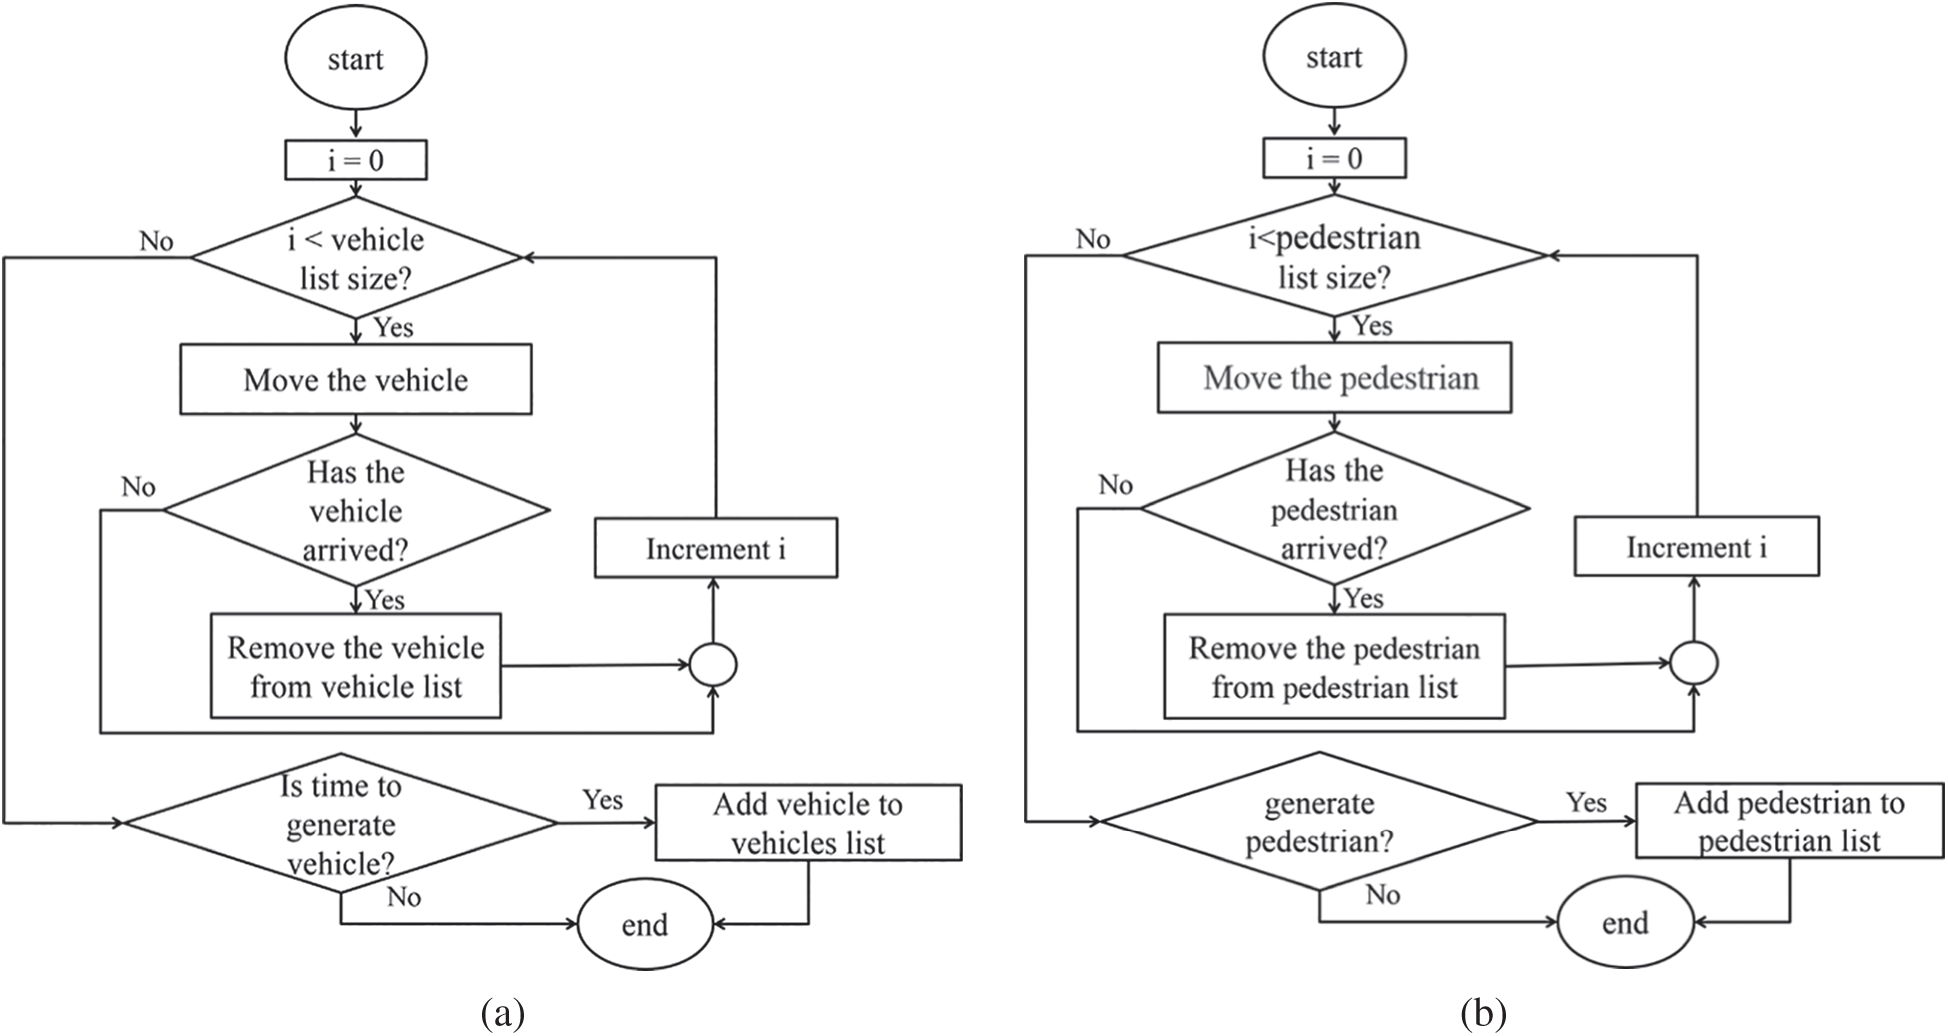
Figure 4: (a) Vehicle module, (b) pedestrian module
Fig. 4b shows the flowchart of the pedestrian module. In the beginning of the pedestrian module, it checks previously deployed pedestrians stored those are in the list by using the variable i to walk through the pedestrian list and keep them moving to cross the strips. Then, it removes them if they arrive to the other side of the link. In addition to the execution of previous pedestrians’ movements, this module is responsible for deploying new pedestrians according to the input scenario.
In order to test our simulator, we designed a number of experiments to manipulate input scenarios based on real traffic statistics, randomly generated scenarios, and randomly uniform distribution scenarios. Accordingly, KSUTraffic generates and analyzes different performance results. Then, it computes traffic statistics in order to provide users with various statistics. As explained earlier, the datasets that we are using in testing KSUTraffic includes a GIS file that covers KSU Girls’ Campus. In addition, our dataset includes real statistics of numbers of vehicles. These statistics are necessary as they are used to design experiments that affect traffic performance and simulation results. The pedestrians are deployed randomly when the simulator runs pedestrians’ mode. Unfortunately, there are no statistics provided for the number of pedestrians and their movements, but we restricted their movement in the known pickup points in KSU Girls’ Campus such as entrances of colleges and Kindergartens.
Sketching simulated area is one of the most important parts in KSUTraffic. The map is an essential part to build KSUTraffic project. Therefore, we needed to draw the map manually to represent links and nodes particularly for our simulator. In drawing the map manually, each link and node must be correctly placed in its corresponding location. Manual drawing of the underlying map also allows understanding and dealing with details as well as representing the statistics and text files in an appropriate format. Sketching covers parts of Prince Turki AlAwwal road, parts of Imam Saud road, KSU Internal Rings driveway, main driveways in KSU Girls’ Campus and buses parking for Humanities Colleges and Scientific Colleges. Fig. 5a shows the KSU main hall sketching and parts of Prince Turki AlAwwal road, (b) shows Humanities Colleges and parts of Prince Turki AlAwwal road, (c) shows Scientific Colleges and its parts of Prince Turki AlAwwal road, (d) shows KSU Internal Rings driveway, parts of Prince Turki AlAwwal road and parts of Imam Saud road.
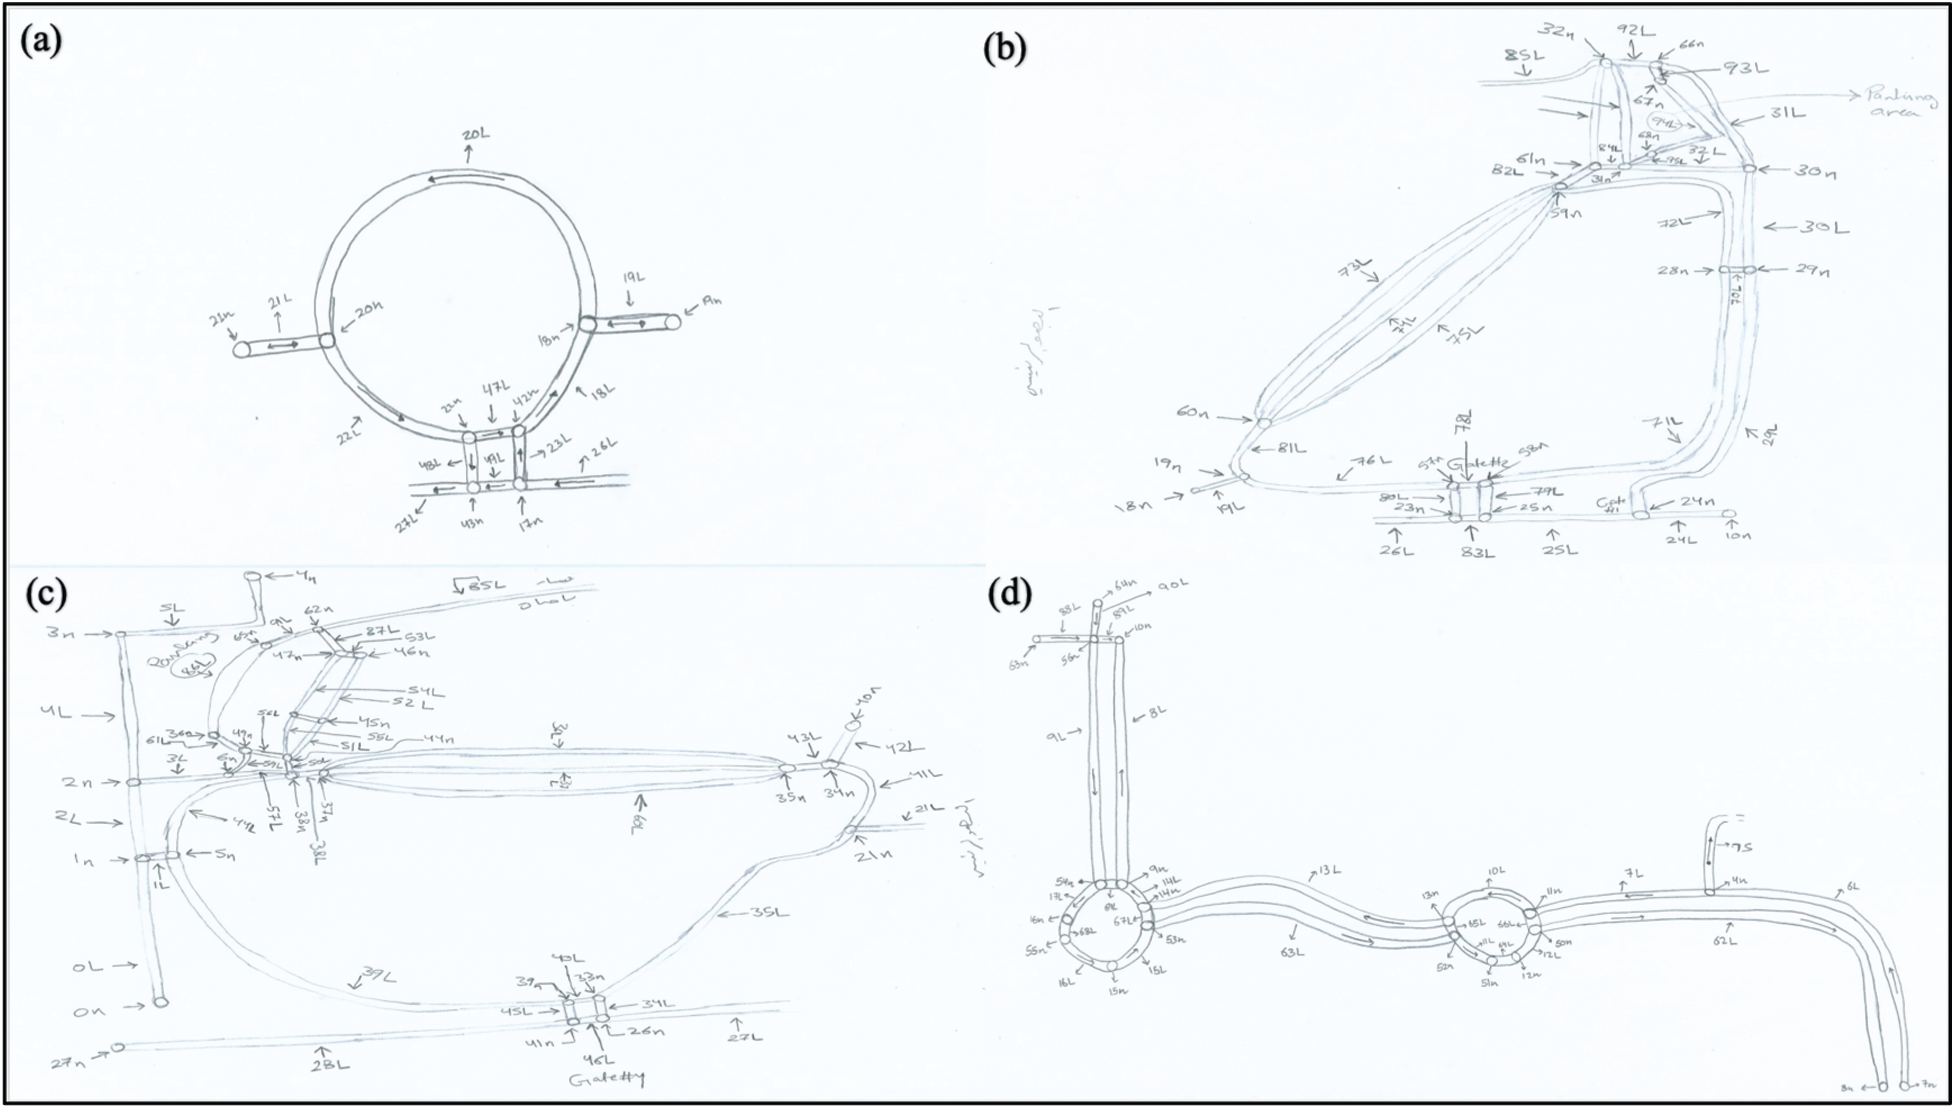
Figure 5: Sketching: (a) Main hall sketching, (b) humanities colleges sketching, (c) scientific colleges sketching, (d) KSU internal rings driveway sketching
We altered the simulator inputs: path and demand in random factor. The number of vehicles and possible Paths for each vehicle are randomly generated. we manipulated the simulator attributes with a uniform random factor. We ran the simulator’s vehicles each to a random destination based on the all possible paths. Furthermore, the path of each vehicle is fed to the simulator in discrete time manner from the input text file which is written randomly for each vehicle. There are two main types of vehicles: cars and buses. We characterized each car with three characteristics: color, size and speed. We classified cars according to their size. There are two sizes of cars: medium and small size. Medium cars are marked as green color and small cars are marked as red color. Car’s speed is specified relevant to its size. Specifically, each car has a random speed within a specific domain according to its type. The speed of small cars has a greater speed than medium cars. Delay in KSUTraffic represents the cars duration time it takes from source to destination. When all the cars in this link leave, the average speed of all cars will be calculated. The length of the link is fixed. The delay unit measurement is hour. Delay Formula is shown in Eq. (1) below:
In KSUTraffic, it takes the average of running the simulator iteratively for each link. It shows results in two statistics approaches: The first approach is the average delay for all links in one simulation iteration. The second one is the average delay for each link to all the iterations.
Our simulator runs in two modes: pedestrian mode or non-pedestrian. When KSUTraffic runs in pedestrian mode, pedestrians’ deployment is performed randomly using Poisson distribution. In each iteration, the number of generated pedestrians is modified randomly. Also, it moves the pedestrians to cross the roads, and the pedestrian who had successfully passed over the road will be removed.
Randomness is important for any simulation experiment. Random processes can be modeled using Poisson distribution, such as the number of vehicles to generate in a specific time. Poisson distribution is explained below where p(x) is the probability of x events and
We executed KSUTraffic 20 iterations for each experiment. In random with real vehicles statistics experiment, the average of the average delay per links is 0.1885. The delay is affected by the link length. Therefore, increasing link length increases delay. On the other hand, when speed increases the delay decreases. The other part of the experiment is changing the percentage of accidents for each iteration. We chose the percentage range from 3% to 22%. On another hand, the average of the average accidents per link is 0.0146. The percentage of accidents is not affected if the link does not have any pickup or drop off points. In addition, accidents would not appear unless there is an accident between a pedestrian and a vehicle. Results are shown in Figs. 6–10.
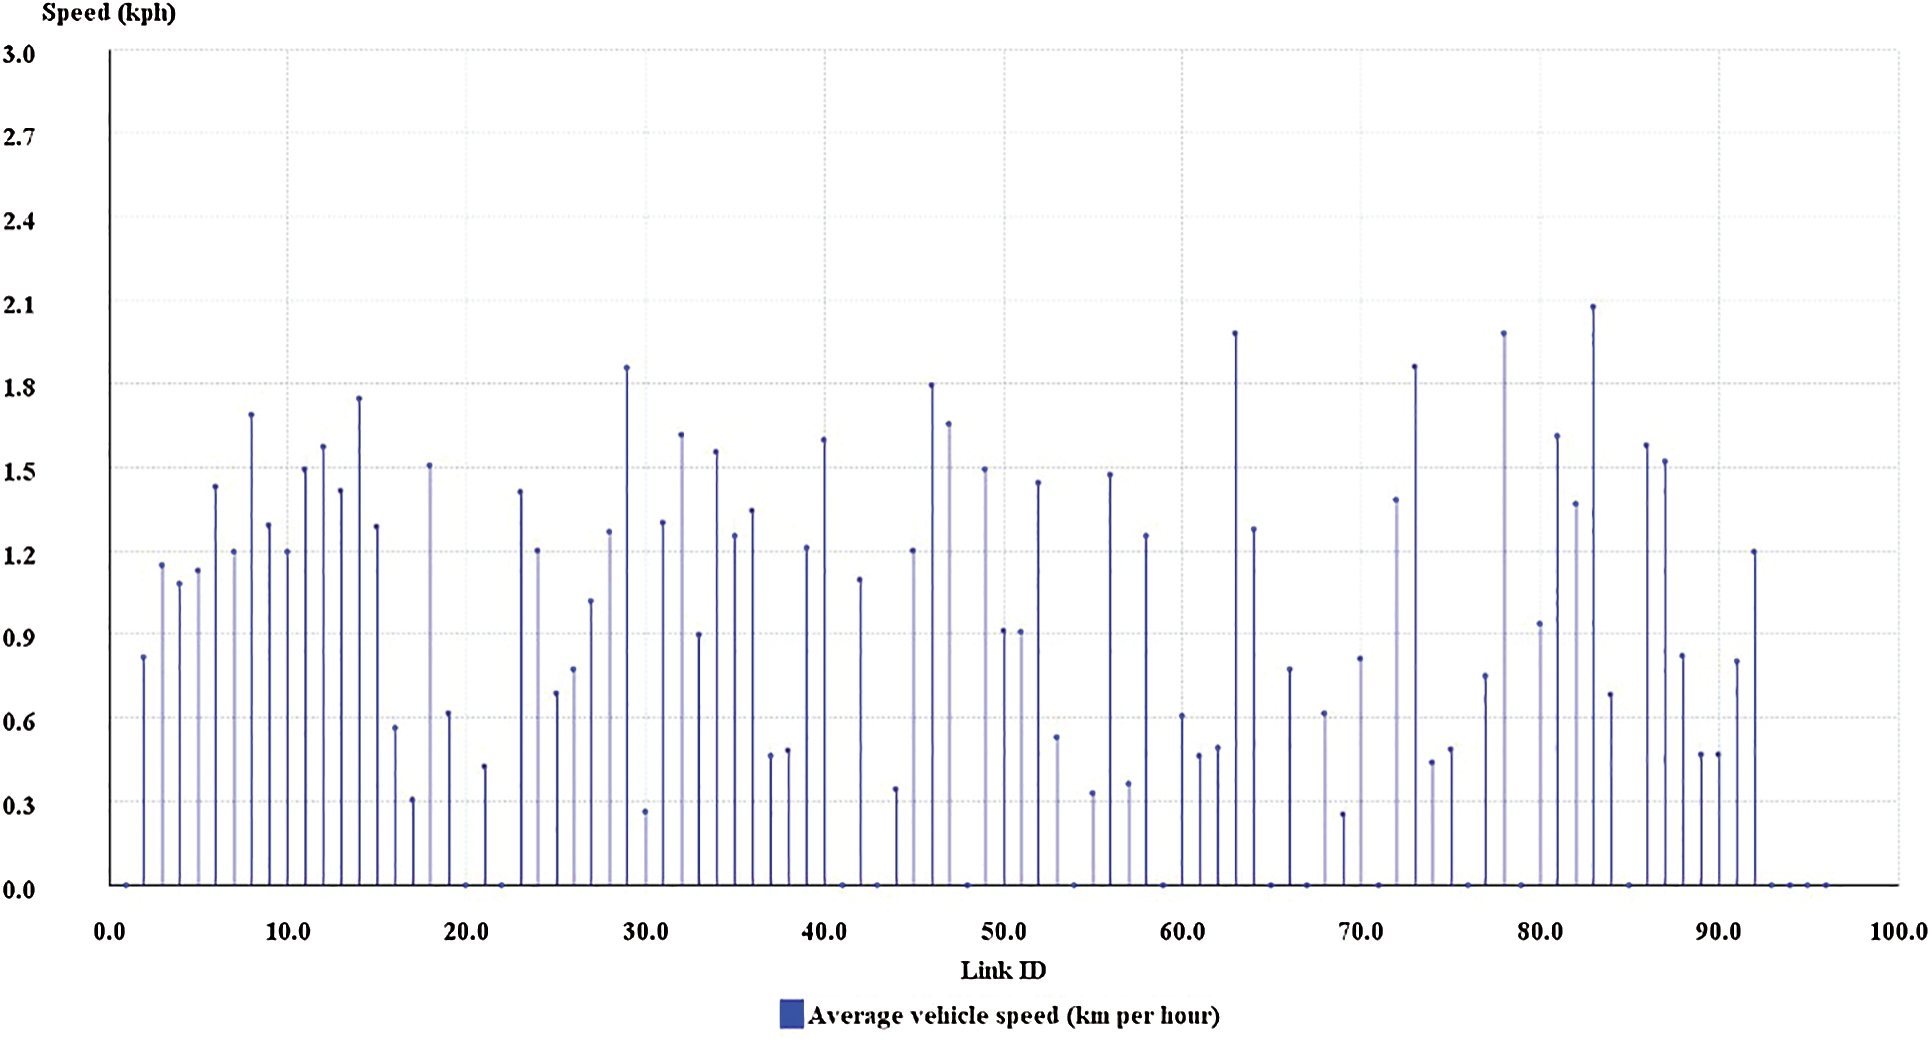
Figure 6: Average speed for pedestrians
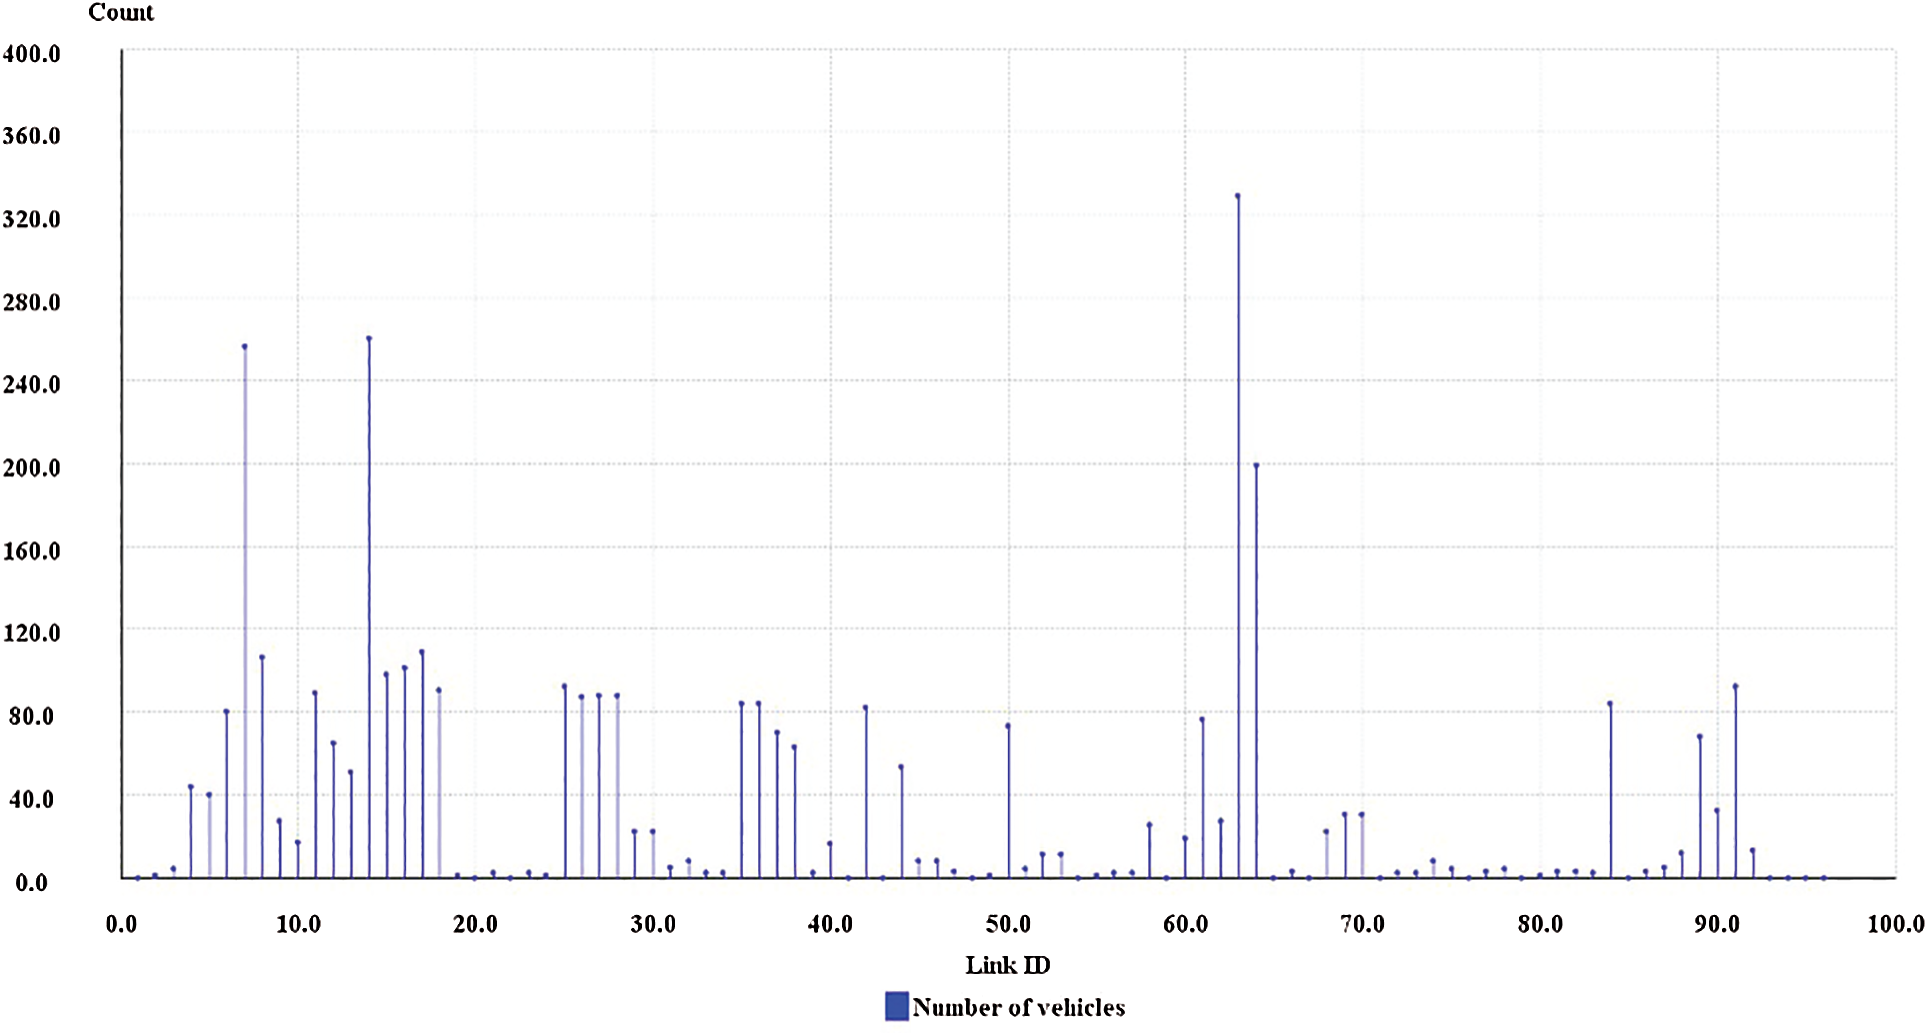
Figure 7: The corresponding number of vehicles for results presented in Fig. 6
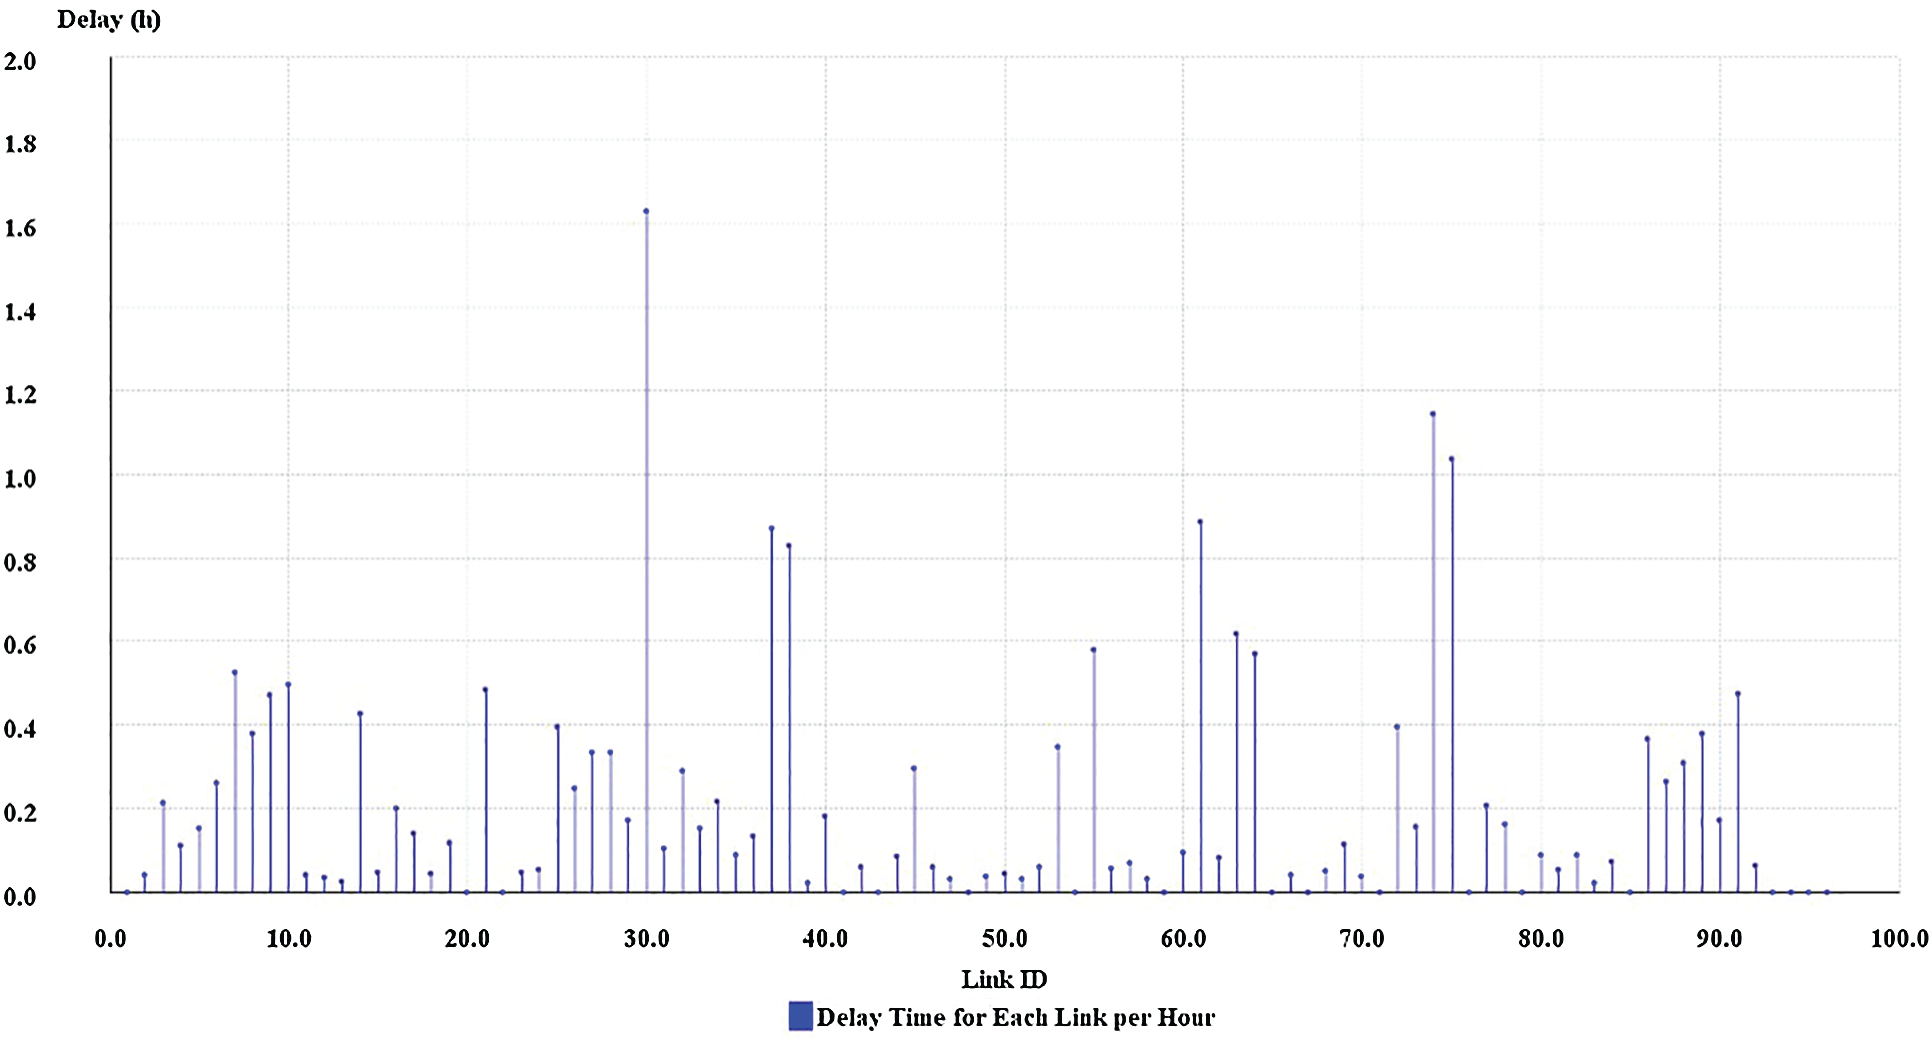
Figure 8: Delay time for each link per hour
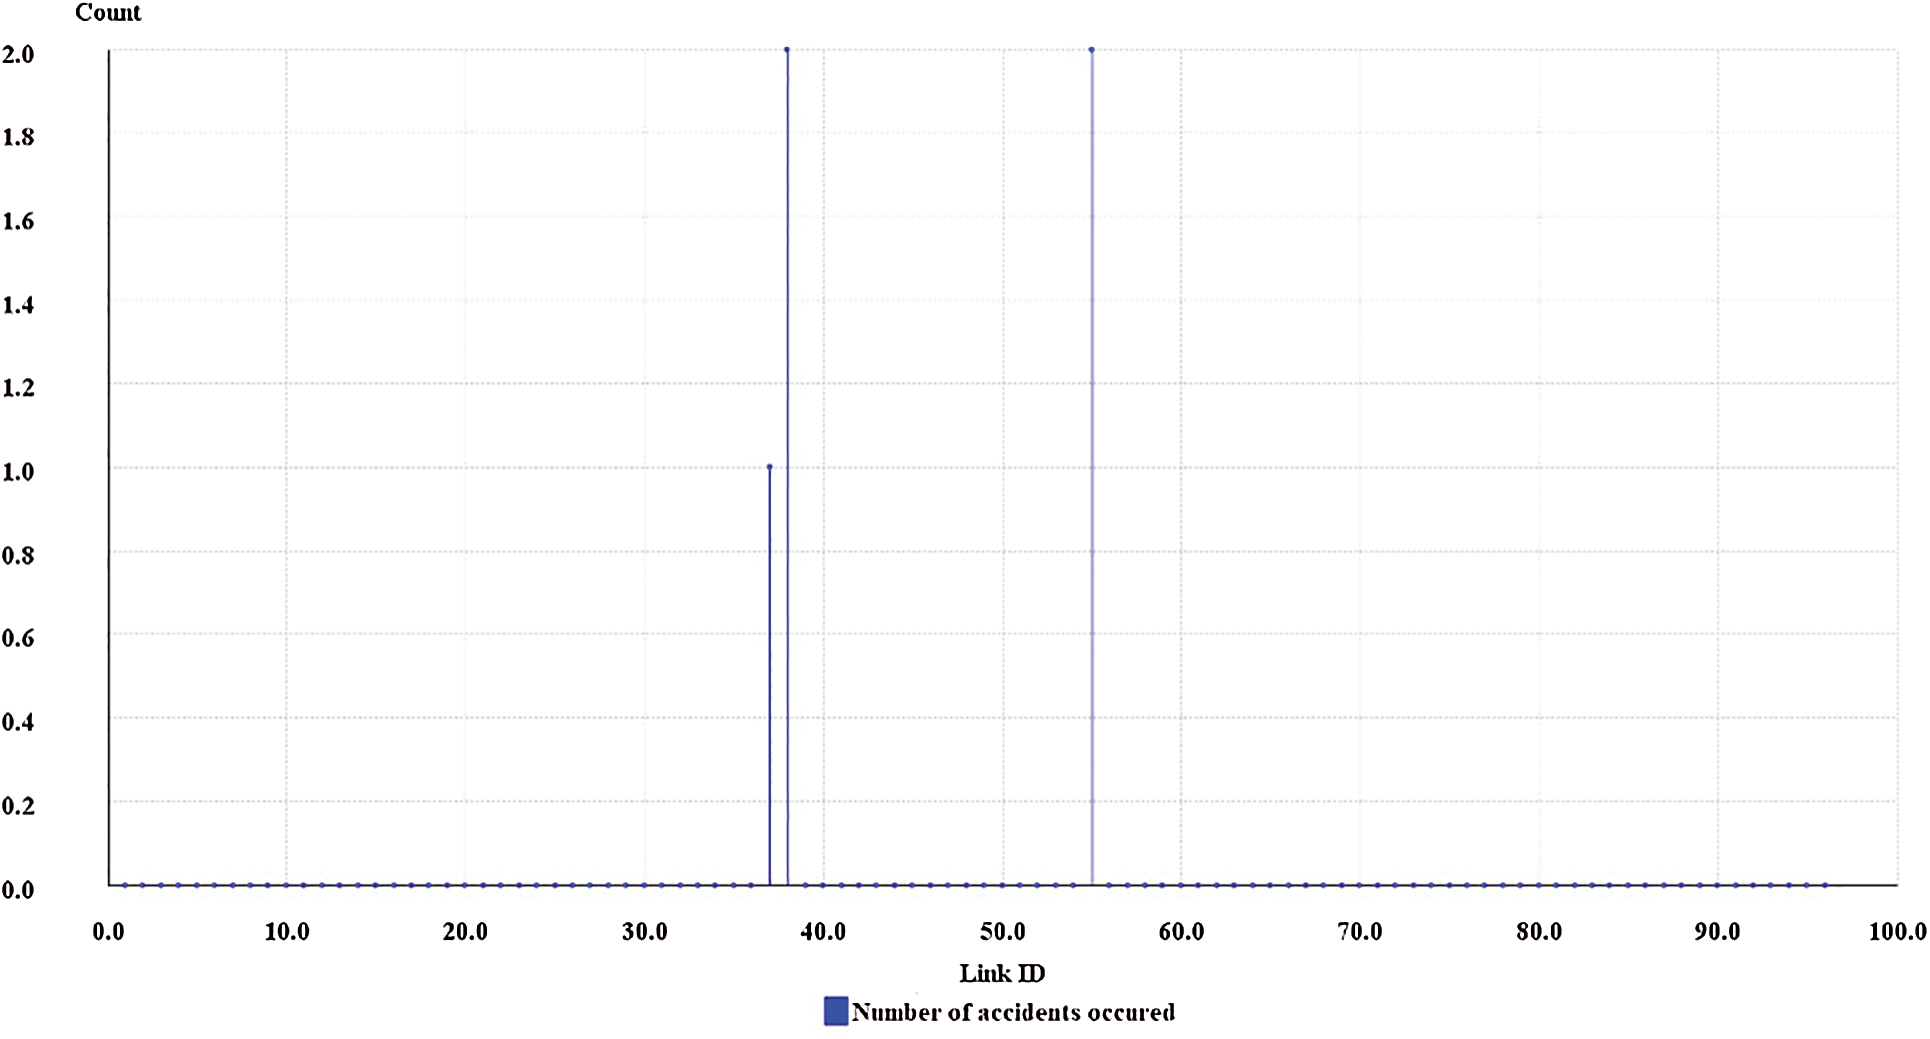
Figure 9: Number of accidents (accidents percentage 0.22%)
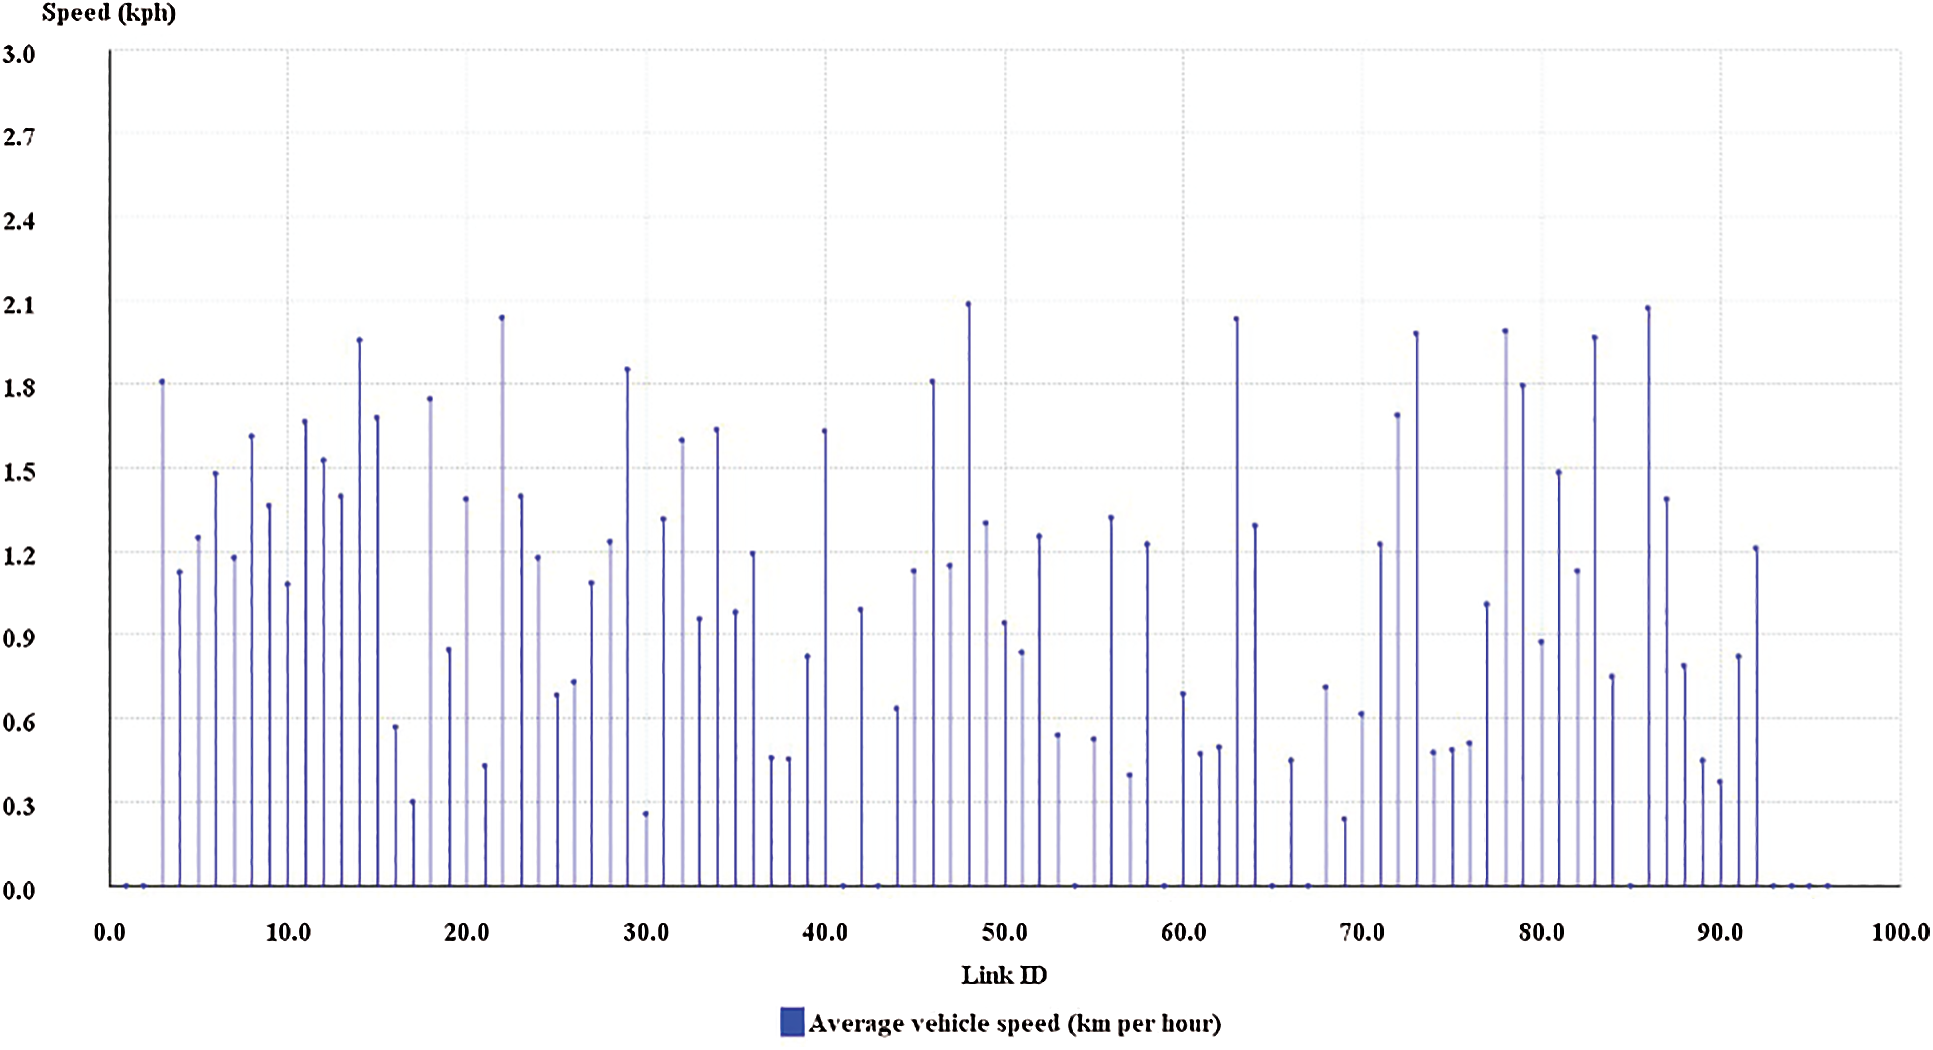
Figure 10: Average Speed (accidents percentage 0.22%)
Traffic simulation is one of the most interesting approaches for studying traffic as it provides traffic engineers with high resolution and fast efficient results. Nowadays the traffic simulation software has expanded to be available to be used and utilized by community members including consultants, users, companies, and researchers. Because of its ability to mimic the flow of traffic based on each dynamically moving vehicle, microscopic traffic simulators are considered to be the most interesting and widely used traffic simulators. Moreover, microscopic traffic simulators support many features such as lane-based approach, both 2D or 3D visualization, and continuous or discrete event-based simulation.
In this research, we developed an event driven microscopic traffic simulator that is customized to simulate real traffic scenarios within a local confined area. The selected area is KSU Girls Campus. The area is specified using GIS map of KSU Girls’ Campus. In addition, our simulation model contains several constant and dynamic elements that help to mimic real-world objects. Our traffic model has many elements to specify the real traffic including links, nodes, segments, strips, vehicles, pedestrians and path. A number of experiments were designing to provide enough manipulation analysis of traffic scenarios.
Acknowledgement: We would like to thank professor A. B. M. Alim Al Islam for his assistance and contributing this work.
Funding Statement: The authors extend their appreciation to the Deanship of Scientific Research at King Saud University for funding this work through research Group No. RG-1441-331.
Conflicts of Interest: The authors declare that they have no conflicts of interest to report regarding the present study.
1. B. Matcha, S. Namasivayam, M. Fouladi, K. C. Ng, S. Sivanesanet al., “Simulation strategies for mixed traffic conditions: A review of car-following models and simulation frameworks,” Journal of Engineering, vol. 2020, no. 10, pp. 1–22, 2020. [Google Scholar]
2. D. McKenney and T. White, “Distributed and adaptive traffic signal control within a realistic traffic simulation,” Engineering Applications of Artificial Intelligence, vol. 26, no. 1, pp. 574–583, 2013. [Google Scholar]
3. F. Jiménez, “Intelligent vehicles: Enabling technologies and future developments,” in Butterworth-Heinemann, vol. 1, Madrid, Spain: Elsevier, pp. 395–436, 2018. [Google Scholar]
4. B. Kaminski, L. Krainski, A. Mashatan, P. Pralat and P. Szufel, “Multiagent routing simulation with partial smart vehicles penetration,” Journal of Advanced Transportation, vol. 2020, no. 1, pp. 1–11, 2020. [Google Scholar]
5. P. A. Lopez, M. Behrisch, L. Bieker-Walz, J. Erdmann, Y. P. Flotterod et al., “Microscopic traffic simulation using SUMO,” in Proc. 2018 21st Int. Conf. on Intelligent Transportation Systems (ITSC), Maui, HI, pp. 2575–2582, 2018. [Google Scholar]
6. Riyadh Metro, (Accessed 25 August 20202020. [Online]. Available: http://riyadhmetro.sa/ar. [Google Scholar]
7. M. Saidallah, A. El Fergougui and A. E. Elalaoui, “A comparative study of urban road traffic simulators,” in Proc. MATEC Web Conf., Meknes, 2016. [Google Scholar]
8. L. Lengyel, “Validating rule-based algorithms,” Acta Polytechnica Hungarica, vol. 12, no. 4, pp. 59–75, 2015. [Google Scholar]
9. P. Group, “PTV vissim,” 2012. [Online]. Available: http://vision-traffic.ptvgroup.com/en-us/products/ptv-vissim/. [Google Scholar]
10. F. Huang, P. Liu, H. Yu and W. Wang, “Identifying if VISSIM simulation model and SSAM provide reasonable estimates for field measured traffic conflicts at signalized intersections,” Accident Analysis and Prevention, vol. 50, pp. 1014–1024, 2013. [Google Scholar]
11. P. Liu, X. Qu, H. Yu, W. Wang and B. Cao, “Development of a VISSIM simulation model for u-turns at unsignalized intersections,” Journal of Transportation Engineering, vol. 138, no. 11, pp. 1333–1339, 2012. [Google Scholar]
12. K. Munehiro, A. Takemoto, S. Kasai and M. Asano, “Analysis on rural highway design using traffic micro-simulation in cold regions,” Procedia Social and Behavioral Sciences, vol. 16, pp. 388–399, 2011. [Google Scholar]
13. Q. M. Alam, “Towards simulating non-lane based heterogeneous road traffic of less developed countries,” in Proc. 5th Int. Conf. on Information and Communication Technology for Sustainability, Toronto, ON, Canada, pp. 37–48, 2018. [Google Scholar]
14. “TransModeler: Traffic simulation software,” 2016. [Online]. Available: http://www.caliper.com/transmodeler/. [Google Scholar]
15. X. Zhou and J. Taylor, “DTALite: A queue-based mesoscopic traffic simulator for fast model evaluation and calibration simulator for fast model evaluation and calibration,” Cogent Engineering, vol. 1, no. 1, pp. 1–20, 2014. [Google Scholar]
 | This work is licensed under a Creative Commons Attribution 4.0 International License, which permits unrestricted use, distribution, and reproduction in any medium, provided the original work is properly cited. |