DOI:10.32604/cmc.2021.014199
| Computers, Materials & Continua DOI:10.32604/cmc.2021.014199 | |
| Article |
Diagnosis of COVID-19 Infection Using Three-Dimensional Semantic Segmentation and Classification of Computed Tomography Images
1Department of Computer Science, University of Wah, 47040, Pakistan
2Department of Computer Science, Comsats University Islamabad, Wah Campus, 47040, Pakistan
3College of Electrical and Mechanical Engineering, National University of Sciences & Technology (NUST), Islamabad, 44000, Pakistan
4Department of Computer Science and Engineering, Soonchunhyang University, Asan, 31538, Korea
5Department of Mathematics and Computer Science, Faculty of Science, Beirut Arab University, 115020, Lebanon
6Faculty of Information Technology, Monash University, Clayton, Victoria, 3800, Australia
*Corresponding Author: Yunyoung Nam. Email: ynam@sch.ac.kr
Received: 16 September 2020; Accepted: 10 February 2021
Abstract: Coronavirus 19 (COVID-19) can cause severe pneumonia that may be fatal. Correct diagnosis is essential. Computed tomography (CT) usefully detects symptoms of COVID-19 infection. In this retrospective study, we present an improved framework for detection of COVID-19 infection on CT images; the steps include pre-processing, segmentation, feature extraction/fusion/selection, and classification. In the pre-processing phase, a Gabor wavelet filter is applied to enhance image intensities. A marker-based, watershed controlled approach with thresholding is used to isolate the lung region. In the segmentation phase, COVID-19 lesions are segmented using an encoder-/decoder-based deep learning model in which deepLabv3 serves as the bottleneck and mobilenetv2 as the classification head. DeepLabv3 is an effective decoder that helps to refine segmentation of lesion boundaries. The model was trained using fine-tuned hyperparameters selected after extensive experimentation. Subsequently, the Gray Level Co-occurrence Matrix (GLCM) features and statistical features including circularity, area, and perimeters were computed for each segmented image. The computed features were serially fused and the best features (those that were optimally discriminatory) selected using a Genetic Algorithm (GA) for classification. The performance of the method was evaluated using two benchmark datasets: The COVID-19 Segmentation and the POF Hospital datasets. The results were better than those of existing methods.
Keywords: Deeplabv3; fusion; genetic algorithm; gabor; watershed
SARS-CoV-2 (also known as COVID-19) is a novel coronavirus. The disease caused by the virus has been declared a pandemic by the World Health Organization (WHO) and has spread to more than 170 countries worldwide. Globally, more than 10 million people have been infected. Recently, the WHO has stated that 33,842,281 COVID-19 cases have been confirmed worldwide, as have 1,010,634 deaths. In Pakistan, COVID-19 is spreading rapidly; a recent report described 312,263 confirmed cases, 6,479 deaths, and 296,881 recoveries.
The treatment of such patients in special care units requires early detection of COVID-19 to increase the survival rate. Separation of healthy people from affected patients is the prime objective; this is possible only if diagnosis is early. The diagnostic technique using throat swabs is 30% to 60% accurate, which means that undiagnosed patients may commonly infect healthy people [1–6]. COVID-19 infection can be diagnosed with high sensitivity using a chest X-ray; the disease correlates with certain visual indices [7,8]. The ground glass pattern is present in the early stage but is located at the edges of pulmonary vessels that may be difficult to observe [9]. COVID-19 infection has been reported to be associated with diffuse airspace opacities or patchy asymmetry [10]. Only expert radiologists can interpret such indirect abnormalities. Given the shortage of trained radiologists and the huge numbers of affected patients, automatic abnormality identification would assist early diagnosis. Automation is possible using Artificial Intelligence (AI) and other potentially powerful Machine Learning (ML) methods [11–13]. Here, we take a unique approach toward early COVID19 infection detection. The principal steps of our approach are:
Pre-processing is performed using a Gabor filter to enhance image intensities, and a marker controller watershed with thresholding is used to segment the actual lung region.
1. The lesion is segmented using a three-dimensional (3D) semantic segmentation model. In this model, the deeplabv3 network serves as the bottleneck of the moblenetv2 module. The combination of these convolutional neural networks accurately segments the infected lung region.
2. The GLCM and statistical features are computed from the segmented regions, and then fused and optimized by the Genetic Algorithm (GA) used for classification.
The structure of the manuscript is as follows: in Section 2, related work is described; in Section 3, our work is explained; in Section 4, the findings and discussion appear; and, in Section 5, conclusions are finally drawn.
Computerized imaging techniques are important when seeking to diagnose COVID-19 infection early. Computed tomography (CT) of the chest is preferred to X-ray [14–20]. Given the increasing numbers of COVID-19 patients, hospitals are overloaded. Manual scan evaluation by radiologists is time-consuming and tedious; the risk of error may increase if the radiologist is under pressure [21]. Therefore, automated methods of efficient and accurate diagnosis would aid decision-making [22].
Artificial intelligence methods play important roles when learning the patterns of many CT images and then making predictions based on those patterns [23–26]. Pre-trained deep learning models [27] (Dense Net, GoogleNet, and AlexNet, etc.) have received considerable attention over the past decades because these models are already trained using big data. A 3D deep learning model is used for classification [28]. Accurate segmentation poses a great challenge because lesions develop at borders and redundant features degrade model accuracy. Thus, in this work, we employed a U-Net model for segmentation, feature extraction, and selection of the framework for COVID-19 CT image classification. Tab. 1 summarizes the existing literature.
Table 1: Existing machine/deep learning methodologies

The proposed model features three major phases:
In Phase 1, a Gabor filter with fine-tuned parameters is used in the pre-processing phase to improve image quality.
In Phase 2, the lung region is segmented using a marker-controlled watershed method. Deeplav3 serves as the bottleneck of the mobilenetv2 module used to segment the actual lesions of COVID-19.
In Phase 3, geometrical and statistical features are computed from each segmented image. The extracted characteristics are serially fused and, on addition of a GA, redundant features are eliminated. Each vector of optimized functionality is forwarded to the COVID-19 classifiers.
Fig. 1 shows these steps.
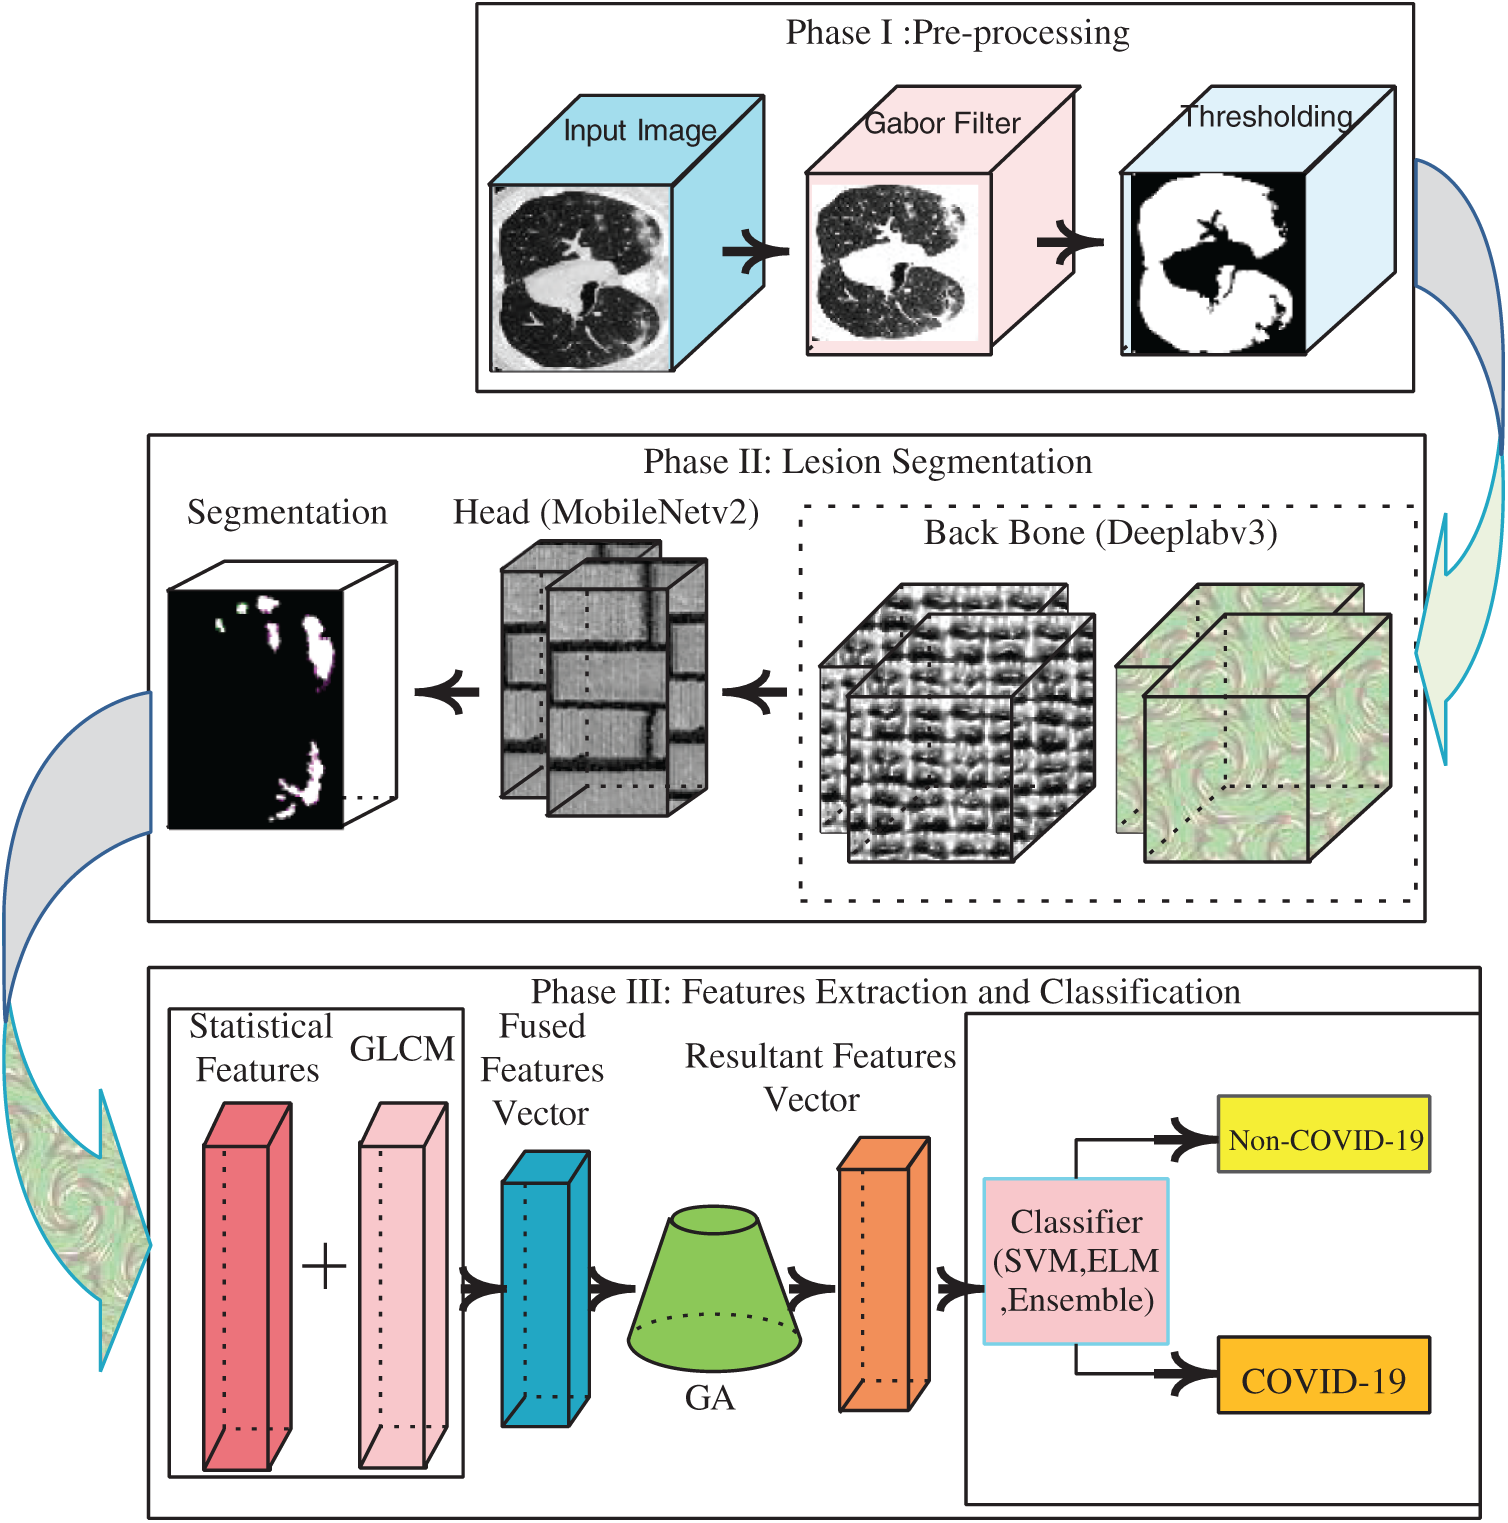
Figure 1: Proposed architecture of COVID-19 detection
3.1 Preprocessing Using Gabor Wavelet Filter
We applied the Gabor filter (a linear filter devised by Dennis Gabor) to CT images when analyzing textural patterns that contain rich information related to pathology. The filter analyzes the specific frequency contents in certain image directions. In the spatial field, a 2D Gabor filter with a Gaussian kernel is modulated via a plane sinusoidal wave. Given the convolution multiplication property, the Fourier transform of the impulse response (the Gabor filter) is convolved with the Fourier transform of the harmonic (sinusoidal) function and a Gaussian function. A Gabor filter is mathematically expressed as:
where B and C denote normalizing factors and f represents frequency. The Gabor-filtered images and the original CT images are illustrated in Fig. 2.

Figure 2: Gabor filtered image (a) CT image (b) filtered outcome
A marker-controlled watershed approach with thresholding was then applied to the Gabor-filtered images to segment the actual lung surface, as shown in Fig. 3. In this method, morphological operations such as opening and closing (using five disc-shaped structuring elements) are applied to remove extraneous regions. The lung region is extracted using a thresholding method in which the background is marked and the background pixels eliminated. The morphological operations are defined as:
where

Figure 3: Lung region of segmentation (a) original CT image (b) lung region (c) segmented lung region
3.2 COVID-19 Segmentation Using Deep Convolutional Neural Network
We propose a new semantic segmentation model in which deeplabv3 serves as the bottleneck of mobilenetv2. There are 186 layers, thus 1 input layer; 70 convolutional layers; two 2D cropping layers; 59 batch norm layers; 43 ReLU layers; eight addition layers; and single depth concatenation, softmax, and pixel classification layers. The primary goal of the model is to assign semantic class labels pixel-by-pixel in the input image. The model is fine-tuned using the learning parameters shown in Tab. 2 to aid precise segmentation. The proposed model layers with the activation units are shown in Fig. 4.
Table 2: Optimization parameters for proposed segmentation model


Figure 4: Activations of proposed semantic segmentation model (where 16 blocks consist of convolutional, batch-normalization and ReLU layers, two transpose convolutional layers, 01 crop 2D layer and 01 pixel classification layer)
The proposed segmentation outcomes are illustrated in Fig. 5.

Figure 5: COVID-19 segmentation (a) Input image (b) COVID-19 segmentation (c) Ground truth annotation
3.3 Proposed Fused Features Vectors
The GLCM features extracted from the segmented region (

Figure 6: Features extraction/selection for COVID19 classification
3.3.1 GLCM Features Extraction
The GLCM of an image
Here, n is the sum of elements in G, and
Energy is used to measure local textural homogeneity within an image.
Entropy is used to measures the randomness.
where r denotes the number of intensity levels
Variance is utilized to evaluate the distribution of intensity values.
Homogeneity
Cluster prominence (
Cluster shade
Dissimilarity (
3.3.2 Statistical Features Extraction
The three statistical features of length
3.4 Features Selection Using GA
In this study, GLCM features were computed in terms of mean, range, and variance and later fused with statistical features such as area, perimeter, and circularity. The length of each fused feature vector is

The vector of the resulting features was transferred to an SVM [34], an Ensemble Tree, and an ELM [35] classifier. The Ensemble Tree classifier featured a LogitBoost kernel, a learning rate of 0.44478, and 349 tree split parameters for training. The ELM [36] employed 200 hidden units for training, and the multiclass SVM model was trained on a maximum of 30 epochs.
In this work, two types of experiments were performed. The first evaluated segmentation method performance using the ground truth annotations and the second explored the classification of CT images.
We used two datasets to validate our proposed approach: The POF Hospital dataset and the COVID-19 segmentation dataset. The POF hospital CT dataset contains data on 100 confirmed COVID-19 patients (2,879 positive CT images of 4,089 CT images). The COVID-19 segmentation dataset consists of the CT imaging data on 40 patients (each of 100 axial slices) and ground truth images. The classification data contain 373 positive and 456 negative slices [37].
4.1 Experiment #1 (Evaluation of Segmentation Method)
In this experiment, semantic segmentation was performed using a group of similar pixels as revealed by their class labels. The prediction was performed at the pixel level; each image pixel was classified based on the corresponding class label. The results of the proposed segmentation method are compared pixel-by-pixel with the ground truth images in Fig. 7.

Figure 7: Segmentation with annotated images (a) input (b) proposed segmentation (c) ground truth
The segmentation technique performance was validated in terms of various measures such as accuracy (mean and global), Intersection Over Union (IoU) (mean and weighted), and Boundary Contour Matching (BF) scores mathematically expressed as follows:
The IoU is also termed the Jaccard index, and computes the proportions of correctly classified pixels among the predicted and ground truth pixels.
The IoU is computed in terms of mean and weighted values. The mean IoU measures the average IoU of all classes in a particular image. The average IoU of a certain class is weighted by the number of pixels in that class. Th boundary F1 scores compute the proportions of class boundaries that align with the actual boundaries.
The results of the proposed segmentation method are listed in Tab. 4, and show that the proposed method performed well.
Table 4: Segmentation results with ground truth annotation on COVID-19 segmentation dataset

4.2 Experiment #2 (Evaluation of Classification Approach)
The extracted GLCM and statistical features were serially fused. The GA chose the informative features. The resultant optimal feature vectors were fed to the support vector machine (SVM), extreme learning machine (ELM), and the ensemble (optimized). The training and testing images were validated using holdouts of 0.7 and 0.5. A summary appears in Tab. 5.
Table 5: Summary of training and testing images for classification

We used the MATLAB 2020Ra Toolbox with the Nvidia Graphic 740k card to run all tests. The results of classification are presented by the two different separation criteria (0.5 and 0.7 holdout validations) in Fig. 8.

Figure 8: Confusion matrix (a) 0.5 cross-validation on POF hospital (b) 0.7 cross-validation on POF hospital (c) 0.5 cross-validation on COVID-19 segmentation (Italian) dataset (d) 0.7 cross-validation on COVID-19 segmentation (Italian) dataset
The results of the classification are listed in Tabs. 6–17.
Table 6: Classification using ELM on POF hospital dataset (0.5 hold cross-validation)

Table 7: Classification using SVM on POF hospital dataset (0.5 hold cross-validation)

Table 8: Classification using optimized ensemble on POF hospital dataset (0.5 hold cross-validation)

Table 9: Classification using ELM on POF hospital dataset (0.7 hold cross-validation)
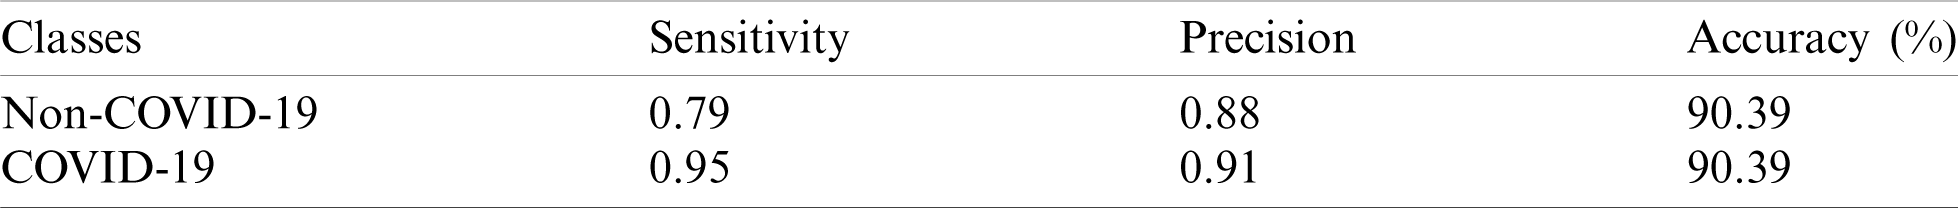
Table 10: Classification using SVM on POF hospital dataset (0.7 hold cross-validation)

Table 11: Classification using optimized ensemble on POF hospital dataset (0.7 hold cross-validation)

Table 12: Classification using ELM on COVID-19 segmentation dataset (0.5 hold cross-validation)

Table 13: Classification using SVM on COVID-19 segmentation dataset (0.5 hold cross-validation)
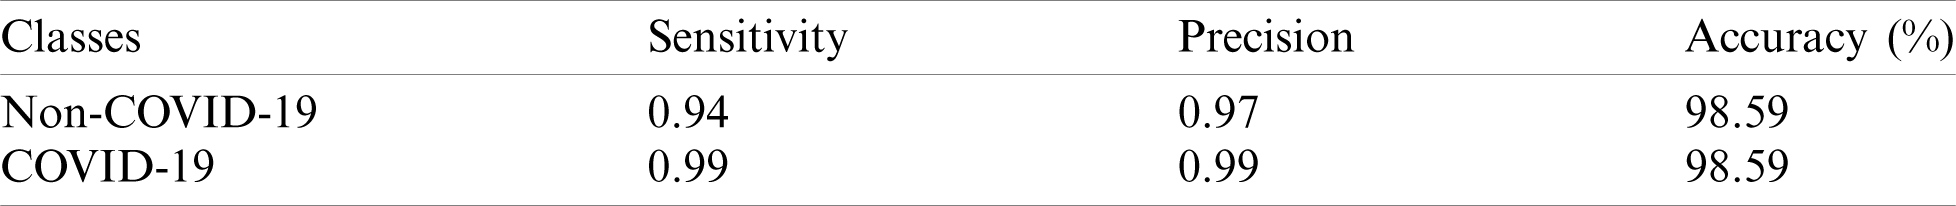
Table 14: Classification using optimized ensemble on COVID-19 segmentation dataset (0.5 hold cross-validation)
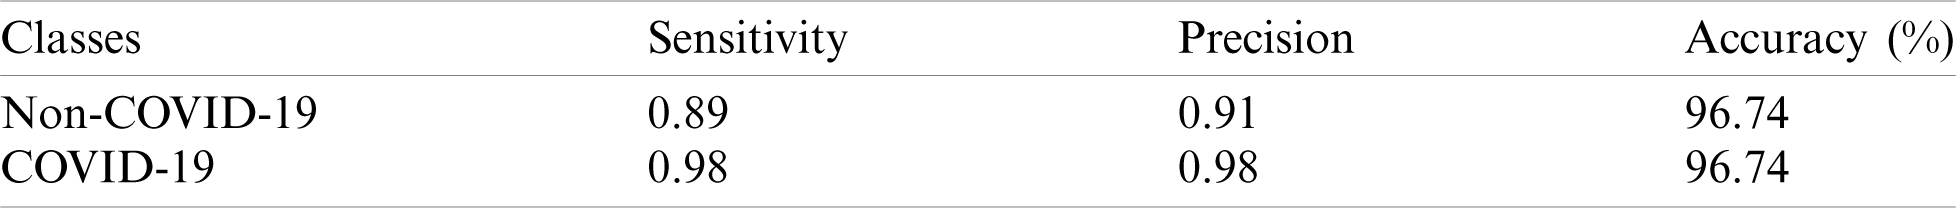
Table 15: Classification using ELM on COVID-19 segmentation dataset (0.7 hold cross-validation)

Table 16: Classification using SVM on COVID-19 segmentation dataset (0.7 hold cross-validation)

Table 17: Classification using Optimized Ensemble on COVID-19 segmentation dataset (0.7 hold cross-validation)
The classification results show that the 0.5 holdout cross-validation method was associated with accuracies of 98.37% on the ELM, 93.27% on the SVM, and 97.54% on the optimized ensemble. The experimental evaluation thus showed that the ELM outperformed the other benchmark classifiers.
Similarly, the experimental evaluation using 0.7 holdout cross-validation yielded accuracies of 90.39% on the ELM, 98.49% on the SVM, and 99.58% on the optimized ensemble. Hence, the SVM exhibited the best accuracy.
The classification accuracies (50:50) of the COVID-19 segmentation dataset were 98.62% on the ELM, 98.59% on the SVM, and 96.74% on the optimized ensemble; the ELM was best.
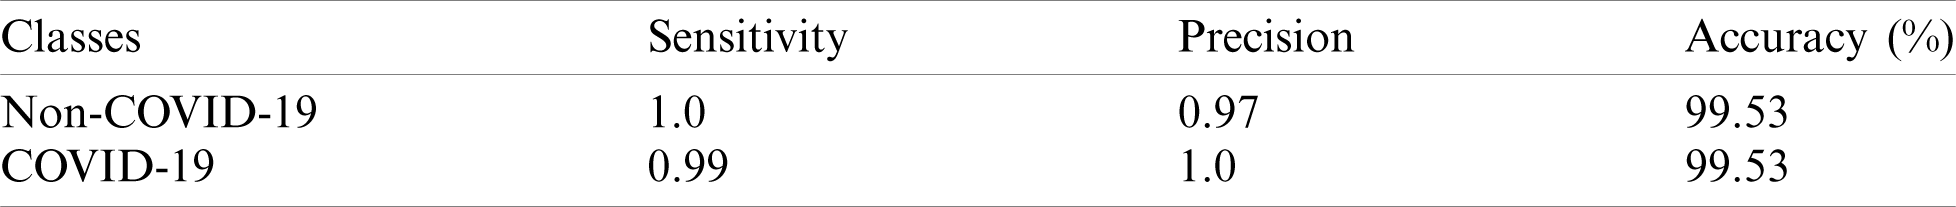
The classification accuracies of positive/negative images (70/30) were 96.33% on the ELM, 96.71% on the SVM, and 99.53% on the optimized ensemble; the latter was thus best.
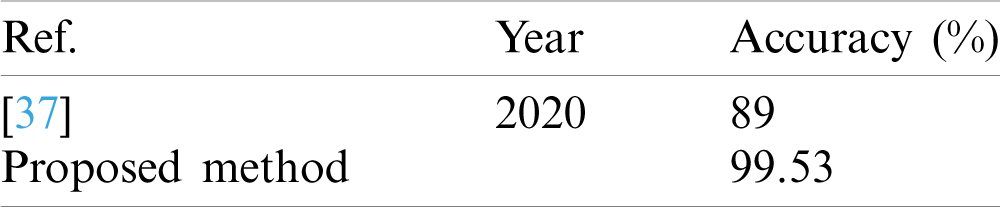
The classification results of the COVID-19 segmentation dataset were compared with a recent work in terms of accuracy; the existing method achieved 89% accuracy [37] and our proposed method 99.53% accuracy, as shown in Tab. 18.
Table 18: Classification results comparison
We used a modified deep learning model to diagnose COVID-19 infection. CT images are noisy and such infections are hard to detect; denoising of CT images is a challenging task. We used a Gabor wavelet filter to remove noise and a marker-controlled watershed method to eliminate non-lung regions including background pixels.
Segmentation is an intricate task because lesions may be irregular in terms of both shape and size. Therefore, we used deeplabv3 as the bottleneck and mobilenetv2 as the classification head for segmentation. As accurate classification depends on the feature vectors used; we extracted GLCM features including the mean, range, and variance, and statistical features, and fused them serially.
We validated the proposed approach using two different training and testing criteria (holdouts of 0.5 and 0.7). The proposed approach yielded consistent results, confirming that it is novel. The approach accurately segmented/classified COVID-19 features and will help radiologists in the present pandemic situation. In future, our approach will be deployed in hospitals to analyze images automatically and predict either a normal or COVID-19-infected lung.
Funding Statement: This research was supported by Korea Institute for Advancement of Technology (KIAT) grant funded by the Korea Government (MOTIE) (P0012724, The Competency Development Program for Industry Specialist) and the Soonchunhyang University Research Fund.
Conflicts of Interest: All authors declare that they have no conflict of interest to report regarding present study.
1. K. J. Clerkin, J. A. Fried, J. Raikhelkar, G. Sayer, J. M. Griffin et al., “COVID-19 and cardiovascular disease,” Circulation, vol. 141, no. 20, pp. 1648–1655. [Google Scholar]
2. M. A. Mohammed, K. H. Abdulkareem, A. S. Al-Waisy, S. A. Mostafa, S. Al-Fahdawi et al., “Benchmarking methodology for selection of optimal COVID-19 diagnostic model based on entropy and TOPSIS methods,” IEEE Access, vol. 8, pp. 1–17, 2020. [Google Scholar]
3. M. A. Mohammed, K. H. Abdulkareem, S. A. Mostafa, M. K. Ghani, M. S. Maashi et al., “Voice pathology detection and classification using convolutional neural network model,” Applied Sciences, vol. 10, no. 11, pp. 1–13, 2020. [Google Scholar]
4. M. S. Subathra, M. A. Mohammed, M. S. Maashi, B. Garcia-Zapirain, N. J. Sairamya et al., “Detection of focal and non-focal electroencephalogram signals using fast walsh-hadamard transform and artificial neural network,” Sensors, vol. 20, no. 17, pp. 1–20, 2020. [Google Scholar]
5. M. K. Abd Ghani, M. A. Mohammed, N. Arunkumar, S. A. Mostafa, D. A. Ibrahim et al., “Decision-level fusion scheme for nasopharyngeal carcinoma identification using machine learning techniques,” Neural Computing and Applications, vol. 32, no. 3, pp. 1–14, 2020. [Google Scholar]
6. O. I. Obaid, M. A. Mohammed, M. K. Ghani, A. Mostafa and F. Taha, “Evaluating the performance of machine learning techniques in the classification of Wisconsin breast cancer,” International Journal of Engineering & Technology, vol. 7, pp. 160–166, 2018. [Google Scholar]
7. T. D. Pham, “A comprehensive study on classification of COVID-19 on computed tomography with pretrained convolutional neural networks,” TechRxiv, vol. 10, pp. 1–19, 2020. [Google Scholar]
8. O. Faust, Y. Hagiwara, T. J. Hong, O. S. Lih and U. R. Acharya, “Deep learning for healthcare applications based on physiological signals: A review,” Computer Methods and Programs in Biomedicine, vol. 161, no. 4, pp. 1–13, 2018. [Google Scholar]
9. P. Lakhani, A. B. Prater, R. K. Hutson, K. P. Andriole, K. J. Dreyer et al., “Machine learning in radiology: Applications beyond image interpretation,” Journal of the American College of Radiology, vol. 15, no. 2, pp. 350–359, 2018. [Google Scholar]
10. O. Gozes, M. Frid-Adar, H. Greenspan, P. D. Browning, H. Zhang et al., “Rapid ai development cycle for the coronavirus (covid-19) pandemic: Initial results for automated detection & patient monitoring using deep learning CT image analysis,” arXiv preprint arXiv:2003.05037, vol. 129, pp. 150–157, 2020. [Google Scholar]
11. J. Amin, M. Sharif, M. Yasmin and S. L. Fernandes, “Big data analysis for brain tumor detection: Deep convolutional neural networks,” Future Generation Computer Systems, vol. 87, no. 8, pp. 290–297, 2018. [Google Scholar]
12. J. Amin, M. Sharif, A. Rehman, M. Raza and M. R. Mufti, “Diabetic retinopathy detection and classification using hybrid feature set,” Microscopy Research and Technique, vol. 81, no. 9, pp. 990–996, 2018. [Google Scholar]
13. T. Saba, A. S. Mohamed, M. El-Affendi, J. Amin and M. Sharif, “Brain tumor detection using fusion of hand crafted and deep learning features,” Cognitive Systems Research, vol. 59, no. 1, pp. 221–230, 2020. [Google Scholar]
14. T. Ozturk, M. Talo, E. A. Yildirim, U. B. Baloglu, O. Yildirim et al., “Automated detection of COVID-19 cases using deep neural networks with X-ray images,” Computers in Biology and Medicine, vol. 121, pp. 103792, 2020. [Google Scholar]
15. A. Narin, C. Kaya and Z. Pamuk, “Automatic detection of coronavirus disease (covid-19) using x-ray images and deep convolutional neural networks,” arxiv preprint arXiv:2003.10849, vol. 3, pp. 1–17, 2003. [Google Scholar]
16. I. D. Apostolopoulos and T. A. Mpesiana, “Covid-19: Automatic detection from x-ray images utilizing transfer learning with convolutional neural networks,” Physical and Engineering Sciences in Medicine, vol. 43, pp. 635–640, 2020. [Google Scholar]
17. D. Singh, V. Kumar and M. Kaur, “Classification of COVID-19 patients from chest CT images using multi-objective differential evolution-based convolutional neural networks,” European Journal of Clinical Microbiology & Infectious Diseases, vol. 39, pp. 1–11, 2020. [Google Scholar]
18. C. Butt, J. Gill, D. Chun and B. A. Babu, “Deep learning system to screen coronavirus disease 2019 pneumonia,” Applied Intelligence, vol. 6, pp. 1–7, 2020. [Google Scholar]
19. G. Marques, D. Agarwal and I. de la Torre Díez, “Automated medical diagnosis of COVID-19 through EfficientNet convolutional neural network,” Applied Soft Computing, vol. 96, pp. 1–11, 2020. [Google Scholar]
20. A. E. Hassanien, L. N. Mahdy, K. A. Ezzat, H. H. Elmousalami and H. A. Ella, “Automatic x-ray covid-19 lung image classification system based on multi-level thresholding and support vector machine,” MedRxiv, vol. 4, pp. 1–8, 2020. [Google Scholar]
21. E. Agosti, A. Giorgianni and D. Locatelli, “Impact of COVID-19 outbreak on spinal pathology: Single center first impression,” Spinal Cord, vol. 58, no. 6, pp. 726–727, 2020. [Google Scholar]
22. F. Shi, J. Wang, J. Shi, Z. Wu, Q. Wang et al., “Review of artificial intelligence techniques in imaging data acquisition, segmentation and diagnosis for covid-19,” IEEE Reviews in Biomedical Engineering, vol. 14, pp. 1–13, 2020. [Google Scholar]
23. M. Sharif, J. Amin, M. Raza, M. Yasmin and S. C. Satapathy, “An integrated design of particle swarm optimization (PSO) with fusion of features for detection of brain tumor,” Pattern Recognition Letters, vol. 129, pp. 150–157, 2020. [Google Scholar]
24. J. Amin, M. Sharif, N. Gul, M. Raza, M. A. Anjum et al., “Brain tumor detection by using stacked autoencoders in deep learning,” Journal of Medical Systems, vol. 44, no. 2, pp. 32, 2020. [Google Scholar]
25. S. Minaee, R. Kafieh, M. Sonka, S. Yazdani and G. J. Soufi, “Deep-covid: Predicting covid-19 from chest x-ray images using deep transfer learning,” arXiv preprint arXiv:2004.09363, vol. 65, pp. 1–9, 2020. [Google Scholar]
26. L. Li, L. Qin, Z. Xu, Y. Yin, X. Wang et al., “Artificial intelligence distinguishes COVID-19 from community acquired pneumonia on chest CT,” Radiology, vol. 296, no. 2, pp. 1–16, 2020. [Google Scholar]
27. M. Barstugan, U. Ozkaya and S. Ozturk, “Coronavirus (covid-19) classification using CT images by machine learning methods,” arXiv preprint arXiv:2003.09424, vol. 4, pp. 1–10, 2020. [Google Scholar]
28. K. Li, J. Wu, F. Wu, D. Guo, L. Chen et al., “The clinical and chest CT features associated with severe and critical COVID-19 pneumonia,” Investigative Radiology, vol. 55, no. 6, pp. 1–5, 2020. [Google Scholar]
29. O. Gozes, M. Frid-Adar, H. Greenspan, P. D. Browning and H. Zhang, “Rapid ai development cycle for the coronavirus (covid-19) pandemic: Initial results for automated detection & patient monitoring using deep learning CT image analysis,” arXiv preprint arXiv:2003.05037, vol. 3, pp. 1–19, 2020. [Google Scholar]
30. S. Minaee, R. Kafieh, M. Sonka, S. Yazdani and G. J. Soufi, “Deep-covid: Predicting covid-19 from chest x-ray images using deep transfer learning,” arXiv preprint arXiv:2004.09363, vol. 65, pp. 1–9, 2020. [Google Scholar]
31. R. Kumar, A. A. Khan, S. Zhang, W. Wang, Y. Abuidris et al., “Blockchain-federated-learning and deep learning models for covid-19 detection using CT imaging,” arXiv preprint arXiv:2007.06537, vol. 2, pp. 1–12, 2007. [Google Scholar]
32. B. Ghoshal and A. Tucker, “Estimating uncertainty and interpretability in deep learning for coronavirus (COVID-19) detection,” arXiv preprint arXiv:2003.10769, vol. 2, pp. 1–14, 2020. [Google Scholar]
33. J. Zhang, Y. Xie, Z. Liao, G. Pang, J. Verjans et al., “Viral pneumonia screening on chest X-ray images using confidence-aware anomaly detection,” arXiv:2003.12338, vol. 4, pp. 1–12, 2020. [Google Scholar]
34. N. Cristianini and J. Shawe-Taylor, An Introduction to Support Vector Machines and Other Kernel-Based Learning Methods. Cambridge: Cambridge University Press, 2000. [Google Scholar]
35. G. B. Huang, H. Zhou, X. Ding and R. Zhang, “Extreme learning machine for regression and multiclass classification,” IEEE Transactions on Systems, Man, and Cybernetics, Part B (Cybernetics), vol. 42, no. 2, pp. 513–529, 2011. [Google Scholar]
36. M. Sharif, J. Amin, M. Raza, M. A. Anjum, H. Afzal et al., “Brain tumor detection based on extreme learning,” Neural Computing and Applications, vol. 32, no. 20, pp. 1–13, 2020. [Google Scholar]
37. J. Zhao, Y. Zhang, X. He and P. Xie, “COVID-CT-Dataset: A CT scan dataset about COVID-19,” arXiv preprint arXiv:2003.13865, vol. 3, pp. 1–14, 2020. [Google Scholar]
 | This work is licensed under a Creative Commons Attribution 4.0 International License, which permits unrestricted use, distribution, and reproduction in any medium, provided the original work is properly cited. |