DOI:10.32604/cmc.2021.016232
| Computers, Materials & Continua DOI:10.32604/cmc.2021.016232 | |
| Article |
Multi Sensor-Based Implicit User Identification
1Department of Computer Science, National University of Computer and Emerging Sciences, Chiniot, 35400, Pakistan
2Department of Computer Science, Bahauddin Zakariya University, Multan, 66000, Pakistan
3Institute of Software Development and Engineering, Innopolis University, Innopolis, 420500, Russia
4Dipartimento di Matematica e Informatica—MIFT, University of Messina, Messina, 98121, Italy
5Department of Computing and Mathematics, Manchester Metropolitan University, Manchester, UK
*Corresponding Author: Muhammad Ahmad. Email: mahmad00@gmail.com
Received: 28 December 2020; Accepted: 06 February 2021
Abstract: Smartphones have ubiquitously integrated into our home and work environments, however, users normally rely on explicit but inefficient identification processes in a controlled environment. Therefore, when a device is stolen, a thief can have access to the owner’s personal information and services against the stored passwords. As a result of this potential scenario, this work proposes an automatic legitimate user identification system based on gait biometrics extracted from user walking patterns captured by smartphone sensors. A set of preprocessing schemes are applied to calibrate noisy and invalid samples and augment the gait-induced time and frequency domain features, then further optimized using a non-linear unsupervised feature selection method. The selected features create an underlying gait biometric representation able to discriminate among individuals and identify them uniquely. Different classifiers are adopted to achieve accurate legitimate user identification. Extensive experiments on a group of 16 individuals in an indoor environment show the effectiveness of the proposed solution: with 5 to 70 samples per window, KNN and bagging classifiers achieve 87–99% accuracy, 82–98% for ELM, and 81–94% for SVM. The proposed pipeline achieves a 100% true positive and 0% false-negative rate for almost all classifiers.
Keywords: Sensors; smartphone; legitimate user identification
Smartphone users exponentially increased to 3 billion and are expected to further grow by several hundred million in coming years. Boosted by information and communication technologies, mobile, and personal devices are becoming a more and more powerful and thus trustworthy inseparable companion of our lives. Our cyber alter egos often store sensitive personal information such as photos, videos, bank account, credit, and debit card details, as well as cookies, passwords, and personal data managed by Internet applications. Such information should be kept confidential and not disclosed, preserving the smartphone from unauthorized access [1]. Robust and reliable user identification methods can be an effective solution for achieving smartphone security [2].
Considering that each individual has their walking pattern, a gait (user walking) based identification mechanism has been proposed in [3,4] using built-in sensors such as an accelerometer and linear accelerometer. Gait-based legitimate user identification has more advantages than limits, including but not limited to unobtrusiveness, passive, implicit, concurrent, and continuous observability. However, the main advantage is the cost-effectiveness, exploiting built-in sensors without any additional hardware required for the identification, just walking with the smartphone. Furthermore, gait-based legitimate user identification avoids identification processing and delays during login by continuously operating in the background while the user is walking. It is also hard to violate since an attacker needs to exactly reproduce the smartphone owner’s gait, which depends on their silhouette and activity, captured by several-different sensors. Gait-based legitimate user identification can also be used as one of the security levels in multilevel security systems [5] combining gait patterns with other security info in crime analysis.
In recent years, several identification approaches have been proposed leveraging smartphone’s sensors such as [6–9]. For instance, [10,11] presented a method for continuous user identification implicitly. Explicit identification is performed only when there is important evidence of change in the user activity, which is not a real-life scenario in many cases. A method to directly compute the distance between pattern traces using the dynamic time warping algorithm is presented in [12]. Sae et al. [13] presents 22 special touch patterns for user identification, most of which involve all five fingers simultaneously. The work [14] studied the correlation between 22 analytic features from touch traces and classified them using k-nearest neighbors and support vector machines. Moreover, the idea behind the behavior-based model is that the person’s habits are a set of attributes; therefore, each activity (event) correlates with two fundamental attributes: time and space. For instance, the works [15,16], utilizes the user calls, schedules, GNSS, device battery level, user applications, and sensors for identification. The works [17–20] proposed a multi-model-based continuous user identification. Whereas, the work [21] put forward another unique implicit user identification framework by using recorded phone call history and location for continuous user identification.
The above-discussed works present several propositions, but to some extent, all these required additional information and source for user identification. Several works have been proposed to overcome these propositions, such as [22] presented a gait-based user identification over biometric unobtrusive pattern. A geometric concept of a convex hull was utilized in 4-layered architecture. One of the major limitations is non-user-friendliness, e.g., only works in specific and controlled environments. The works [18,23–27] utilized portable devices based on gait signals acquired with a 3-dimensional accelerometer, where the accelerometer was put on the user’s belt only at the back. Whereby, [18] proposed a 3-fold method based on data distribution statistics, correlation, and frequency domain features for user identification while the individuals are intentionally asked to walk at different speeds such as slow, normal, and fast. Mantyjarvi’s work is novel but the major drawback is its limitations to not only walked by the same user but with very limited variations.
Despite the success of the gait-based systems demonstrated by a relevant number of existing solutions, summarized above as well as in Tab. 1, there is still room for improving this approach, strongly depending on factors like physical changes i.e., aging, weight loss, or gain, injury, shoes, clothes, carrying objects, orientation, and placement, walking surface, psychological states of an individual, stimulants, etc. All these factors significantly reduce the effectiveness of the gait-based system in real scenarios.
Table 1: Summary of related work

Considering the aforementioned scenarios, this work proposes a novel, non-intrusive, and automatic legitimate user identification system exploiting built-in smartphone motion dynamics captured by four different sensors namely, Accelerometer (AC), Linear Accelerometer (LAC), Gyroscope (GY), and Magnetometer (MM) sensors, able to overcome the limitations of existing solutions. To test the system, we first collect raw data from 16 individuals walking with the smartphone freely placed in one of their pants pockets then extracting relevant features from the raw data. To reduce the redundancy among such features a non-linear Extended Sammon Mapping Projection (ESMP) feature selection method is adopted, thus resulting in an underlying representation for the gait characteristics able to uniquely identify individuals. Finally, SVM, KNN, Bagging, and ELM are implemented and compared to show the effectiveness-accuracy of the proposed gait-based legitimate user identification. In a nutshell, the following points are added in this research as compared to the previous works.
1. Previous works only considered an activity/sub-activity-based user identification, however, our current research aims to propose a semi-controlled environment system in which we overcome the limitations of users’ jeans style (loose or tight) and walking style (we intentionally asked users to walk differently in various times to investigate the ambulatory activity performed by each user). In this regard, our current work aims to investigate several research questions relevant to building a walking-based legitimate user identification system in real-life: (a): How to achieve real-time user identification in practice? Since our goal is to develop an algorithm that identifies the user in real-time, thus computation complexity is extremely important. System performance measurements ought to be considered to balance the trade-off between accuracy and computational cost. (b): Does the data variation affect the performance of the LUI process? (c): Does the ESMP, a non-linear unsupervised feature selection method improve the identification accuracy more than the other existing and well-studied unsupervised feature selection methods such as Principal Component Analysis (PCA)? It is a known fact that the output of the smartphone sensor depends on the position of the smartphone while walking. This could result in a high within-class variance. Therefore, it is desirable to improve both the discriminatory power and achieve dimensionality reduction, by employing an optimum method. The advantages of the feature selection process are to avoid the curse of dimensionality, as well as to reduce the abundant, irrelevant, misleading, and noisy features, but above all, to be able to reduce the system’s running cost of real-time applications. In addition to the above, effective feature selection can increase the accuracy of the resulting model. (d): Does kernel-based Extreme Learning Machine (KELM) an effective classifier for the non-linear signal-based user identification method than the state-of-the-art classification methods such as SVM, KNN, and Bagging? The reason to choose these classifiers, because these have been extensively utilized in the literature and rigorously analyzed for comparative analysis. Moreover, this work aims to show that the proposed pipeline can work well with a diverse set of classifiers.
2. In our current work, we have invited 16 users with 4 activities i.e., user walked with the phone freely placed in one of their pants pockets i.e., front left, front right, back left, back right.
3. Previous works only considered a limited number of features extracted from two types of sensors, however, this work further involved the gait based features together with frequency and time domain features obtained through four different sensors which provide more confidence towards the ultimate results.
Smartphone sensors generate highly fluctuating time-series signals making legitimate user identification more challenging. Therefore, it is required to transform raw signals into relevant and meaningful features through a complex process including preprocessing, feature extraction, and selection.
2.1 Hardware and Preprocessing
Smartphones are equipped with a variety of sensors that are useful for monitoring device movements. Some of them are AC, LAC, GY, and MM in which AC and LAC record the acceleration along three axes (x, y, z) and can measure both the effects of Earth’s gravity on the device and device movement, whereas, GY and MM eradicate the effects of Earth’s gravity. The smartphone (LG Nexus 4 smartphone with Android Wear v4.2 OS in the experiments) runs a custom application gathering data from sensors temporarily stored into a text file in a micro SD card and then transferred to a computer. The sensor sampling frequency is set to 50 Hz and in total, 10 min of raw samples were gathered from each individual without any fixed protocol while carrying a smartphone in one of their pants pockets. It is worth mentioning that different smartphones have different sampling rates, therefore, to control the sensor reading process and for better generalization and validation, the sample rate is set to 50 Hz instead to use the highest sampling rate within different smartphones. For these reasons, we split the raw signals into windows (5 to 105 samples per window, respectively) to control the flow rate hence passing fewer data to the system. The selected sample size provides enough data to be able to extract quality features while ensuring a fast response. Before extracting relevant features, a third ordered moving average filter is applied in the preprocessing stage to reduce the sensor noise.
The feature extraction process first analyzes sensor reading by applying time series modeling (i.e., Auto-regressive [49], Moving average [50], and both auto-regressive and moving average models) to understand the behavior of users’ physical patterns which reveals unusual observations and data patterns. Partial Auto-Correlation (PAC) and Auto-Correlation (AC) coefficients are used to identify the best model which revealed the pattern of each datum. Later each model is determined individually based on the characteristics of the theoretical PAC and AC. The best fit time-series model is calculated by estimating the parametric values based on the former model. Auto-regressive and moving average parameters are estimated through the box Jenkins model due to its flexibility for the inclusion of both models. The model and parameters need to be verified to ensure that the estimated results are statistically significant. Our experiments revealed that the frequency and time domain features, including the coefficients from the time-series model, provide the best accuracies. Therefore, as listed in Tab. 2, gait, frequency, and time-domain features are extracted from raw signals for each sensor individually. In total, 180 features are extracted from each window.
Table 2: Extracted features for gait-based legitimate user identification

The sensor’s output mainly depends upon the position of the smartphone, which may result in a high within-class variance. Therefore, it is required to enhance the discriminatory power of features that can achieve by deploying an optimum feature selection method. The feature selection process eliminates the irrelevant, abundant, noisy, and misleading features that reduce the system cost on run-time applications and improve the accuracy of the resulting model. A number of feature selection methods have been used for legitimate user identification. Filtering methods are interdependent to the classifier and depend on discriminating criteria i.e., maximum relevance and minimum redundancy. These methods are scalable, fast, and less computationally complex; however, ignore the interaction with the classifier. Wrapper methods utilize the classifier as a black box to obtain a subset based on their predictive power. The main drawback of the wrapper method is its dependency on the classifier which makes the classifier choice a key component. LDA and KLDA seek a linear combination of features. However, the number of dimensions depends on the number of classes which limits the use of such methods, especially for legitimate user identification.
To overcome the aforementioned issues, ESMP was first introduced in [28] for smartphone-based physical activity recognition and legitimate user identification. ESMP is a nonlinear metric multi-dimensional scaling method that projects the high dimensional input space into lower dimensions while preserving the structure of inter-point distances. Let dij and
The selected features are processed through KELM, Bagging, SVM, and KNN. Several statistical measures are performed on the resulting false and true positive rates, ROC, and accuracies for legitimate user identification are calculated for a different number of samples per window.
2.4.1 Kernel Extreme Learning Machine (KELM)
ELM has a fast learning speed and better generalization abilities than other neural network frameworks. ELM randomly generates the input weights and bias with the help of a simple activation function. The tune-able activation functions were proposed to overcome the random assignments [51]. However, finding suitable combinations for activation functions is still in infancy. The KELM is used when the feature mapping functions of hidden neurons are unknown. However, the kernel parameters need to be tuned very carefully when it comes to real-time applications. Therefore, our current study explores the use of a swarm optimizer to tune the kernel parameters. In this hierarchy, at the first hidden layer, all nonlinear piece-wise continuous functions can be used as hidden neurons as these parameters need not be tuned. Thus, for N samples i.e.,
where T, H, and C are expected output, hidden layer output, and regularization coefficients respectively. Thus, the training model output is expressed as;
The output and kernel function
where
2.4.2 Support Vector Machine (SVM)
Among the most popular methods for regression and classification problems, SVM is the most common classifier. SVM has been deployed for several real-world applications for instance bioinformatics, biometrics, cheminformatics, and remote sensing [52]. The SVM hierarchy works in two phases as the training examples are used to build the model for classification later the trained model is used to classify an unknown example. The tuning parameters of SVM are considered as key to success for any classification problems. These parameters include kernel and penalty parameters [53]. The penalty is important to maintain a trade-off between maximizing the decision margin while minimizing the training error [54]. Whereas, the kernel parameters are used to map the low dimensional input feature space to a higher dimensional feature space. These two parameters are labeled as a backbone to control the performance of SVM for any classification problem. SVM works while separating several known classes using the concept of hyperplanes and achieved remarkable results in linearly separable data examples [55–60].
The classifier’s output indicates the ability to predict which user is walking while carrying the smartphone without considering its orientation, age, and gender. The 5-fold cross-validation process is adopted to get meaningful and statistically significant results. The cross-validation process split the dataset into 5 equal subsets in which 4 subsets are selected to train the model and the remaining subset is selected to validate the model. This process is repeated 5-times by picking a new subset (every time) as a validation set and the remaining subsets are used as training data lead to a total of 5 experiments that are weighted for the result. The proposed pipeline has been evaluated against 3 different types of classifiers such as KNN, SVM, and Bagging. The reason to choose these classifiers, because these have been extensively utilized in the literature and rigorously analyzed for comparative analysis. Moreover, this work aims to show that the proposed pipeline can work well with a diverse set of classifiers. For KELM, [1–500] hidden neurons are selected, and SVM is evaluated with the polynomial kernel, similarly, for KNN, k is set to [2–20]. For bagging, a tree-based method is used to train the classifier from a range of [1–100] trees. All the parameters are adjusted carefully while setting up the experiments. The reason to provide the range is that because the number of samples in each round (samples per window) changes so the parameters need to be tuned in each round. For the main proposal, KELM classifier training and testing accuracy concerning the number of hidden neurons is presented in Fig. 1. For fare experimental evaluation of our proposed pipeline, several benchmark metrics are bring considered such as overall and average accuracies. For experimental validation and statistical analysis, true positive (TP), false positive (FP), true negative (TN), and false-negative (FN) is usually computed from the confusion matrix shown in Figs. 2a–2h.

Figure 1: ELM: accuracy vs. hidden neurons

Figure 2: Confusion matrices for KELM, Bagging, KNN, and SVM for two different window sizes (i.e., 5 and 105). (a) 5 Samples per window for KELM (b) 105 Samples per window for KELM (c) 5 Samples per window for Bagging (d) 105 Samples per window for Bagging (e) 5 Samples per window for KNN (f) 105 Samples per window for KN (g) 5 Samples per window for SVM (h) 105 Samples per window for SVM
Moreover, to validate the statistical significance, several statistical measures are considered such as Recall, Precision, and F1-score. Furthermore, this work carried out several statistical tests including but not limited to true positive rate (TPR), true negative rate (TNR), false-positive rate (FPR), and false-negative rate (FNR). Meanwhile, this study also used several other statistical measures to validate the performance of our proposed model as shown in Tabs. 3–6. The FPR and TPR show two crucial aspects as TPR and FPR show how usable and secure this would be as a legitimate user identification model. A low TPR shows that several legitimate attempts to identify would fail, thus making this too much of a burden to use, whereas a high FPR means illegitimate users could bypass the security and identification when they were not supposed to. Therefore, the ultimate goal of this work is to attain high TPR and low FNR as much as possible. The average statistical measures are computed as follows, where m be the number of users.
where NPV stands for Negative Predictive Values, FDR is False Discovery Rate, and FOR is False Omission Rate. NPV is the score of the negative statistical results based on TN and FN values across the users used in this study. FDR and FOR are usually used in multiple hypothesis testing to make sure the multiple comparisons. FOR can be computed by taking the complement of NPV values or another way around, it can be measured using TN and FN values. FOR is used to measure the rate of false negatives, which are incorrectly rejected whereas, FDR measures the actual positives which were incorrectly identified.
Table 3: Statistical tests for KELM classifier for all users

Table 4: Statistical tests for bagging classifier for all users

Table 5: Statistical tests for KNN classifier for all users

Table 6: Statistical tests for SVM classifier for all users

In-terms of machine learning, extensive model performance measurement is required. Moreover, when it comes to the classification, the overall accuracy is shown in Fig. 3 and the area under the curve, such as the receiver Operating Characteristics Curve (ROC) is an essential evaluation metric at various threshold settings. ROC is a probability curve that measures the degree of separability among classes. ROC curve is plotted with TPR against the FPR values obtained through the classification method. To validate the statistical significance of the proposed pipeline, the ROC has been drawn for two different sample sizes i.e., 5 and 105 samples per window.

Figure 3: Cumulative overall accuracy across all the users for all classifiers
The results are presented in Fig. 3 uphold the effectiveness of the proposed pipeline for real-time applicability with a 99% confidence interval of legitimate user identification by using a pairwise T-test between groups of individuals. Looking at Fig. 3, significant statistical results are seen; showing that all the classifiers outperform. Finally, we present the computational cost in terms of the time of enlisted experiments. Fig. 4 shows the computational time taken by the feature extraction and feature selection process for average users with a different number of samples per window.
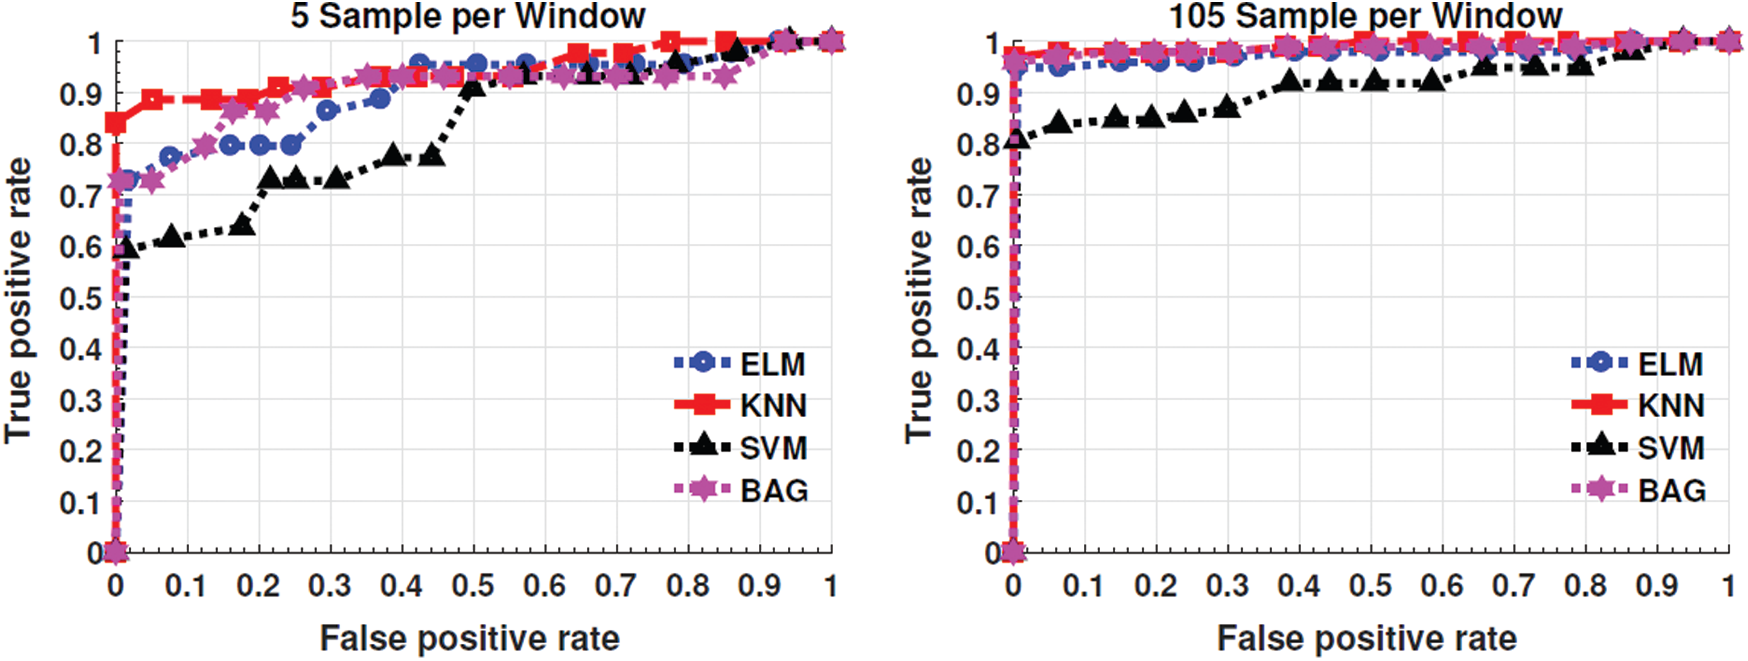
Figure 4: ROC for two different sample sizes, i.e., 5 and 105 samples per window. Here are the values of Auc’s for each classifier:
As shown in Fig. 5, the processing time is increased gradually at the start and then increased exponentially as the sample size increases. Therefore, to cope with the high computational time may become an important issue for the legitimate user identification system for larger sample sizes. There are many ways to overcome such high computational time, however, this one needs to work on fewer features, i.e., either gait-based features or time and frequency domain feature processed through one of the feature selection methods but this may bring incompetency for statistical significance.
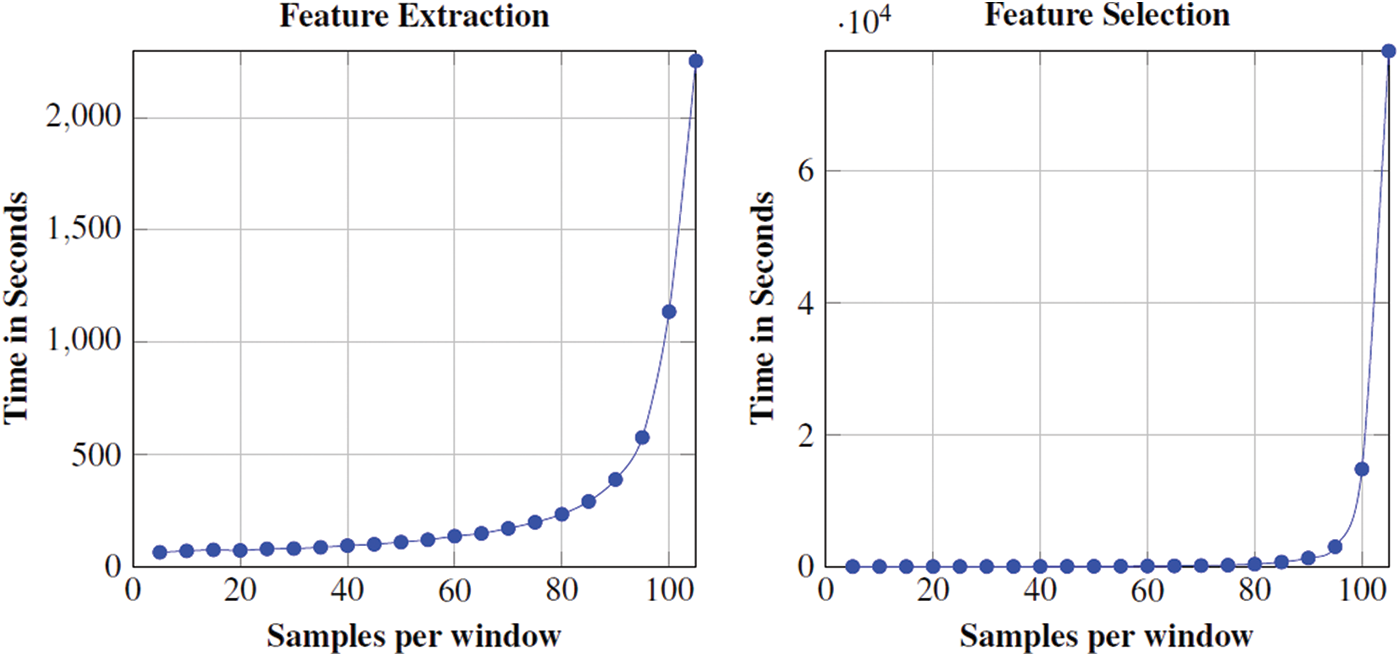
Figure 5: Processing Time with a different number of samples per window selected ([5:5:105]) in each round for Legitimate User Identification. All the experiments are carried out on a notebook using MATLAB (2017a) on Intel Core (TM) i5 CPU 2.40
From experimental results, one can conclude that the ESMP helps to boost legitimate user identification performance. Based on the results listed in Fig. 3 and Tabs. 3–6, we observe that the ESMP together with almost all classifiers works better and accurately than the several state-of-the-art legitimate user identification methods. The experiments show the process of analyzing the behavior of a different number of samples per window taken by the user for legitimate user identification (i.e., 05:05:105). Fig. 2 presents the accuracy of our proposed pipeline for an individual user being identified correctly with the different number of samples per window after the fusion of four different built-in sensors data. From the results, we found that the proposed pipeline produces acceptable results with 30–50 samples per window. Fig. 3 enlists the results of overall accuracy across all users with a 99% confidence interval.
4 Comparison Against State-of-the-Art Solutions
Hereby we present and compare some of the critical works from the literatu- re [1,4,28–34,36–38] that can be categorized into two groups such as implicit and multi-modality biometrics. All these methods have some limitations i.e., required some additional information and source or may require user interaction. Therefore, to some extent, all these methods are innovative but require some external legitimate user identification process. The works compared in Tab. 7 require user interaction in-terms to perform a predefined activity or user data has been gathered in controlled environments that are not a real representation of frequent user interactions. Therefore, the proposed method could be considered as an exciting alternative for continuous and explicit legitimate user identification or impostor identification in a semi-controlled environment. Hence the proposed method overcomes the limitations of the smartphone in power consumption and user interaction. We have worked on combining different feature extraction and selection techniques and concatenating the selected features to deliver a reliable legitimate user identification model using built-in sensors data in a semi-controlled environment.
Table 7: Cross subjects performance comparison with state-of-the-art works

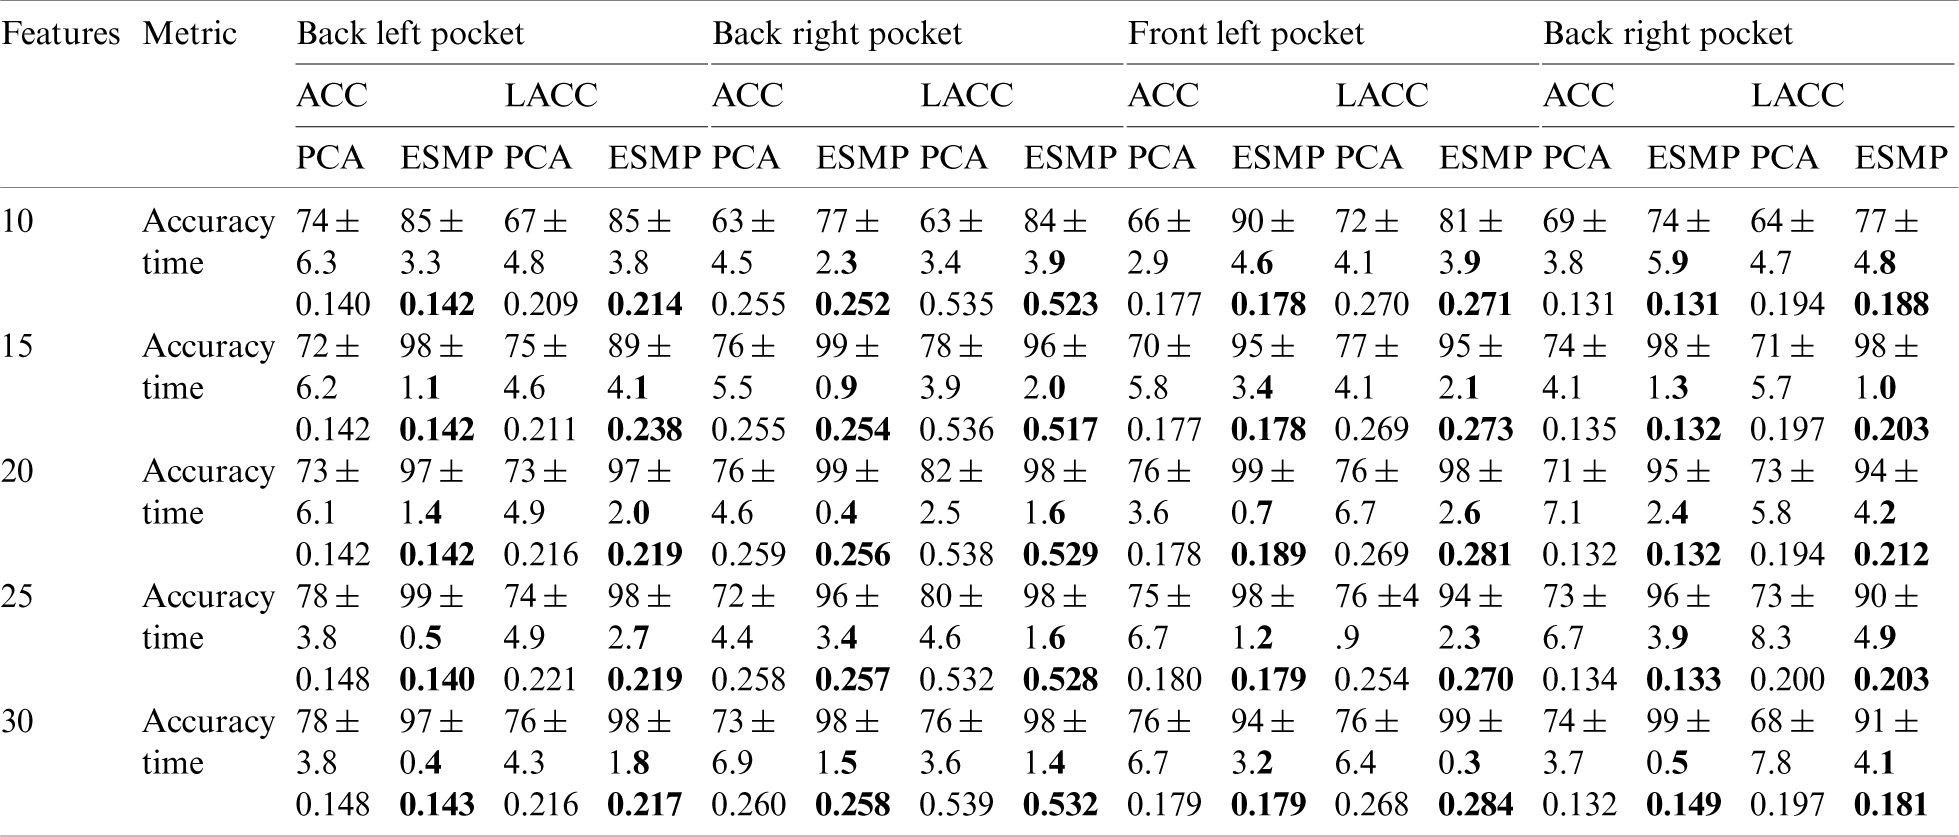
As we earlier discussed, this study focuses on the idea of identifying a smartphone user by applying different walking patterns. Furthermore, it is assumed that the phone is freely placed without any particular orientation inside any of the user’s pants pockets (front left, front right, back left, back right). Thus to answer the questions “Does the ESMP, a non-linear unsupervised feature selection method improve the identification accuracy more than the other existing and well-studied unsupervised feature selection methods such as Principal Component Analysis (PCA)?” and “Does the data variation affect the performance of the LUI process?” Tab. 8 enlists the comparative analysis of these two different feature selection methods with a different number of features and different locations of a smartphone.
Table 8: Average accuracy, confidence intervals, and time is taken for legitimate user identification for 50 samples per window with different feature selection methods and different number of features for two different sensors data
Smartphones are becoming increasingly popular that has forced the community to study the security implications of these devices. This work suggested that gait-based legitimate user identification is possible in an uncontrolled environment with some limitations. The proposed pipeline has some attractive features to its applicability such as smaller confidence intervals that imply more reliability in training. Furthermore, holding a permanent structure is a useful feature for hardware constraints such as transforming the trained model into a chip which can further increase device security by not allowing software-based attacks but only hardware manipulations. These hardware operations would require access to the smartphone hence making such attacks subject to the device defense.
The proposed pipeline achieves a 100% true positive and 0% false-negative rate for almost all classifiers. However, to further validate the claims, it may be useful to check the sensor quality while changing the smartphone as well as with different operating systems.
The key advantage of our study is that the samples for each user are collected on different days with different jeans, locations, and orientations which significantly helps to understand the characteristic behavior of users which is an essential component for any legitimate user identification system. However, one of the main limitations of gait-based legitimate user identification is that the signals inconsistency e.g., signal reliability, degrades significantly between days due to many factors such as a change in habits, mood, workload, etc. which we will address in our future studies.
Funding Statement: The authors received no specific funding for this study.
Conflicts of Interest: The authors declare that they have no conflicts of interest to report regarding the present study.
1. M. Ahmad, A. M. Khan, J. A. Brown, S. Protasov and A. M. Khattak, “Gait fingerprinting-based user identification on smartphones,” in Proc. of International Joint Conf. on Neural Networks, Vancouver, BC, Canada, pp. 3060–3067, 2016. [Google Scholar]
2. M. De Marsico and A. Mecca, “A survey on gait recognition via wearable sensors,” ACM Computing Survey, vol. 52, no. 4, pp. 1–86, 2019. [Google Scholar]
3. M. Ahmad, A. M. Khan, M. Mazzara and S. Distefano, “Seeking optimum system settings for physical activity recognition on smartwatches,” in Proc. of Advances in Computer Vision, Las Vegas, USA, pp. 220–233, 2020. [Google Scholar]
4. M. Ahmad, M. Alqarni, A. Khan, A. M. Khan, S. Chaudhary et al., “Smartwatch-based legitimate user identification for cloud-based secure services,” Mobile Information Systems, vol. 2018, pp. 1–14, 2018. [Google Scholar]
5. R. Damasevicius, R. Maskeliunas, A. Venckauskas and M. Wozniak, “Smartphone user identity verification using gait characteristics,” Symmetry, vol. 8, no. 10, pp. 9, 2016. [Google Scholar]
6. Y. Yang, X. Huang, L. Wu and J. Sun, “Echoia: Implicit authentication system based on user feedback,” ArXiv, abs/2006.07676, pp. 1–6, 2020. [Google Scholar]
7. Y. Yang, X. Huang, J. Li and J. Sun, “Bubblemap: Privilege mapping for behavior-based implicit authentication systems,” ArXiv, abs/2006.08817, pp. 1–12, 2020. [Google Scholar]
8. B. Ayotte, M. K. Banavar, D. Hou and S. Schuckers, “Fast free-text authentication via instance-based keystroke dynamics,” ArXiv, abs/2006.09337, vol. 2, no. 4, pp. 377–387, 2020. [Google Scholar]
9. X. Lu, S. Zhang, P. Hui and P. Lio, “Continuous authentication by free-text keystroke based on CNN and RNN,” Computers & Security, vol. 96, no. 4, pp. 101861, 2020. [Google Scholar]
10. N. Clarke and S. Furnell, “Authenticating mobile phone users using keystroke analysis,” International Journal of Information Security, vol. 6, no. 1, pp. 1–14, 2007. [Google Scholar]
11. W. Shi, J. Yang, Y. Jiang, F. Yang and Y. Xiong, “Senguard: Passive user identification on smartphones using multiple sensors,” in Proc. of IEEE 7th Int. Conf. on Wireless and Mobile Computing, Networking and Communications, Shanghai, China, pp. 141–148, 2011. [Google Scholar]
12. A. D. Luca, A. Hang, F. Brudy, C. Lindner and H. Hussmann, “Touch me once and I know it’s you! Implicit authentication based on touch screen patterns,” in Proc. of the SIGCHI Conf. on Human Factors in Computing Systems, CHI’12, New York, NY, USA, pp. 987–996, 2012. [Google Scholar]
13. N. Sae-Bae, N. Memon and K. Isbister, “Investigating multi-touch gestures as a novel biometric modality,” in 5th Int. Conf. on Biometrics: Theory, Applications, and Systems, Arlington, VA, USA, pp. 156–161, 2012. [Google Scholar]
14. M. Frank, R. Biedert, E. Ma, I. Martinovic and D. Song, “Touchalytics: On the applicability of touchscreen input as a behavioral biometric for continuous authentication,” IEEE Transactions on Information Forensics and Security, vol. 8, no. 1, pp. 136–148, 2013. [Google Scholar]
15. C. C. Rocha, J. C. D. Lima, M. A. R. Dantas and I. Augustin, “A2best: An adaptive authentication service based on mobile user’s behavior and Spatio-temporal context,” in Proc. of IEEE Symp. on Computers and Communications, Kerkyra, Greece, pp. 771–774, 2011. [Google Scholar]
16. J. C. D. Lima, C. C. Rocha, I. Augustin and M. A. R. Dantas, “A context-aware recommendation system to behavioral-based authentication in mobile and pervasive environments,” in Proc. of 9th Int. Conf. on Embedded and Ubiquitous Computing, Melbourne, VIC, Australia, pp. 312–319, 2011. [Google Scholar]
17. M. Sabharwal, “Multi-modal biometric authentication and secure transaction operation framework for e-banking,” International Journal of Business Data Communications and Networking, vol. 13, no. 1, pp. 102–116, 2017. [Google Scholar]
18. J. Mantyjarvi, M. Lindholm, E. Vildjiounaite, S. Makela and H. A. Ailisto, “Identifying users of portable devices from gait pattern with accelerometers,” Proc. Int. Conf. on Acoustics, Speech, and Signal Processing, vol. 2, pp. ii/973–ii/976, 2005. [Google Scholar]
19. D. Gafurov and E. Snekkenes, “Gait recognition using wearable motion recording sensors,” EURASIP Journal of Advanced Signal Processing, vol. 2009, no. 1, pp. 16, 2009. [Google Scholar]
20. A. A. Kale, N. Cuntoor and V. Kruger, “Gait-based recognition of humans using continuous hmms,” in Proc. of Int. Conf. on Automatic Face and Gesture Recognition, Washington, DC, USA, pp. 336, 2002. [Google Scholar]
21. M. Jakobsson, E. Shi, P. Golle and R. Chow, “Implicit authentication for mobile devices,” in Proc. of 4th USENIX Conf. on Hot Topics in Security, pp. 9, 2009. [Google Scholar]
22. P. Casale, O. Pujol and P. Radeva, “Personalization and user verification in wearable systems using biometric walking patterns,” Personal and Ubiquitous Computing, vol. 16, no. 6, pp. 1–18, 2012. [Google Scholar]
23. L. Rong, Z. Jianzhong, L. Ming and H. Xiangfeng, “A wearable acceleration sensor system for gait recognition,” in Proc. of IEEE Conf. on Industrial Electronics and Applications, Harbin, China, pp. 2654–2659, 2007. [Google Scholar]
24. M. O. Derawi, C. Nickel, P. Bours and C. Busch, “Unobtrusive user-authentication on mobile phones using biometric gait recognition,” in Proc. of Sixth Int. Conf. on Intelligent Information Hiding and Multimedia Signal Processing, Darmstadt, Germany, pp. 306–311, 2010. [Google Scholar]
25. D. Gafurov, E. Snekkenes and P. Bours, “Improved gait recognition performance using cycle matching,” in Proc. of 24th Int. Conf. on Advanced Information Networking and Applications Workshops, Perth, WA, Australia, pp. 836–841, 2010. [Google Scholar]
26. M. O. Derawi, P. Bours and K. Holien, “Improved cycle detection for accelerometer-based gait authentication,” in Proc. of Int. Conf. on Intelligent Information Hiding and Multimedia Signal Processing, Darmstadt, Germany, pp. 312–317, 2010. [Google Scholar]
27. P. Bours and R. Shrestha, “Eigensteps: A giant leap for gait recognition,” in Proc. of Int. Workshop on Security and Communication Networks, pp. 1–6, 2010. [Google Scholar]
28. M. Ahmad, A. M. Khan, M. Mazzara, S. Distefano, A. Ali et al., “Extended Sammon projection and wavelet kernel extreme learning machine for gait-based legitimate user identification,” in Proc. of the 34th ACM/SIGAPP Symp. on Applied Computing, Limassol, Cyprus, pp. 1216–1219, 2019. [Google Scholar]
29. J. A. Hughes, J. A. Brown and A. M. Khan, “Smartphone gait fingerprinting models via genetic programming,” in IEEE Congress on Evolutionary Computation, pp. 408–415, 2016. [Google Scholar]
30. M. Derawi and P. Bours, “Gait and activity recognition using commercial phones,” Computer Security, vol. 39, no. 2, pp. 137–144, 2013. [Google Scholar]
31. S. Davidson, D. Smith, C. Yang and S. C. Cheahs, “Smartwatch user identification as a means of authentication,” San Diego: Computer Science department at the University of California, Technical report, 2016. [Google Scholar]
32. T. Kobayashi, K. Hasida and N. Otsu, “Rotation invariant feature extraction from 3-d acceleration signals,” in IEEE Int. Conf. on Acoustics, Speech and Signal Processing, Prague, Czech Republic, pp. 3684–3687, 2011. [Google Scholar]
33. H. M. Thang, V. Q. Viet, N. Dinh Thuc and D. Choi, “Gait identification using accelerometer on mobile phone,” in Int. Conf. on Control, Automation and Information Sciences, Saigon, Vietnam, pp. 344–348, 2012. [Google Scholar]
34. M. Wolff, “Behavioral biometric identification on mobile devices,” in Dylan D. Schmorrow and CaliM. Fidopiastis, Editors, Foundations of Augmented Cognition, Las Vegas, NV, USA, pp. 783–791, 2013. [Google Scholar]
35. F. Juefei-Xu, C. Bhagavatula, A. Jaech, U. Prasad and M. Savvides, “Gait-id on the move: Pace independent human identification using cell phone accelerometer dynamics,” in Proc. of IEEE 5th Int. Conf. on Biometrics: Theory, Applications, and Systems, Arlington, VA, USA, pp. 8–15, 2012. [Google Scholar]
36. S. Sprager and D. Zazula, “A cumulant-based method for gait identification using accelerometer data with principal component analysis and support vector machine,” WSEAS Transactions on Signal Processing, vol. 5, no. 11, pp. 369–378, 2009. [Google Scholar]
37. G. Pan, Y. Zhang and Z. Wu, “Accelerometer-based gait recognition via voting by signature points,” Electronics Letters, vol. 45, no. 22, pp. 1116–1118, 2009. [Google Scholar]
38. J. R. Kwapisz, G. M. Weiss and S. A. Moore, “Cell phone-based biometric identification,” in Proc. of 4th IEEE Int. Conf. on Biometrics: Theory, Applications, and Systems, Washington, DC, USA, pp. 1–7, 2010. [Google Scholar]
39. B. S. Lin, Y. T. Liu, C. Yu, G. Jan and B.-T. Hsiao, “Gait recognition and walking exercise intensity estimation,” International Journal of Environmental Research and Public Health, vol. 11, no. 4, pp. 3822–3844, 2014. [Google Scholar]
40. H. Lu, J. Huang, T. Saha and L. Nachman, “Unobtrusive gait verification for mobile phones,” in Proc. of ACM Int. Symp. on Wearable Computers, Seattle, Washington, USA, pp. 91–98, 2014. [Google Scholar]
41. A. H. Johnston and G. M. Weiss, “Smartwatch-based biometric gait recognition,” in Proc. of IEEE Int. Conf. on Biometrics Theory, Applications and Systems, Arlington, VA, USA, pp. 1–6, 2015. [Google Scholar]
42. G. Trivino, A. A. Alvarez and G. Bailador, “Application of the computational theory of perceptions to human gait pattern recognition,” Pattern Recognition, vol. 43, no. 7, pp. 2572–2581, 2010. [Google Scholar]
43. L. Wang, T. Tan, W. Hu and H. Ning, “Automatic gait recognition based on statistical shape analysis,” IEEE Transactions on Image Processing, vol. 12, no. 9, pp. 1120–1131, 2003. [Google Scholar]
44. L. Rong, Z. Jianzhong, L. Ming and H. Xiangfeng, “A wearable acceleration sensor system for gait recognition,” in Proc. of 2nd IEEE Conf. on Industrial Electronics and Applications, pp. 2654–2659, 2007. [Google Scholar]
45. H. J. Ailisto, M. Lindholm, J. Mantyjarvi, E. Vildjiounaite and S. M. Makela, “Identifying people from gait pattern with accelerometers,” in Biometric Technology for Human Identification II, International Society for Optics and Photonics, A. K. Jain, N. K. Ratha (eds.vol. 5779. Bellingham: SPIE, pp. 7–14, 2005. [Google Scholar]
46. M. Bachlin, J. Schumm, D. Roggen and G. Toaster, “Quantifying gait similarity: User authentication and real-world challenge,” in Proc. of Int. Conf. on Advances in Biometrics, Alghero, Italy, pp. 1040–1049, 2009. [Google Scholar]
47. T. Hoang, T. Nguyen, C. Luong, S. Do and C. Deokjai, “Adaptive cross-device gait recognition using a mobile accelerometer,” Journal of Information Processing Systems, vol. 9, no. 6, pp. 333–348, 2013. [Google Scholar]
48. C. Nickel, H. Brandt and C. Busch, “Classification of acceleration data for biometric gait recognition on mobile devices,” in Proc. of Biometrics Special Interest Group, Darmstadt, Germany, pp. 57–66, 2011. [Google Scholar]
49. V. Cuomo, V. Lapenna, M. Macchiato and C. Serio, “Autoregressive models as a tool to discriminate chaos from randomness in geoelectrical time series: An application to earthquake prediction,” Annals of Geophysics, vol. 40, no. 2, pp. 385–400, 1997. [Google Scholar]
50. M. D. R. Medina, “Spatial autoregressive and moving average Hilbertian processes,” Journal of Multivariate Analysis, vol. 102, no. 2, pp. 292–305, 2011. [Google Scholar]
51. M. Ahmad, A. M. Khan., M. Mazzara and S. Distefano, “Multi-layer extreme learning machine-based autoencoder for hyperspectral image classification,” Proc. of Int. Joint Conf. on Computer Vision, Imaging and Computer Graphics Theory and Applications, vol. 4, pp. 75–82, 2019. [Google Scholar]
52. M. Ahmad, A. Khan, A. Khan, M. Mazzara, S. Distefano et al., “Spatial prior fuzziness pool-based interactive classification of hyperspectral images,” Remote Sensing, vol. 11, no. 5, pp. 1136, 2019. [Google Scholar]
53. M. Ahmad, A. M. Khan and R. Hussain, “Graph-based spatial-spectral feature learning for hyperspectral image classification,” IET Image Processing, vol. 11, no. 12, pp. 1310–1316, 2017. [Google Scholar]
54. M. Ahmad, S. Protasov, A. M. Khan, R. Hussain, A. M. Khattak et al., “Fuzziness based active learning framework to enhance hyperspectral image classification performance for discriminative and generative classifiers,” PLOS ONE, vol. 13, no. 1, pp. e0188996, 2018. [Google Scholar]
55. H. Patel, D. S. Rajput, T. G. Reddy, C. Iwendi, A. K. Bashir et al., “A review on classification of imbalanced data for wireless sensor networks,” International Journal of Distributed Sensor Networks, vol. 16, no. 4, pp. 1–15, 2020. [Google Scholar]
56. T. G. Reddy, M. P. K. Reddy, K. Lakshmanna, R. Kaluri, D. S. Rajput et al., “Analysis of dimensionality reduction techniques on big data,” IEEE Access, vol. 8, pp. 54776–54788, 2020. [Google Scholar]
57. M. Ahmad, A. M. Khan, M. Mazzara, S. Distifano, M. Ali et al., “A fast and compact 3-D CNN for hyperspectral image classification,” IEEE Geoscience and Remote Sensing Letters, pp. 1–5, 2020. [Google Scholar]
58. M. Ahamd, “Ground truth labeling and samples selection for hyperspectral image classification,” Optik, vol. 230, no. 12, pp. 166267, 2021. [Google Scholar]
59. T. G. Reddy, D. S. Rajput, M. P. K. Reddy, K. Lakshmanna, S. Bhattacharya et al., “A novel PCA-whale optimization-based deep neural network model for classification of tomato plant diseases using GPU,” Journal of Real-Time Image Processing, 2020. [Google Scholar]
60. T. G. Reddy, S. Bhattacharya, P. K. Reddy, S. Hakak, W. Z. Khan et al., “Antlion re-sampling based deep neural network model for classification of imbalanced multimodal stroke dataset,” Multimed Tools and Application, 2020. [Google Scholar]
 | This work is licensed under a Creative Commons Attribution 4.0 International License, which permits unrestricted use, distribution, and reproduction in any medium, provided the original work is properly cited. |