DOI:10.32604/cmc.2021.016836
| Computers, Materials & Continua DOI:10.32604/cmc.2021.016836 | |
| Article |
Optimal Cost-Aware Paradigm for Off-Grid Green Cellular Networks in Oman
1Department of Electrical Engineering, College of Electronics and Information Engineering, Sejong University, Seoul, 05006, Korea
2Department of Electrical and Electronics Engineering, Sri Venkateswara College of Engineering, Sriperumbudur, Chennai, 602117, India
3Department of Electrical and Computer Engineering, University of Ottawa, Ottawa, K1N 6N5, ON, Canada
4Department of Electronics and Communications Engineering, A’Sharqiyah University, Ibra, 400, Oman
5School of Telecommunication Engineering, Suranaree University of Technology, Nakhon Ratchasima, Thailand
6Prince Sattam bin Abdulaziz University, College of Computer Engineering and Sciences, Alkharj, 11942, Saudi Arabia
*Corresponding Author: Peerapong Uthansakul. Email: uthansakul@sut.ac.th
Received: 13 January 2021; Accepted: 17 February 2021
Abstract: Green wireless networks or energy-efficient wireless networks have gained popularity as a research topic due to the ecological and economic concerns of cellular operators. The specific power supply requirements for the cellular base station, such as cost-effectiveness, efficiency, sustainability, and reliability, can be met by utilizing the technological advances in renewable energy. There are numerous drivers for the deployment of renewable energy technologies and the transition towards green energy. Renewable energy is free, clean, and abundant in most locations throughout the year. Accordingly, this work proposes a novel framework for energy-efficient solar-powered base stations for the Oman site, specifically for off-grid locations where fuel transportation for diesel generator (DG) is a serious concern. To demonstrate the effectiveness of the proposed system for off-grid sites, the Hybrid Optimization Model for Electric Renewables optimization software is adapted by considering real-time conditions and its technical feasibility. Different cost factors such as capital cost, salvage cost, replacement cost, operational, and maintenance cost of PV panels, inverters, and batteries also undergo extensive analysis. From the observed results, the total net present cost (NPC) of the proposed system is $27,887, while the net NPC of the DG is estimated at $32,900. Remarkably, the proposed scheme can potentially achieve considerable savings in the operational expenditure at approximately 15.24%. Indeed, these outcomes can provide profound economic, technical, and ecological benefits to the cellular operators of Oman. It also ensures a sizeable reduction in greenhouse gas that supports sustainable green wireless network deployment in remote areas.
Keywords: Wireless networks; green wireless networks; green communications; sustainability; OPEX
The energy consumption rate of information and communication technology (ICT) has seen a rapid increase over the last few decades due the excessive demand for multimedia services. Wireless networks are considered one of the main sources of energy consumption in the ICT arena [1]. Among the wireless network components, base stations (BSs) are considered a paramount source of energy consumption, accounting for 57% of the total energy used [2]. In the last decade, wireless network operators are focused on providing a high data transfer rate with large radio coverage to satisfy the demand of subscribers. Therefore, wireless network operators have significantly raised the BS numbers to deliver high data rate to several wireless devices and access point nodes [3]. Consequently, a steep rise is observed in both the energy consumption and operational expenditure (OPEX) [4]. Recently, the massive connectivity of IoT devices incorporated with wireless access networks led to a huge energy consumption and is further predicted to increase enormously in the future owing to the diverse types of IoT applications [5]. Thus, the primary focuses of wireless network operators lie in providing high data rate while paying attention to energy-efficient issues [6]. Moreover, the increasing concerns of the wireless network operators about energy consumption are not only on how to increase savings in OPEX but also raise awareness of global warming issues and other ecological problems [7]. Therefore, the researchers and experts are striving to determine the optimum approaches to largely diminish the energy consumption rate for the wireless networks while maintaining the desired data services [8].
Researchers are focused on numerous distinctive approaches to reduce the energy consumption in wireless networks such as energy-efficient hardware components, selective operation of components, efficient use of radio transmission process, deploying heterogeneous cells, and implementing renewable energy resources (RESs) [9]. Over the long term, RESs are considered the most attractive and cost-effective practices of designing energy-efficient wireless networks in the existing infrastructure [10].
Typically, the desired zone for PV-powered BSs is in the mid-latitude between 30
Considering all these inferences, researchers lack sufficient descriptions for the total OPEX savings due to RESs. Accordingly, this study examines the feasibility of using solar power solutions as the main power sources to supply the energy requirements of cellular LTE-BSs in Oman’s off-grid locations to determine the net OPEX savings. Oman is positioned at a latitude between 16
Implementing the PV system requires intensive study owing to its diverse design and the uncertainty of solar parameters, such as the dynamic rate of solar irradiation that adds to the difficulty due to its intermittent, seasonal, and uncertain nature. To overcome these issues, the HOMER model is used by creating the energy balance scheming every hour for 8,760 h per year. It also compares the actual hourly load demand with generated energy. Additionally, it manages the charging and discharging features of the batteries and computes the installation and operating cost for the complete lifespan of the project. Given all these advantages, the HOMER software is adapted in this work to achieve the techno-economic feasibility of the solar-driven LTE-BS. The contributions of this work are summarized as follows:
i) To propose and determine the technical benchmarks of an optimal standalone PV system that guarantees energy autonomy.
ii) To obtain a long-term energy balance for cellular networks based on the available solar irradiation in Oman that warrants sustainable green wireless networks.
iii) To examine, analyze, and evaluate the viability of a standalone PV system for maximum energy yield and economic savings to guarantee both sustainability and cost-effectiveness.
The rest of this work is organized as follows. Section 2 presents the proposed system and mathematical modeling. Section 3 discusses the implementation of simulation configurations. Then, results and discussion are described in Section 4. Section 5 specifies the economic feasibility of the proposed scheme. Section 6 concludes the work.
2 Proposed System and Mathematical Modeling
The proposed system comprises three segments such as sources, converters, and loads as demonstrated in Fig. 1. As stated earlier, sources are standalone solar PV panels which are arranged in series and parallel connection on the bases of the voltage and current ratings. A battery bank or battery management system stores the energy from PV panels and ensures the reliability and power quality of the generated power. The DC bus which maintains the constant voltage, supplies the power to the cellular macro LTE-BS. Furthermore, a DC/AC converter is used to convert the power to AC which supplies the power to the AC load (Air conditioner). Excess energy is stored in the battery bank as a backup which can be utilized during non-sunny periods, particularly at night (load shedding hours). The following subsections thoroughly demonstrate the architecture of solar-powered macro LTE-BS.
The cellular BS consists of various pieces of equipment that can be used to communicate with mobile/cellular units. The backhaul network comprises the following sub-units: (i) multiple transceivers (TRXs), (ii) power amplifier (PA), (iii) radio-frequency (RF), (iv) baseband (BB), (v) DC–DC Power supply, and (vi) cooling systems. The TRXs have a PA which amplifies the signal power coming from the BB unit. In addition, the BB is adapted for internal processing and coding. A detailed discussion of the BS components can be seen in [2].
A macro LTE-BS type subsystem has three sectors with two antennas based on the component level [12]. Fig. 1 provides the detailed block diagram of macro LTE-BS hardware elements. The net power consumption by the BS is derived through the following equation [12];
where NTRX denotes the number of transmitting/receiving antennas for individual sites, i.e., transceivers;
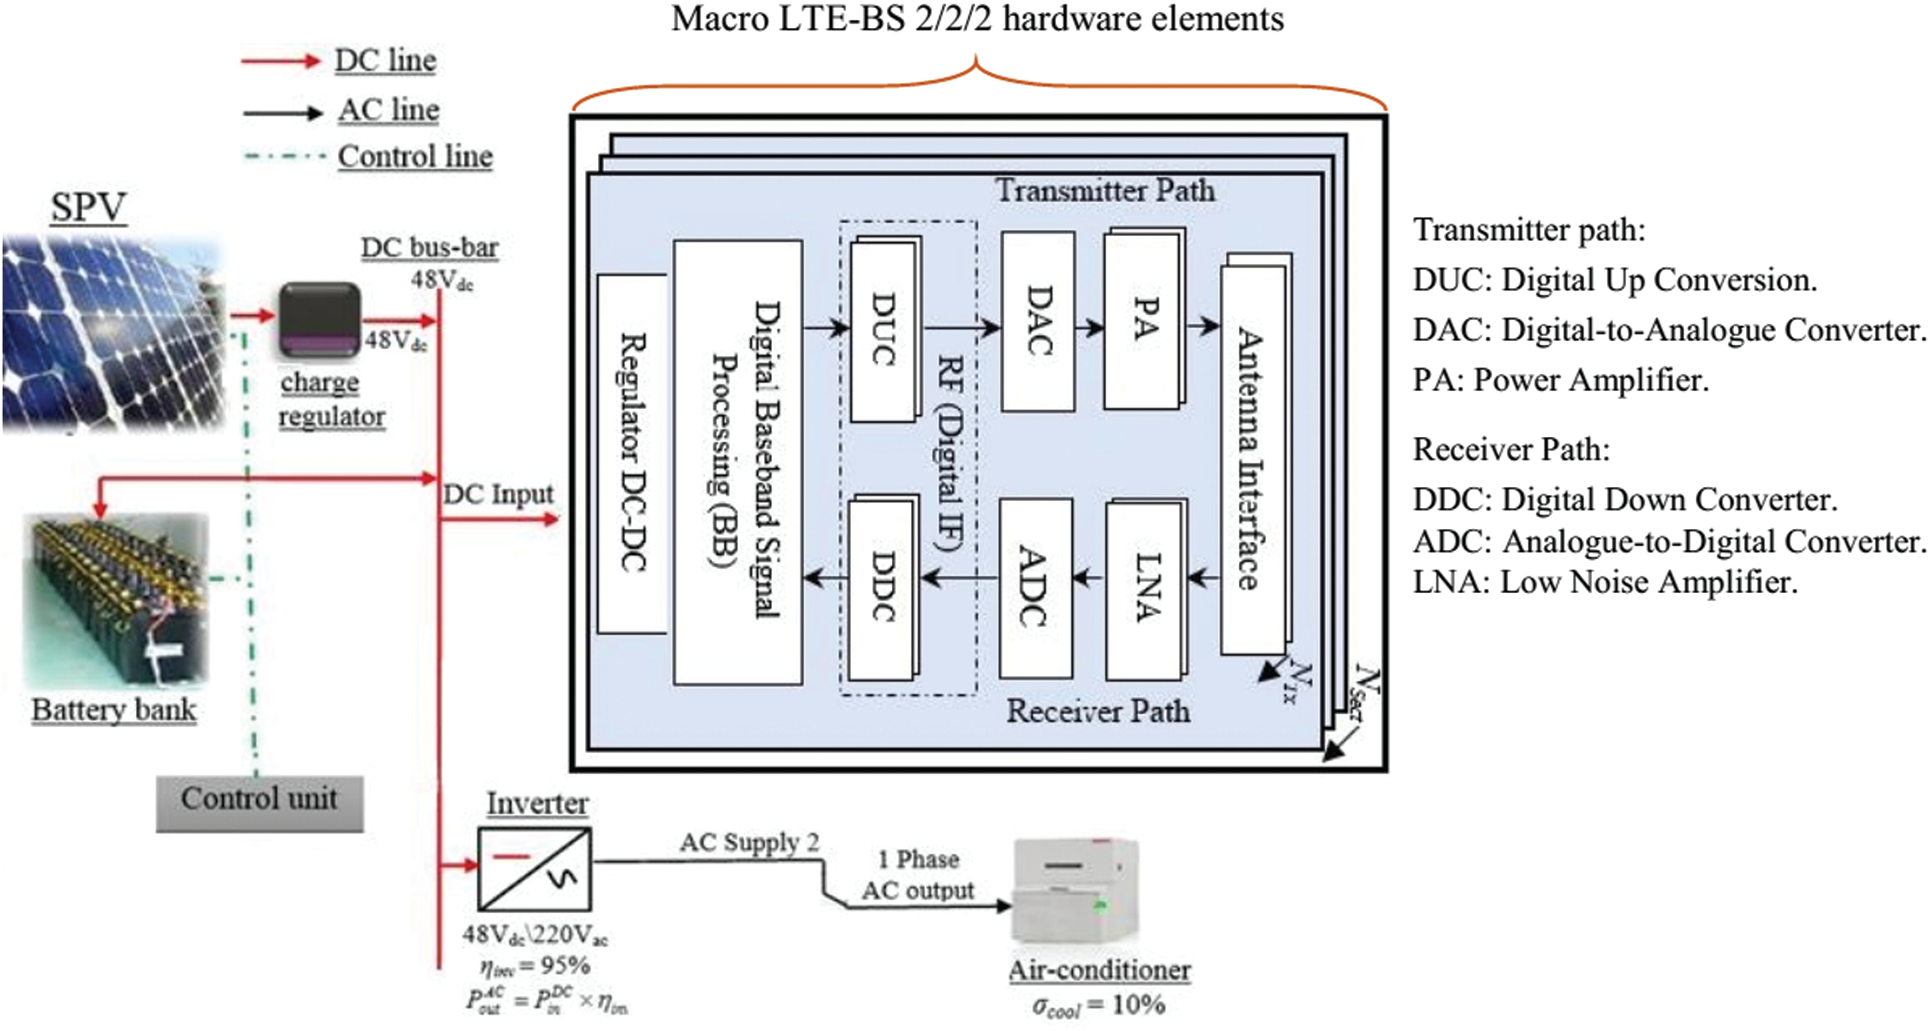
Figure 1: Schematic diagram of the proposed system
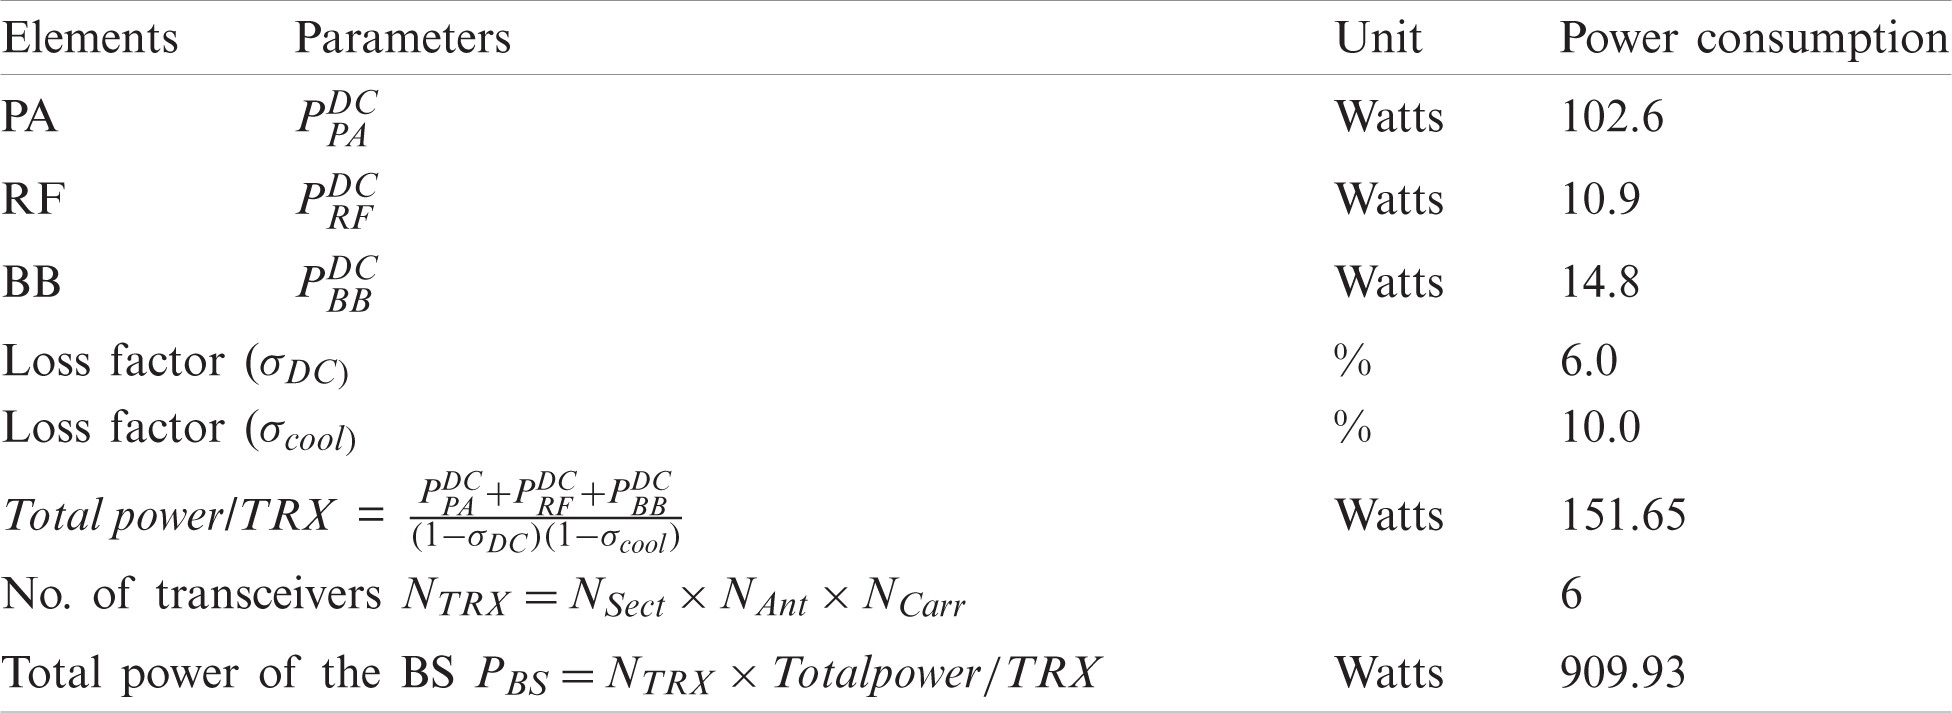
Tab. 1 presents the power consumption scale of the different parts of the macro BS system with a
Table 1: Power consumption scale of different hardware elements at a bandwidth equals 10 MHz [12]
It consists of numerous solar cells that are connected in series and parallel to form a solar module or PV arrangement. It generates DC electric power through the absorption of shortwave irradiance. The total annual energy extraction from the PV arrangement (EPV) is derived as [13],
where PCPV states a peak capacity of the PV array (kW); PSH denotes peak solar hour and is calculated on the basis of the equivalent average daily solar irradiation. DFPV states a derating factor of PV array, considering the impact of dust, losses, temperature variations, and other potential factors that can distress the output power of the panel.
A solar power-driven macro LTE-BS consists of a battery bank that is allowed to charge during a sunny period with excess power generated by PV arrays. The BESS capacity of the BS merely depends on the depth of discharge (DOD) and requires evaluation before commissioning. It can be expressed as [14],
where SOCmin denotes the minimum state of charge (SOC). In this work, the Trojan L16P battery model is considered because the DOD of this battery is 70%, i.e., it can effectually deliver 70% of its energy with 30% of its energy reserved. Computing the days of autonomy (
where the terms Nbatt and Vnom are the total number of battery units in the BESS and a nominal voltage of a single battery unit (V), respectively. The terms Qnom and
The lifetime of the battery plays a crucial role. It can be predicted on the basis of the operating conditions. More specifically, the DOD during each diurnal charge–discharge cycle displays a leading role in the battery lifetime and can be computed as [15],
where the term Qlifetime represents the lifetime throughput of a single battery in kWh, Qthrpt denotes the annual battery throughput in kWh per year, and the term Rbattf states a battery float life in years.
The total capacity of the inverter (Cinv) is calculated as [16],
where the term LAC represents the available maximum AC load;
The configuration of a solar-powered base station is based on the following considerations: (i) the essential components that must be involved in the system design, (ii) the number of components that must be adopted, and (iii) the size of each element. The HOMER Micro-power optimization tool aids in obtaining an optimal solar system with low net present cost (NPC). NPC contains all incurred expenses and incomes throughout the project lifetime. The total annualized cost (CTAC) exemplifies the annual price of the complete scheme in the $/year that contains the initial capital (IC) costs (
The net present cost (CNPC) can also be described for annualized value and can be derived as
The term CRF denotes the recovery factor which converts a CNPC into a flow of equal annual costs over a definite period. It can be calculated on the basis of the annual interest rate (i) and number of years (N) using the following equation [15],
The CNPC symbolizes all the prices incurred within the project lifespan but with impending cash flows cut-rate to the current discount ratio. NPC comprises the IC, replacement, O&M, and salvage costs. However, the total NPC value is substantially reduced due to the salvage value at the end of the project lifespan. The computation of salvage value (S) can be carried out using the following equation;
where Rcomp defines the lifespan of the component in years, Rrem denotes the remaining lifespan of the component in years, and the term Crep is the replacement rate of the component in $.
This study scrutinizes to minimize the total cost of the NPC for an optimal scheme of a stand-alone SPS based on various constraints. To attain system optimization, the objective function of the NPC can be derived using Eq. (9) and formulated as
The above-derived objective function is subjected to the following constraints;
To warrant a power balance between actual demand and energy production, the power production of the sources (EPV and EBattery) must meet the demand of BS (EBS) plus losses (ELosses).
3 Implementing Simulation and Configuration
The simulation consists of three major parts such as inputs, optimization, and outputs as given in Fig. 2. To determine the optimal PV system architecture with reduced NPC cost, a new methodology has been proposed as demonstrated in Fig. 3.
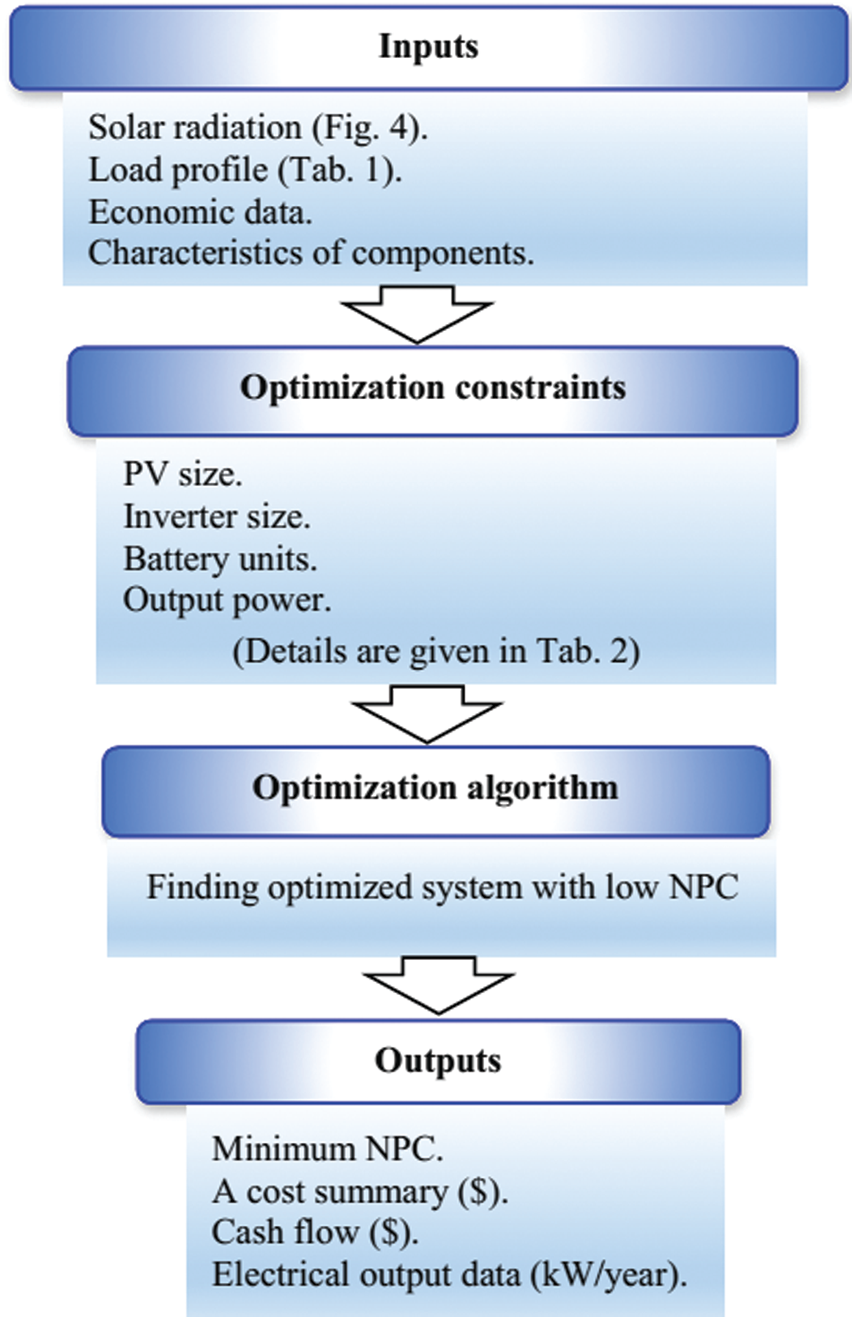
Figure 2: Major parts of the simulation process
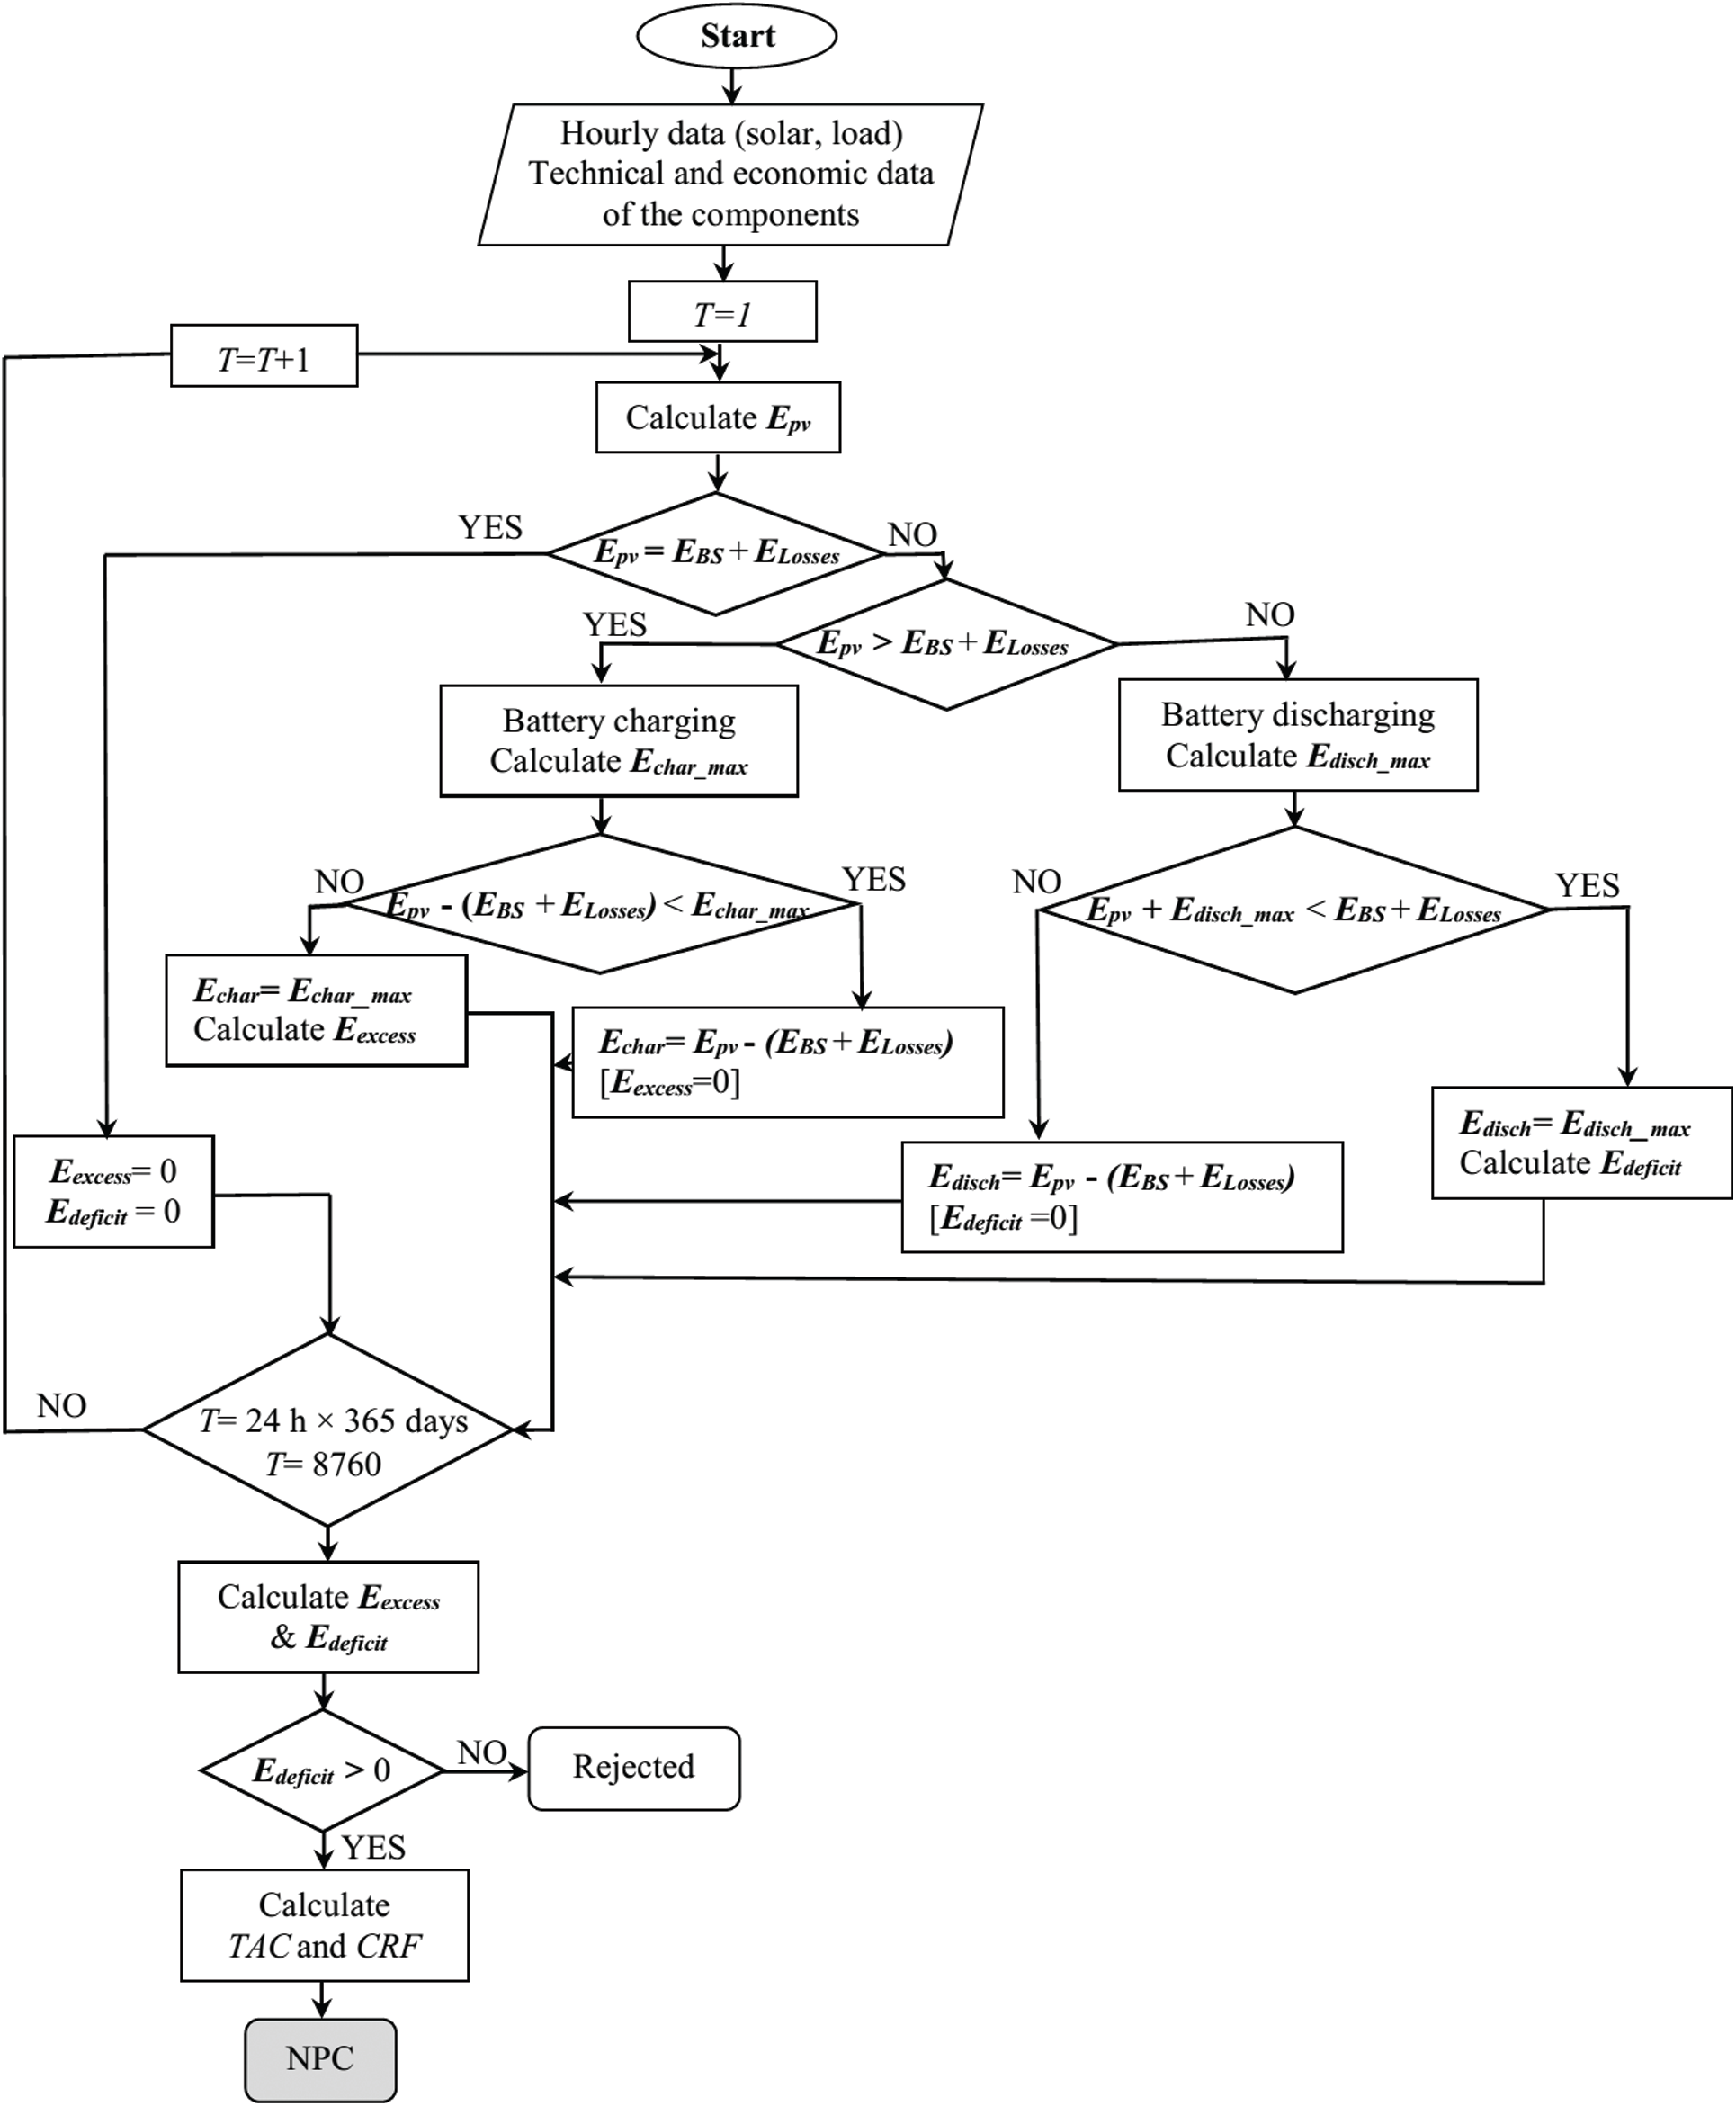
Figure 3: Flowchart of the proposed system architecture with the lowest NPC cost
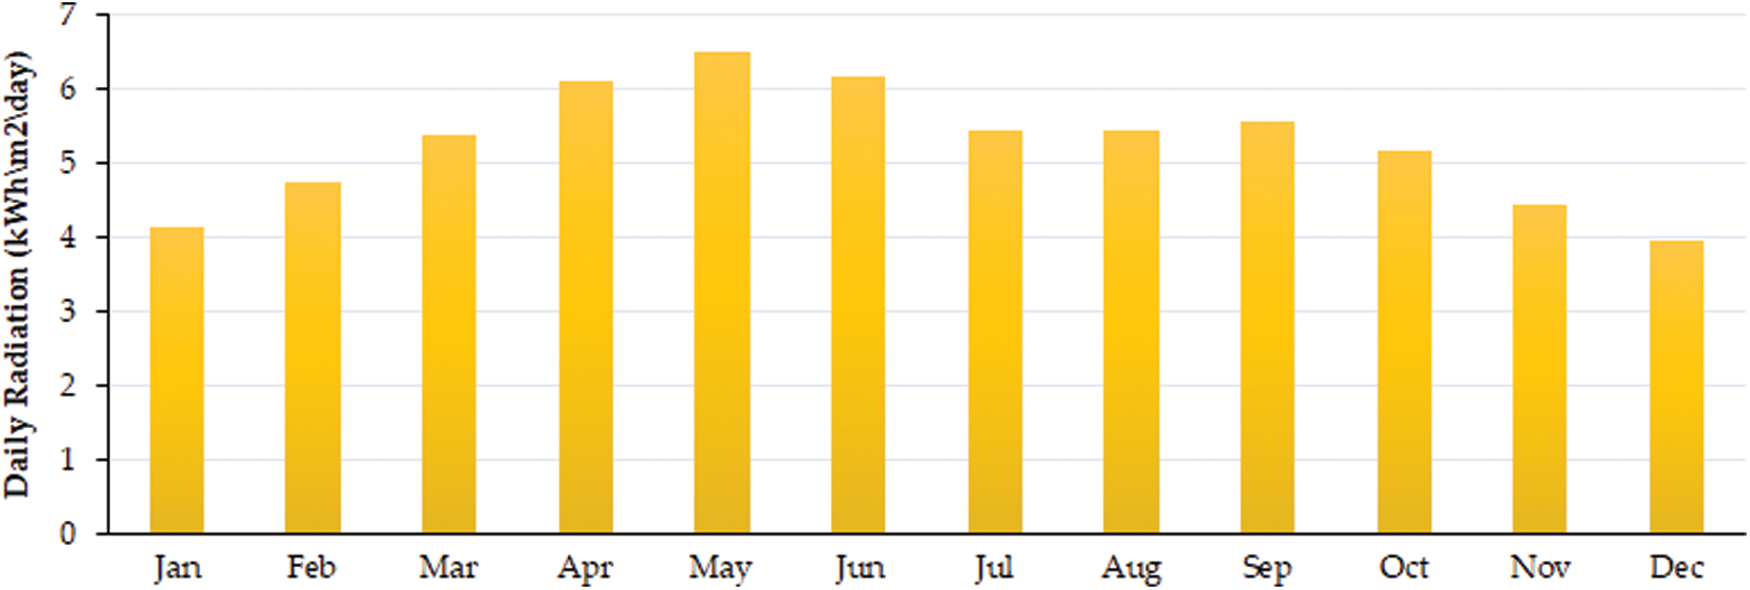
Figure 4: Solar irradiance (monthly average) [11]
Table 2: Simulation configuration
Most economically, the total NPC cost is $27,887. It comprises 4.4 kW rated PV panels and 64 numbers of batteries connected in eight parallel strings along with a 0.1 kW inverter. The following subsections provide detailed discussions.
The optimal capacity of the PV is 4.5 kW. The yearly energy output of the PV is calculated using Eq. (2): the total energy output of the PV is calculated as 7,344 kWh (
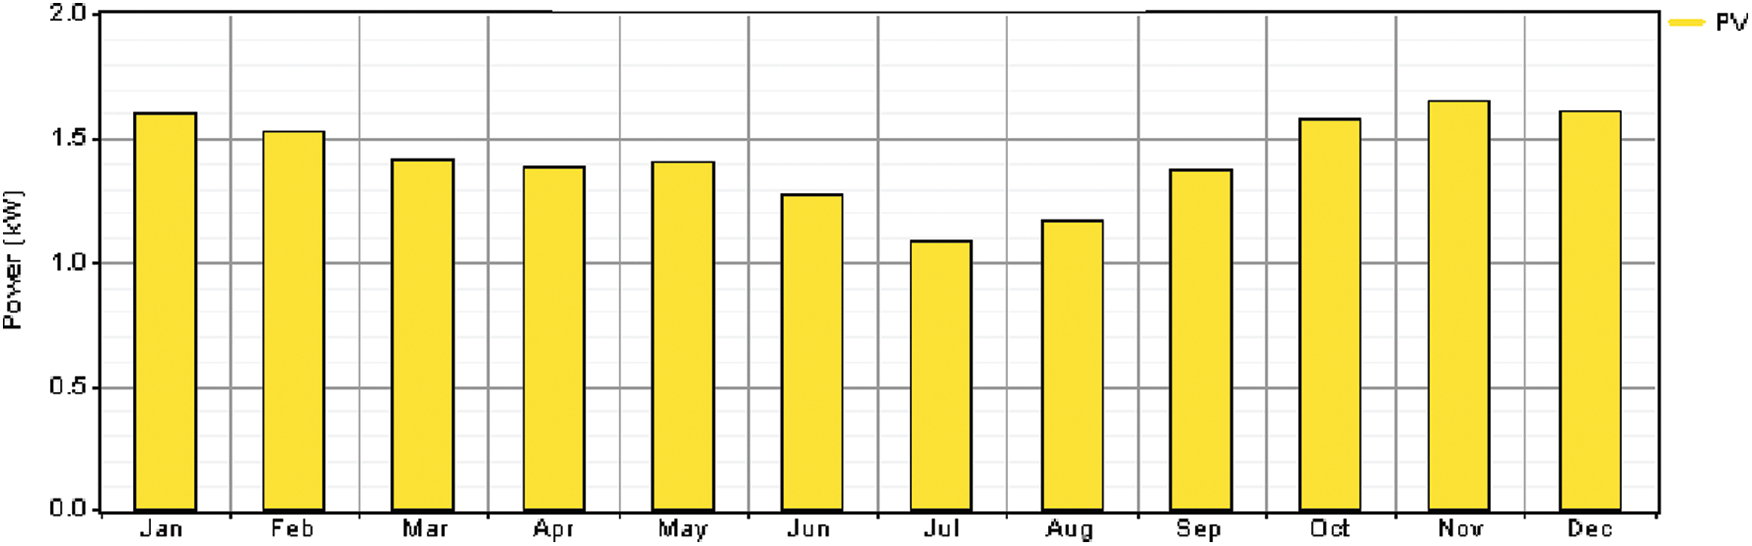
Figure 5: Average PV output power (month wise)
Fig. 6 presents a cash flow summary of the PV array during the project lifespan. The total capital of the PV array is $4,500 which is computed as 4.5 kW
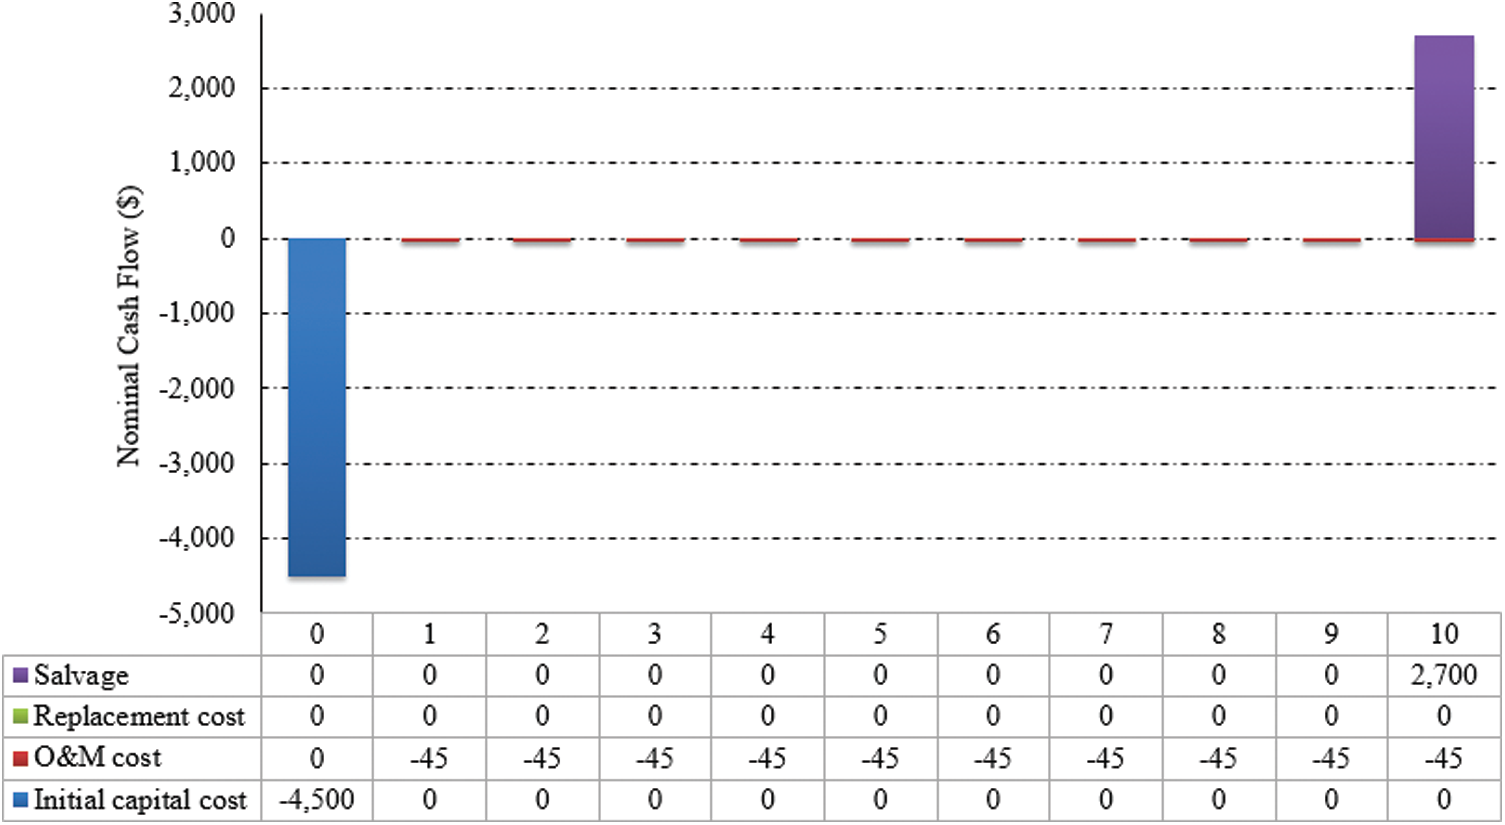
Figure 6: Summary of cash flow of the PV array (project lifespan)
The optimal capacity of the battery bank, as determined by the HOMER simulation for the system, is 64 units. The voltage rating of the Trojan L16P single battery is 6 Vdc, and its capacity is 360 Ah. To obtain the required ratings, 64 batteries are connected in series and parallel in the HOMER platform to be compatible with the 48 Vdc bus bar. The roundtrip efficiency of the battery reached 85%, calculated between the ratios of annual energy output and input, i.e., 4,369 kWh and 5,139 kWh, respectively. Roughly, the battery bank supplies the power to the load approximately 106 h specifically during the malfunction of the PV array. Fig. 7 presents the average hourly energy generation of the PV, battery storage, and excess electricity for 12 months. The initial phase at the end of July and first of August shows a lower rate of energy contribution from the PV system. Therefore, the energy stored in the battery bank has condensed into the lowest scale, and the state of charge stretched to 50% (see Fig. 8). Fig. 9 demonstrates the seasonal statistics of the maximum and minimum SOC, where the maximum energy influence of the battery bank occurred at the end of July and the first of August due to less energy contribution by the PV array.
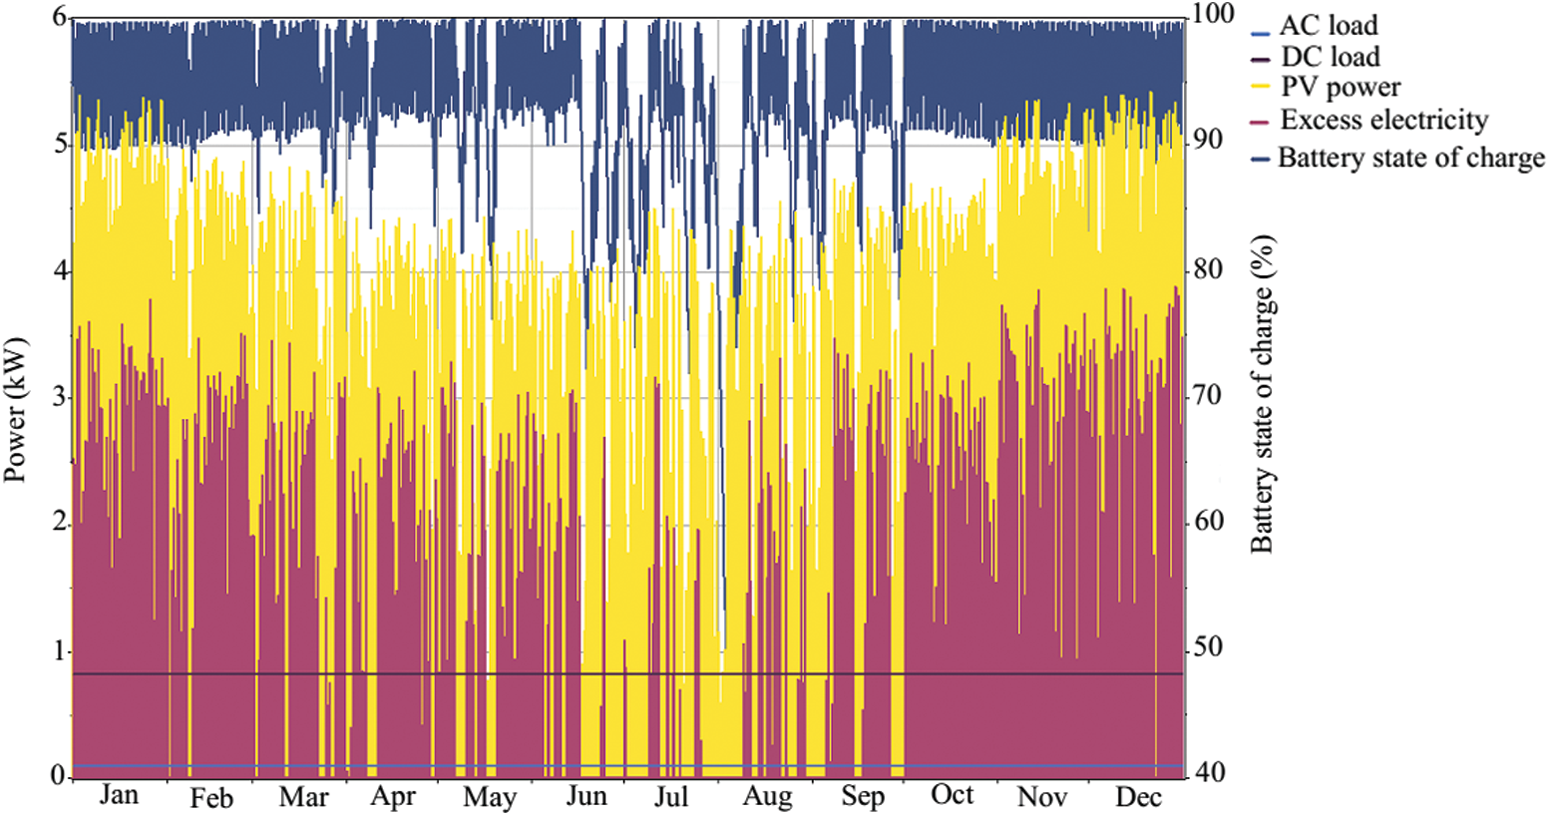
Figure 7: Average PV, battery bank, and excess electricity output (hourly)
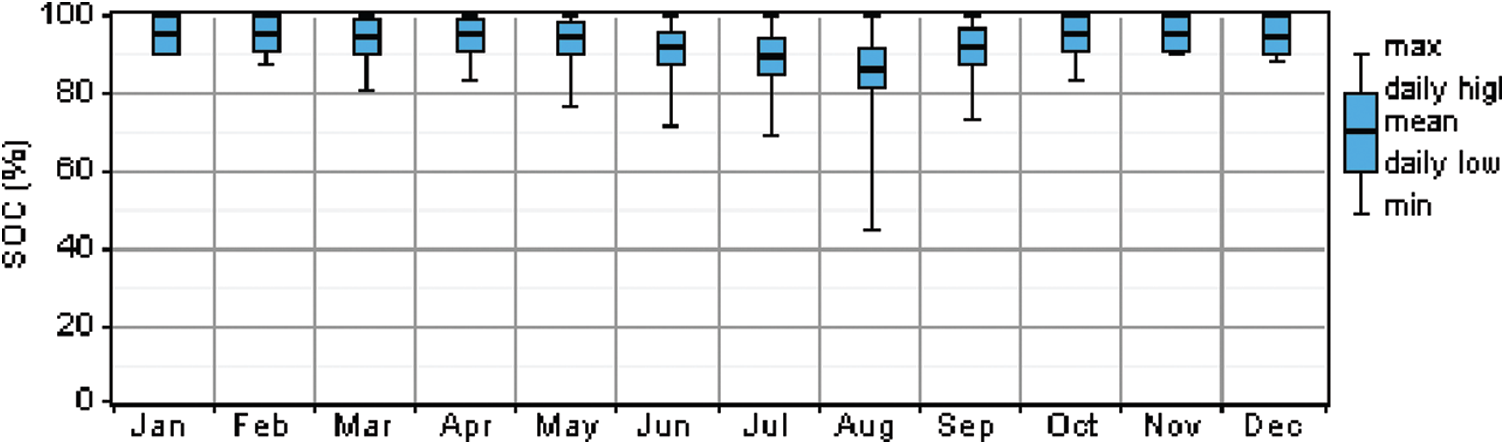
Figure 8: Battery bank state of charge (Monthly statistics)
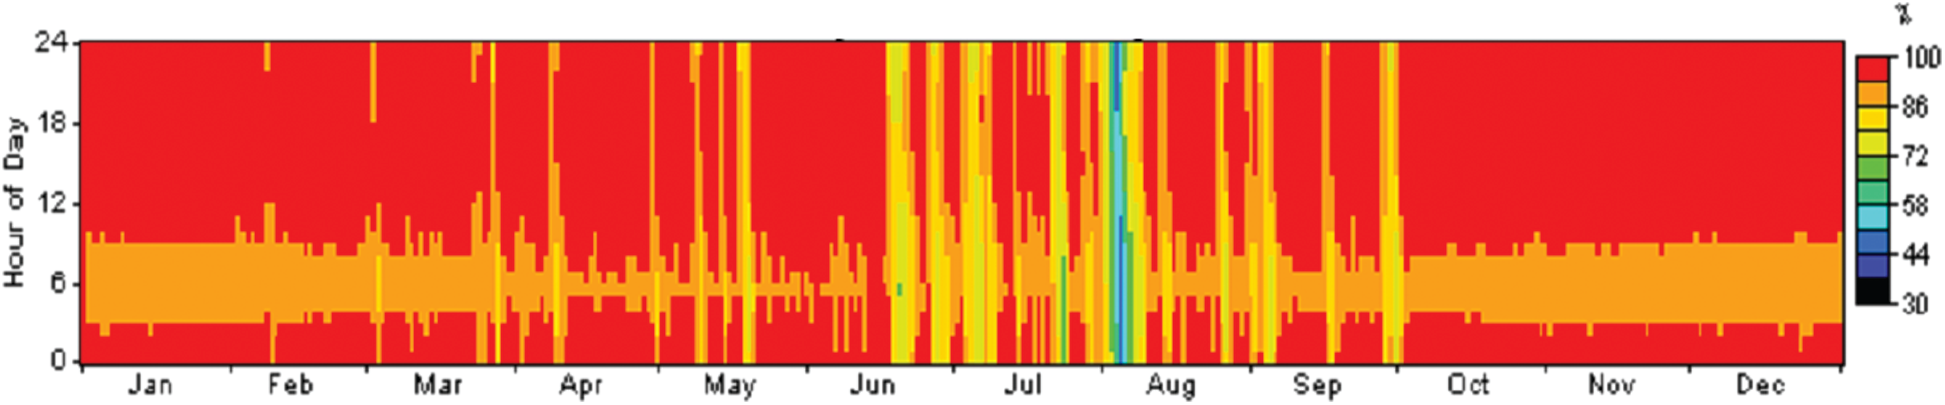
Figure 9: Maximum and minimum SOC (seasonal statistics)
Fig. 10 presents a cash flow summary of the battery bank during a project lifespan. The total capital of the PV array is $19,200 which is computed as 64
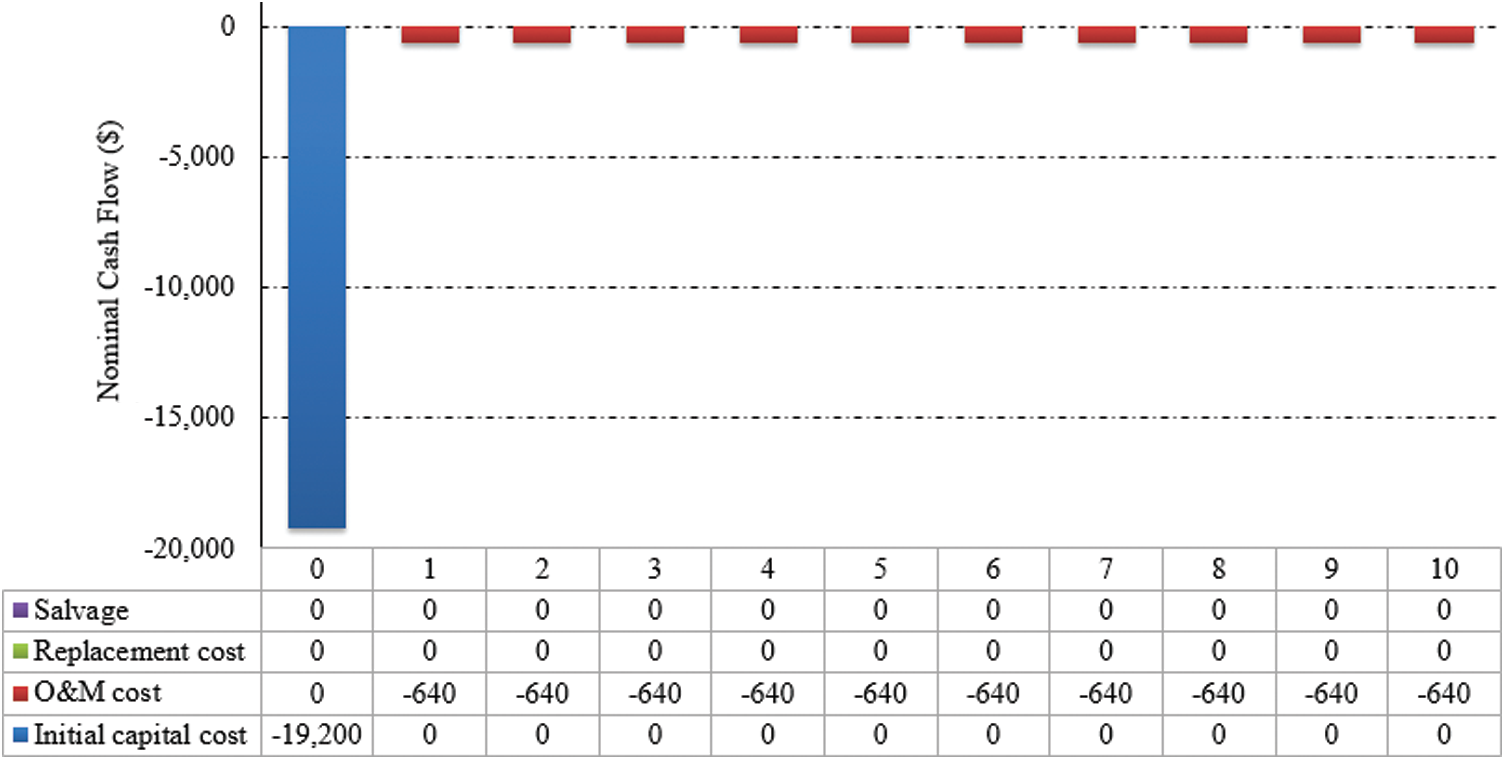
Figure 10: Summary of cash flow of the battery bank (project lifespan)
The net capacity of the inverter unit is 0.1 kW, and its efficiency is annually computed between the input (837 kWh) and output energy (795 kWh) and observed as 95%. The total operating hours are 8,759 h/year (24
Fig. 11 presents a cash flow summary of the inverter during a project lifetime. The total capital of the inverter is $40 which is computed as 0.1 kW
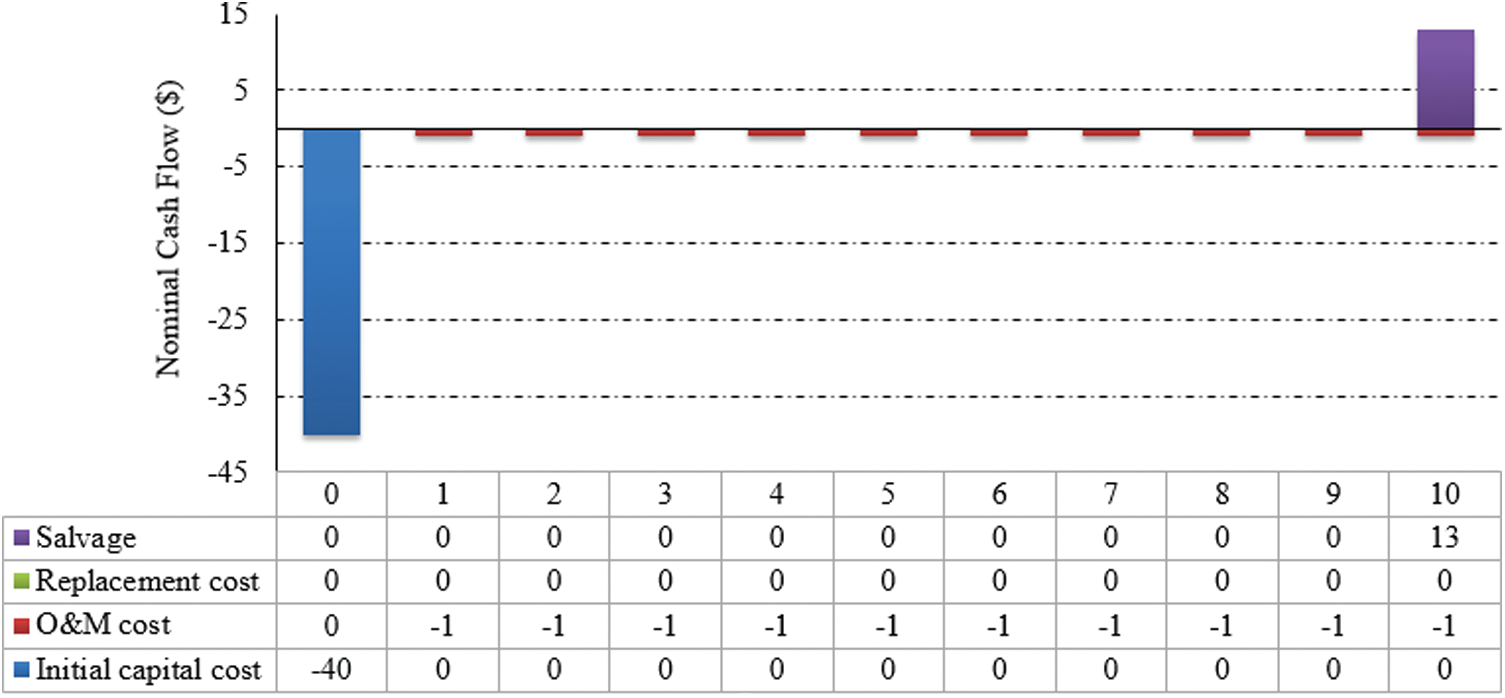
Figure 11: Summary of cash flow of the inverter (project lifespan)
The total NPC for the PV system is $27,887, i.e., $2,250 (NPCPV)+< dolloar > 25,600 (NPCBattery)+< dolloar > 37 (NPCInverter). Fig. 12 summarizes the total cash flow for the proposed solar-powered macro LTE-BS. From the economic analysis for the solar-powered macro LTE-BS, the battery bank clearly represents the bulk cost. However, this cost depends on the number of batteries in the system. Herein, the optimal number of batteries was found by the HOMER 64 battery. Thus, the number of batteries can be reduced, but the load autonomy decreases and is considered an important issue, especially in off-grid areas. Alternatively, the bulk of the replacement cost goes to components with short operational lifetimes because the batteries have a lifetime of 10 years, which is the same as the project lifetime. In addition, the PV array and inverter have lifetimes of 25 and 15 years, respectively. Accordingly, both do not require replacement.
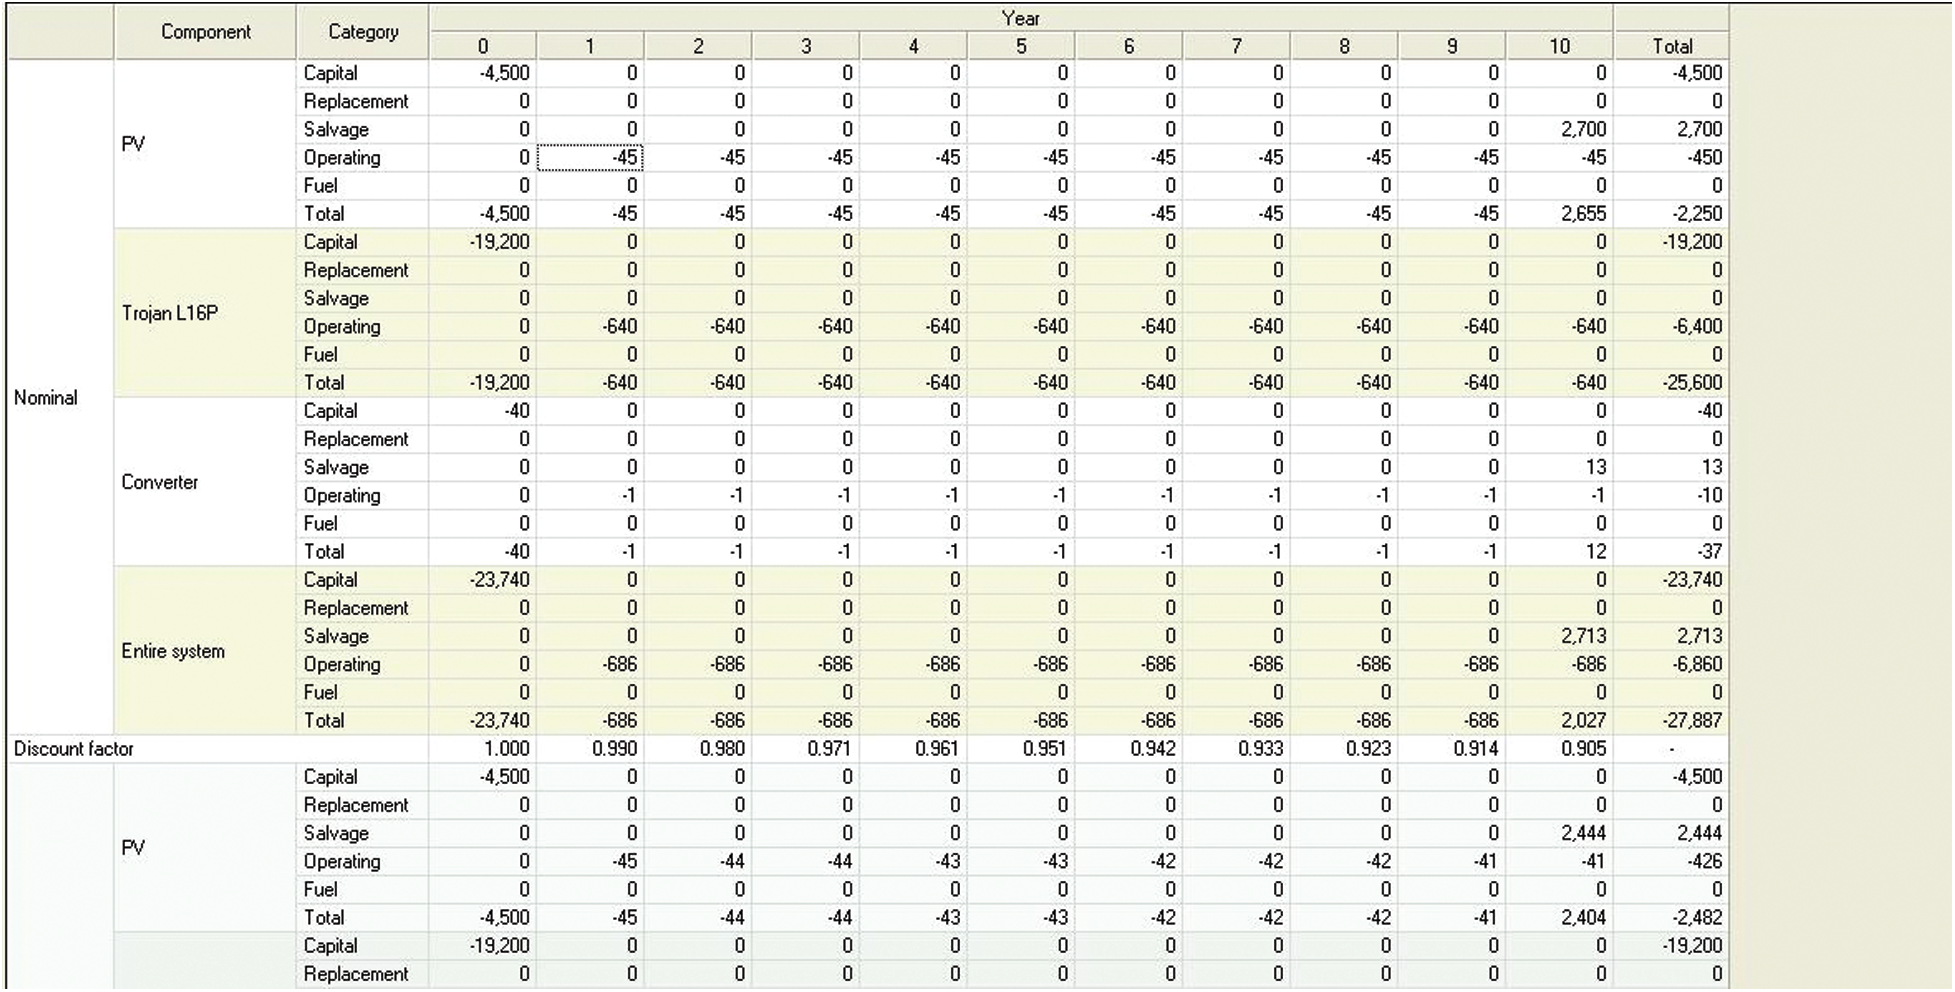
Figure 12: Summary of cash flow of the proposed solar-powered macro LTE-BS (project lifespan)
In remote areas, i.e., an off-grid station, the DG is typically used to power the cellular BSs. The rating of DG should be approximately 3.5 kW that can be computed between the ratio of maximum macro LTE-BS and 30% DG
• The IC is computed by multiplying the system size (3.5 kW) with its cost ($660/kW).
• The O&M cost (annual) of the DG is approximately $2,366 (excluding fuel transportation cost). A breakdown of this cost is described as follows:
—The net maintenance cost of DG is $438/year, estimated using the product of DG maintenance cost of 0.05$/h with annual operating hours (8,760 h).
—The total fuel cost is computed using the product of diesel price ($0.54/L) with total diesel consumption (3,569 L/year) and found to be $1,928. It is calculated on the basis of specific fuel consumption
• Every three years, a mobile operator must replace the DG, i.e., a minimum of three times during the lifespan of the project. Therefore, the net DG replacement cost is equal to $6,930, i.e.,
The net NPC of the solar system is approximately $27,887. Applying the proposed solar scheme, the total OPEX savings of 15.24% can be achieved compared with a conventional power source (DG).
This work proposed a framework for an energy-efficient RES-based cellular network for Oman off-grid sites using a PV module that acts as the main and standalone source for the base stations to minimize the OPEX. It also discussed the optimal system architecture, energy yield analysis, and economic analysis. The simulation results revealed that the proposed PV-based system can potentially meet the total demand for macro LTE-BS. Moreover, a battery bank can supply power to the macro LTE-BS load autonomy for 106 h. This figure is considered sufficient to fix the solar array in case of malfunctions. Regarding the economic aspect, the simulation results showed that the proposed solar system can achieve OPEX savings with a reliable energy supply. These results indicate that the PV-based power system is a good and effective choice for wireless network operators.
Acknowledgement: The authors wish to thank the editors of CMC and anonymous reviewers for their time in reviewing this manuscript.
Funding Statement: This research was supported by SUT Research and Development Fund and by the Deanship of Scientific Research at Prince Sattam bin Abdul-Aziz University, Saudi Arabia.
Conflicts of Interest: The authors declare that they have no conflicts of interest to report regarding the present study.
1. A. Srivastava, M. Gupta and G. Kaur, “Energy efficient transmission trends towards future green cognitive radio networks (5GProgress, taxonomy and open challenges,” Journal of Network and Computer Applications, vol. 168, no. 2, pp. 102760–102775, 2020. [Google Scholar]
2. M. H. Alsharif, J. Kim and J. H. Kim, “Green and sustainable cellular base stations: An overview and future research directions,” Energies, vol. 10, no. 5, pp. 587–607, 2017. [Google Scholar]
3. M. H. Alsharif, R. Nordin and M. Ismail, “Classification, recent advances and research challenges in energy efficient cellular networks,” Wireless Personal Communications, vol. 77, no. 2, pp. 1249–1269, 2014. [Google Scholar]
4. K. Yahya and O. Alomari, “A new maximum power point tracking algorithm based on power differentials method for thermoelectric generators,” International Journal of Energy Research, vol. 16, no. 2, pp. 760–785, 2020. [Google Scholar]
5. M. H. Alsharif, S. Kim and N. Kuruoğlu, “Energy harvesting techniques for wireless sensor networks/radio-frequency identification: A review,” Symmetry, vol. 11, no. 7, pp. 865–885, 2019. [Google Scholar]
6. M. H. Alsharif, J. Kim and J. H. Kim, “Energy optimization strategies for eco-friendly cellular base stations,” Energies, vol. 11, no. 6, pp. 1500–1520, 2018. [Google Scholar]
7. Z. Niu, “Green communication and networking: A new horizon,” IEEE Transactions on Green Communications and Networking, vol. 4, no. 3, pp. 629–630, 2020. [Google Scholar]
8. M. S. Hossain, A. Jahid, K. Z. Islam, M. H. Alsharif, K. M. Rahman et al., “Towards energy efficient load balancing for sustainable green wireless networks under optimal power supply,” IEEE Access, vol. 8, no. 2, pp. 200635–200654, 2020. [Google Scholar]
9. M. Hossain, A. Jahid, K. Islam, M. H. Alsharif and M. Rahman, “Multi-objective optimum design of hybrid renewable energy system for sustainable energy supply to a green cellular networks,” Sustainability, vol. 12, no. 9, pp. 3536–3556, 2020. [Google Scholar]
10. M. H. Alsharif, “Comparative analysis of solar-powered base stations for green mobile networks,” Energies, vol. 10, no. 8, pp. 1208–1258, 2017. [Google Scholar]
11. A. Gastli and Y. Charabi, “Solar electricity prospects in Oman using GIS-based solar radiation maps,” Renewable and Sustainable Energy Reviews, vol. 14, no. 2, pp. 790–797, 2010. [Google Scholar]
12. G. Auer, V. Giannini, C. Desset, I. Godor, P. Skillermark et al., “How much energy is needed to run a wireless network?,” IEEE Wireless Communications, vol. 18, no. 5, pp. 40–49, 2011. [Google Scholar]
13. M. H. Alsharif and J. Kim, “Optimal solar power system for remote telecommunication base stations: A case study based on the characteristics of South Korea’s solar radiation exposure,” Sustainability, vol. 8, no. 9, pp. 942–962, 2016. [Google Scholar]
14. M. H. Alsharif and J. Kim, “Hybrid off-grid SPV/WTG power system for remote cellular base stations towards green and sustainable cellular networks in South Korea,” Energies, vol. 10, no. 1, pp. 9–29, 2016. [Google Scholar]
15. M. H. Alsharif, “Optimization design and economic analysis of energy management strategy based on photovoltaic/energy storage for heterogeneous cellular networks using the HOMER model,” Solar Energy, vol. 147, no. 1, pp. 133–150, 2017. [Google Scholar]
16. M. H. Alsharif, R. Nordin and M. Ismail, “Green wireless network optimisation strategies within smart grid environments for Long Term Evolution (LTE) cellular networks in Malaysia,” Renewable Energy, vol. 85, no. 3, pp. 157–170, 2016. [Google Scholar]
 | This work is licensed under a Creative Commons Attribution 4.0 International License, which permits unrestricted use, distribution, and reproduction in any medium, provided the original work is properly cited. |