DOI:10.32604/cmc.2021.016907
| Computers, Materials & Continua DOI:10.32604/cmc.2021.016907 | |
| Article |
Brain Cancer Tumor Classification from Motion-Corrected MRI Images Using Convolutional Neural Network
1Department of Information Systems, College of Computer and Information Sciences, Princess Nourah bint Abdulrahman University, Riyadh, 11671, Saudi Arabia
2Department of Computer Science, College of Computer and Information Sciences, Princess Nourah bint Abdulrahman University, Riyadh, 11671, Saudi Arabia
3Department of Computer and Systems Engineering, Faculty of Engineering, University of Alexandria, Alexandria, Egypt
*Corresponding Author: Hanan Abdullah Mengash. Email: hamengash@pnu.edu.sa
Received: 15 January 2021; Accepted: 19 February 2021
Abstract: Detection of brain tumors in MRI images is the first step in brain cancer diagnosis. The accuracy of the diagnosis depends highly on the expertise of radiologists. Therefore, automated diagnosis of brain cancer from MRI is receiving a large amount of attention. Also, MRI tumor detection is usually followed by a biopsy (an invasive procedure), which is a medical procedure for brain tumor classification. It is of high importance to devise automated methods to aid radiologists in brain cancer tumor diagnosis without resorting to invasive procedures. Convolutional neural network (CNN) is deemed to be one of the best machine learning algorithms to achieve high-accuracy results in tumor identification and classification. In this paper, a CNN-based technique for brain tumor classification has been developed. The proposed CNN can distinguish between normal (no-cancer), astrocytoma tumors, gliomatosis cerebri tumors, and glioblastoma tumors. The implemented CNN was tested on MRI images that underwent a motion-correction procedure. The CNN was evaluated using two performance measurement procedures. The first one is a k-fold cross-validation testing method, in which we tested the dataset using
Keywords: Classification; convolutional neural network; tumor classification; MRI; deep learning; k-fold cross classification
Brain cancer is one of main causes of death globally [1]. If detected early, the progress of this disease can be controlled and fatality due to it can be prevented. Cancerous brain tumors are classified into pre-carcinoma tumors or malignant tumors [2].
Brain tumors that are classified by computerized methods usually fall into three types: gliomas, which affect brain tissues, meningiomas and pituitary, which both affect brain membranes. While meningiomas are typically benign brain tumors, pituitary tumors induce lumps inside the skull [3–6]. Clinical diagnosis can separate between these types of tumors and aid in assessing medical cases efficiently.
Other brain tumor types include astrocytoma tumors, gliomatosis cerebri tumors, and glioblastoma tumors. Those types are our concern in this research for two reasons; The first one is that they are diffused types of tumors where their classification is very difficult manually. The second is that there are very few previous researches exist that classify them using computerized methods.
The diagnosis of brain tumors is performed through magnetic resonance imaging (MRI). Although MRI is an important tool in detecting brain tumors, it is not that helpful in early detection. Early detection from MRI requires an experienced medical expert. With the new technology in image analysis and processing as well as deep learning, it is now feasible to develop a computerized identification tool for discerning brain tumors in MRI images [7]. However, MRI as a tool is not able to show whether a tumor is benign or malignant. As such, an MRI must be followed with an invasive biopsy procedure, which is in fact a brain surgery [8].
Deep learning and image analysis techniques can be useful in identifying brain tumors in MRI images. Many MRI image databases are available, such as BRATS [9,10], which is available to the public and contains around 290 MRI images with their diagnosis and tumor detection. In [11], MRI images for real patients with and without tumors are stored with their manual diagnoses.
One of the main problems with MRI image classification via CNN is how many images are in the dataset. The larger the database, the better the classification procedure, especially for the CNN classifiers with no pre-processing and when feature extraction is required.
In [12], the authors devised a classification methodology based on deep learning techniques. They classified brain tumors into normal, metastatic bronchogenic carcinoma, glioblastoma, and sarcoma tumors. The authors in [13] performed tumor classification by enhancing the region of interest and the image ring segmentation. Feature extraction was attained using histograms of intensity levels and a co-occurrence matrix.
The authors in [14] performed brain tumor classification utilizing capsule networks, which requires smaller datasets. In [15], the authors utilized the capsule-net neural network architecture for brain tumor classification from MRI images. They proved an assumption that data pre-processing plays an important part in the classification improvement. In [16], the authors proposed a CAD architecture for brain tumor classification of gliomas tumors into three grades utilizing a custom deep neural network structure. The authors in [17] presented a new method for brain tumor classifications using CNN with preprocessing and denoising based on Discrete Wavelet Transform (DWT); their method gained a high accuracy of 93.5%–96.7%.
In [18], the authors classified brain tumors by transfer learning and fine-tuning techniques for the MRI images. They achieved better accuracy and less execution time. The authors in [19] utilized a machine learning technique for classifying brain tumors through the implementation of transfer learning method. In [20], the authors presented a non-invasive technique for brain tumor grading using textural-based features. They achieved a high accuracy of 96.8%. The authors in [21] utilized a back-propagation technique to classify brain tumors through extracting statistical features. In [22], the authors used MRI-based brain tumor grading through CNN and genetic-based algorithms. They claimed that this achieved better accuracy than CNN alone. In [23], the authors utilized fast R-CNN to classify brain tumors with a high speed and an average accuracy of 97.8%. However, the smallness of the dataset was considered as a drawback of this research.
A comparison of recent research in brain tumor classification using deep learning techniques is depicted in Tab. 1.
Table 1: Recent research in brain tumor classification using deep learning techniques

In this paper, we devise and implement a CNN network for the automated classification of brain tumors. We classify these types of tumors into gliomatosis cerebri tumors, astrocytoma tumors, and glioblastoma tumors. Gliomatosis cerebri tumors have a diffusion pattern and can cause extensive growth and infect multiple brain lobes (Fig. 1). Astrocytoma brain tumors can be aggressive and can grow at a fast pace (Fig. 2). Therefore, it is very important to identify astrocytoma tumors when they first occur. Glioblastoma is a fast-growing tumor and is considered a grade IV astrocytoma (Fig. 3).

Figure 1: Gliomatosis cerebri diffusion pattern

Figure 2: MRI images showing astrocytoma brain tumor in AC–PC and sagittal planes. The tumor is outlined with a pink mark

Figure 3: Glioblastoma grade IV astrocytoma
These three types of tumors are our concern in this research because very few research efforts have tried to classify them using computerized methods.
The rest of the paper is as follows: Section 2 describes the methodology and the dataset used. Section 3 presents the validation and testing, while Section 4 discusses the experimental results. Section 5 presents the conclusions of this research.
MRI images for real patients with and without tumors were taken from the database in [11]. The dataset we used included 680 MRI images of astrocytoma tumors, 520 MRI images of gliomatosis cerebri tumors, and 700 MRI images of glioblastoma tumors. Another 680 MRI images of normal-cell brains without tumors are also included in our dataset. All images are captured in the sagittal plane and the anterior commissure–posterior commissure (AC–PC) plane, which is an axial MRI plane that is widely used. Fig. 2 presents an example of MRI images showing a brain tumor in the AC–PC and sagittal planes.
The normalization of the acquired MRI images for the dataset used in our research was necessary because they were sized differently. All MRI images were normalized into
We applied pre-processing steps to the MRI images prior to any image analysis being done. The pre-processing steps included:
• Distortion rectification: Spatial distortions, especially near the anterior frontal lobe, were eliminated through high-pass filters.
• Motion correction due to head movement during the MRI using motion compensation techniques from a set of MRIs taken at time slices via minimizing a cost mean-squared difference error function.
• Noise elimination, which was done by applying low-pass filtering that could output spatial smoothing for the MRI images.
• Spatial smoothing was also accomplished through the averaging of adjacent pixels and the removal of noises that were above the average standard deviation.
We classified brain tumors from the MRI images through deep learning by utilizing CNN. As shown in Fig. 4, the implemented CNN was comprised of: 1) an input layer; 2) several blocks (C-P blocks) that included a convolution layer followed by a pooling layer; 3) a classifier layer; and finally 4) an output layer. Each C-P block contained convolutional and pooling layers. The convolution layer converted the input image into a smaller image with the ratio of 4:1 from the input image. The convolutional layer was tailed with the pooling layer. The pooling layer utilized a max pooling strategy to reduce the image further to a quarter of the input’s size. The classifier block consisted of two fully connected layers, representing the output of the latest pooling layer (max) and the identification of the tumor class. The CNN layers and their properties are depicted in Tab. 2.
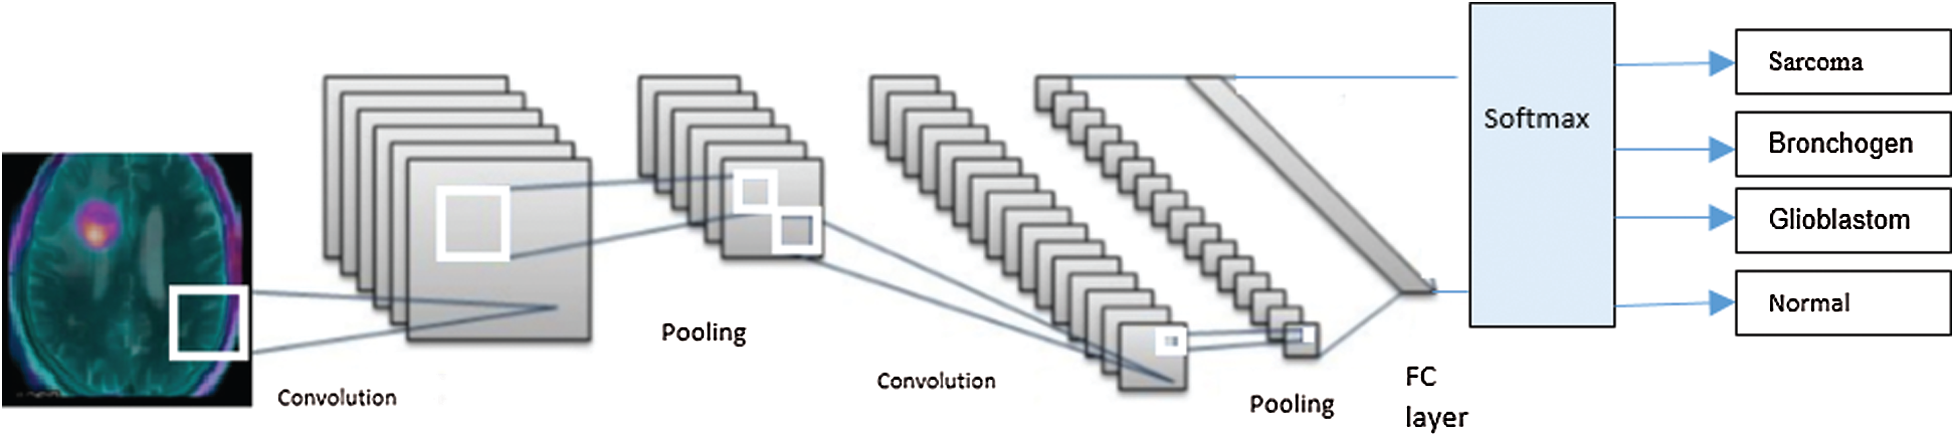
Figure 4: The CNN network, including the input layer, two convolution/pooling layers, the classification layer, and the output layer
Table 2: CNN neural network layers

We devised experimental validation using k-fold cross-validation testing and hold-out testing. We conducted the experiments on MRI images without motion correction and on motion-corrected MRI images.
In the experiments, we utilized a k-fold cross-validation to assess the performance of the implemented CNN neural network.
We divided the data into k partitions of approximately equal size (equal folds). CNN training and validation was performed in k iterations. For each iteration, one fold was utilized for testing and k-1 folds were utilized in the training phase. The accuracy was measured in every iteration, and the average accuracy over all of the iterations defined the model accuracy. To have a well-accepted accuracy, data stratification is a must. Stratification is the rearrangement of data in each fold to become an acceptable representation of the data as a whole.
The first set of experiments used MRI images without motion correction and its results are depicted in Tab. 3. The second set of experiments was performed on motion-corrected images and its results are depicted in Tab. 4.
Table 3: Cross-validation testing for MRI images without motion correction

Table 4: Cross-validation testing for MRI images with motion correction

The results of this experiment found k-fold cross-validation with
Table 5: Confusion matrix for the utilized dataset with 10-fold cross-validation for MRI images with motion correction

Hold-out testing is used to remove the over-fitting that can be seen in the k-fold testing method where the testing folds have a statistical resemblance to the training folds. The MRI data is partitioned into two not necessarily equal non-overlapping partitions. While the first partition is specifically used for training only, the second (hold-out partition) is utilized in testing and validation. The problem with hold-out validation is the over-fitting, especially if the data that is utilized in the learning model is not distributed properly. In spite of the over-fitting problem, though, this method has the advantage of taking less learning time than the k-fold cross-validation.
Therefore, we used an intermediate approach between hold-out testing and the k-fold testing. To increase the randomness of the partitions while avoiding the over-fitting problem, we divided the data into k nearly equal portions in a random fashion. This mechanism is utilized in order to examine the capability of the CNN generalization procedure in medical diagnosis [24,25]. This will aid in forecasting the brain cancer diagnosis based on the data that has no observations in the training model. Therefore, a constraint in dividing the partitions must be that no subjects in the training shall be included in the test set. We tested the hold-out method by dividing the data into two partitions, three for validation, and nine for training.
The CNN is trained using a stochastic gradient descent optimizer with data shuffling for every iteration. It finalizes the training process by tuning into one epoch. The training process will end with the start of the increase of loss. We set the regularization factor to 0.006 and the rate of the initial learning to 0.0003. Xavier initializer was used to initialize the convolutional layers’ weights [26].
We devised the testing procedure to end the training at the event that the loss was greater than the previous lowest loss for 10 consecutive iterations. The confusion matrix for the utilized dataset with hold-out test validation (for motion-corrected MRI images) is depicted in Tab. 6.
Table 6: Confusion matrix for the utilized dataset with hold-out test validation for motion-corrected MRI images

4 Experimental Results Discussion
The experimental results of the implemented CNN using k-fold cross-validation with k equal to 8, 10, 12, and 14 folds are depicted in Tabs. 3 and 4, for MRI images without motion correction and for motion-corrected MRI images, respectively. Average precision, average recall, and average F1-score are displayed, which helped overcome the classes’ imbalance of the number of tumors in the dataset.
Instances of tumors classified from the used dataset via 10-fold cross-validation testing are displayed in Fig. 5. (The tumors are marked in pink outlines.)
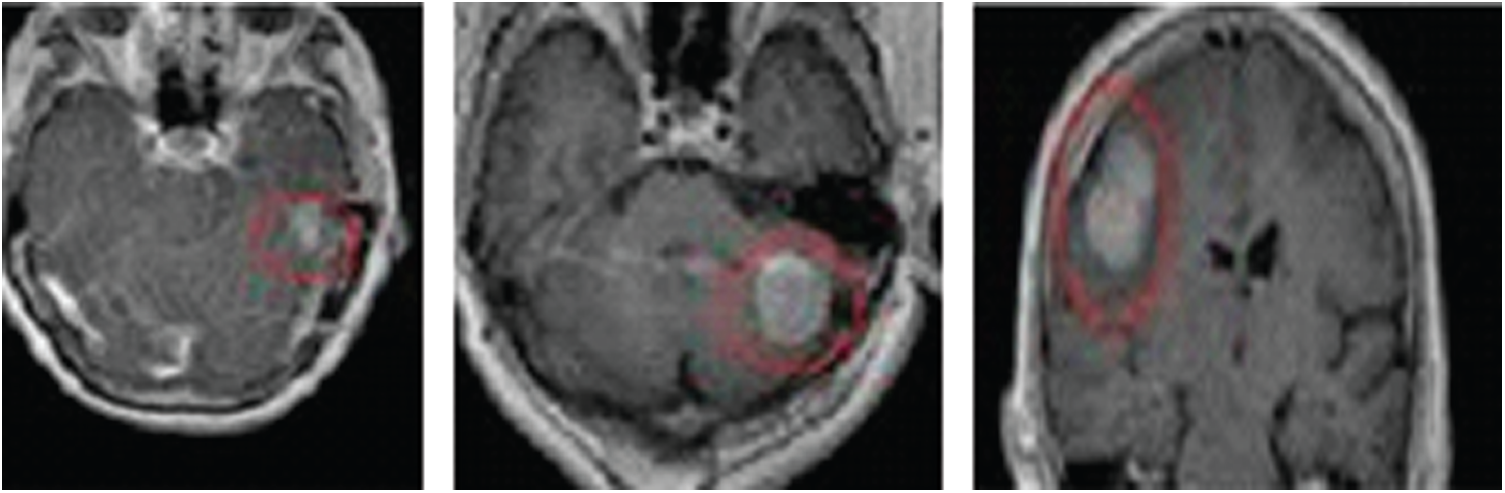
Figure 5: Instances of classified tumors from the used dataset using 10-fold cross-validation testing
A classifier is usually evaluated by measuring its accuracy, sensitivity, and specificity. Eqs. (1)–(3) are the metrics to measure the accuracy, sensitivity, and specificity of this classifier, respectively. The classifier attains 97.5% average accuracy, 99.44% average sensitivity, and 97.15% average specificity over 20 runs. These numbers are for the dataset of motion-corrected MRI images.
where TP (true positives) is the number of correctly predicted positive cases, TN (true negatives) is the number of correctly predicted negative cases, FP (false positives) is the number of incorrectly predicted positive cases, and FN (false negatives) is the number of incorrectly predicted negative cases. The accuracy of a classifier is the percentage of correctly predicted cases among the test set, the sensitivity is the rate of true positives, and the specificity is the rate of true negatives.
Two figures show our experimental results:
• Fig. 6 shows the distribution of the different cases. The total number of cases and the numbers of normal and cancerous cases are plotted. In addition, the output of our proposed CNN is presented, showing the different types of brain cancer cases in the testing set.
• Fig. 7 shows the accuracy, sensitivity, and specificity of five runs of the classifier. It also shows the average accuracy, sensitivity, and specificity of 20 runs of the classifier, each with a different set of input data and a different set of tested data.
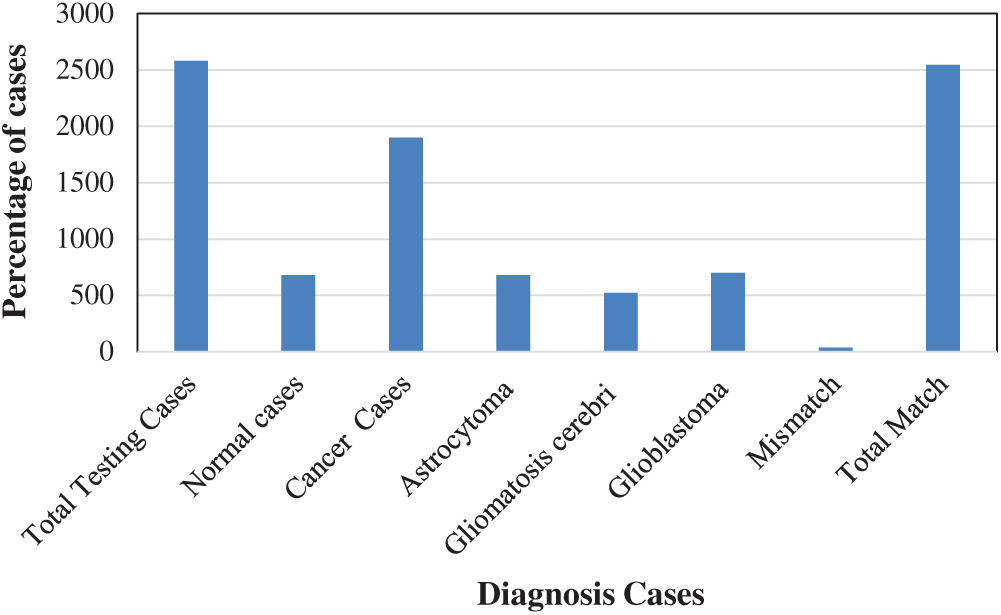
Figure 6: Percentage of patient cases using 10-fold cross-validation
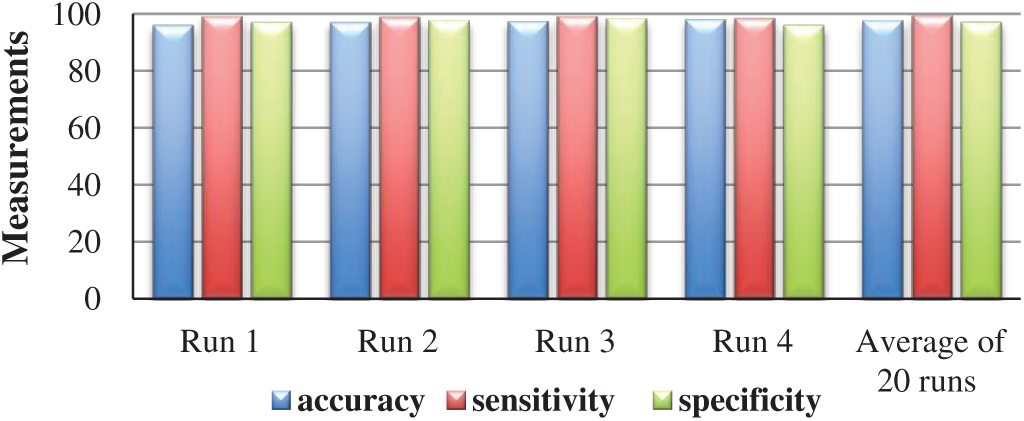
Figure 7: The accuracy, sensitivity, and specificity of 4 different runs and the average accuracy, average sensitivity, and average specificity of 20 runs
Several researchers have used the database in [11] to classify brain tumors using CNN technique. The CNN architectures that used MRI images with motion correction as input for classification were compared to our proposed architecture using k-fold cross-validation, as shown in Tab. 7.
Table 7: Comparison of the results of the CNN, which used motion-corrected MRI images as input for classification, and our proposed architecture using k-fold cross-validation

Improvement of the quality of the utilized visual feature is very essential to produce better classification results that can lead to augmenting the tumor region.
The performance of our proposed algorithm can be enhanced using clustering techniques as a preprocessing stage; K-means and C-means algorithms might be very helpful [27]. Both algorithms are unsupervised clustering algorithm that will lead to better segmentation of regions of interest which will lead to better classification. Also, Sparse coding can be combined to enhance the classification performance of our model especially that we have datasets with labeled images. Sparse coding can lead to better discriminative classifier.
Another aspect that may hinder the performance is that MRI images are vulnerable to noise, so more complicated inhomogeneity correction should be applied. Also, more advanced motion correction algorithms can enhance the performance especially for pediatric patients. Other limitation that hindered our experiments is the unavailability of larger datasets.
In this paper, we demonstrated the importance of automated methodology for brain cancer tumor diagnosis. We developed and implemented a CNN for brain tumor classification. The proposed CNN can distinguish between normal (no-cancer), astrocytoma tumors, gliomatosis cerebri tumors, and glioblastoma tumors. We chose these types of aggressive cancerous classifications in order to shed light on the need to automatically diagnose them.
The implemented CNN utilized motion-corrected MRI images and was evaluated using two performance measurement procedures. The first one is a k-fold cross-validation testing method, using
In future extension of the work, the proposed methodology can be extended for other brain tumor classification such as gliomas and pituitary. The diagnosis of other brain tumors types can lead to detect other brain abnormalities.
Other contribution that can stem from our proposed system is to participate effectively in the early diagnosis of other types of cancers such as breast and lung cancers that can benefit from our classification scheme, especially for cancers with high mortality rate. We can extend our approach in other image classification of diseases especially with the problematic accessibility of large image datasets.
Also, the practicality of the proposed method can be utilized in devising an automated diagnostic tool that can help in tumor classification at an early stage. The motion correction aspect of our methodology can be incorporated in a pediatric diagnostic tool to compensate for head motion of small children.
Funding Statement: The authors extend their appreciation to the Deputyship for Research & Innovation, Ministry of Education in Saudi Arabia for funding this research work through the project Number PNU-DRI-RI-20-029.
Conflicts of Interest: The authors declare that they have no conflicts of interest to report regarding the present study.
1. World Health Organization, “Cancer,” 2018. [Online]. Available: https://www.who.int/news-room/fact-sheets/detail/cancer (Accessed on 5 November 2019). [Google Scholar]
2. V. V. Priya, “An efficient segmentation approach for brain tumor detection in MRI,” Indian Journal of Science and Technology, vol. 9, no. 19, pp. 1–6, 2016. [Google Scholar]
3. Cancer Treatments Centers of America, “Brain cancer types,” 2020. [Online]. Available: https://www.cancercenter.com/cancer-types/brain-cancer/types (Accessed on 30 November 2019). [Google Scholar]
4. American Association of Neurological Surgeons, “Classification of brain tumours,” 2020. [Online]. Available: https://www.aans.org/en/Media/Classifications-of-Brain-Tumors (Accessed on 30 November 2019). [Google Scholar]
5. L. M. DeAngelis, “Brain tumors,” New England Journal of Medicine, vol. 344, no. 1, pp. 114–123, 2001. [Google Scholar]
6. D. N. Louis, A. Perry, G. Reifenberger, A. Von Deimling, M. Figarella-Branger et al., “The 2016 world health organization classification of tumors of the central nervous system: A summary,” Acta Neuropathologica, vol. 131, no. 6, pp. 803–820, 2016. [Google Scholar]
7. P. Afshar, K. N. Plataniotis and A. Mohammadi, “Capsule networks for brain tumor classification based on MRI images and coarse tumor boundaries,” in Proc. of the IEEE Int. Conf. on Acoustics, Speech and Signal Processing, Brighton, UK, pp. 1368–1372, 2019. [Google Scholar]
8. J. Byrne, R. Dwivedi and D. Minks, “Tumours of the brain,” in Recommendations Cross Sectional Imaging Cancer Management, 2nd ed. London, UK: Royal College of Radiologists, pp. 1–20, 2014. [Google Scholar]
9. Center for Biomedical Image Computing & Analytics (CBICA“Brain tumor segmentation (BraTS) challenge 2020: Scope,” 2020. [Online]. Available: http://braintumorsegmentation.org/ (Accessed on 5 November 2019). [Google Scholar]
10. Spyridon (Spyros) Bakas, “Brats MICCAI Brain tumor dataset,” IEEE Dataport, 2020. [Online]. Available: https://ieee-dataport.org/competitions/brats-miccai-brain-tumor-dataset (Accessed on 5 November 2019). [Google Scholar]
11. J. Cheng, “Brain Tumor Dataset,” 2017. [Online]. Available: https://doi.org/10.6084/m9.figshare.1512427.v5 (Accessed on 10 September 2019). [Google Scholar]
12. S. Vijh, S. Sharma and P. Gaurav, “Brain tumor segmentation using OTSU embedded adaptive particle swarm optimization method and convolutional neural network,” in Data Visualization and Knowledge Engineering, vol. 32. Cham: Springer, pp. 171–194, 2019. [Google Scholar]
13. J. Cheng, W. Huang, S. Cao, R. Yang, W. Yang et al., “Enhanced performance of brain tumor classification via tumor region augmentation and partition,” PLoS ONE, vol. 10, no. 10, pp. 1–13, 2015. [Google Scholar]
14. P. Afshar, A. Mohammadi and K. N. Plataniotis, “Brain tumor type classification via capsule networks,” in Proc. of the 25th IEEE Int. Conf. on Image Processing, Athens, Greece, pp. 3129–3133, 2018. [Google Scholar]
15. R. V. Kurup, V. Sowmya and K. P. Soman, “Effect of data pre-processing on brain tumor classification using capsulenet,” in Int. Conf. on Intelligent Computing and Communication Technologies, Berlin, Heidelberg, Germany: Springer Science and Business Media LLC, pp. 110–119, 2019. [Google Scholar]
16. H. H. Sultan, N. Salem and W. Al-Atabany, “Multi-classification of brain tumor images using deep neural network,” IEEE Access, vol. 7, pp. 69215–69225, 2019. [Google Scholar]
17. H. Kutlu and E. Avci, “A novel method for classifying liver and brain tumors using convolutional neural networks, discrete wavelet transform and long short-term memory networks,” Sensors, vol. 19, pp. 9, 2019. [Google Scholar]
18. Z. N. K. Swati, Q. Zhao, M. Kabir, F. Ali, Z. Ali et al., “Brain tumor classification for MR images using transfer learning and fine-tuning,” Computerized Medical Imaging and Graphics, vol. 75, pp. 34–46, 2019. [Google Scholar]
19. A. Rehman, S. Naz, M. I. Razzak, F. Akram and I. A. Razzak, “Deep learning-based framework for automatic brain tumors classification using transfer learning,” Circuits Systems and Signal Processing, vol. 39, no. 8, pp. 757–775, 2019. [Google Scholar]
20. P. C. Tripathi and S. Bag, “Non-invasively grading of brain tumor through noise robust textural and intensity based features,” in Computational Intelligence in Pattern Recognition, Berlin, Heidelberg, Germany: Springer Science and Business Media LLC, pp. 531–539, 2019. [Google Scholar]
21. M. Ismael and I. Abdel-Qader, “Brain tumor classification via statistical features and back-propagation neural network,” in Proc. of the 2018 IEEE Int. Conf. on Electro/Information Technology, Rochester, MI, USA, pp. 252–257, 2018. [Google Scholar]
22. A. K. Anaraki, M. Ayati and F. Kazemi, “Magnetic resonance imaging-based brain tumor grades classification and grading via convolutional neural networks and genetic algorithms,” Biocybernetics and Biomedical Engineering, vol. 39, no. 1, pp. 63–74, 2019. [Google Scholar]
23. H. Kaldera, S. R. Gunasekara and M. B. Dissanayake, “Brain tumor classification and segmentation using faster R-CNN,” in Proc. of the 2019 Advances in Science and Engineering Technology Int. Conf., Dubai, UAE, pp. 1–6, 2019. [Google Scholar]
24. T. T. Wong, “Performance evaluation of classification algorithms by k-fold and leave-one-out cross validation,” Pattern Recognition, vol. 48, no. 9, pp. 2839–2846, 2015. [Google Scholar]
25. T. T. Wong and P. Yeh, “Reliable accuracy estimates from k-fold cross validation,” IEEE Transactions on Knowledge and Data Engineering, vol. 32, no. 8, pp. 1586–1594, 2020. [Google Scholar]
26. M. Sajjad, S. Khan, K. Muhammad, W. Wu, A. Ullah et al., “Multi-grade brain tumor classification using deep CNN with extensive data augmentation,” Journal of Computational Science, vol. 30, pp. 174–182, 2019. [Google Scholar]
27. M. Hung and D. Yang, “An efficient Fuzzy C-means clustering algorithm,” in Proc. of the 2001 IEEE Int. Conf. on Data Mining, San Jose, CA, USA, pp. 225–232, 2001. [Google Scholar]
 | This work is licensed under a Creative Commons Attribution 4.0 International License, which permits unrestricted use, distribution, and reproduction in any medium, provided the original work is properly cited. |