DOI:10.32604/cmc.2021.017433
| Computers, Materials & Continua DOI:10.32604/cmc.2021.017433 | |
| Article |
A Novel Technique for Early Detection of COVID-19
1Department of Management Information Systems, Faculty of Economics and Administration, King Abdulaziz University, Jeddah, 21589, Saudi Arabia
2Faculty of Computer and Information Systems, Islamic University of Madinah, Al Medina, Saudi Arabia
*Corresponding Author: Mohammad Yamin. Email: myamin@kau.edu.sa
Received: 21 January 2021; Accepted: 26 February 2021
Abstract: COVID-19 is a global pandemic disease, which results from a dangerous coronavirus attack, and spreads aggressively through close contacts with infected people and artifacts. So far, there is not any prescribed line of treatment for COVID-19 patients. Measures to control the disease are very limited, partly due to the lack of knowledge about technologies which could be effectively used for early detection and control the disease. Early detection of positive cases is critical in preventing further spread, achieving the herd immunity, and saving lives. Unfortunately, so far we do not have effective toolkits to diagnose very early detection of the disease. Recent research findings have suggested that radiology images, such as X-rays, contain significant information to detect the presence of COVID-19 virus in early stages. However, to detect the presence of the disease in in very early stages from the X-ray images by the naked eye is not possible. Artificial Intelligence (AI) techniques, machine learning in particular, are known to be very helpful in accurately diagnosing many diseases from radiology images. This paper proposes an automatic technique to classify COVID-19 patients from their computerized tomography (CT) scan images. The technique is known as Advanced Inception based Recurrent Residual Convolution Neural Network (AIRRCNN), which uses machine learning techniques for classifying data. We focus on the Advanced Inception based Recurrent Residual Convolution Neural Network, because we do not find it being used in the literature. Also, we conduct principal component analysis, which is used for dimensional deduction. Experimental results of our method have demonstrated an accuracy of about 99%, which is regarded to be very efficient.
Keywords: COVID-19; classification; feature selection; dimensionality reduction; chest CT; deep learning; deep convolutional neural network; AIRRCNN
Over the decades, the issue of virus categorization has always been a concern for epidemiologists and virologists. COVID-19, the disease resulting from SARS-CoV-2, known simply as coronavirus, was first registered on 31st December 2019 in Wuhan province of China, and, in March 2020 [1], was declared as a global pandemic by the World Health Organisation (WHO). Coronavirus is a descendent of a family of viruses which can cause severe respiratory problems to humans. These viruses can induce fatal infections, and choke some of them to death. Similar viruses which have affected human being in many countries in recent years are Middle East Respiratory Syndrome (MERS) and Severe Acute Respiratory Syndrome (SARS) [2]. Corona virus is one the deadliest descendent from the family of respiratory tract viruses as it has ability to transmit from animals to humans and then spread from human to human rapidly [3]. During the first thirteen months, coronavirus has infected more than one hundred million people, causing over two million deaths [4]. To add to the misery, there is no known medicine to treat this virus effectively.
Unfortunately, a new variant of corona virus has now spread to dozens of countries, which is considered to be more aggressive, and, unlike the corona virus, is spreading in the younger generation as well. To fight and eradicate the coronavirus, several vaccines have been approved for emergency use. In fact, millions of people have already taken up these vaccinations. There are claims and counterclaims on the effectiveness of the vaccines for prevention of new strain of the virus. A report from Nature [5] says “The world is cautiously waiting for credible reports on short and long term impact and effects these vaccinations.”
For several years computed tomography (CT) scans, also known as computerized axial tomography (CAT) scans, have been assisting physicians in their diagnosis of different strains of coronavirus [6,7]. The rapid growth of coronavirus has created shortage of physicians and radiologists. Thus it is critical to balance this widening gap by developing automatic methods for detection of the virus. Disease prognosis from CT scans is a complex and challenging task. Its complexity is increased if the patient lungs have inflammation, requiring manual visualization, which is prone to errors. Some researchers have used Machine Learning (ML) techniques to detect coronavirus from the CT scan images of patients’ chests. The study in [8] has used Logistic Regression (LR) for classifying coronavirus from clinical laboratory features. Some researchers [9,10] have used Random Forest (RF) classifier for coronavirus classification from handcrafted features. Deep Learning Techniques (DLT) have also been proposed in diagnosing corona. Features of CT images were represented by using DLT in [11], which were then classified using decision trees, and Ada Boost (AB) based on DLT’s learning. The study in [12] has mapped CT scans to a label space using an end-to-end network for classifying coronavirus.
In this paper we propose to use Advanced Inception based Recurrent Residual Convolution Neural Network (AIRRCNN) for classifying coronavirus from the CT scan images by pre-processing patients’ images. This method uses multitude ML techniques for efficient classification of coronavirus. We shall also demonstrate the effectiveness of the proposed method.
AI techniques provide us a method of early detection of virus, and hence contribute to saving precious lives, and further spread of the virus [13]. Usage of AI and data analytical tools in early prediction create challenges for researchers [14]. Virus spread is also checked by observing social distancing [15]. There are many software startups for addressing problems of pandemic outbreaks in countries like Canada, Australia, the USA, and some European countries. In all developments and implementations, use of the AI is central in COVID-19 pandemic [16]. As we know, AI is the enabler field in developing robotic solutions, natural language processing, sensory solutions, expert solution systems, decision making tools, traffic management. Due to this extraordinary features, the AI methods are preferred in technological solutions. This includes business development, which receive many innovations due to the AI applications [17].
Unfortunately, major companies have still not invested into corona prediction related tools with AI techniques. To fill the gap, this article contributes to designing methods for detecting coronavirus automatically by Recurrent Residual CNN Algorithm, which uses AI, whose details follow.
1. First the input images are processed using multiple feature selection techniques.
2. Then the advanced recurrent based CNN is applied for detecting the infection in the X-ray images.
3. After that, recurrent operation is performed using kernels in each convolution layers.
The kernel evolution makes more accurate prediction and classification of infected images.
In Section 2, we provide literature review on detecting the diseases using X-ray images and neural networks. In Section 3, we define our research problem, in Section 4, we provide research methodology and experiments. Section 5 provides evaluation results, and the conclusions are recorded in Section 6.
This section describes studies on the theme of coronavirus identification. Convolutional Neural Networks (CNN) has been used in automating identification of coronavirus features for pathogenic classification by [18]. Their results showed an accuracy of 83% when applied on a dataset of above 200 cases. Another research [19] has proposed an automated framework where CNN extracted coronavirus features differentiate with those of the pneumonia. Their overall accuracy showed 96% in a dataset with 400 CT scan images. The model proposed in [12] is also useful to identify influenza-A viral pneumonia from CTs of healthy lungs with an overall demonstrated accuracy of 87% in a dataset of 618 images. A dataset of 272 images mixed with pneumonia, corona and healthy lung images was used by [20]. Their model classified coronavirus and pneumonia infections with 95% accuracy.
Coronavirus diagnostic tool using DLT was proposed in [21] where UNet pre-trained and created 3D segments from CT lung areas. DNN was then used to detect coronavirus from the segmented 3D images. Working on 499 images, the tool identified Weak Labels and achieved an ROC value of 0.959 with a Precision-Recall value of 0.976 on curves. The study in [22] investigated CTs for corona using DLTs. The tool’s objective was to expedite clinical investigations of coronavirus, which demonstrated an accuracy of 89.5%, 0.88 specificity and 0.87 sensitivity when validated. When the AI and ML techniques are combined to analyse radiographic images, the results can be very efficient and accurate for coronavirus identification [23].
Authors in [24] have developed a tool with AI capabilities which may be used to predict patients at risk for more severe cases of COVID-19 on initial presentation. The predictive model is said to have achieved 70% to 80% on prediction of cases. Research in [25] has identified seven significant applications of AI for COVID-19 pandemic. Study in [26] discusses the importance of CT scan and X-ray images to detect coronavirus in early stages, and propose an automatic diagnosis system for the purpose. Different experiments have returned accuracy levels between 95 and 98.2 percent.
Authors in [27] have analysed the achievements for medical image recognition of the state-of-the-art neural networking architectures, and have proposed a model for the purpose. Their model is said to have achieved 96.73% accuracy. In [28], the authors have provided two techniques, namely Support Vector Machine, and Conventional Neural Networks, with accuracies on chest X-rays of 84% and 75%, respectively. Research in [29] have proposed a coronavirus detection method at an early stage by using artificial neural network (ANN), and support vector machine (SVM). The method is claimed to have an accuracy of 98.2 percent in experiments.
Although many proposals have been offered for early detection of the virus by means of the ML techniques, their implementations is yet to be benchmarked for reliability and complexities in detecting the coronavirus. Our research in this paper attempts to find gaps in benchmarking of coronavirus identifications. We shall provide an automated model for diagnosing coronavirus from the CTs.
Within six months of recording incidence of coronavirus in China’s Wuhan [30], there was a crunch for hospital beds and ambulances. Healthcare management could not handle the growing number of cases. Even the social distancing, mask wearing, and regular sanitization couldn’t arrest the virus spread, mainly due to delayed action plan. Many patients as well as healthcare workers lost their lives due to a range of reasons (shortage of drugs, oxygen, and hospital beds). Fig. 1 shows the spread of virus in under different conditions, which indeed was maximum without protective measures.
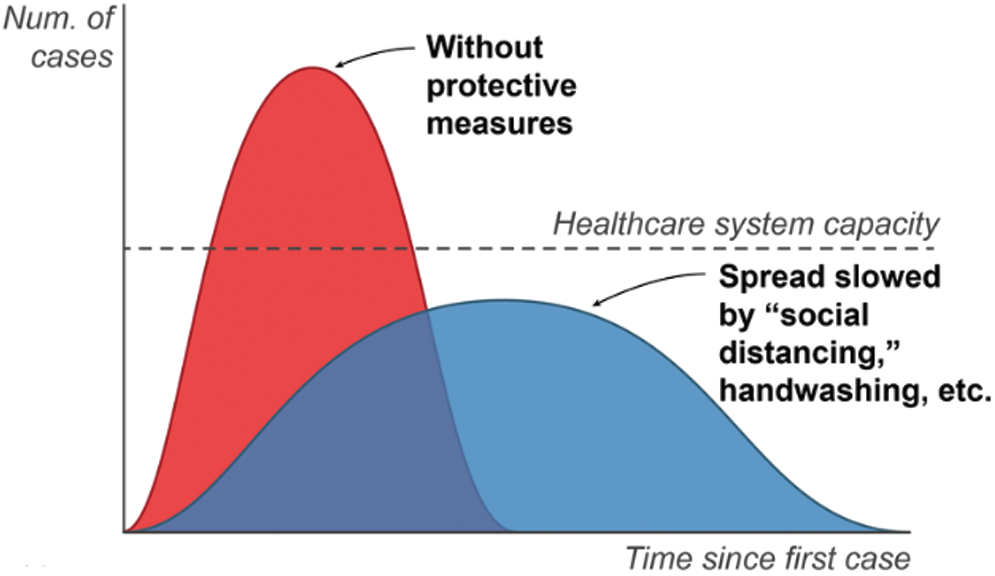
Figure 1: Graphical representation of coronavirus treatment
Coronavirus outbreak and its subsequent spreads can also be approximated with a mathematical model using four parameters.
• Fundamental reproductive number (No) for representing new infection from the infected
• Fatality rate (Fr) for representing people who die with symptoms
• Incubation period (p) for representing duration time between infection and symptoms
• Duration of the disease (x) for representing recovery or death
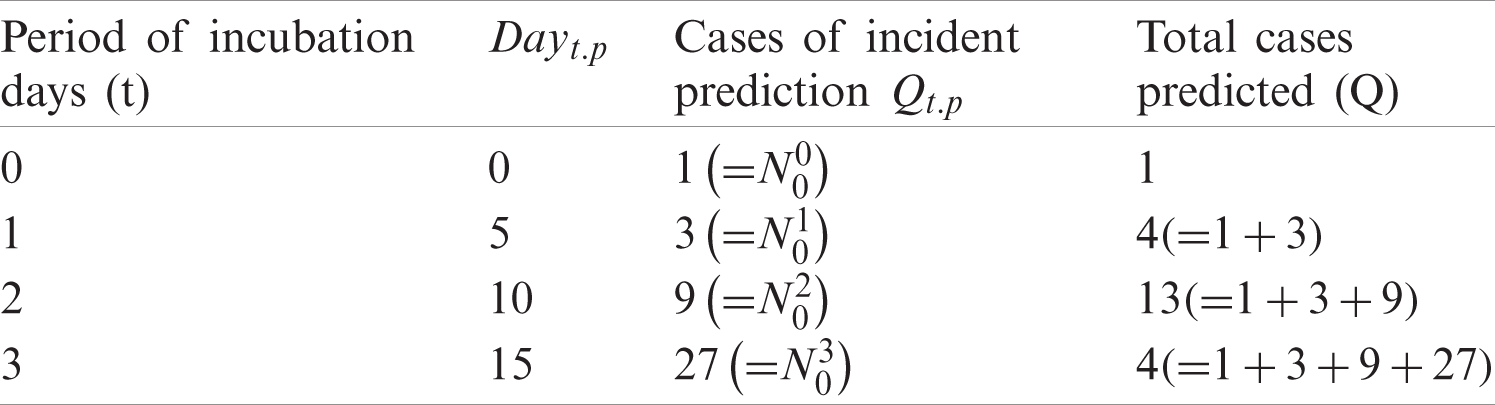
Corona cases can be predicted using (No), the number of infected people to be infected by an infected person, (p), the number of infected personsAssume that one
In (1), Q represents the number of predicted cases, Qt.p number of incidences on dayt.p, and t as the time of incubation period. Tab. 1 provides results from computations of Eq. (1) when applied with No = 3, and
Table 1: Predicted corona deaths with No = 3 and p = 5 (days)
To predict coronavirus related fatalities, let us assume that after value of x, the affected people are either dead or recovered then Fr, the percentage of deaths, 1 − Fr, the percentage of recovery, and dayt.p+x, the number of deaths in a Day. Then deaths can be predicted using Eqs. (2) and (3).
In Eqs. (2) and (3), Mt.p+x represents number of deaths predicted in the dayt.p+x, M the total number of predicted deaths, and t the time of incubation needed. Tab. 2 lists values computed by using Eqs. (2) and (3), with No = 3, p = 5 days, Fr = 10 and x = 14.
Table 2: COVID-19 death prediction
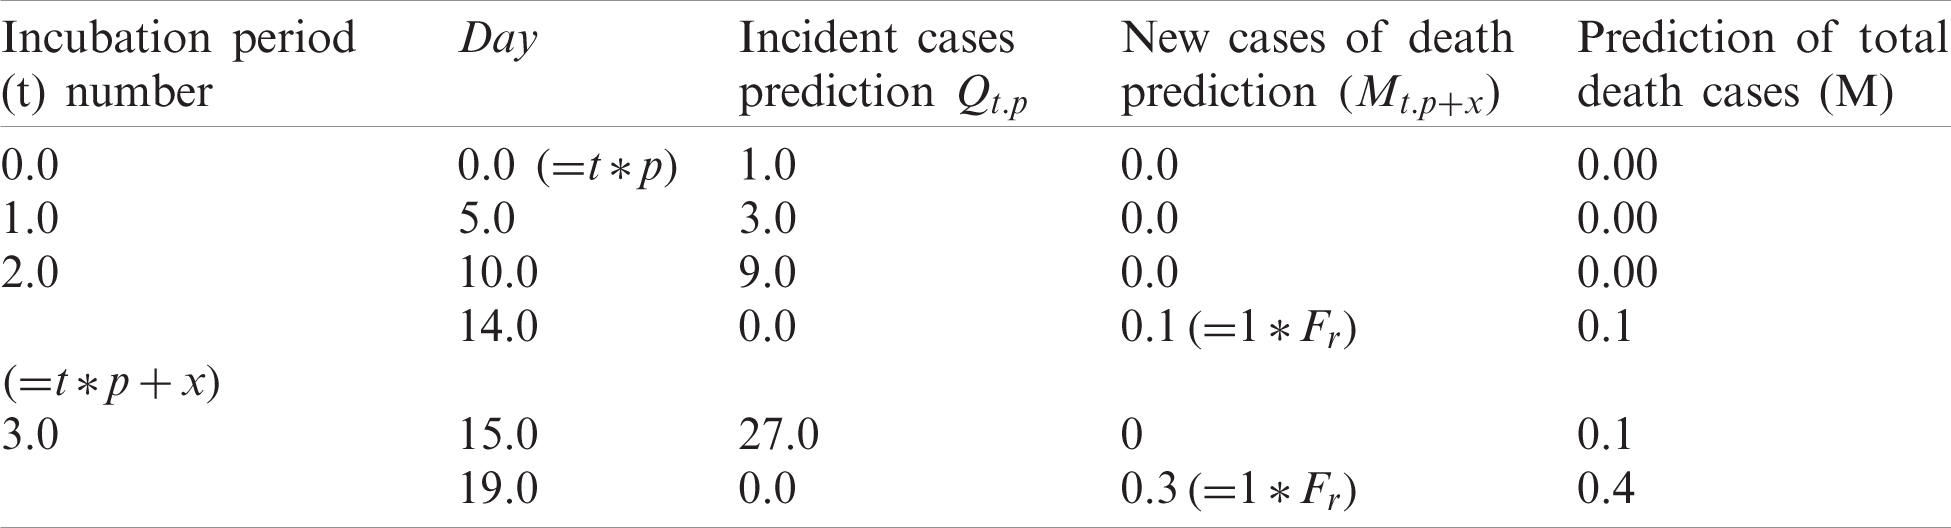
Tab. 2 can be interpreted as follows. Day 0 cases are eliminated after 15 days. Day 0’s 1 case would lead to 0.10 deaths (
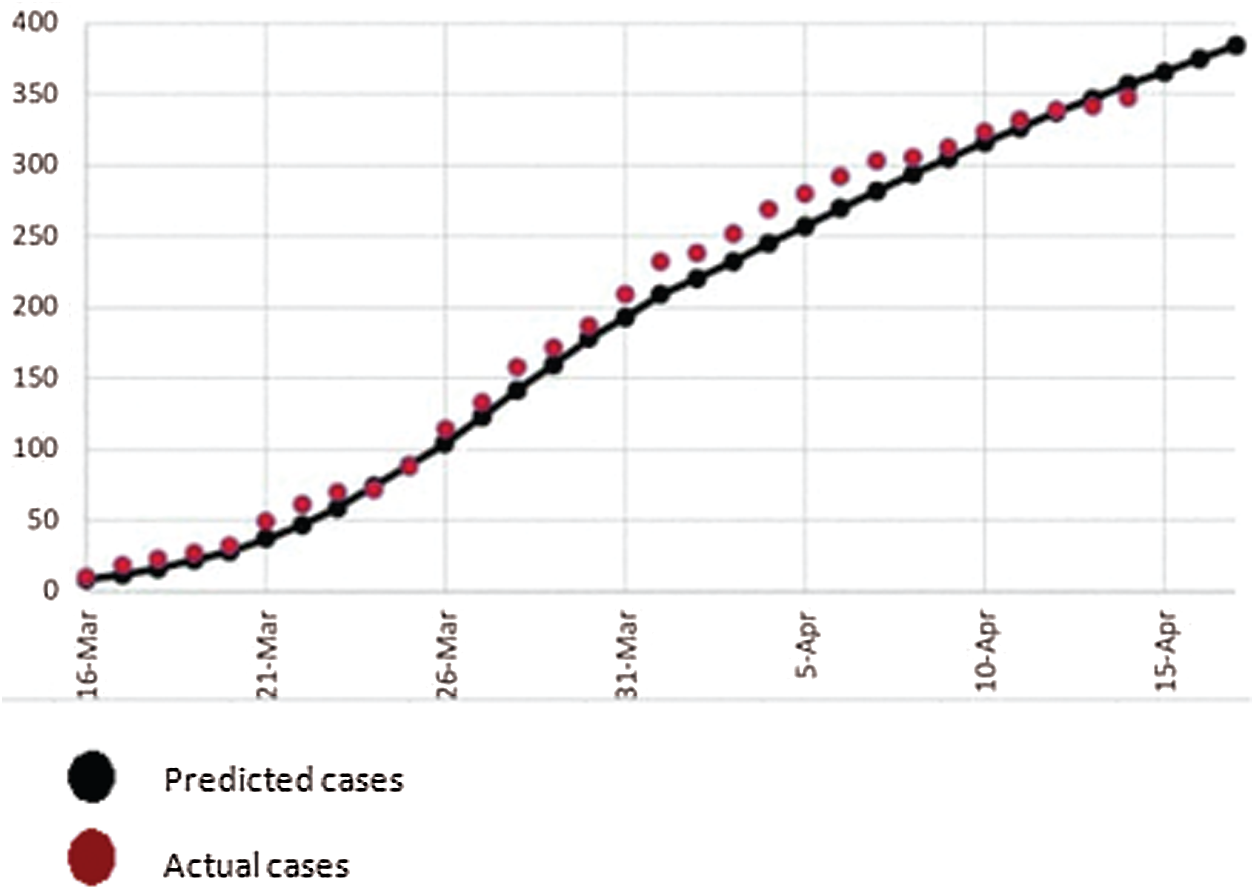
Figure 2: Actual COVID-19 cases vs. predicted cases
We also know that all patients may not be correctly predicted due to technical error. Indeed it is necessary to predict accurately. If we mistakenly leave any COVID-19 patients out, not only they might suffer but also cause the suffering and deaths to others. So, the role of technological development in accurate prediction is very important in the diagnosing the coronavirus.
4 Research Methodology and Experiments
Here we shall present and describe main contributions of our research in this paper. The flow of the research in this paper is shown in Fig. 3. The research flow begins with input X-ray, which is pre-processed with fuzzy and dimensionality reduction. Then the data is fed to recurrent based artificial neural network for prediction.
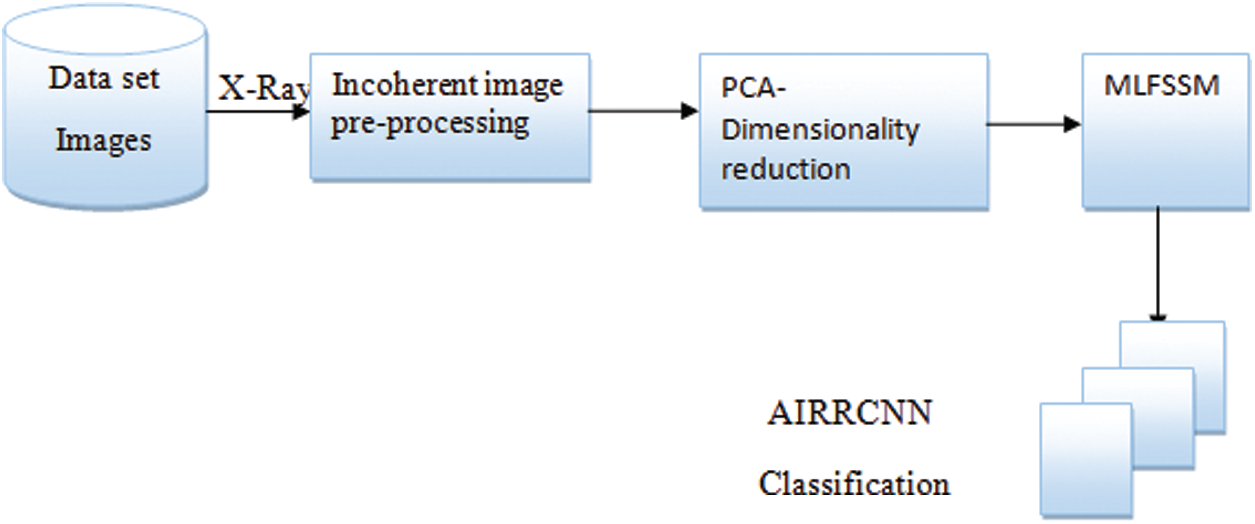
Figure 3: Architectural overview
4.1 Fuzzy Based Pre-Processing and Stacking
Incoherent Color (IC) algorithms play a significant role in image analysis as for accurate conceptual incoherence. The outcomes are completely based on similarity/difference functions used for separating colours and degree of uncertainty. In these techniques, input images are treated as three colours namely red, green, and blue (RGB) and single variable as an output. The inputs and outputs are produced based on training data [31]. An IC technique separates the original records into blurred windows where each image pixel has a degree of membership calculated in the window based on the distance between the pixel and the window. In the final output, weights of each window images are blurred. Images are totaled and an image output generated with respect to average values is considered for membership degree [32]. This work has used Python to recreate the original using IC technique [33]. Fig. 4 shows the sample structure of the pre-processing step of the input data image. The output of Pixel level, obtained after eliminating color intensity, is stacked, with the help of an image processing technique by combining different focal distances with the original image. Noise is eliminated by improving image quality using stacking. Two of the images, which have minimum noise level out of the pre-processed images, are compared with the original image in the same row (2nd row of the inputted image). At last, the inputted image is divided into two images as background and overlay image, where the former is processed and the latter is overlaid. After theses settings, parameter, contrast, opacity, brightness, and combined ratio of the two images are compared. The accuracies in the ratios result in accurate reduction of noises [34]. The final output is high quality image.

Figure 4: Structure of pre-processing process
4.2 Principle Component Analysis Based Dimensionality Reduction
Ay image processing technique processes a large number of pixels or high dimensional data. Dimensionality reduction helps in processing important image features in a short span of time. Our method uses doc2vec technique for feature generation, where the Principle Component Analysis (PCA) reduces image features (Dimensionality Reduction) [35]. The PCA reduces dimensionality linearly, and extracts only dominant features. This results in a lower-dimensional representation of the image with maximum variance.
4.2.1 Feature Selection Based on Multilayered Feature Subset Selection Technique
Assuming a dataset X of size (
In Eq. (4), ftl, m describes l
In (5), each subset
Eq. (3) indicates the probabilities of features have equality in selecting the 1st layer. Revising weight in feature promotes higher weights to be selected in more subsets. The multiple layers help in achieving higher performance, and computational time also increases proportionally. Terminating the algorithm is based on rate of accuracy in the topmost feature T reaching 100% else the layers still be reaching L’s value. This research has considered values of 20 for T and L for a trade off in running time and stability. The MLFSST algorithm can be found in [20]. Here, we provide its modified version for our use.


In the selection process, features are sorted to the identical weights, based on which subsets are picked up to generate diverse combinations. Classifiers work on each subset showing accuracy of the model. Weights are increased for better performance, when selected into many subsets in a layer. This recalculation of feature weights results in new subsets. This recursive process goes on until terminal conditions are met. From the resulting process, subset with the highest classification accuracy is the final output.
4.3 Classifying COVID Data Using AIRRCNN
This research proposes AIRRCNN for improving classification accuracy in coronavirus detection. The proposed model uses fewer parameters in its computations when compared to other Deep Learning Techniques (DLTs). Residual units in this model use network of Inception-v4 described in [36]. It is a form of DLT that combines convolution operation output with different sized kernels, and improves overall accuracy of recognitions. The architecture of AIRRCNN is shown in Fig. 5, which shows that the architecture has more convolution layers, transition block, and IRRCNN blocks with output layer of softmax.

Figure 5: AIRRCNN architecture
Significant in the architecture is the use of IRRCNN block with its inception units, RCLs and residual units. RCLs are applied on inputs from layer passing via inception sections. The output of inception sections is added to IRRCNN input block. Recurrent operation in convolution section is operated by inception unit with different sized kernels. Present time of a step is added to outputs in this recursive operation which is again inputted into the layer. For
In Eq. (7),
The function f is stated as a standard Rectified Linear Unit (ReLU) for the purpose of activation. The proposed model’s performance was also explored with activation of function, with Exponential Linear Unit (ELU). Inception unit outputs y for the various kernel size and average layer of pooling can be defined as y1x1(x), y3x3(x), and
In Eq. (9),
In Eq. (10), xl+1 inputs for next immediate transition block, xl input samples of AIRRCNN block, wl kernel weights of lth AIRRCNN block, and
The implementation of the model in this work used a
In this section, we provide details the applications of the proposed techniques MLFSST (feature selection) and AIRRCNN (classification) on COVID_CT dataset [39,40], with necessary figures and tables. The database is an internet based dataset with CTs of patients. The dataset includes a wide range of corona samples with MERS, ARDS, and SARS mixed in the samples. Experiments were conducted on fifty images, twenty five of them being normal, and the other twenty five corona positive. The resolution of images ranged between 700 and 3342 pxi. The techniques were evaluated using the performance measures of error, accuracy, precision, sensitivity, and F-measure. Fig. 6 depicts a snap of two shot of the Dataset used.

Figure 6: Dataset sample
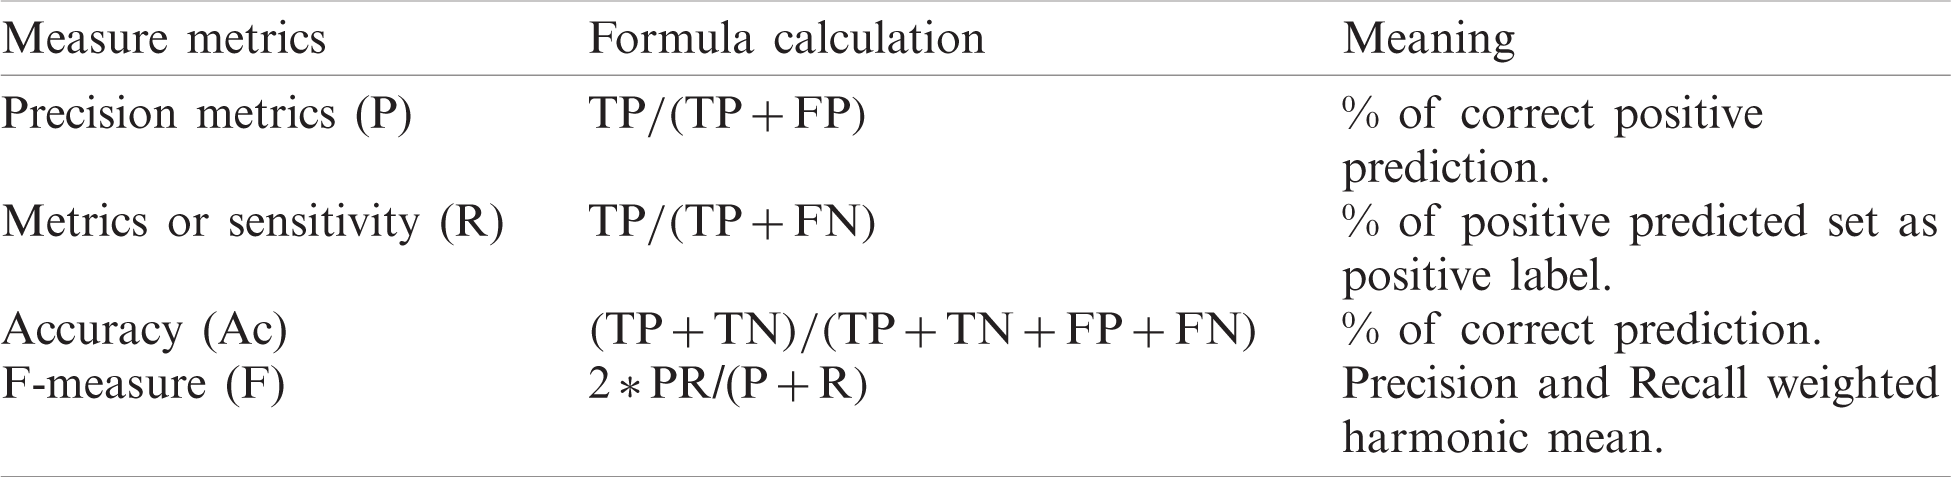
Tab. 3 evaluates the confusion matrices and summarization in the lists [41]. Formula for confusion matrices is provided in Tab. 4 [42].
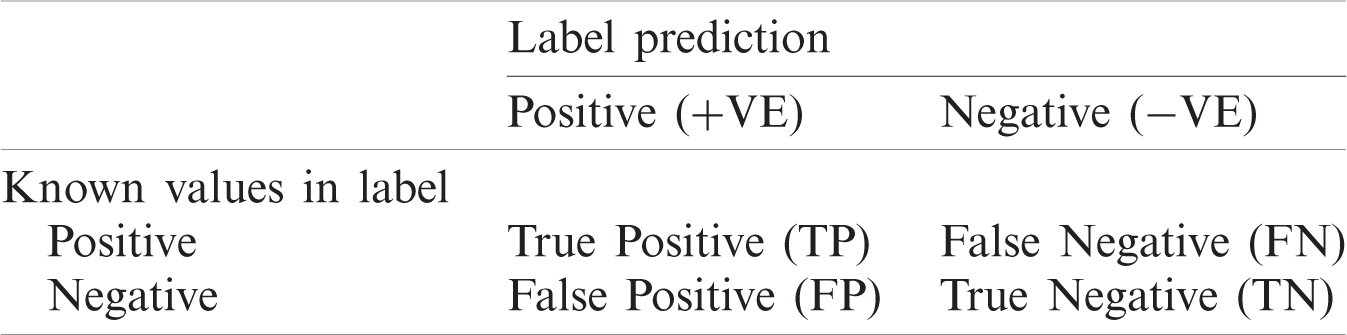
Table 4: Formulas for confusion matrix
Comparative performances of Classifiers for detecting corona from CTs images is listed in Tab. 5, which also includes the criteria of Time consumption for costs. Now we draw bar charts using the data from Tab. 5, and compare the performance metrics of the proposed AIRRCNN technique with the other techniques.
Table 5: Comparative performances of classifier in corona detection from CT images
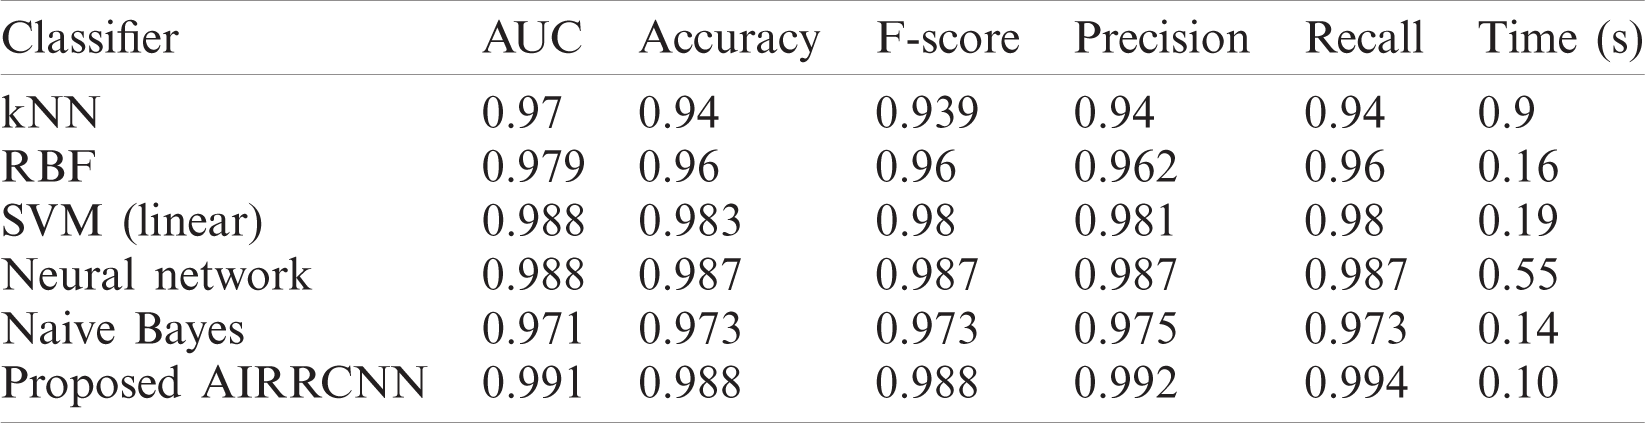
From the Fig. 7, we conclude that the proposed AIRRCNN classifier provides higher Classification Accuracy results of 99.1%, whereas the existing KNN algorithm provides 97%, RBF algorithm provides 97.9%, SVM (linear) algorithm provides 98.8%, Neural Network algorithm provides 98.8% and Naïve Bayes algorithm provides 97.1%. From the Fig. 8, we infer that the proposed AIRRCNN classifier provides higher Accuracy results of 98.8%, whereas the existing KNN algorithm provides 94%, RBF algorithm provides 96%, SVM (linear) algorithm provides 98.3%, Neural Network algorithm provides 98.7% and Naive Bayes algorithm provides 97.3%. From the Fig. 9, we conclude that the proposed AIRRCNN classifier provides higher F-Score value results of 0.988 value, whereas the existing KNN algorithm provides 0.939, RBF algorithm provides 0.96, SVM (linear) algorithm provides 0.98%, Neural Network algorithm provides 0.987% and Naive Bayes algorithm provides 0.973.
From the Fig. 10, it is concluded that the proposed AIRRCNN classifier provides higher Precision value results of 99.2%, whereas the existing KNN algorithm provides 94%, RBF algorithm provides 96.2%, SVM (linear) algorithm provides 98.1%, Neural Network algorithm provides 98.7% and Naive Bayes algorithm provides 97.5%. From the Fig. 11, it is evident that the proposed AIRRCNN classifier provides higher Recall value results of 0.994, whereas the existing KNN algorithm provides 0.94, RBF algorithm provides 0.96, SVM (linear) algorithm provides 0.98, Neural Network algorithm provides 0.987 and Naive Bayes algorithm provides 0.973. From the Fig. 12, it can be concluded that the proposed AIRRCNN classifier consumes lesser time of 0.10 s, whereas the existing KNN algorithm provides 0.9 s, RBF algorithm provides 0.16 s, SVM (linear) algorithm provides 0.19 s, Neural Network algorithm provides 0.55 s and Naive Bayes algorithm provides 0.14 s.

Figure 7: Classification accuracy

Figure 8: Accuracy comparison

Figure 9: F-score comparison

Figure 10: Precision comparison

Figure 11: Recall comparison

Figure 12: Time comparison
From the above comparative analysis shows that the proposed scheme is comparatively better than all the other exiting schemes.
Corona is a dangerous virus, capable of killing many people, if not managed properly. With over two million fatalities, it has become a lethal global pandemic. Most of the countries are struggling to effectively contain its spread. Many of them do not have adequate number of hospital beds, ambulances, doctors, healthcare workers, recommended drugs to treat COVID-19 and its variants. Some of the countries do not even have enough diagnosis facilities and oxygen. Automating coronavirus identifications from CT images is a very good option, which can help physicians to identify the virus in the early stages of treatment. This paper has proposed, implemented and validated an automatic, implementable DLT for COVID-19 identification. The proposed schemes has been demonstrated its validity and efficiency in tracing corona. The proposed AIRRCNN classifies coronavirus infected patients from CT images with higher precision of 99.2%, compared to other existing algorithms. Moreover, its results show better performances in comparison to other ML techniques. It can be concluded that the proposed AIRRCNN is an implementable and viable technique for detecting coronavirus from CT Images.
Funding Statement: This project was funded by the Deanship of Scientific Research (DSR) at King Abdulaziz University, Jeddah, under Grant No. GCV19-49-1441. The authors, therefore, acknowledge with thanks DSR for technical and financial support.
Conflicts of Interest: The authors declare that they have no conflicts of interest to report regarding the present study.
1. M. Yamin, “Counting the cost of COVID-19,” International Journal of Information Technology, vol. 12, no. 2, pp. 311–317, 2020. [Google Scholar]
2. M. Chung, A. Bernheim, X. Mei and N. Zhang, “CT Imaging features of 2019 Novel Coronavirus 2019-nCoV,” Radiology, vol. 275, no. 1, pp. 202–207, 2019. [Google Scholar]
3. A. Narin, C. Kaya and Z. Pamuk, “Automatic detection of Coronavirus disease (COVID-19) using X-ray images and deep convolutional neural networks,” COVID-19 e-Print arXiv: 2003.10849 [eess.IV], 2020. [Google Scholar]
4. World Health Organization, “Global Situation, WHO Coronavirus Disease (COVID-19) Dashboard,” 2020. [Online]. Available: https://covid19.who.int/. [Google Scholar]
5. S. Mallapaty, “Are COVID vaccination programmes working? Scientists seek first clues, Nature (News),” 2021. [Online]. Available: https://www.nature.com/articles/d41586-021-00140-w. [Google Scholar]
6. C. Huang, Y. Wang, X. Li, L. Ren, Z. Jianping et al., “Clinical features of patients infected with 2019 novel coronavirus in Wuhan,” Lancet, vol. 3, no. 2, pp. 11–23, 2020. [Google Scholar]
7. N. Chen, M. Zhou, X. Dong, J. Qu, F. Gong et al., “Epidemiological and clinical characteristics of 99 cases of 2019 novel coronavirus pneumonia in Wuhan, China: A descriptive study,” Lancet, vol. 5, no. 3, pp. 134–147, 2020. [Google Scholar]
8. W. Shi, X. Peng, T. Liu, Z. Cheng, H. Lu et al., “Deep learning-based quantitative computed tomography model in predicting the severity of COVID-19: A retrospective study in 196 patients,” Annals of Translational Medicine, vol. 9, no. 3, pp. 2–13, 2021. [Google Scholar]
9. Z. Tang, W. Zhao, X. Xie, Z. Zhong, F. Shi et al., “Severity assessment of COVID-19 using CT image features and laboratory indices,” Physics in Medicine & Biology, vol. 66, no. 3, pp. 35015, 2021. [Google Scholar]
10. F. Shi, L. Xia, F. Shan, D. Wu, Y. Wei et al., “Large-scale screening of COVID-19 from community acquired pneumonia using infection size-aware classification,” Preprint arXiv, arXiv.org > eess > arXiv: 2003.09860, 2020. [Google Scholar]
11. S. Wang, B. Kang, J. Ma, X. Zeng, M. Xiao et al., “A deep learning algorithm using CT images to screen for Corona Virus Disease (COVID-19),” Preprint from medRxiv, 2020. [Google Scholar]
12. X. Xu, X. Jiang, C. Ma, P. Du, X. Li et al., “Deep learning system to screen coronavirus disease 2019 pneumonia,” Engineering, vol. 6, no. 10, pp. 1122–1129, 2020. [Google Scholar]
13. J. Block, “COVID-19 puts spotlight on artificial intelligence,” Genetic Engineering & Biotechnology News, 2020. [Online]. Available: https://www.genengnews.com/gen-edge/COVID-19-putsspotlight-on-artificial-intelligence/. [Google Scholar]
14. W. Naudé, “Artificial intelligence against COVID-19: An early review,” IZA Institute of Labor Economics. IZA discussion paper no. 13110, 2020. [Online]. Available: https://covid-19.iza.org/publications/dp13110/. [Google Scholar]
15. K. Silverman, “Tackling COVID-19 requires better governance of AI and other frontier technologies–Here’s why,” World Economic Forum, 2020. [Online]. Available: https://www.weforum.org/agenda/2020/05/success-in-emerging-covid-19-crisis-requires-better-governance-of-ai-and-other-frontier-technologies-here-s-why/. [Google Scholar]
16. V. Sreeharsha, “Computer vision could help enforce social distancing in the workplace; with no coronavirus vaccine in sight, good behavior will be crucial to keeping people safe when companies start to reopen plants and offices,” Wall Street Journal, 2020. [Online]. Available: https://www.wsj.com/articles/computervision-could-help-enforce-social-distancing-in-the-workplace-11587720601?mod=searchresults&page=1&pos=1/. [Google Scholar]
17. J. M. Mueller, “The ABCs of assured autonomy,” in 2019 IEEE Int. Symp. on Technology and Society, Medford, MA, USA, pp. 1–5, 2019. [Google Scholar]
18. S. Wang, B. Kang, J. Ma, X. Zeng, M. Xiao et al., “A deep learning algorithm using CT images to screen for corona virus disease (COVID-19),” MedRxiv, vol. 6, no. 2, pp. 334–342, 2020. [Google Scholar]
19. L. Li, L. Qin, Z. Xu, Y. Yin, X. Wang et al., “Artificial Intelligence istinguishes COVID-19 from community acquired pneumonia on chest CT,” Radiology, vol. 2, no. 1, pp. 189–204, 2020. [Google Scholar]
20. Y. Song, S. Zheng, L. Li, X. Zhang, X. Zhang et al., “Deep learning enables accurate diagnosis of novel coronavirus (COVID-19) with CT images,” MedRxiv, vol. 5, no. 1, pp. 871–883, 2020. [Google Scholar]
21. C. Zheng, X. Deng, Q. Fu, Q. Zhou, J. Feng et al., “Deep Learning based detection for COVID-19 from chest CT using weak label,” medRxiv, vol. 4, no. 2, pp. 21–34, 2020. [Google Scholar]
22. S. Wang, B. Kang, J. Ma, X. Zeng, M. Xiao et al., “A deep learning algorithm using CT images to screen for corona virus Disease (COVID-19),” medRxiv., vol. 4, no. 3, pp. 34–41, 2020. [Google Scholar]
23. X. Xu, X. Jiang, C. Ma, P. Du, X. Li et al., “Deep learning system to screen coronavirus disease 2019 pneumonia,” arXiv preprint, 2020, arXiv: 2002.09334, 2019. [Google Scholar]
24. X. Jiang, M. Coffee, A. Bari, J. Wang, X. Jiang et al., “Towards an artificial intelligence framework for data–driven prediction of coronavirus clinical severity,” Computers, Materials & Continua, vol. 63, no. 1, pp. 537–551, 2020. [Google Scholar]
25. P. Yu, Z. Xia, J. Fei and S. K. Jha, “An application review of artificial intelligence in prevention and cure of covid-19 pandemic,” Computers, Materials & Continua, vol. 65, no. 1, pp. 743–760, 2020. [Google Scholar]
26. S. Y. Siddiqui, S. Abbas, M. A. Khan, I. Naseer, T. Masood et al., “Intelligent decision support system for covid-19 empowered with deep learning,” Computers, Materials & Continua, vol. 66, no. 2, pp. 1719–1732, 2021. [Google Scholar]
27. R. A. Al-Falluji, Z. D. Katheeth and B. Alathari, “Automatic detection of covid-19 using chest X-ray images and modified resnet18-based convolution neural networks,” Computers, Materials & Continua, vol. 66, no. 2, pp. 1301–1313, 2021. [Google Scholar]
28. X. Deng, H. Shao, L. Shi, X. Wang and T. Xie, “A classification-detection approach of COVID-19 based on chest X-ray and CT by using Keras pre-trained deep learning models,” Computer Modeling in Engineering & Sciences, vol. 125, no. 2, pp. 579–596, 2020. [Google Scholar]
29. M. A. Mohammed, K. H. Abdulkareem, B. Garcia-Zapirain, S. A. Mostafa, M. S. Maashi et al., “A comprehensive investigation of machine learning feature extraction and classification methods for automated diagnosis of covid-19 based on X-ray images,” Computers, Materials & Continua, vol. 66, no. 3, pp. 3289–3310, 2021. [Google Scholar]
30. C. Huang, Y. Wang, X. Li, L. Ren, J. Zhao et al., “Clinical features of patients infected with 2019 novel coronavirus in Wuhan, China,” Lancet, vol. 395, no. 10223, pp. 497–506, 2020. [Google Scholar]
31. M. Chung, A. Bernheim, X. Mei and N. Zhang, “CT Imaging features of 2019 Novel Coronavirus (2019-nCoV),” Radiology, vol. 275, no. 1, pp. 202–207, 2020. [Google Scholar]
32. T. Bardak and S. Bardak, “Prediction of wood density by using red-green-blue (RGB) color and fuzzy logic techniques,” Journal of Polytech, vol. 20, no. 3, pp. 979–984, 2020. [Google Scholar]
33. J. Arnal and L. Súcar, “Hybrid filter based on fuzzy techniques for mixed noise reduction in color images,” Applied Science, vol. 10, no. 2, pp. 1–17, 2020. [Google Scholar]
34. J. M. Soto-Hidalgo, D. Sánchez, J. Chamorro-Martínez and P. M. Martínez-Jiménez, “Color comparison in fuzzy color spaces,” Fuzzy Set and Systems, vol. 8, no. 4, pp. 453–462, 2019. [Google Scholar]
35. N. A. Elleboudy, H. M. EzzEldin and S. M. S. Azab, “Focus stacking technique in identification of forensically important Chrysomya species (Diptera: Calliphoridae),” Egyptian Journal of Forensic Sciences, vol. 6, no. 2, pp. 235–239, 2016. [Google Scholar]
36. K. Rajan, C. Suh and P. F. Mendez, “Principal component analysis and dimensional analysis as materials informatics tools to reduce dimensionality in materials science and engineering,” Statistical Analysis and Data Mining, vol. 1, no. 6, pp. 361–371, 2009. [Google Scholar]
37. C. Szegedy, S. Ioffe, V. Vanhoucke and A. Alemi, “Inception-v4, Inception-Resnet and the impact of residual connections on learning,” arXiv preprint arXiv: 1602.07261, 2016. [Google Scholar]
38. S. Ioffe and C. Szegedy, “Batch normalization: Accelerating deep network training by reducing internal covariate shift,,” arXiv preprint arXiv: 1502.03167, 2015. [Google Scholar]
39. C. Szegedy, V. Vanhoucke, S. Ioffe, J. Shlens and Z. Wojna, “Rethinking the inception architecture for computer vision,” in Proc. of the IEEE Conf. on Computer Vision and Pattern Recognition, pp. 2818–2826, 2016. [Google Scholar]
40. M. Lin, C. Qiang and Y. Shuicheng, “Network in network,” arXiv preprint, arXiv: 1312.4400, 2013. [Google Scholar]
41. J. Zhao, Y. Zhang, X. He and P. Xie, “COVID-CT-Dataset: A CT scan dataset about COVID-19,” arXiv preprint, arXiv: 2003.13865v1, 2020. [Google Scholar]
42. L. Abualigah, “Feature selection and enhanced krill herd algorithm for text document clustering,” in Studies in Computational Intelligence, Boston, MA, USA: Springer, pp. 1–7, 2019. [Google Scholar]
 | This work is licensed under a Creative Commons Attribution 4.0 International License, which permits unrestricted use, distribution, and reproduction in any medium, provided the original work is properly cited. |