DOI:10.32604/cmc.2021.016736
| Computers, Materials & Continua DOI:10.32604/cmc.2021.016736 | |
| Article |
Performance Comparison of Deep CNN Models for Detecting Driver’s Distraction
1School of Information Technology and Engineering, Vellore Institute of Technology, Vellore, 632014, India
2Faculty of Information and Communication Technology, University of Malta, Msida, 2080, MSD, Malta
3School of Computer Science and Engineering, Vellore Institute of Technology, Vellore, 632014, India
4College of Computer Science, Shaqra University, Kingdom of Saudi Arabia
5School of Computer Science and Engineering, SCE, Taylor’s University, Subang Jaya, 47500, Malaysia
*Corresponding Author: Lalit Garg. Email: Lalit.garg@um.edu.mt
Received: 10 January 2021; Accepted: 22 March 2021
Abstract: According to various worldwide statistics, most car accidents occur solely due to human error. The person driving a car needs to be alert, especially when travelling through high traffic volumes that permit high-speed transit since a slight distraction can cause a fatal accident. Even though semi-automated checks, such as speed detecting cameras and speed barriers, are deployed, controlling human errors is an arduous task. The key causes of driver’s distraction include drunken driving, conversing with co-passengers, fatigue, and operating gadgets while driving. If these distractions are accurately predicted, the drivers can be alerted through an alarm system. Further, this research develops a deep convolutional neural network (deep CNN) models for predicting the reason behind the driver’s distraction. The deep CNN models are trained using numerous images of distracted drivers. The performance of deep CNN models, namely the VGG16, ResNet, and Xception network, is assessed based on the evaluation metrics, such as the precision score, the recall/sensitivity score, the F1 score, and the specificity score. The ResNet model outperformed all other models as the best detection model for predicting and accurately determining the drivers’ activities.
Keywords: Deep-CNN; ResNet; Xception; VGG16; data; classification
Various reports have indicated that several road accidents occurred over the years due to the driver’s distraction. An inattentive driver is one of the main reasons behind the vast majority of accidents. The yearly statistics indicate that nearly half a million people are injured due to these accidents, and thousands of deaths occur each year [1–4]. There are several reasons for driver’s distraction, such as operating gadgets, conversing with their co-passengers, drunken driving, and fatigue. There is a need for a reliable method that guarantees road safety. To this end, this research’s main objective is to develop a suitable solution to curb such occurrences and ensure road safety. Predicting the reasons for the driver’s distraction and possibly alerting the driver could avoid such accidents. Further, this work devises the tools and methods to determine the best and most efficient Deep Convolutional Neural Network (deep CNN) model for detecting the reason behind a driver’s distraction. The deep CNNs have proven to perform exceptionally well in classifying images; thus, it seems to be an excellent fit for resolving this problem.
A deep CNN usually requires significantly less preprocessing than the other classification algorithms [5–10]. The entire process of finding the best deep CNN model begins with comparing the models in terms of different evaluation metrics and selecting the best among them. The deep CNN models help to classify the distracted driver dataset. Further, this system would ensure road safety in high-risk roads and highways, where speed is also a concern, and the fatality rate is much higher. Even though the external checks are essential for curbing accidents, predicting the driver’s distraction plays a significant role in saving lives and guaranteeing road safety.
This research determines an optimized approach among different deep CNN models for detecting the driver’s distraction. The various models’ performances were compared using the evaluation metrics, and then the best-suited approach was determined based on these metrics. The materials and methods section deals with the background concepts and related works on this topic, and it briefly introduces the deep CNN models. The implementation section discusses the hardware and software requirements, the dataset utilized, and the individual deep CNN models’ parameter settings. Next, the results and discussions section provides the performance comparisons of various deep CNN models. Finally, the conclusion section summarizes this work along with a brief discussion about possible future enhancements.
2.1 The Deep Convolutional Neural Network (Deep CNN)
The concept of image recognition, classification and processing has evolved through various architectures and algorithms, and deep CNN models are a branch of Deep Learning [11]. Firstly, the images get converted into the two-dimensional matrix [12–15]. However, this reduces the quality of the image when it has pixel dependencies. The deep CNN algorithm ensures that the image quality and its spatial and temporal dependencies are also preserved. A deep CNN model trained on a larger dataset usually generalizes much better than a model trained with a smaller dataset. Further, the deep CNN model processes the images with minimum computation and minimal damage to the pixel values. The entire process of the deep CNN image classification can be broadly divided into three steps. The image passes through the convolutional layers, the pooling layers, and the Fully Connected Layers [16]. Finally, a probabilistic function is applied to classify the images. Various deep CNN architectures such as LeNet, AlexNet, VGGNet, ResNet, and Xception can be deployed for image classification. This work focuses on three prominent deep CNN architectures: the ResNet, Xception, and the VGG16 model.
Generally, in deep CNN models, the classification efficiency keeps improving proportionately with the number of network layers. However, this causes a consequent increase in the training and testing error rate. This phenomenon is referred to as the vanishing or exploding gradient. Further, this issue can be resolved using the Residual Network (ResNet) [17–19]. These networks deploy an approach known as skip connections. Further, the network skips the training from a few layers and connects directly to the output. ResNet’s basic architecture is inspired by the VGG network, where the convolutional layers use 3 × 3 filters. The architecture involves two concepts for model optimization. The layers possess the same number of filters for the same type of output feature maps. Moreover, when the output feature map’s size is halved, the number of filters is doubled to preserve each layer’s time complexity [20–22]. In this work, the ResNet model was trained and tested over the Kaggle dataset for Distracted Driver Detection by State Farm. Moreover, this model efficiently classifies the driver’s distraction. Fig. 1 portrays the architecture for the ResNet model that consists of 152 layers. Each step is carried forward with four layers of similar behavioural pattern in a ResNet. Every subsequent segment follows the same pattern. A three-by-three convolution is performed with a constant dimension: 64, 128, 256, and 512, respectively. Thus, it bypasses the input after every two convolutions. Moreover, the width and height dimensions during the entire layer remain constant. Skip connections perform identity mapping, and their outputs are added to the outputs of the stacked layers. Furthermore, the ResNet model is less complicated and can be easily optimized compared to the other networks. Besides, this model converges faster and generates better results than other peer-level networks.
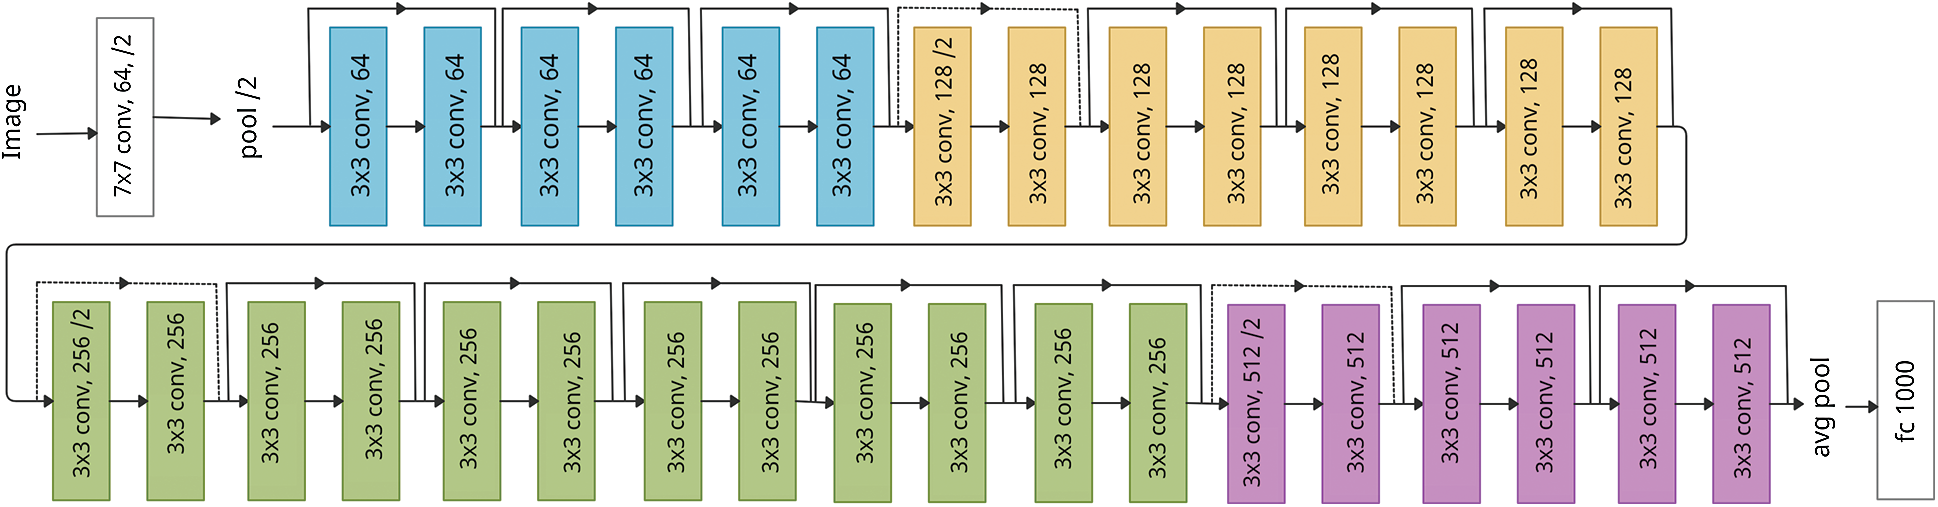
Figure 1: Architecture of the ResNet deep CNN model
The Extreme Inception or the Xception model is an inspired version of CNN’s Inception model, an ‘extreme’ improvement. The Inception model has deep convolutional layers and wider convolutional layers that work in a parallel manner. This model has two different levels, each with three convolutional layers. Unlike the inception model, the Xception model has two levels, where one of them has a single layer. This layer slices the output into three segments and passes it on to the next set of filters. The first level has a single convolutional level of 1 * 1 filter, while the next level has three convolutional levels of a 3 * 3 filter. The aspect that defines the Xception model is the Depthwise Separable Convolution [23–25]. A general deep CNN model takes care of spatial and channel distribution, but the Xception model involves depthwise and pointwise convolution. The work by Chollet [26] shows the improvement of Xception over the previous models. This research uses this Xception model to evaluate the distracted driver dataset for classifying the driver’s distraction. The architecture of the Xception network model is illustrated in Fig. 2. The Xception model is a 71-layer deep CNN, inspired by the Inception model from Google, and it is based on an extreme interpretation of the Inception model [27]. Its architecture is stacked with depthwise separable convolutional layers. The pre-trained version of the model is trained using millions of images from the Imagenet database. Moreover, this model can classify hundreds of object categories and has rich representations of its utilities for a wide range of pictures. The Xception model has profound utilities in the domains of image identification and classification.
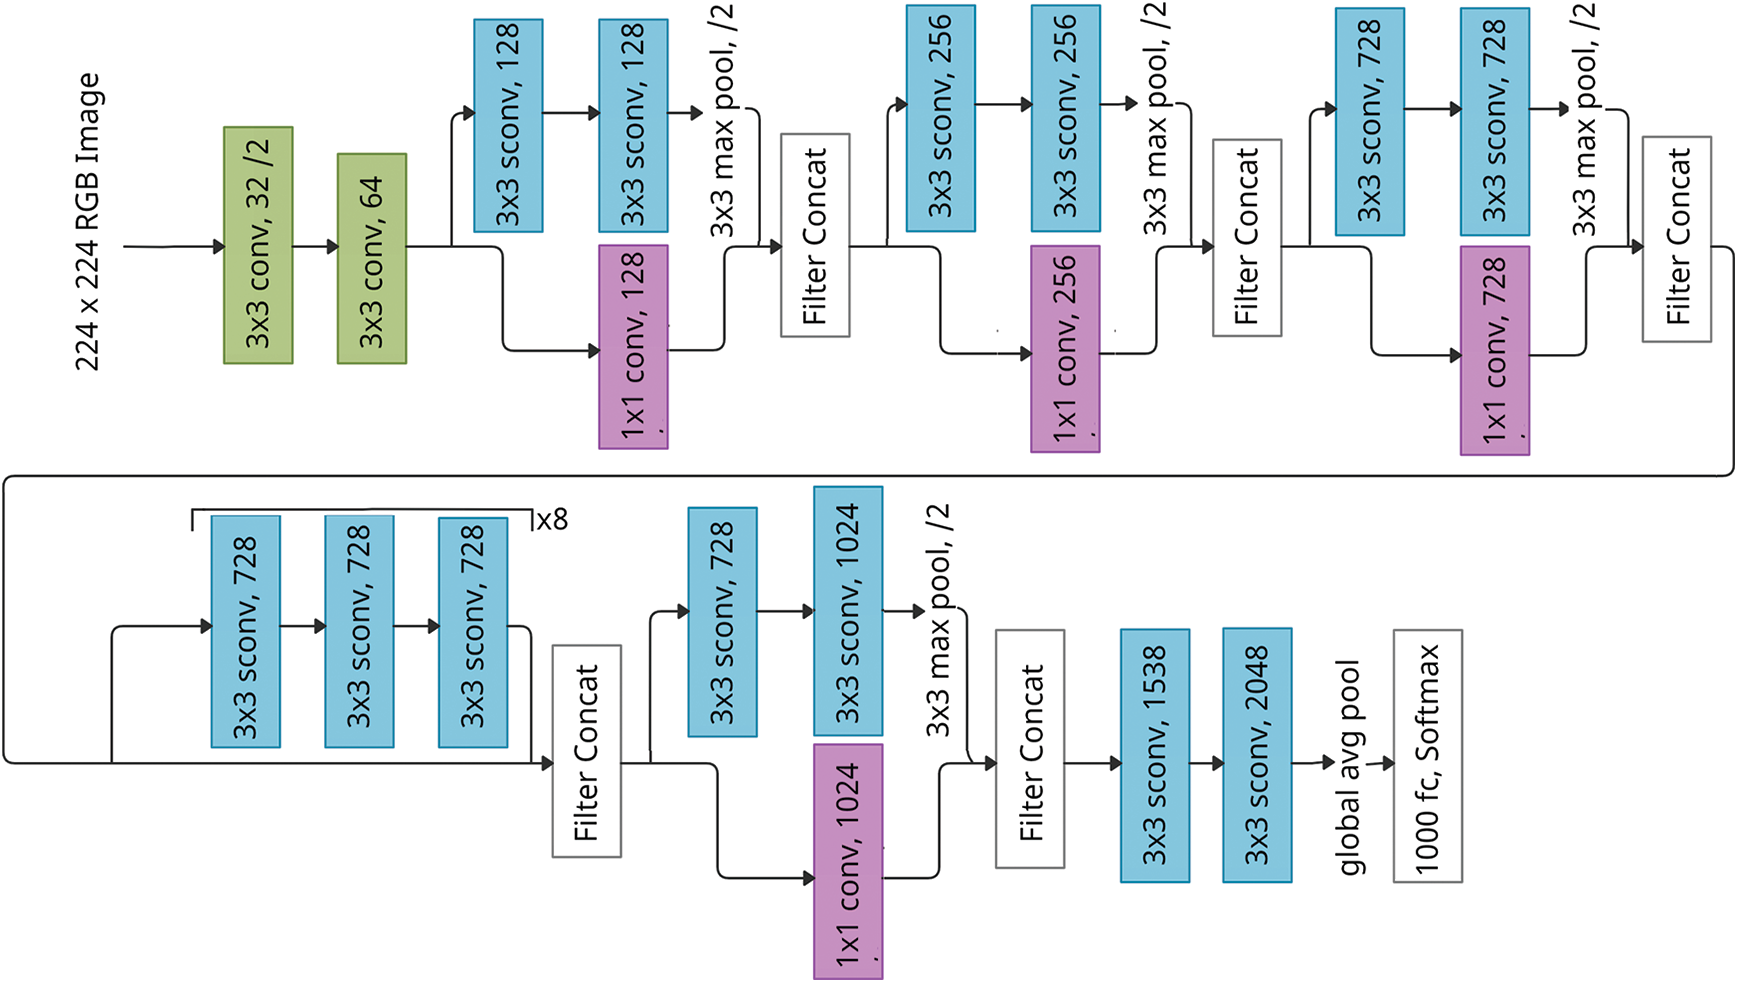
Figure 2: Architecture of the Xception deep CNN model
The VGG16 architecture is an improved version of the AlexNet deep CNN model. When this model was tested over the Imagenet dataset, it showed a top-5 test accuracy of 92.7%. The VGG16 model uses 16 layers with tunable parameters. There are 13 convolutional layers and three fully connected layers. It also contains five max-pooling layers in the middle, and at the output, it has the Softmax activation function [28–30]. The entire module’s architecture is divided into various sets of convolutional layers and max-pooling layers, following which the fully connected layer and the activation function are present. In the VGG16 model, the image passes through two sets of two convolutional layers and one max pooling layer. Subsequently, it is followed by three sets of three convolutional layers and one max pooling layer. After this stage, the image passes through the three dense, fully connected layers, finally entering the Softmax activation function [31].
The VGG16 model also has hidden layers with the Rectified Linear Unit (ReLU) as the activation function. This model happens to be less computationally intensive than the previous ones due to the decrease in kernels. Besides that, the convolutional layer preserves the image resolution as it has a small receptive field, that of 3 * 3, and a stride of 1. Fig. 3 represents the architecture of the VGG16 model. The input of the first convolution layer is of a definite size and a specific fixated RGB image. The picture moves across many network layers, utilizing the filters with a minimal 3 * 3-pixel responsive field. The stride of convolution is fixated at a pixel, and the in-space resolution is saved even after the convolution [32].
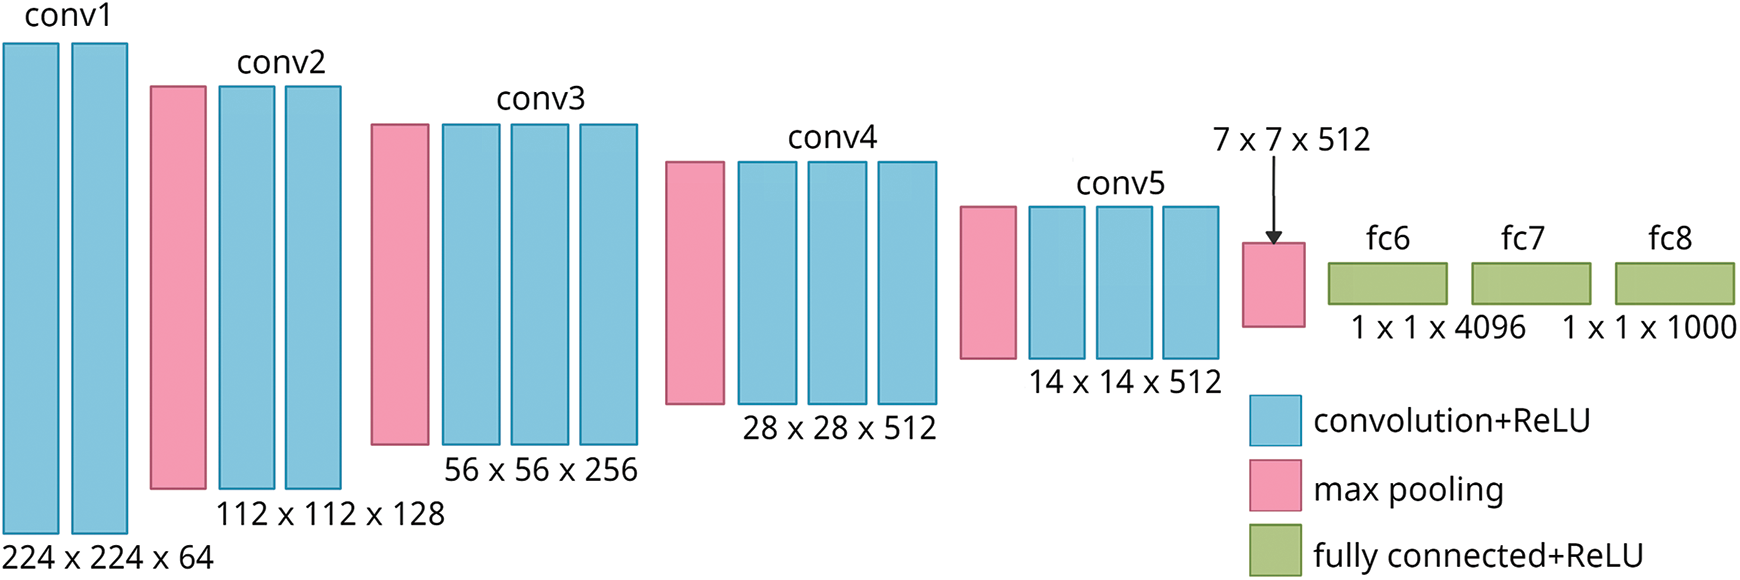
Figure 3: Architecture of the VGG16 deep CNN model
For the 3 * 3 convolutional layers, one layer of zeros gets added to the borders for the same padding. The max-pooling function is performed across a 2 * 2-pixel window, with a stride of 2. Three fully connected layers follow a stack of convoluting sheets, with the final layer being the Softmax layer. The fully connected layer configuration is similar in every network, and every hidden layer is provided with the ReLU activation function.
This research presents an accurately trained model for classifying the driver’s distraction. The rate of fatal accidents due to the driver’s human error or negligence has been at a record high for the past few years. Accidents can be prevented by alerting drivers whenever they tend to get distracted. The input provided for training the system is the distracted driver’s images, such as the driver using a mobile phone, adjusting radio channels, drinking, and/or engaged in other such activities [33]. This dataset will then train the various deep CNN algorithms, and the best model for this task is determined. For increasing distraction levels, the model proportionately recognizes a wide range of distracted drivers better while eliminating the non-distracted ones. The deep CNN algorithms require minimal preprocessing of the data; also, they can capture the spatial and temporal dependencies in images. However, basic preprocessing methods are still needed to ensure that the dataset does not provide irrelevant details. The RGB images are converted into the grey-scale format, where a two-dimensional matrix structure represents each image. The images’ thresholding is necessary due to the car seats’ background noise. Thresholding ensures the extraction of only the relevant part(s) from the image—characterizing the driver’s distraction. The primary image processing methods guarantee the obtained image’s appropriateness and contribute to the dataset’s variety. Fig. 4 shows this work’s methodological flow. As mentioned earlier, deep CNN architecture provides various image classification algorithms and models. We used three models: ResNet, Xception, and VGG16. These models were trained separately using the distracted driver dataset. Further, various evaluation metrics were employed to assess these models’ performance. The best model was decided based on the evaluation metrics. To this end, the ResNet was observed to be the best model for performing a successful driver’s distraction classification.
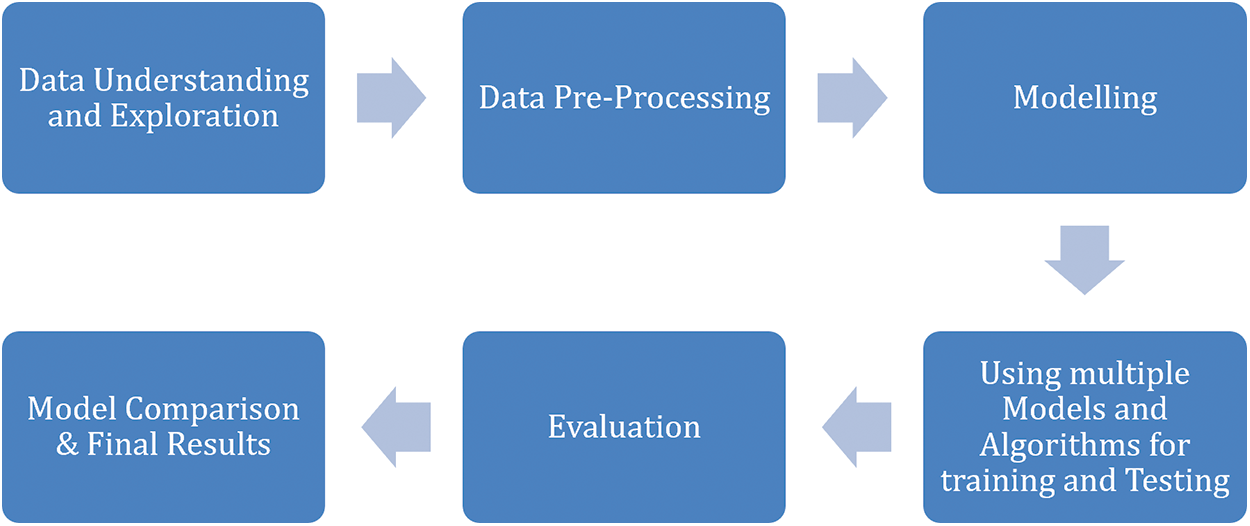
Figure 4: Methodological flow of the work
The system was executed on a Hewlett-Packard (HP) Spectre ×360 convertible workstation with a 64-bit Intel® Core™ i7 processor and a GPU. It had 16 GB RAM and a 64-bit operating system with touch and pen input supports. The camera used in this system was an HP TrueVision Full HD WVA Webcam that comes inbuilt with the workstation and interspersed with dual digital microphones.
The software applications used for this system included a Python platform and R-Studio. The system was built primarily on the Python language along with secondary support from R programming. Several Python libraries like NumPy, Keras, TensorFlow, Pandas, and Matplotlib were used to implement the deep CNN models. Further, these models were executed using open-source machine learning and deep learning libraries like Keras and TensorFlow.
The State Farm Distracted Driver Detection dataset used in this work was obtained from Kaggle. This dataset comprises more than 20,000 image data, totalling an overall size of approximately 8 GB. All the dataset images had the same dimension, 480 * 480 pixels, and several driver images in various driving postures. The pictures were classified into ten classes, as shown in Tab. 1. The different deep CNN models were trained to predict the likelihood of the driver’s distraction in each picture. Fig. 5 shows the demo pictures from each of the ten classes of images. Further, this dataset possesses the distribution of more than 20,000 images into the ten distinguished classes. The histogram visualized in Fig. 6 shows that approximately 2500 image data are present under each class. However, one exception is the number of images in class C8, which consists of people talking to a passenger. This category has 4000 data compared to the other class images, whose average frequency is around 2350.
Table 1: Classes of images in the dataset and their description
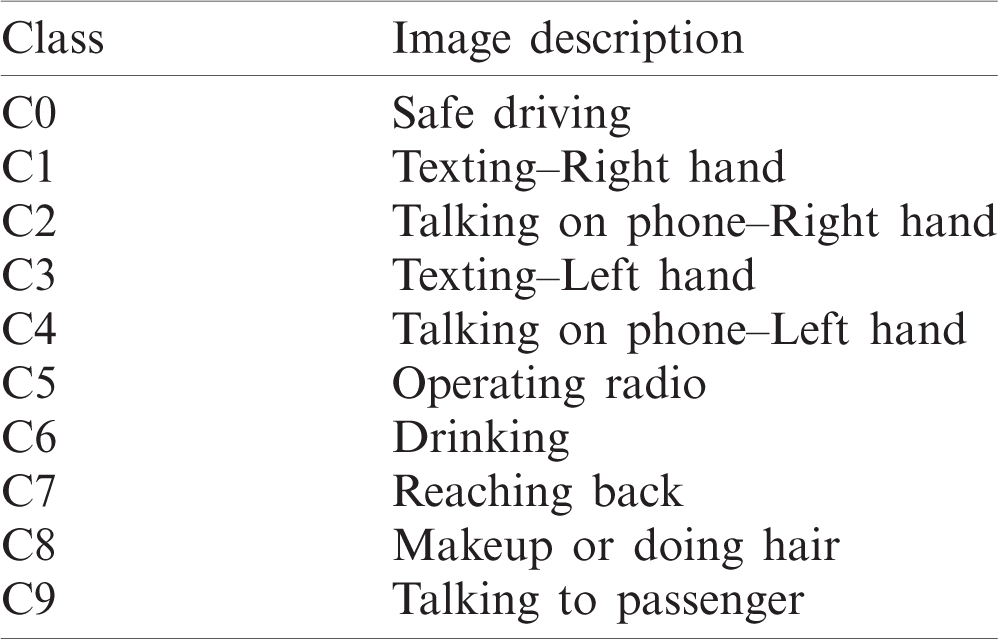
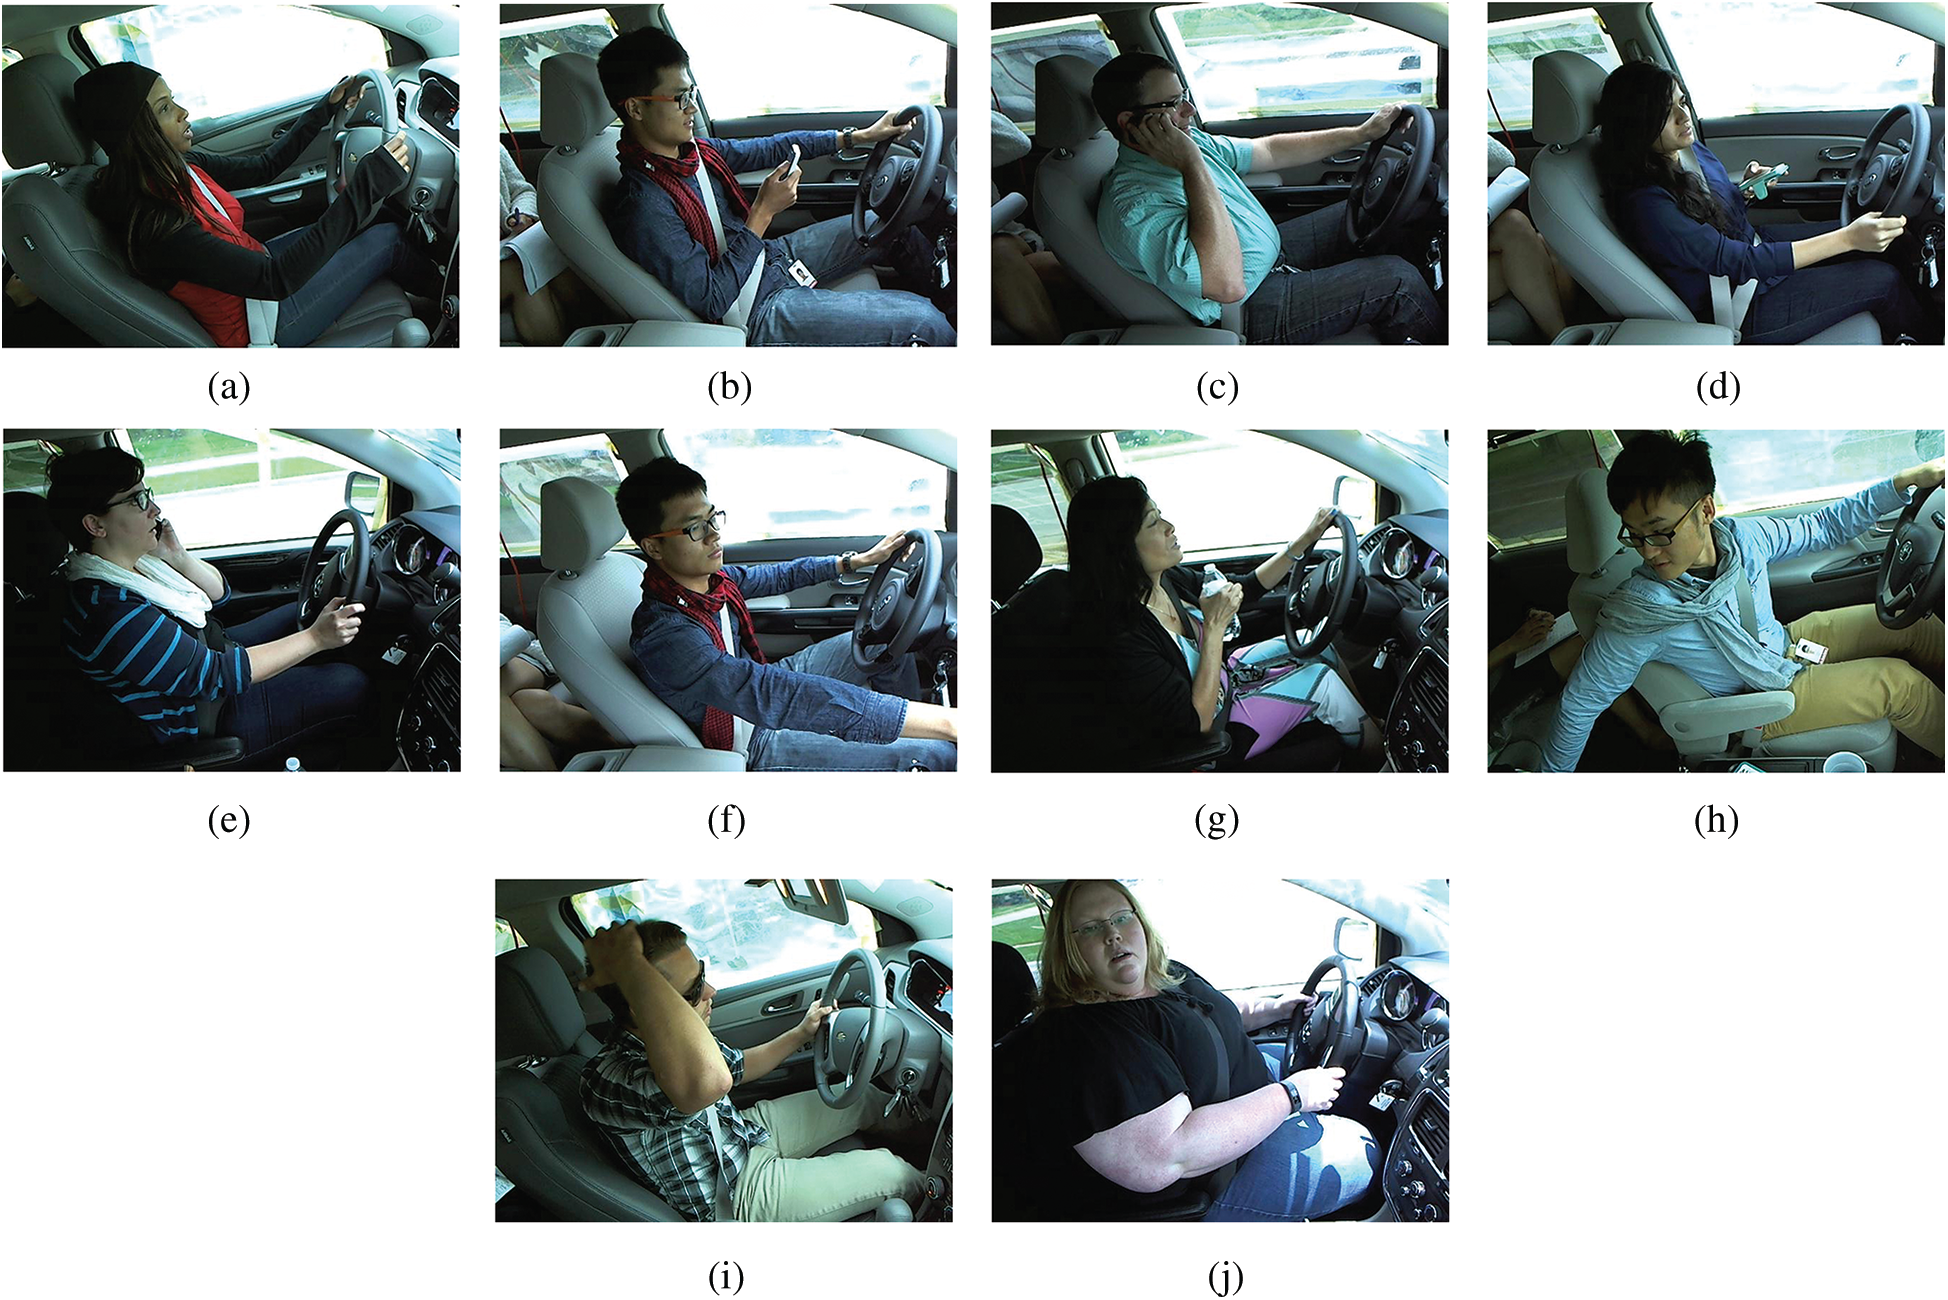
Figure 5: Sample pictures from each of the ten classes of images–(a) class C0–safe driving (b) class C1–texting with right hand (c) class C2–talking on the phone with right hand (d) class C3–texting with left hand (e) class C4–talking on the phone with left hand (f) class C5–operating radio (g) class C6–drinking (h) class C7–reaching back (i) class C8–doing hair (j) class C9–talking to a passenger
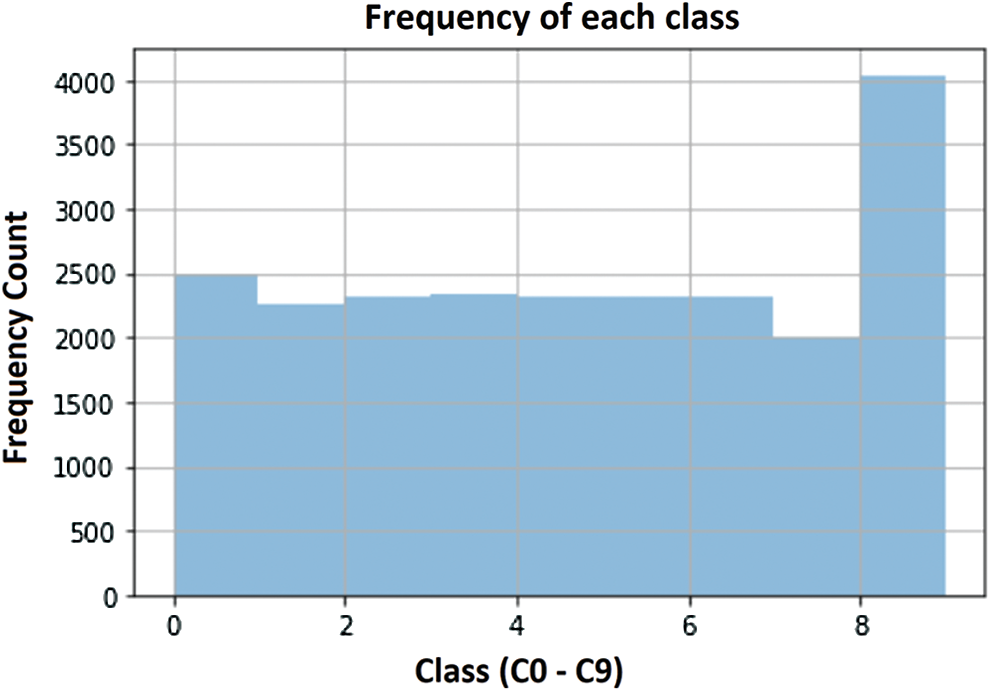
Figure 6: Frequency of images in each class
Certain observations were drawn after acquiring and evaluating the information about the dataset. Not all the pixel values contributed equally to the class value assigned to a particular image. For example, in most cases, hands and head positioning play a vital role in determining the image class. The images are preprocessed to remove the background noise, which barely contributed as a prominent feature for the evaluation. The image data was converted into 64 * 64 pixels from its original resolution of 480 * 480 pixels. The images had many background noises not required for the prediction, such as the windshield and the seats. The essential characteristics of the image are the positioning of hands, head, and legs. Hence, unwanted information was removed using image processing techniques like grey-scaling and thresholding. The mean RGB values of every image in the dataset were determined, and these values were 95.124, 96.961, and 80.123. Every image’s pixel values were subtracted by the mean value to retain only valuable information for the training model. The position of arms, head, legs, and any new object was still clearly identifiable, making the image appropriate for further processing by the deep CNN models.
The ResNet model used fivefold cross-validation to verify the results’ stability and authenticity. A checkpoint was created after each set of validations to avoid the loss of the stored weights. Further, each cross-validation was set to run with ten epochs, and the various performance evaluation metrics were determined. As shown in Fig. 7, the model was prepared using the ResNet50 layer using the ‘Imagenet’ data as its weights, as available in the Keras library. Next, these values were flattened using a flatten layer. The ResNet deep CNN model was fine-tuned with the dense layer using the ‘Softmax’ function. Further, to utilize an adaptive learning rate, Adam optimization was used instead of Gradient Descent optimization.
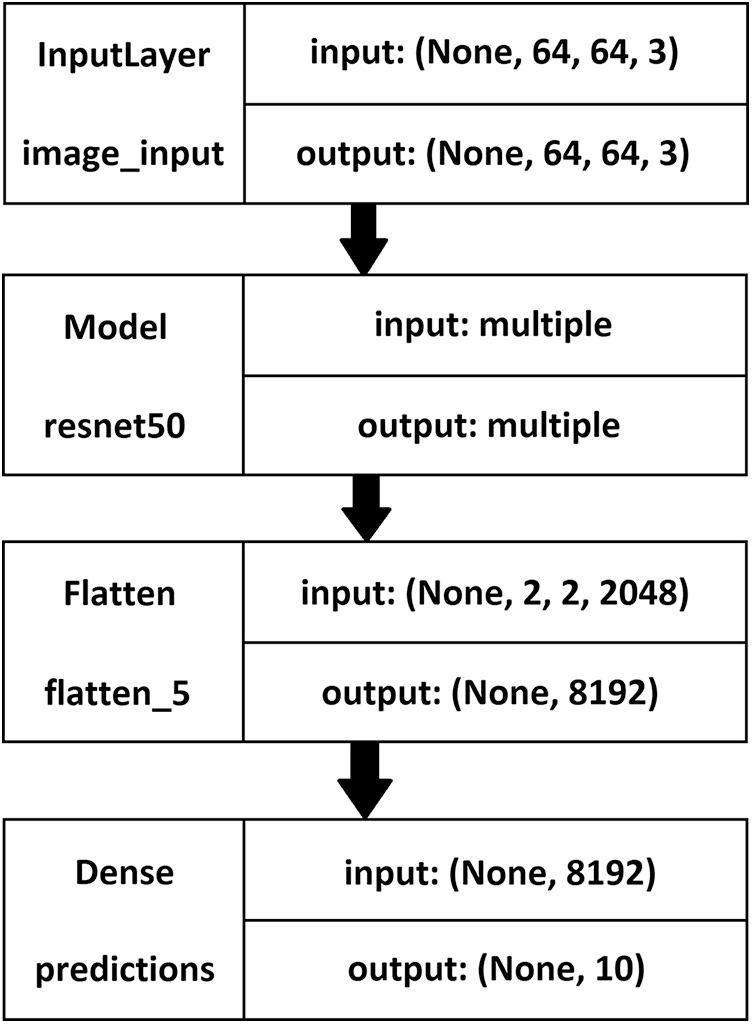
Figure 7: The ResNet model description–left: layer name, right: input-output size
3.6 Execution of Xception Model
The Xception model was set up using transfer learning, utilizing a pre-trained VGG16 model. Like the ResNet model, in the Xception model, each cross-validation was run with ten epochs, and the various evaluation metrics were determined. As shown in Fig. 8, the Xception model was prepared using the Xception layer with the weights trained using the ‘Imagenet’ dataset. The shuffle parameter was set to true, and the verbose parameter was set to 1. Further, these values were flattened using a flatten layer. The Xception model, like the ResNet model, was fine-tuned with the dense layer using the ‘Softmax’ function. Adam optimization was used instead of Gradient Descent optimization, and the loss parameter was set to ‘Categorical Crossentropy.’

Figure 8: The Xception model description–left: layer name, right: input-output size
The VGG16 model was set up with the Softmax function and the ReLU activation function. The ReLU activation function helped filter out the negative values and pass only the non-negative values onto the next layer. The fully connected layers were initially added to the network with appropriate activation functions. Two dense layers were used with 1024 and 512 units, respectively, in the initial few layers, utilizing the ReLU activation function. After implementing the two dense ReLU layers, a dense Softmax with ten units was added to the network. Ten units were used to predict the occurrences of the ten distraction classes created. The Softmax layer finally returned a value in the range of 0 to 1, based on the distracted drivers’ image class (C0 to C9). Further, while training the model, Adam optimization was used, rather than the Stochastic Gradient Descent (SGD), to reach the global minima. The learning rate was set as 1e−5. This learning rate was tweaked several times to reach the current results. The description of the VGG16 Model network is shown in Fig. 9. The input data was passed through these different layers. The fully connected dense layers were included in the model, and finally, a ten-unit output was used to classify the images under the ten distraction classes.
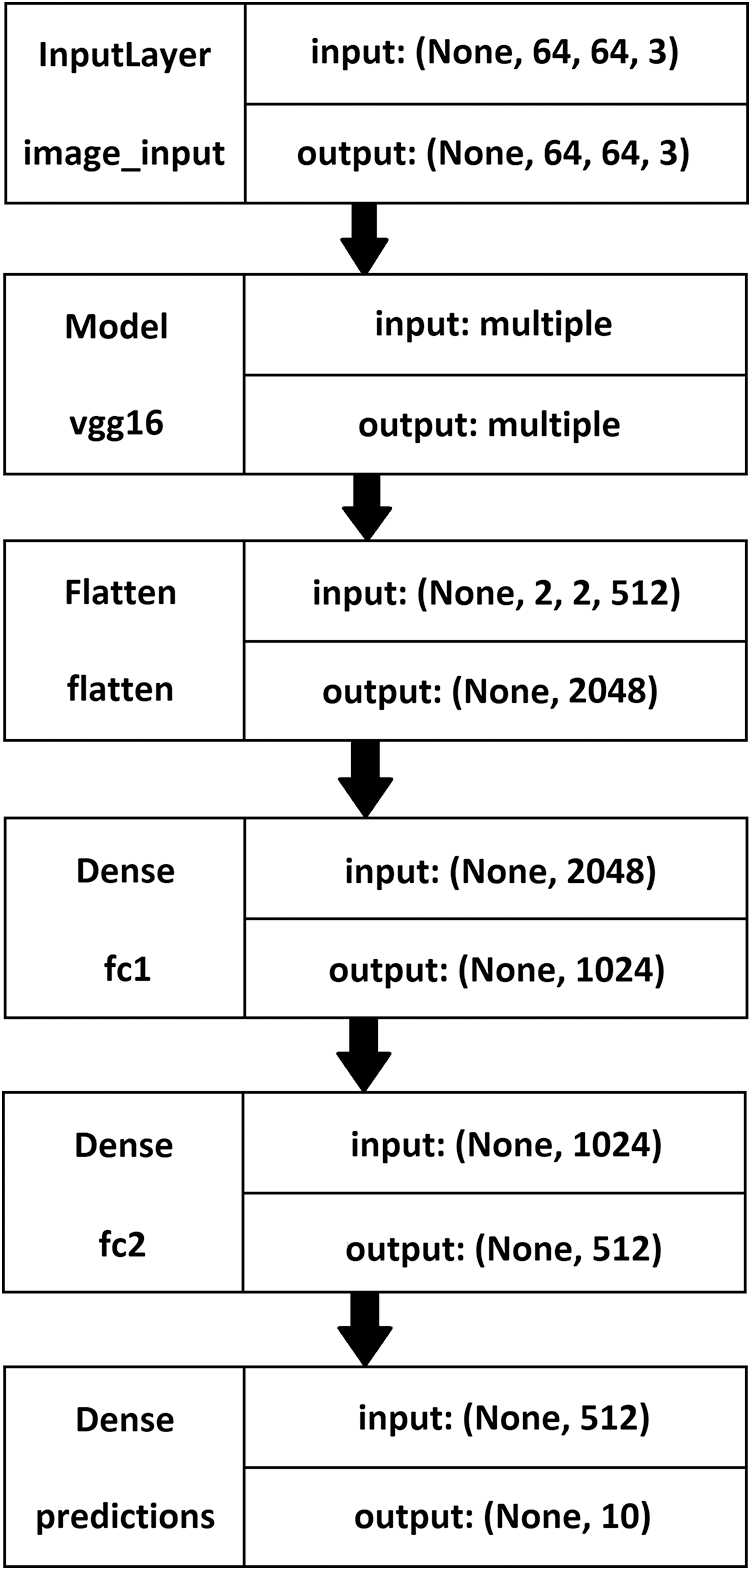
Figure 9: The VGG16 model description–left: layer name, right: input-output size
The performance comparison was accomplished based on the evaluation metrics—precision score, recall/sensitivity score, F1 score, and specificity score [34]. True positive, true negative, false positive, and false negative values were used to compute the evaluation metrics [35–41]. The results were plotted using Python’s Matplotlib library for better interpretation and visualization. The results tabulated in Tab. 2 represent the evaluation metric scores for the ten classes of images obtained by the deep CNN ResNet model. The highest precision, recall/sensitivity, and F1 score were observed for the class label C7, and the lowest precision, recall/sensitivity, and F1 score were seen in class label C6. However, the specificity score was highest for the class label C9 and lowest for the class label C2.
Table 2: Evaluation metric scores for ResNet model
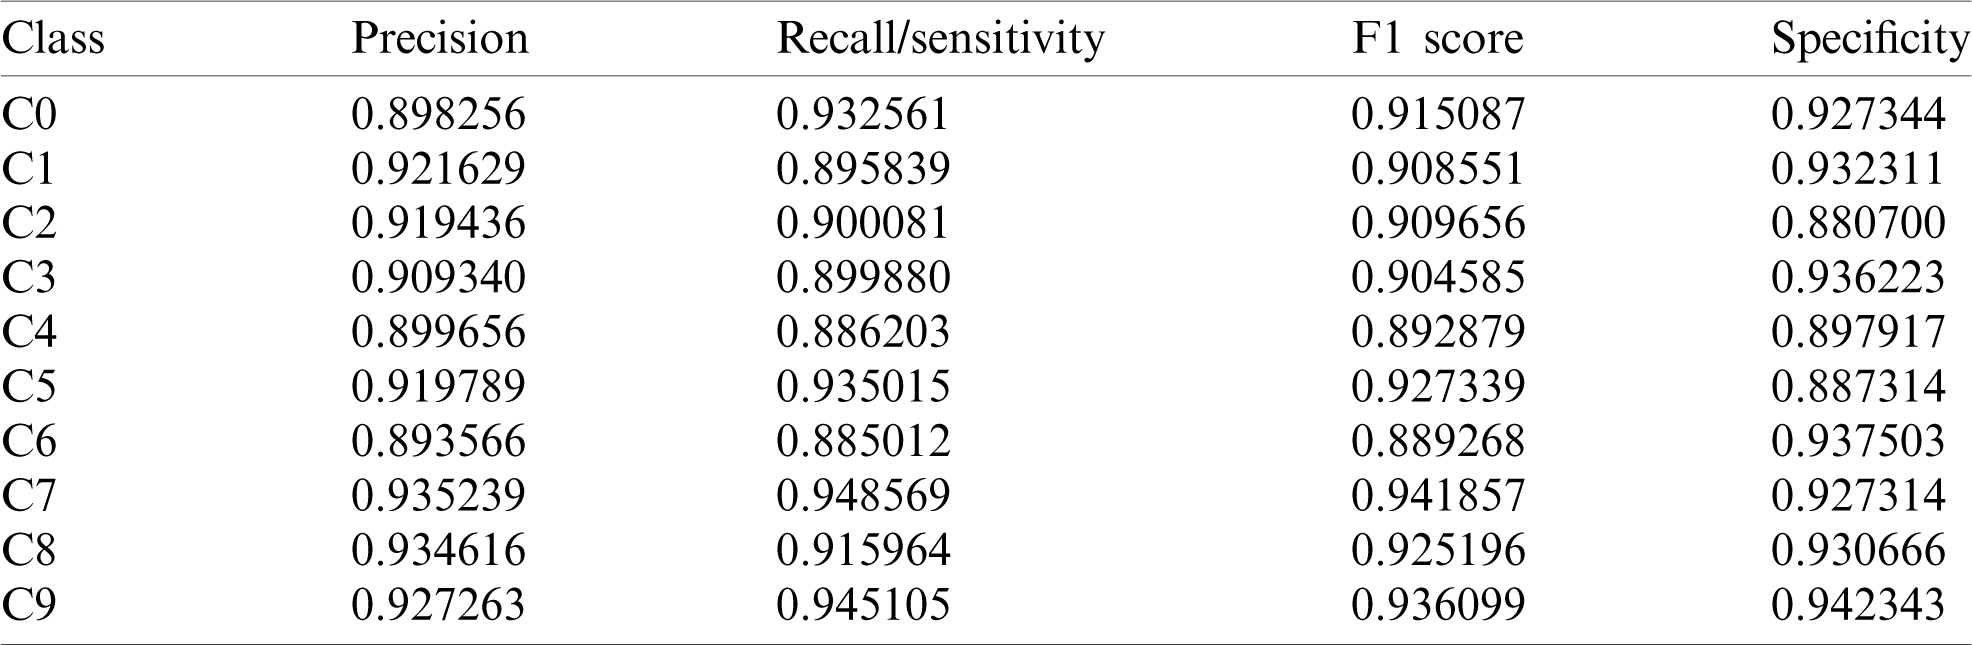
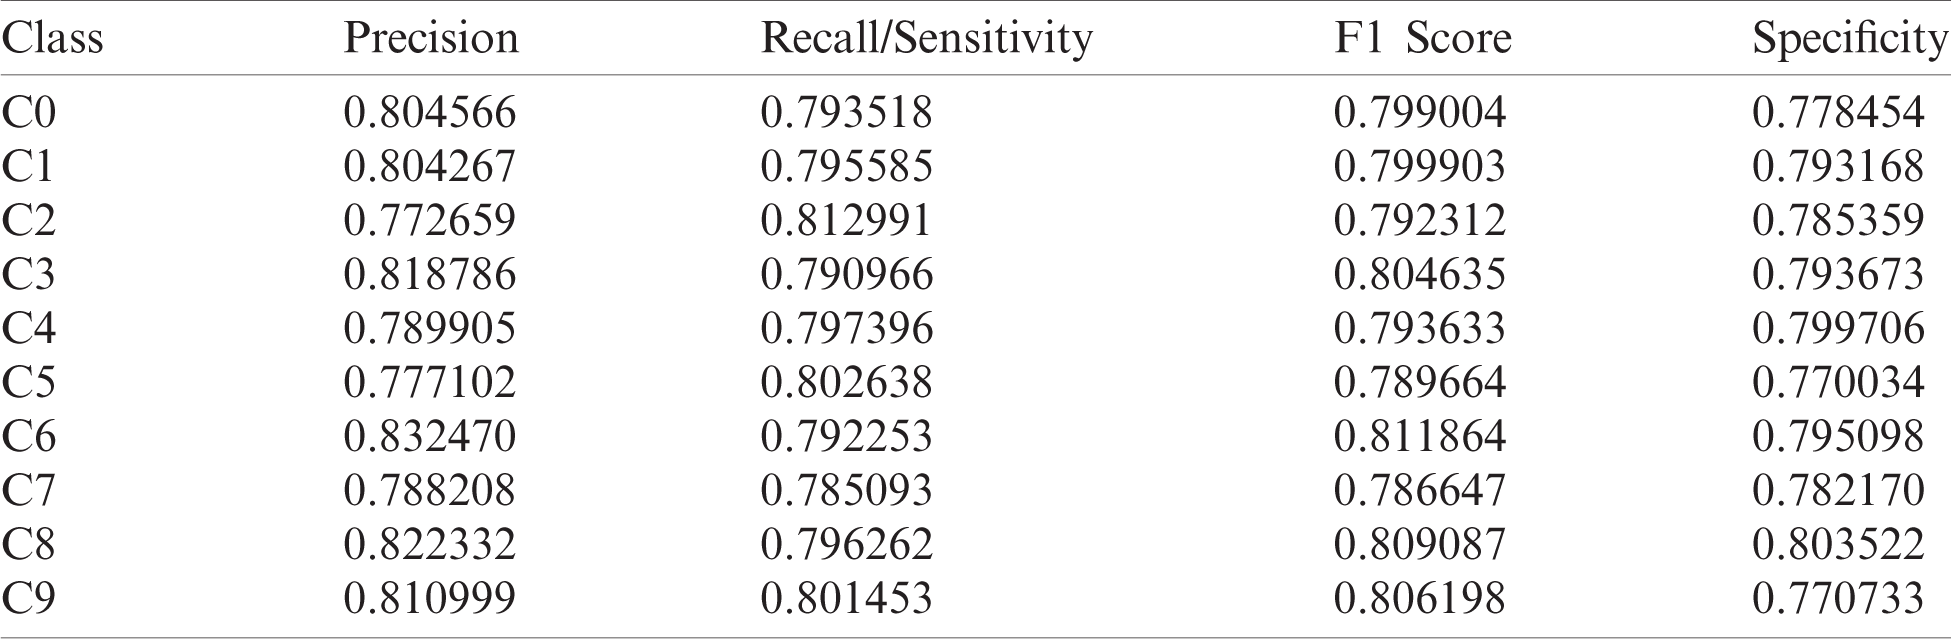
The visualization in Fig. 10 shows the precision, recall/ sensitivity, F1 score, and specificity score for the ResNet model. Overall, this model performed well for all the class labels, especially the C7–C9 class labels. The evaluation metric scores obtained by the Xception model are tabulated in Tab. 3. The visualization of the evaluation metric scores for the Xception model is shown in Fig. 11, where the precision, recall/sensitivity, F1 score, and specificity score are plotted. It can be observed that these scores are lower than those of the ResNet model. The highest precision, recall/sensitivity, and F1 score were observed for the class label C6, while the lowest precision and F1 score were seen in the case of the class label C1, and the lowest recall/sensitivity was observed for the class label C4. The specificity score was highest for the class label C0 and lowest for C5. The evaluation metric scores obtained by the VGG16 model are tabulated in Tab. 4. It can be observed that these scores are lower than those of the ResNet and the Xception models.
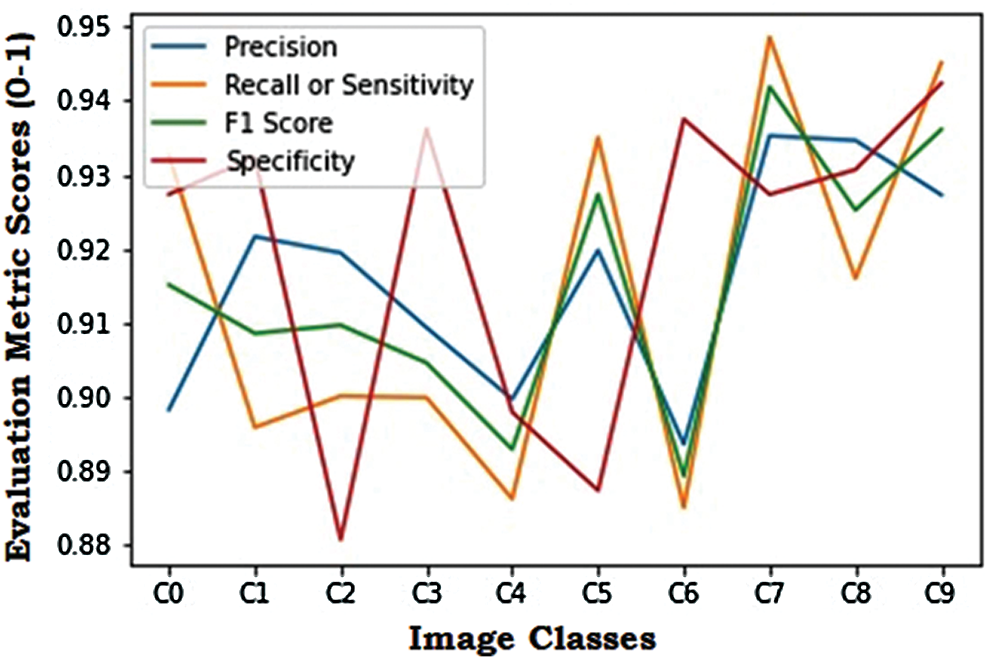
Figure 10: Evaluation metric scores for the ResNet model
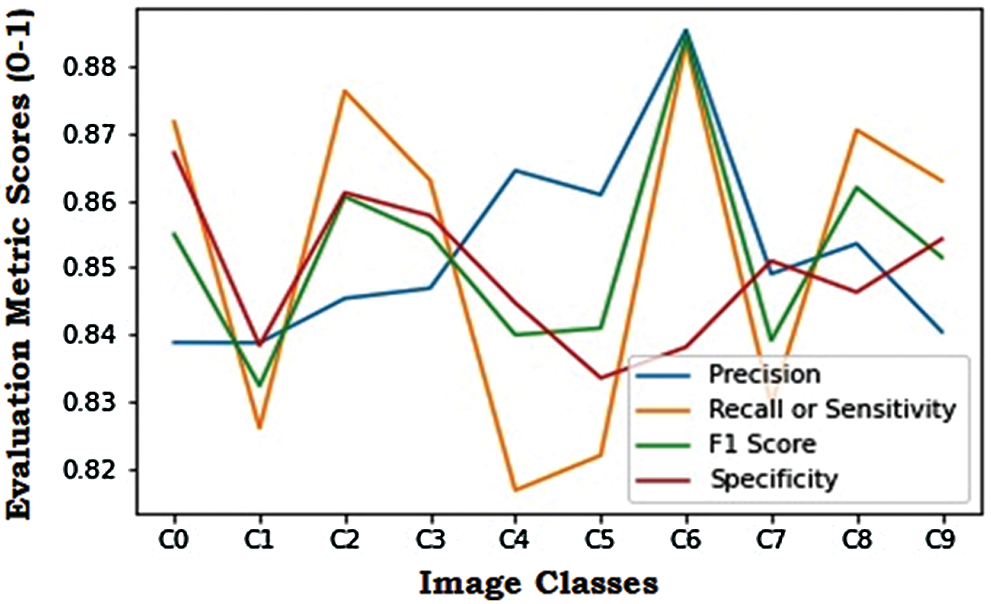
Figure 11: Evaluation metric scores for the Xception model
Table 3: Evaluation metric scores for the Xception model
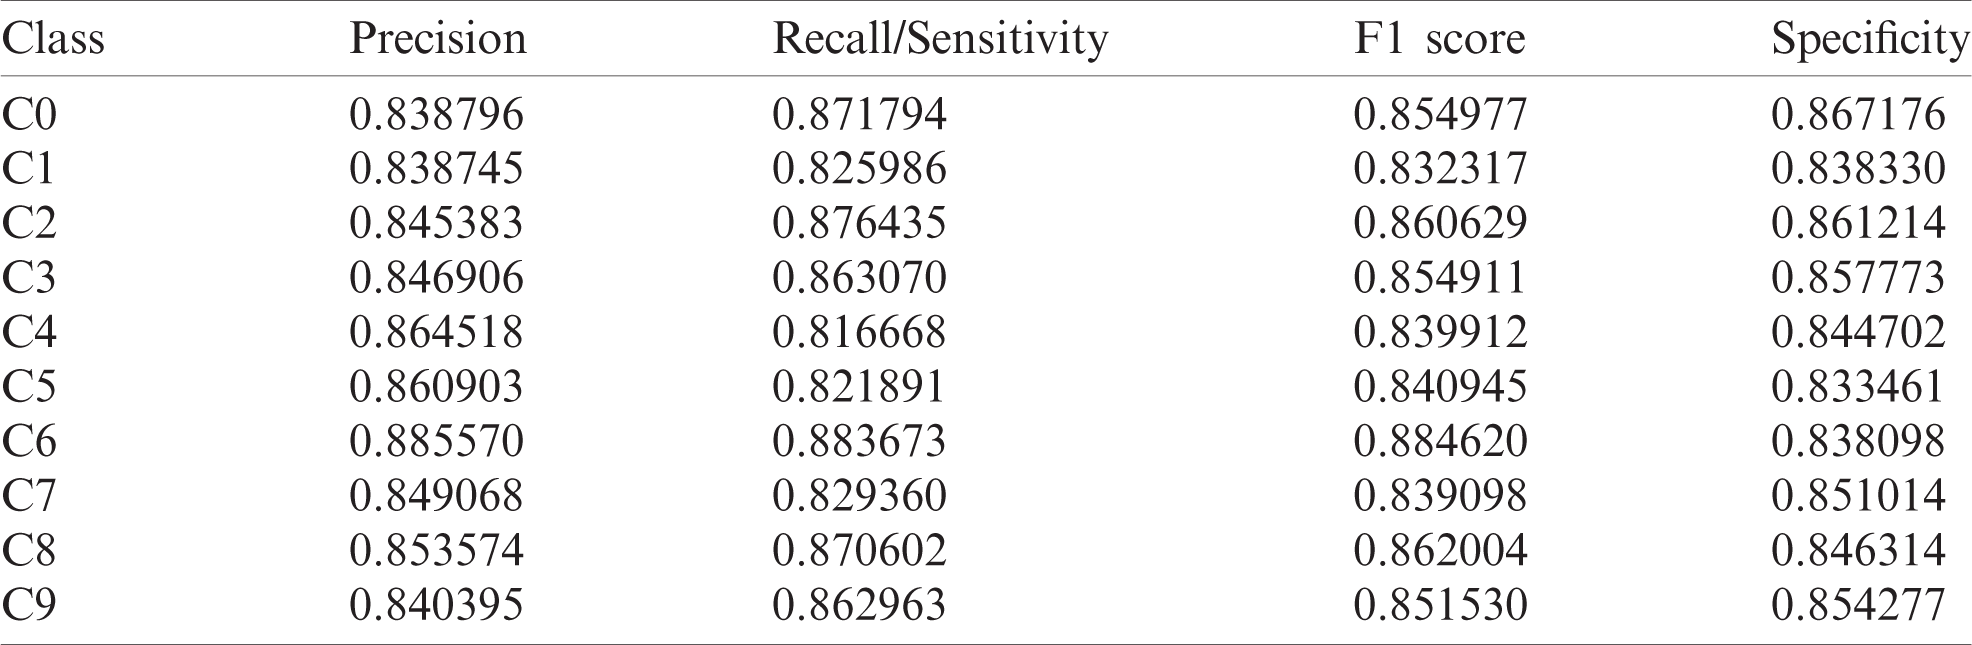
Table 4: Evaluation metric scores for the VGG16 model
The graphical visualization of the evaluation metric scores for the VGG16 model is shown in Fig. 12. The highest precision score was observed for the class label C6, and the lowest was observed for C2. Similarly, the highest recall/sensitivity score was seen in C2, and the lowest was observed for C7. The F1 score was maximum for C6 and minimum for C7. Also, the specificity score was maximum for C8 and minimum for C5. Comparing the evaluation metrics scores shows that the ResNet model provides the most superior performance, followed by the Xception model. Even though the VGG16 model yielded lower evaluation metric scores than the other two models, the results were satisfactory [42–45]. These models can be further optimized to prevent the overfitting issue in the network. Fine-tuning the learning rates or the hyper-parameters and/or adding or removing layers can also optimize the model. The activation functions such as ReLU, Sigmoid, and Softmax functions could also be more efficiently used for achieving better results.
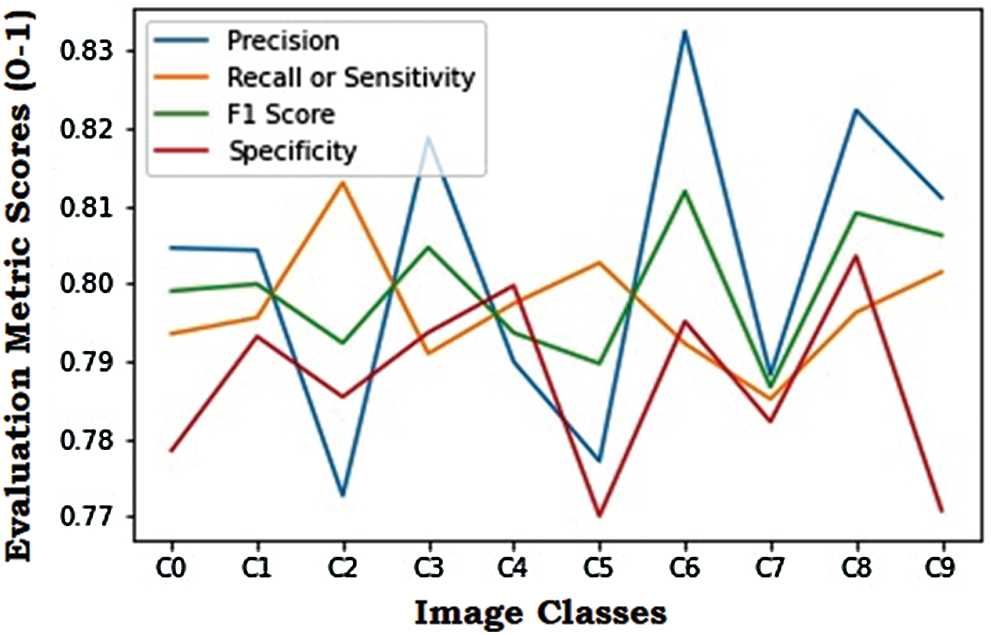
Figure 12: Evaluation metric scores for the VGG16 model
After implementing all the deep CNN models—ResNet, Xception, and VGG16—it can be concluded that the ResNet model provides the most superior performance, followed by Xception and VGG16, respectively. The evaluation metrics used for comparing the models’ performances were the precision score, the recall/sensitivity score, the F1 score, and the specificity score. The dataset consisted of distracted driver images, and this work classified them into ten classes based on the distractions. Even though the VGG16 model is primitive compared to the other two models, it offers satisfactory results. However, as the complexity of the images and the dataset increases, the differences tend to become more prominent, and the superior performance of the ResNet model becomes evident. The advantage of using the ResNet deep CNN architecture for the distracted driver dataset is that the layers are stacked better while having much lesser kernels than in the VGG16 model. The ResNet model is less complicated and can be easily optimized compared to the other networks. Also, this model converges faster and generates better results than other networks. Furthermore, by using the ResNet deep CNN architecture for detecting the driver’s distraction, the system can also create various alerting prototypes in the future by integrating cloud technology, the Internet of Things, and other disciplines. Moreover, alarm systems can be installed to detect the driver’s distraction and ensure road safety. In conclusion, these systems help reduce accidents and guarantee self-awareness in drivers by continuously alerting them.
Funding Statement: The authors received no specific funding for this study.
Conflicts of Interest: The authors declare that they have no conflicts of interest to report regarding the present study.
1. I. Ashraf, S. Hur, M. Shafiq and Y. Park, “Catastrophic factors involved in road accidents: Underlying causes and descriptive analysis,” PLoS one, vol. 14, no. 10, pp. e0223473, 2019. [Google Scholar]
2. V. M. Ramachandiran, P. K. Babu and R. Manikandan, “Prediction of road accidents severity using various algorithms,” International Journal of Pure and Applied Mathematics, vol. 119, pp. 16663–16669, 2018. [Google Scholar]
3. S. Kini, “Road traffic accidents in India: Need for urgent attention and solutions to ensure road safety,” Indian Journal of Forensic Medicine & Toxicology, vol. 13, no. 2, pp. 144–148, 2019. [Google Scholar]
4. I. Ashraf, S. Hur, M. Shafiq and Y. Park, “Catastrophic factors involved in road accidents: Underlying causes and descriptive analysis,” PLoS one, vol. 14, no. 10, pp. e0223473, 2019. [Google Scholar]
5. D. Datta, R. Agarwal and P. E. David, “Performance enhancement of customer segmentation using a distributed python framework, ray,” International Journal of Scientific & Technology Research, vol. 9, no. 11, pp. 130–139, 2020. [Google Scholar]
6. N. A. Golilarz, A. Addeh, H. Gao, L. Ali, A. M. Roshandeh et al., “A new automatic method for control chart patterns recognition based on ConvNet and Harris Hawks meta heuristic optimization algorithm,” IEEE Access, vol. 7, pp. 149398–149405, 2019. [Google Scholar]
7. I. El Maachi, G. A. Bilodeau and W. Bouachir, “Deep 1D-Convnet for accurate Parkinson disease detection and severity prediction from gait,” Expert Systems with Applications, vol. 143, no. 1, pp. 113075, 2020. [Google Scholar]
8. Q. Bi, K. Qin, Z. Li, H. Zhang, K. Xu et al., “A multiple-instance densely-connected ConvNet for aerial scene classification,” IEEE Transactions on Image Processing, vol. 29, pp. 4911–4926, 2020. [Google Scholar]
9. D. Datta and J. Dheeba, “Exploration of various attacks and security measures related to the internet of things,” International Journal of Recent Technology and Engineering, vol. 9, no. 2, pp. 175–184, 2020. [Google Scholar]
10. D. Datta, P. E. David, D. Mittal and A. Jain, “Neural machine translation using recurrent neural network,” International Journal of Engineering and Advanced Technology, vol. 9, no. 4, pp. 1395–1400, 2020. [Google Scholar]
11. B. B. Traore, B. Kamsu-Foguem and F. Tangara, “Deep convolution neural network for image recognition,” Ecological Informatics, vol. 48, no. 17, pp. 257–268, 2018. [Google Scholar]
12. G. Li, H. Tang, Y. Sun, J. Kong, G. Jiang et al., “Hand gesture recognition based on convolution neural network,” Cluster Computing, vol. 22, no. 2, pp. 2719–2729, 2019. [Google Scholar]
13. A. A. M. Al-Saffar, H. Tao and M. A. Talab, “Review of deep convolution neural network in image classification,” in Proc. 2017 Int. Conf. on Radar, Antenna, Microwave, Electronics, and Telecommunications, Oct. 23–26, Jakarta, Indonesia: IEEE, pp. 23– 26, 2017. [Google Scholar]
14. M. Xin and Y. Wang, “Research on image classification model based on deep convolution neural network,” EURASIP Journal on Image and Video Processing, vol. 2019, no. 1, pp. 1–11, article 40, 2019. [Google Scholar]
15. D. Datta and S. B. Jamalmohammed, “Image classification using CNN with multi-core and many-core architecture,” in Applications of Artificial Intelligence for Smart Technology. Pennsylvania, United States: IGI Global, pp. 233–266, 2020. [Google Scholar]
16. G. Jakimovski and D. Davcev, “Using double convolution neural network for lung cancer stage detection,” Applied Sciences, vol. 9, no. 3, pp. 427, 2019. [Google Scholar]
17. H. Lin and S. Jegelka, “Resnet with one-neuron hidden layers is a universal approximator,” Advances in Neural Information Processing Systems, vol. 31, pp. 6169–6178, 2018. [Google Scholar]
18. L. Wen, X. Li and L. Gao, “A transfer convolutional neural network for fault diagnosis based on ResNet-50,” Neural Computing and Applications, vol. 32, no. 10, pp. 1–14, 2019. [Google Scholar]
19. Z. Wu, C. Shen and A. V. D. Hengel, “Wider or deeper: Revisiting the ResNet model for visual recognition,” Pattern Recognition, vol. 90, no. 3, pp. 119–133, 2019. [Google Scholar]
20. I. Z. Mukti and D. Biswas, “Transfer learning based plant diseases detection using ResNet50,” in Proc. 2019 4th Int. Conf. on Electrical Information and Communication Technology, Khulna, Bangladesh, IEEE, pp. 1–6, 2019. [Google Scholar]
21. A. Anand, K. Ridhuparan, G. S. Karthik, R. S. Veer and V. R. Prasath, “Classification of brain tumor using Resnet50,” Solid State Technology, vol. 63, no. 5, pp. 5639–5649, 2020. [Google Scholar]
22. K. He, X. Zhang, S. Ren and J. Sun, “Deep residual learning for image recognition,” in Proc. IEEE Conf. on Computer Vision and Pattern Recognition, June 27–30, Las Vegas, NV, USA, pp. 770–778, 2016. [Google Scholar]
23. W. W. Lo, X. Yang and Y. Wang, “An Xception convolutional neural network for malware classification with transfer learning,” in Proc. 2019 10th IFIP Int. Conf. on New Technologies, Mobility and Security, June 24–26, Canary Islands, Spain: IEEE, pp. 1–5, 2019. [Google Scholar]
24. X. Duan, M. Gou, N. Liu, W. Wang and C. Qin, “High-capacity image steganography based on improved Xception,” Sensors, vol. 20, no. 24, pp. 7253, 2020. [Google Scholar]
25. S. H. Kassani, P. H. Kassani, R. Khazaeinezhad, M. J. Wesolowski, K. A. Schneider et al., “Diabetic retinopathy classification using a modified Xception architecture,” in Proc. 2019 IEEE Int. Symp. on Signal Processing and Information Technology, Ajman, United Arab Emirates: IEEE, pp. 1–6, 2019. [Google Scholar]
26. F. Chollet, “Xception: Deep learning with depthwise separable convolutions,” in Proc. of the IEEE Conference on Computer Vision and Pattern Recognition, July 21–26, Honolulu, HI, USA: IEEE, pp. 1251–1258, 2017. [Google Scholar]
27. M. M. Leonardo, T. J. Carvalho, E. Rezende, R. Zucchi and F. A. Faria, “Deep feature-based classifiers for fruit fly identification (diptera: Tephritidae),” in Proc. 2018 31st SIBGRAPI Conf. on Graphics, Patterns and Images, Oct. 29–Nov. 1, Parana, Brazil: IEEE, pp. 41–47, 2018. [Google Scholar]
28. D. Datta, D. Mittal, N. P. Mathew and J. Sairabanu, “Comparison of performance of parallel computation of CPU cores on CNN model,” in Proc. 2020 Int. Conf. on Emerging Trends in Information Technology and Engineering, Feb. 24–25, Vellore, India: IEEE, pp. 24–25, 2020. [Google Scholar]
29. H. Qassim, A. Verma and D. Feinzimer, “Compressed residual-VGG16 CNN model for big data places image recognition,” in Proc. 2018 IEEE 8th Annual Computing and Communication Workshop and Conf., Jan. 8–10, Las Vegas, NV, USA: IEEE, pp. 8–10, 2018. [Google Scholar]
30. E. Rezende, G. Ruppert, T. Carvalho, A. Theophilo, F. Ramos et al., “Malicious software classification using VGG16 deep neural network’s bottleneck features,” in Information Technology-New Generations. Advances in Intelligent Systems and Computing, S. Latifi (Eds.vol. 738. Cham: Springer, pp. 51–59, 2018. [Google Scholar]
31. B. Liu, X. Zhang, Z. Gao and L. Chen, “Weld defect images classification with VGG16-based neural network,” in Digital TV and Wireless Multimedia Communication. IFTC 2017. Communications in Computer and Information Science, G. Zhai, J. Zhou, X. Yang (Eds.vol. 815. Singapore: Springer, pp. 215–223, 2017. [Google Scholar]
32. H. Wang, “Garbage recognition and classification system based on convolutional neural network VGG16,” in Proc. 2020 3rd Int. Conf. on Advanced Electronic Materials, Computers and Software Engineering, Shenzhen, China: IEEE, pp. 252–255, 2020. [Google Scholar]
33. D. Datta, T. M. Navamani and R. Deshmukh, “Products and movie recommendation system for social networking sites,” International Journal of Scientific & Technology Research, vol. 9, no. 10, pp. 262–270, 2020. [Google Scholar]
34. D. Mishkin, N. Sergievskiy and J. Matas, “Systematic evaluation of convolution neural network advances on the imagenet,” Computer Vision and Image Understanding, vol. 161, no. 2, pp. 11–19, 2017. [Google Scholar]
35. D. Datta, R. Agarwal, I. Tuteja, V. B. Vedula and P. K. Maurya, “Optimization of an automated examination generation system using hybrid recurrent neural network,” International Journal of Interdisciplinary Global Studies, vol. 14, no. 4, pp. 246–255, 2020. [Google Scholar]
36. T. R. Gadekallu, D. S. Rajput, M. P. K. Reddy, K. Lakshmanna, S. Bhattacharya et al., “A novel PCA-whale optimization-based deep neural network model for classification of tomato plant diseases using GPU,” Journal of Real-Time Image Processing, vol. 2, no. 12, pp. 1–14, 2020. [Google Scholar]
37. S. Bhattacharya, P. K. R. Maddikunta, Q. V. Pham, T. R. Gadekallu, C. L. Chowdhary et al., “Deep learning and medical image processing for coronavirus (COVID-19) pandemic: A survey,” Sustainable cities and society, vol. 65, pp. 102–589, 2020. [Google Scholar]
38. R. Shrivastava, P. Kumar, S. Tripathi, V. Tiwari, D. S. Rajput et al., “A novel grid and place neuron’s computational modeling to learn spatial semantics of an environment,” Applied Sciences, vol. 10, no. 15, pp. 5147, 2020. [Google Scholar]
39. S. Venkatraman and M. Alazab, “Use of data visualization for zero-day malware detection,” Security and Communication Networks, vol. 2018, no. 12, pp. 1–13, 2018. [Google Scholar]
40. D. Datta, L. Garg, K. Srinivasan, A. Inoue, G. T. Reddy et al., “An efficient sound and data steganography based secure authentication system,” Computers, Materials & Continua, vol. 67, no. 1, pp. 723–751, 2021. [Google Scholar]
41. G. T. Reddy, M. P. K. Reddy, K. Lakshmanna, R. Kaluri, D. S. Rajput et al., “Analysis of dimensionality reduction techniques on big data,” IEEE Access, vol. 8, pp. 54776–54788, 2020. [Google Scholar]
42. L. Garg, E. Chukwu, N. Nasser, C. Chakraborty and G. Garg, “Anonymity preserving IoT-based COVID-19 and other infectious disease contact tracing model,” IEEE Access, vol. 8, pp. 159402–159414, 2020. [Google Scholar]
43. A. K. Gupta, C. Chakraborty and B. Gupta, “Monitoring of epileptical patients using cloud-enabled health-IoT system,” Traitement du Signal, vol. 36, no. 5, pp. 425–431, 2019. [Google Scholar]
44. C. Chakraborty, B. Gupta and S. K. Ghosh, “Chronic wound characterization using Bayesian classifier under telemedicine framework,” in Medical Imaging: Concepts, Methodologies, Tools, and Applications. Pennsylvania, United States: IGI Global, pp. 741–760, 2017. [Google Scholar]
45. C. Chakraborty, B. Gupta and S. K. Ghosh, “Identification of chronic wound status under tele-wound network through smartphone,” International Journal of Rough Sets and Data Analysis, vol. 2, no. 2, pp. 58–77, 2015. [Google Scholar]
 | This work is licensed under a Creative Commons Attribution 4.0 International License, which permits unrestricted use, distribution, and reproduction in any medium, provided the original work is properly cited. |