DOI:10.32604/cmc.2021.016956
| Computers, Materials & Continua DOI:10.32604/cmc.2021.016956 | |
| Article |
An Improved Jellyfish Algorithm for Multilevel Thresholding of Magnetic Resonance Brain Image Segmentations
1Faculty of Computers and Informatics, Zagazig University, Zagazig, 44519, Egypt
2Department of Mathematics, Faculty of Science, Mansoura University, Mansoura, 35516, Egypt
3Department of Computational Mathematics, Science, and Engineering (CMSE), Michigan State University, East Lansing, MI, 48824, USA
4Capability Systems Centre, School of Engineering and IT, UNSW Canberra, Australia
5Department of Computer Science and Engineering, Soonchunhyang University, Asan, 31538, Korea
*Corresponding Author: Yunyoung Nam. Email: ynam@sch.ac.kr
Received: 16 January 2021; Accepted: 05 March 2021
Abstract: Image segmentation is vital when analyzing medical images, especially magnetic resonance (MR) images of the brain. Recently, several image segmentation techniques based on multilevel thresholding have been proposed for medical image segmentation; however, the algorithms become trapped in local minima and have low convergence speeds, particularly as the number of threshold levels increases. Consequently, in this paper, we develop a new multilevel thresholding image segmentation technique based on the jellyfish search algorithm (JSA) (an optimizer). We modify the JSA to prevent descents into local minima, and we accelerate convergence toward optimal solutions. The improvement is achieved by applying two novel strategies: Ranking-based updating and an adaptive method. Ranking-based updating is used to replace undesirable solutions with other solutions generated by a novel updating scheme that improves the qualities of the removed solutions. We develop a new adaptive strategy to exploit the ability of the JSA to find a best-so-far solution; we allow a small amount of exploration to avoid descents into local minima. The two strategies are integrated with the JSA to produce an improved JSA (IJSA) that optimally thresholds brain MR images. To compare the performances of the IJSA and JSA, seven brain MR images were segmented at threshold levels of 3, 4, 5, 6, 7, 8, 10, 15, 20, 25, and 30. IJSA was compared with several other recent image segmentation algorithms, including the improved and standard marine predator algorithms, the modified salp and standard salp swarm algorithms, the equilibrium optimizer, and the standard JSA in terms of fitness, the Structured Similarity Index Metric (SSIM), the peak signal-to-noise ratio (PSNR), the standard deviation (SD), and the Features Similarity Index Metric (FSIM). The experimental outcomes and the Wilcoxon rank-sum test demonstrate the superiority of the proposed algorithm in terms of the FSIM, the PSNR, the objective values, and the SD; in terms of the SSIM, IJSA was competitive with the others.
Keywords: Magnetic resonance imaging; brain image segmentation; artificial jellyfish search algorithm; ranking method; local minima; Otsu method
Image segmentation has attracted considerable interest due to the need to separate similar regions within an image to facilitate image processing [1] and computer vision [2]. In treating brain tumors, magnetic resonance (MR) images yield invaluable data on tumor location and complexity [3]. However, to provide those benefits, the images must be accurately segmented to allow rapid diagnosis [3]. Segmentation techniques applied to such images include feature selection-based clustering [4], region detection [5], edge detection [6], and threshold segmentation [7].
Segmentation based on thresholding is used commonly for many applications because of its simplicity, ease of implementation, and high segmentation quality. Broadly, threshold segmentation is classified into bi-level thresholding (which only separates an image into a background and foreground) and multilevel thresholding (which is commonly used to separate more than two homogenous objects within an image). The principal problem associated with traditional multilevel thresholding is that the time required grows exponentially with the increasing number of threshold levels (objects) in the segmented image. The traditional techniques used to optimize thresholding are either parametric (using a probability density function to estimate the parameter values of each class in a segmented image) or non-parametric [8] (optimal threshold values are obtained using entropy [9], fuzzy entropy [10], or the Otsu method [11,12]), and must be maximized without the aid of statistical parameters.
Given the time demand when estimating optimal thresholds using traditional techniques, meta-heuristic algorithms, which efficiently solve several optimization problems within reasonable times [13–20], have become widely used to estimate thresholds and several researchers have segmented MR images; some of which are reviewed here. In [3], three methods based on particle swarm optimization (PSO) were used to estimate optimal brain segmentation thresholds for MR images: PSO, the Darwinian PSO (DPSO), and the Functional Order DPSO (FO-DPSO). An adaptive PSO [21] has also been employed to find thresholds, by maximizing the Otsu method. The extracted features were used to train a convolutional neural network to detect brain tumors automatically.
Das et al. [22] segmented MR images using the Quantum-Inspired Modified Genetic Algorithm (QIANA). The modified algorithm was compared with the classical version; the former performed better in terms of the time required and the segmented image quality. Adaptive wind-driven optimization (AWDO) [23] was developed to optimize thresholding of brain MR images utilising the Otsu method as the objective function. AWDO was experimentally compared with other optimization algorithms: The RGA, GA, Nelder–Mead simplex, PSO, BF, and ABF algorithms. In [24], an ant colony optimization algorithm was enhanced (by determining the ant’s direction and the probability of its next location) and used to segment brain MR images and diagnose tumors.
Differential evolution (DE) [25] has been adapted to optimize multilevel thresholding of brain MR images with the performance was improved by employing new mutational methods and a novel adaptive approach to the equilibria of both the exploration and exploitation operators. This adaptive DE was empirically compared with three other DE algorithms using T2-weighted brain MR images; the new algorithm performed best in terms of both computational cost and segmented image quality. Other approaches used for brain MR image segmentation include the hybrid firefly algorithm [26], teaching/learning-based optimization [27], artificial bee colony optimization [28], an adaptive bacterial foraging algorithm [29], and improved quantum PSO [30].
To overcome the attraction to local minima and low convergence speeds that compromise the performance of many algorithms during brain MR image segmentation, we develop here a new, multilevel thresholding method based on the jellyfish search algorithm (JSA) (an optimizer) [31] which has been modified to enhance outcomes. The JSA is simple, easy to implement and modify, and effective in terms of mathematical optimization. Our improved JSA (IJSA) uses a ranking-based update method to prevent descents into local minima and a new adaptive method to widen and deepen exploitation around the best-so-far solution. JSA and IJSA were extensively validated using seven brain MRI images, and compared with each other and some recent robust optimization algorithms, including the marine predator algorithm (MPA) [30], the improved MPA (IMPA) [30], the salp swarm algorithm (SSA) [32], the modified SSA (MSSA) [29], and the equilibrium algorithm (EO) [33]. The experimental data proved that the IJSA was best in terms of the peak signal-to-noise ratio (PSNR), the features similarity index (FSIM), the standard deviation (SD), and fitness; and was competitive in terms of the Structured Similarity Index Metric (SSIM).
The remainder of the paper is organized as follows. Section 2 presents the multi-threshold image segmentation problem using the Otsu method. Section 3 describes the JSA. Section 4 explains the proposed algorithm. Section 5 discusses the outcomes of experiments. Section 6 concludes and discusses future works.
In [11], the Otsu method was used to extract optimal threshold values for an image in which homogenous regions are extracted by maximizing the between-class variances among regions. Mathematically, assume that an image has m + 1 homogenous regions that are mutually separated by m threshold values [
where the
3 The Artificial Jellyfish Search Algorithm (An Optimizer)
Recently, a new meta-heuristic algorithm [31] based on the behaviour of jellyfish, the artificial Jellyfish Search Algorithm (JSA) (an optimizer), was developed for mathematical optimizations. Jellyfish search for food by exploiting both ocean currents and movements within a swarm over time.
In this phase, solutions are efficiently distributed within the search space of the problem to cover all of the space. The algorithm thus does not descend terminally into local minima and we accelerate convergence toward optimal solutions. We evaluated several chaotic maps and sought to optimize population initialization within the search space. The logistic map [34] was optimal.
Early in optimization, the initialized solutions are compared in terms of quality, and the fittest chosen as the food location
r3 is a random number between 0 and 1, and
j is the index of a solution selected at random. To model the trade-off between the ocean current and the passive and active motions, a predefined constant c0 and the time control function mathematically described in Eq. (10) is used, which yields the time control mechanism depicted in Fig. 1.
As shown in Fig. 1, when
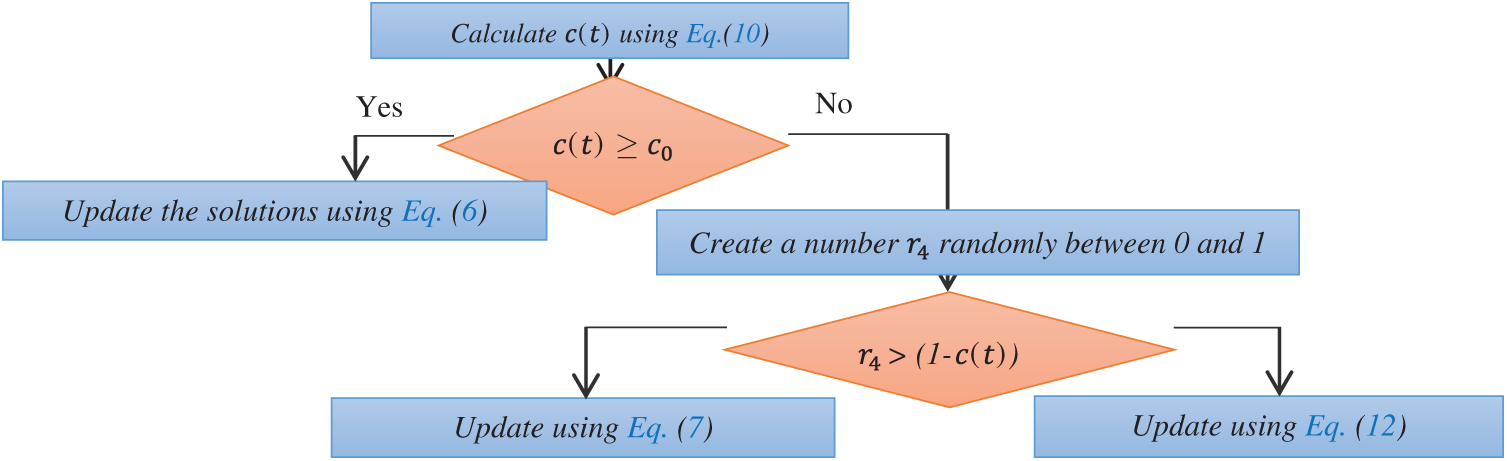
Figure 1: Flowchart of the time control mechanism
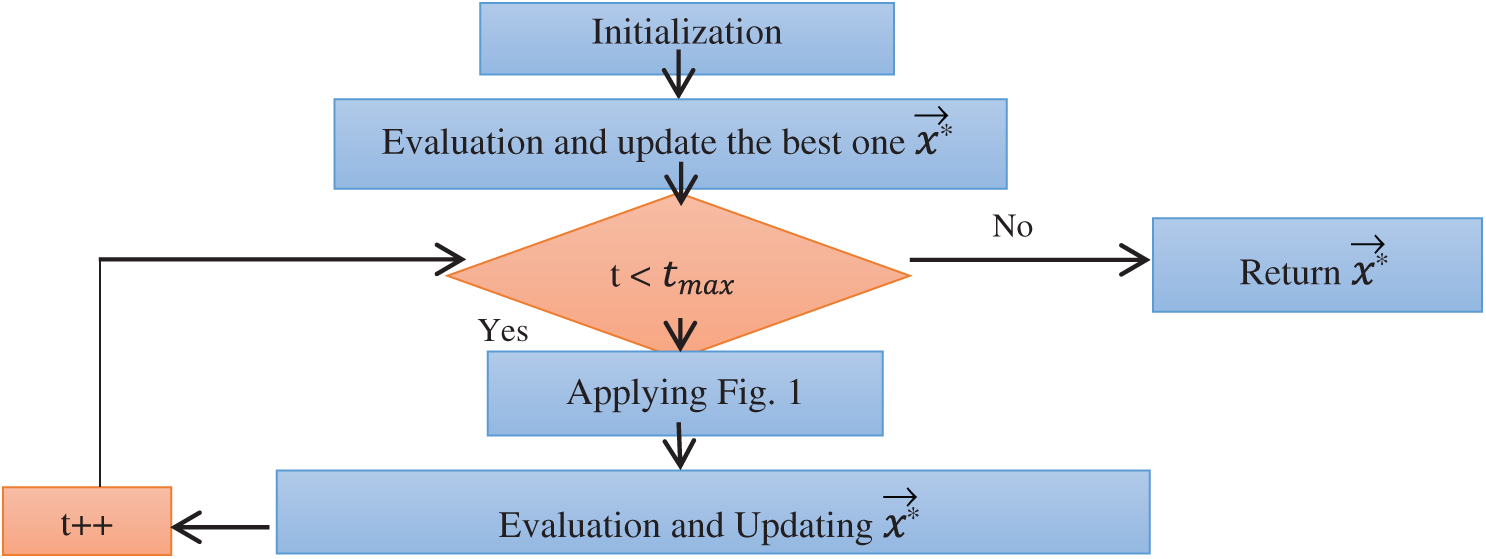
Figure 2: Flowchart of the JSA
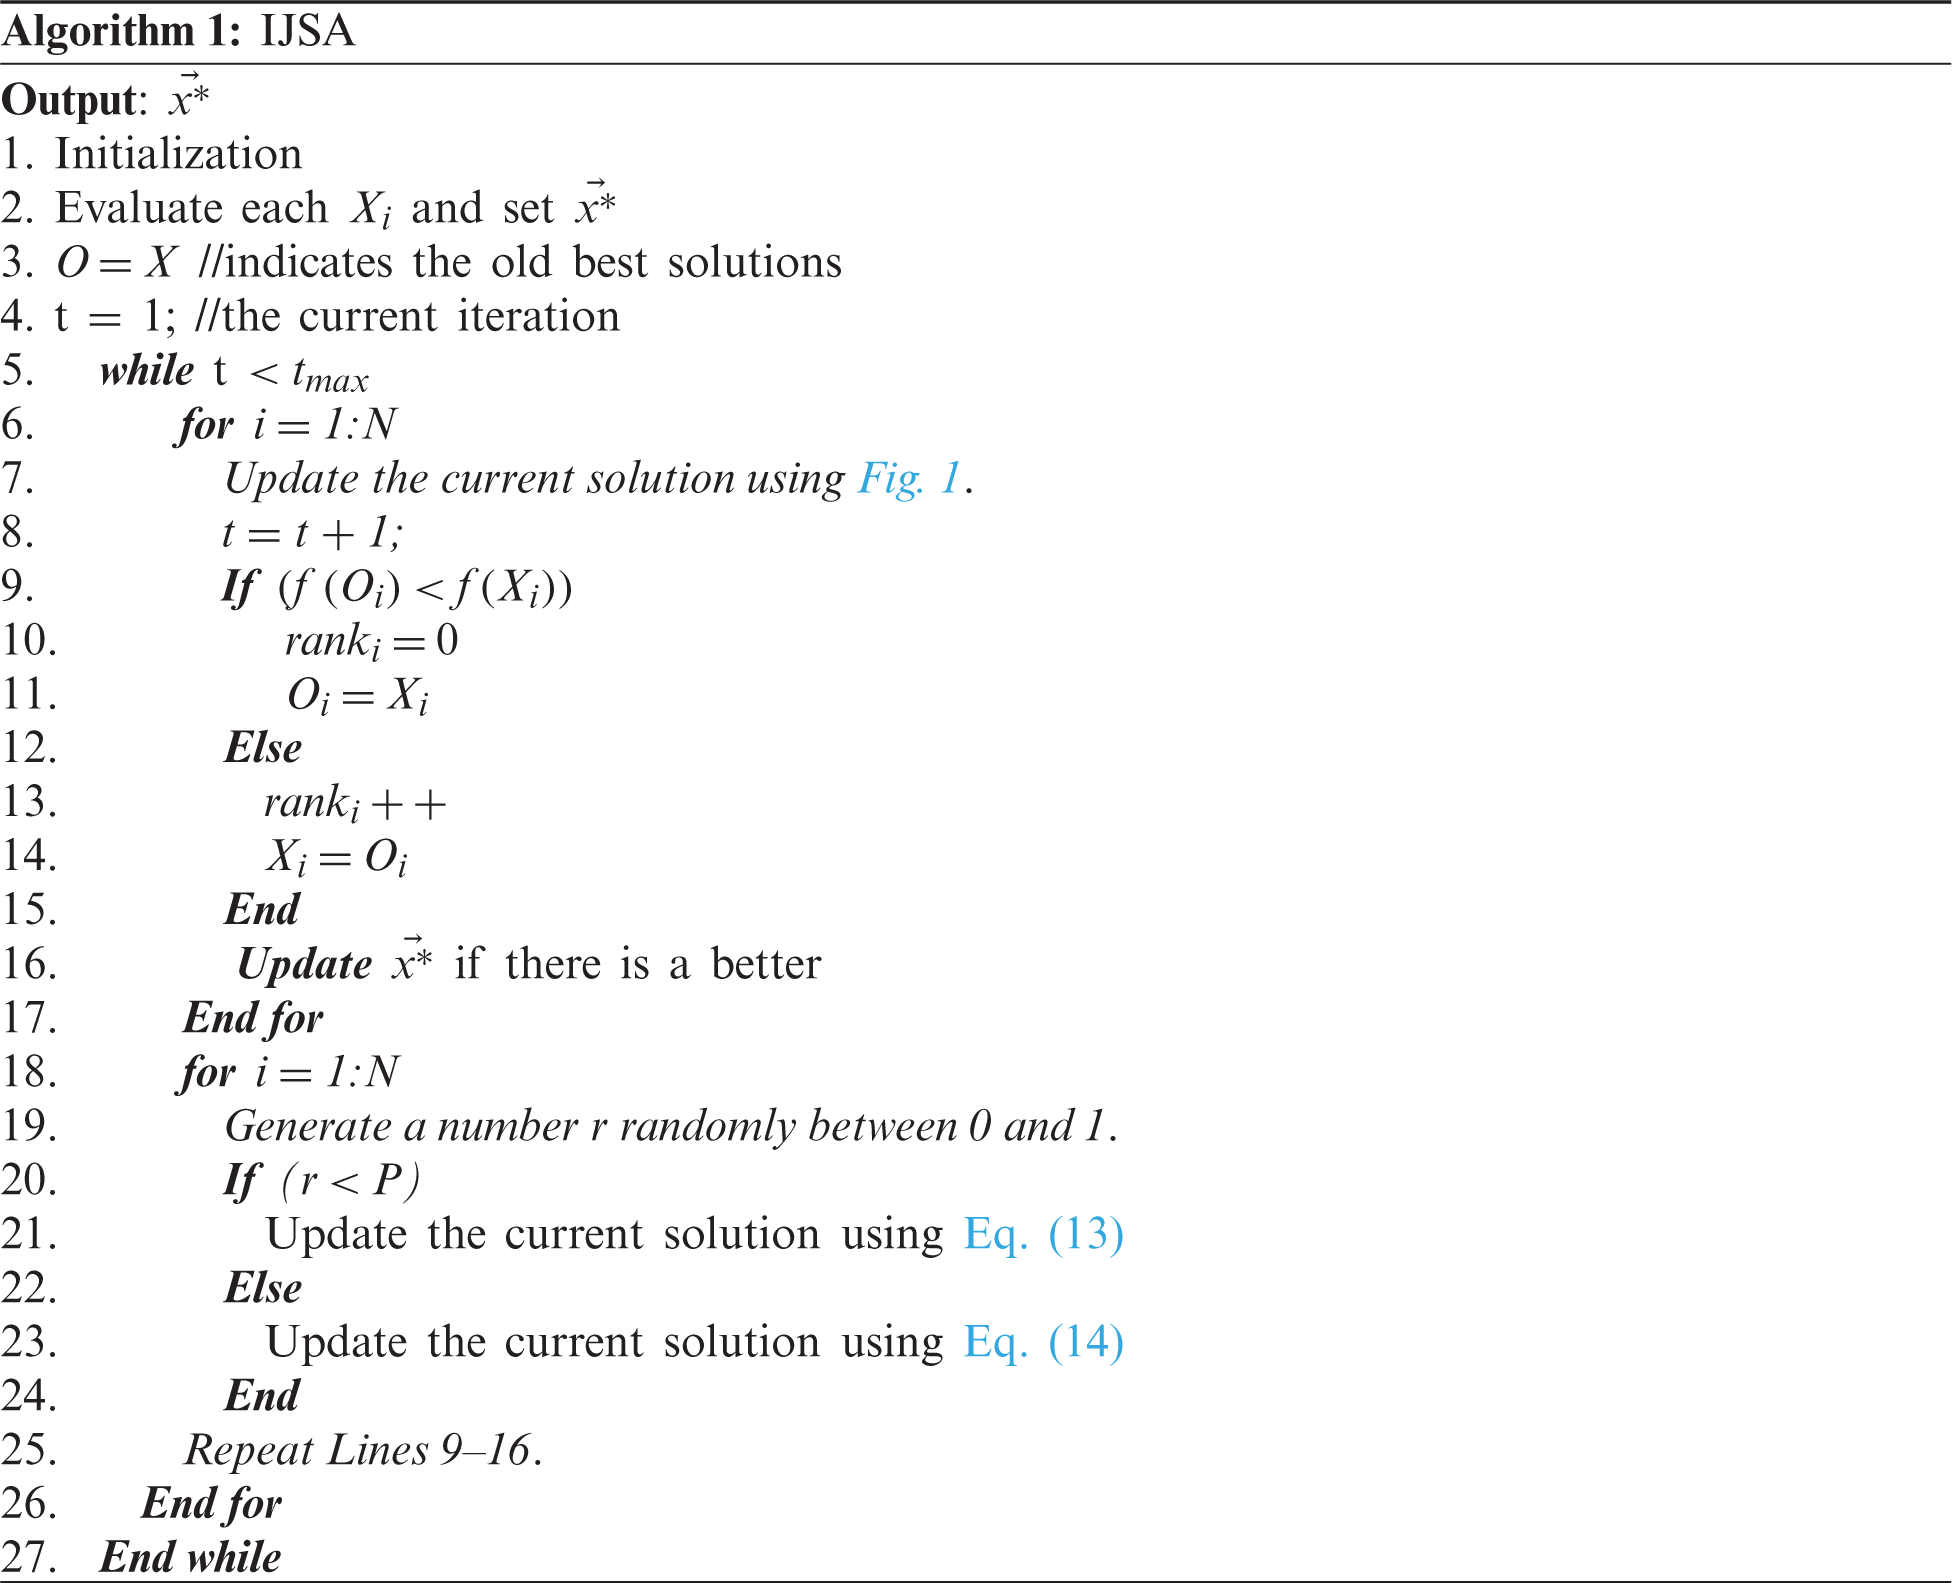
This section discusses IJSA initialization, ranking-based updating, and the use of a novel adaptive strategy.
During initialization, a group of N solutions, each of m dimensions, is randomly generated and randomly initialized within the search space of the problem using Eq. (11):
4.2 Ranking-Based Updating Method (RUM)
Our recently published RUM [30] ranking strategy was here used to replace ineffective solutions with others created by a novel updating scheme. Ineffective solutions are those that remain no better than the current local best solution over NS consecutive iterations. This scheme was used here to search extensively around the best-so-far solutions in efforts to improve the convergence speed and avoid early local minima. The mathematical model is:
We developed a new strategy to facilitate both the exploration and exploitation capacities of the proposed algorithm. The basic algorithm explores extensively, reducing the convergence speed toward the best solution and thus the qualities of the obtained solutions. Using our adaptive strategy, current solutions are updated around the best-so-far solutions at two different step sizes; such exploitation improves the outcomes and reduces the probabilities of descents into local minima. The first step size is based on a random distance between two solutions for a partial population, thus not on all dimensions of the current solutions. The random distance is created between
where
Here, the proposed algorithm is verified and compared to other algorithms using various performance metrics. We used a Windows 10 platform with a 64-bit operating system; an Intel(R) Core (TM) i7-4700MQ CPU@2.40 GHz; 32 GB of RAM; and MATLAB R2019a for implementation.
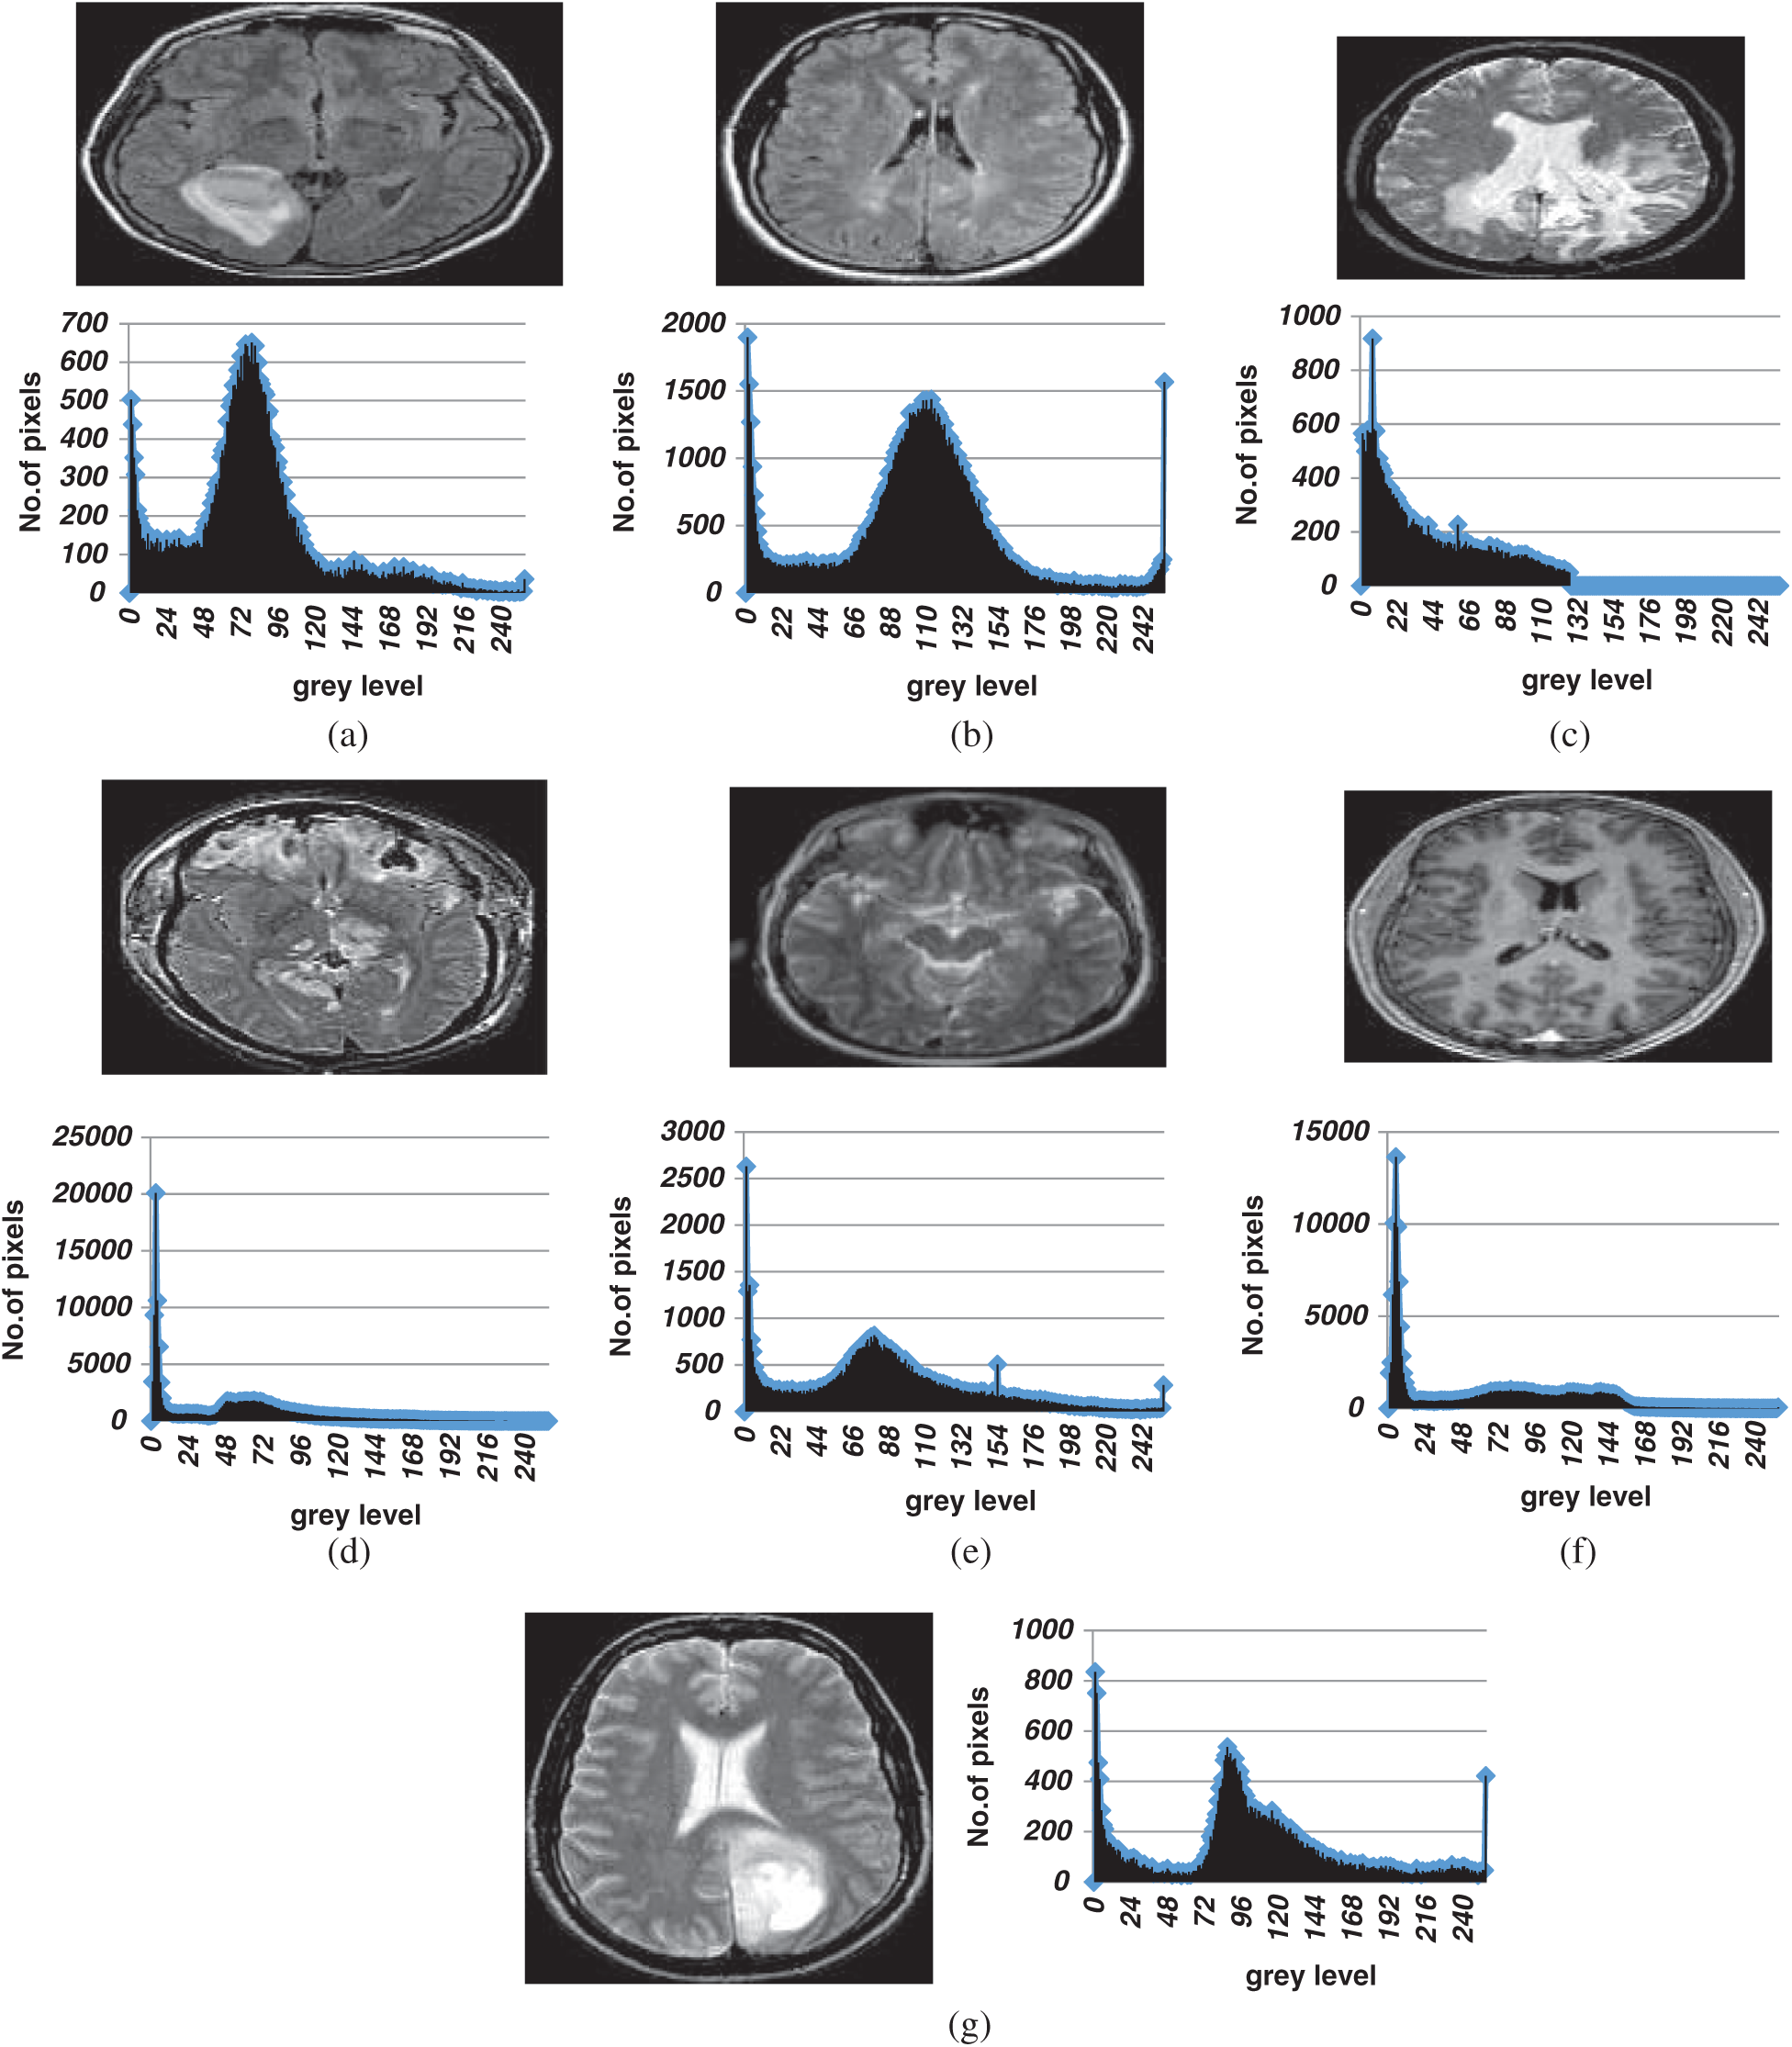
Figure 3: The original images and their histograms (a) Br1 original image (b) Br2 original image (c) Br3 original image (d) Br4 original image (e) Br5 original image (f) Br6 original image (g) Br7 original image
Our proposed algorithm was validated using seven brain MR images with different histograms. We evaluated segmentation at thresholds of 3, 4, 5, 6, 7, 8, 10, 15, 20, 25, and 30. The original images and the histograms are shown in Fig. 3.
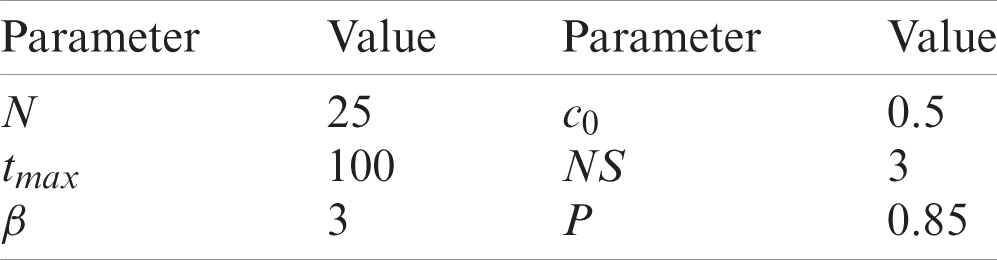
We compared our proposed algorithm with the MPA [30], the improved MPA (IMPA) [30], the SSA [32], the modified SSA (MSSA) [32], and the EO [33]. The parameters used for those algorithms were those of the cited reports. The parameters used for the standard JSA were those of the original report which were also used for IJSA. Additionally, the IJSA requires a parameter P that maximizes performance. We conducted extensive experiments to determine that the best value was 0.85. The N and tmax values were 25 and 100, respectively. The parameters of the proposed algorithm are summarized in Tab. 1.
Table 1: Parameter settings for IJSA and JSA
We used four objective performance criteria to compare algorithms: SD, PSNR, FSIM, and SSIM. The PSNR, SSIM, and FSIM details follow:
• The PSNR [35] metric was used to calculate segmented image quality employing the following equation:
• The SSIM [35] metric was used to measure the difference between the structures of the segmented and source images, thus:
• The FSIM [36] was used to calculate the feature similarity between the segmented and original images. Mathematically, the FSIM is:
where
The best algorithm has the highest PNSR, FSIM, and SSIM values.
5.3 Performance Evaluation of the Proposed Algorithm and Other Algorithms
After running each algorithm 40 times for each test image at each threshold level, the average fitness, PSNR, FSIM, SSIM, and SD values of all test images at various threshold levels were calculated (Figs. 4–8). The IJSA was best in terms of fitness and with regard to PSNR, FSIM, and SD. Unfortunately, it was outperformed by the IMPA and MPA in terms of the SSIM. This is an important limitation that will be addressed in future work. Thus, the IJSA identified thresholds that more accurately and efficiently separated homogenous regions within images than did other algorithms, as revealed by four performance metrics, but not the SSIM. Our proposed algorithm was nonetheless the best because it was optimal in terms of most performance metrics.
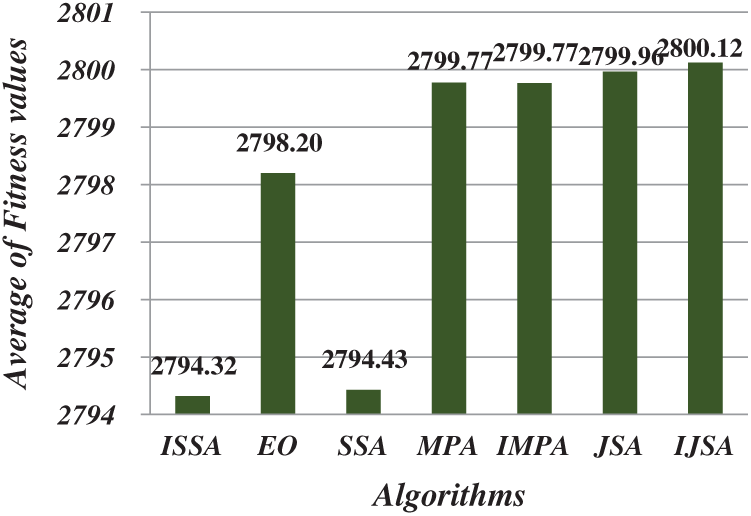
Figure 4: Average of fitness values
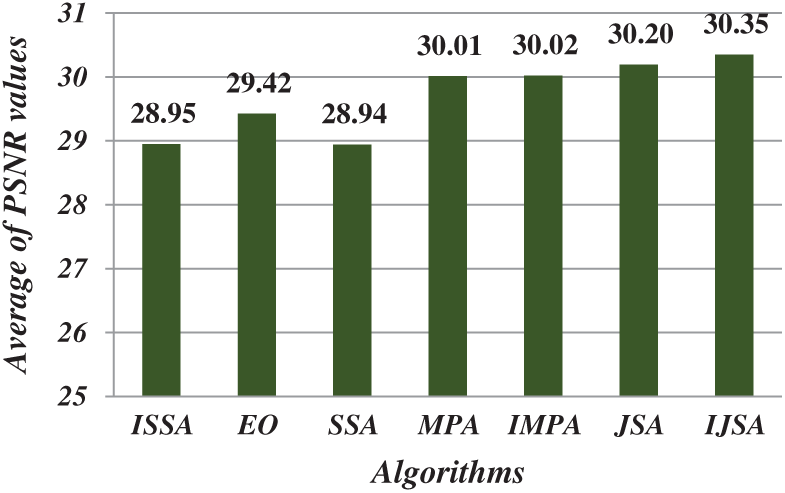
Figure 5: Average of PSNR values
Fig. 9 shows algorithm performances as boxplots of the various threshold levels for the test image Br2. Each algorithm was run 40 times at each threshold level and the fitness values were calculated. The EO, MPA, IMPA, JSA, and IJSA were similarly efficient at threshold levels of 3 and 4. For threshold levels greater than 4, JSA and IJSA were superior in terms of stability; the fitness values converged in terms of the means, maxima, and minima. Furthermore, IJSA outperformed JSA in these measures. IJSA is thus a useful alternative to JSA, attaining thresholds that separate heterogeneous regions within an image.
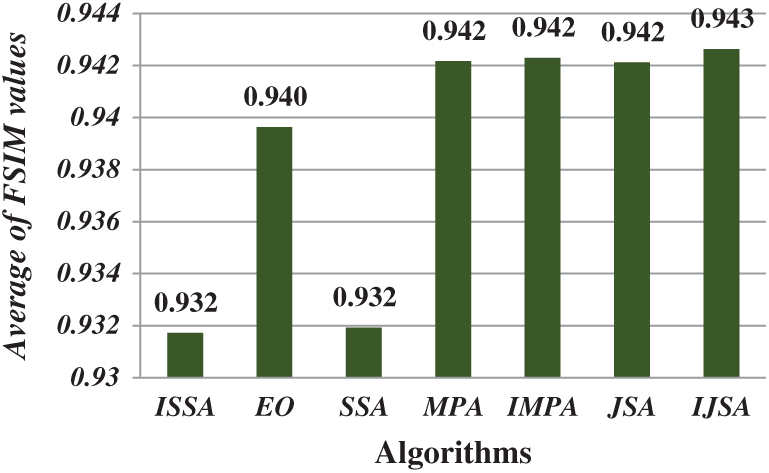
Figure 6: Average of FSIM values
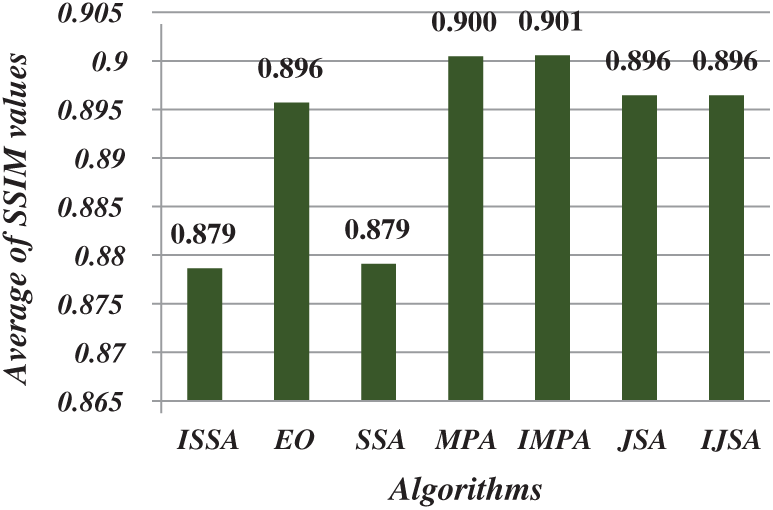
Figure 7: Average of SSIM values
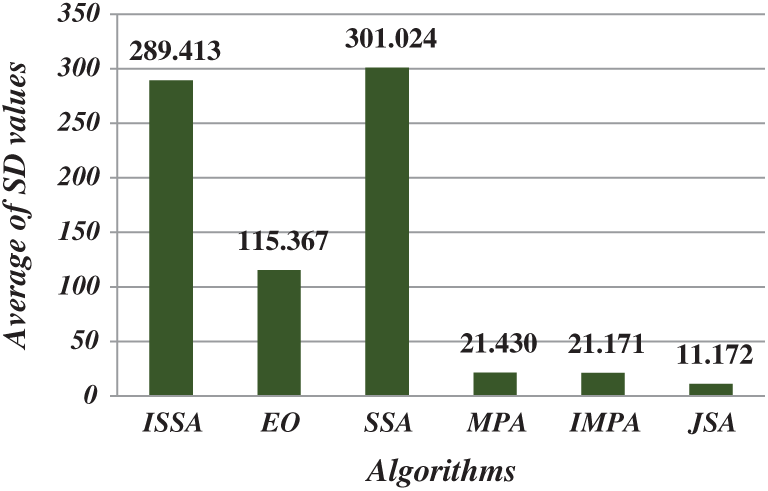
Figure 8: Average of SD values
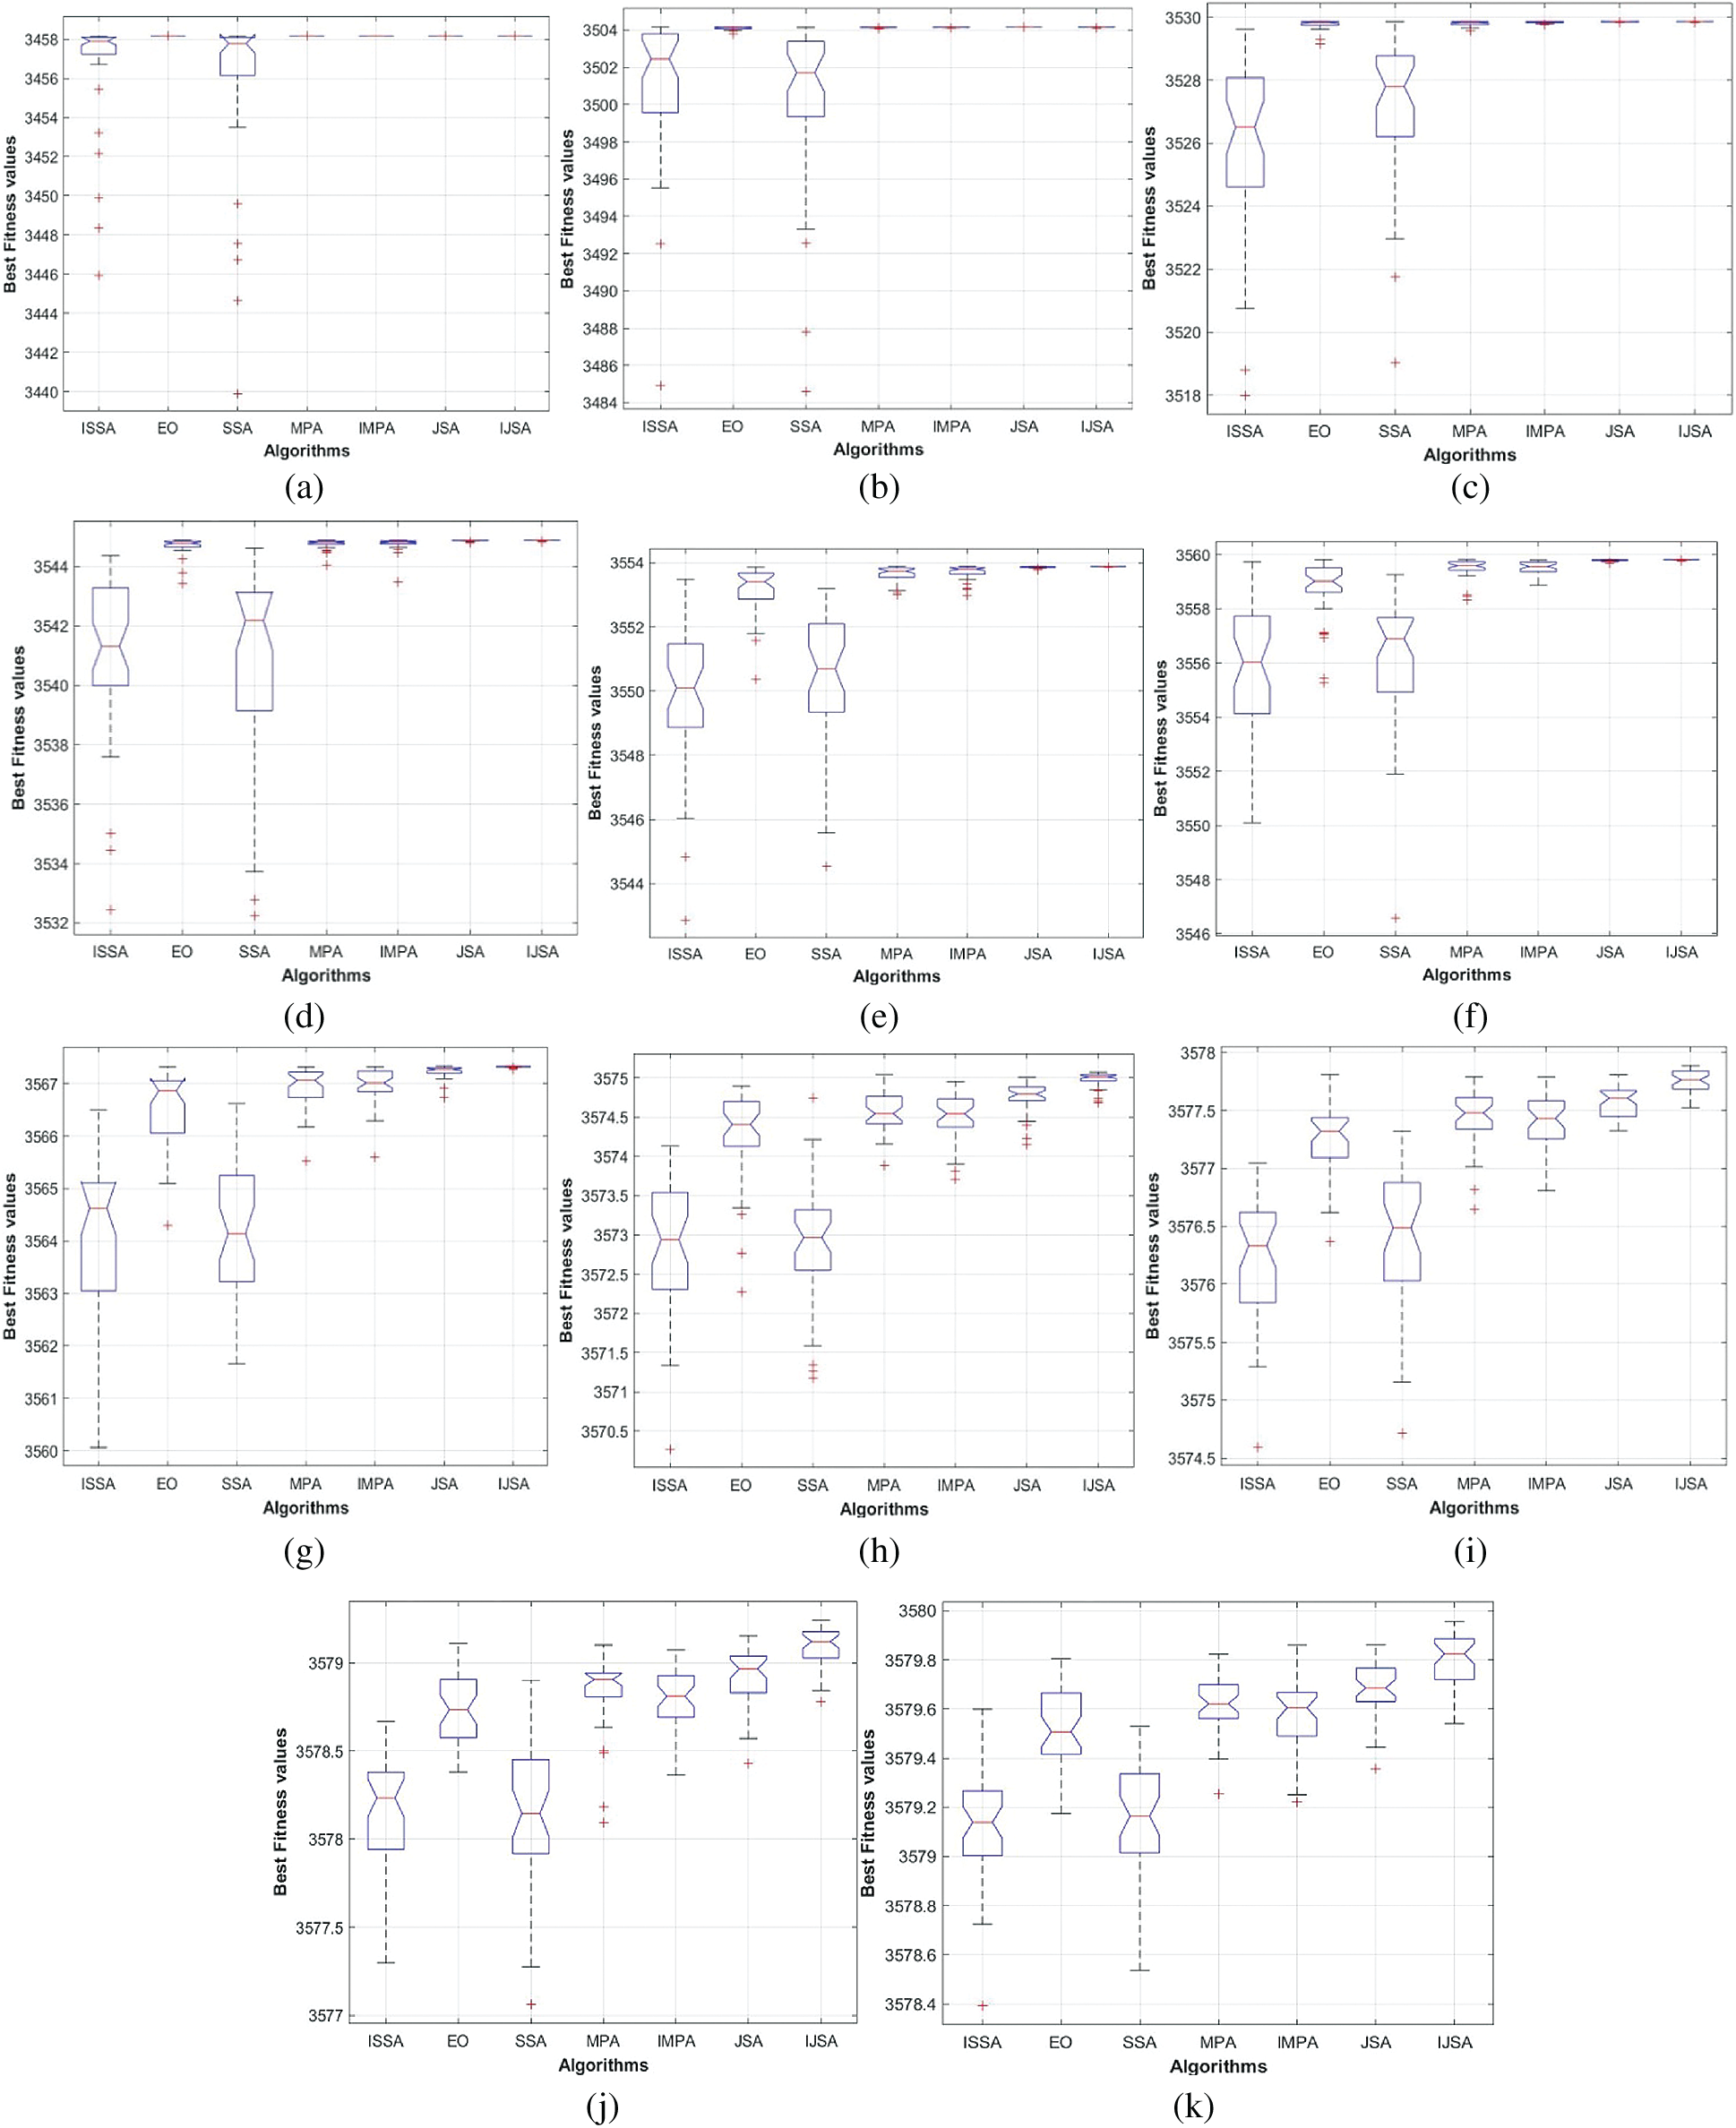
Figure 9: Comparison among algorithms using Boxplot of the fitness values for the Br2 image under various threshold levels. (a) Boxplot for Br2 with
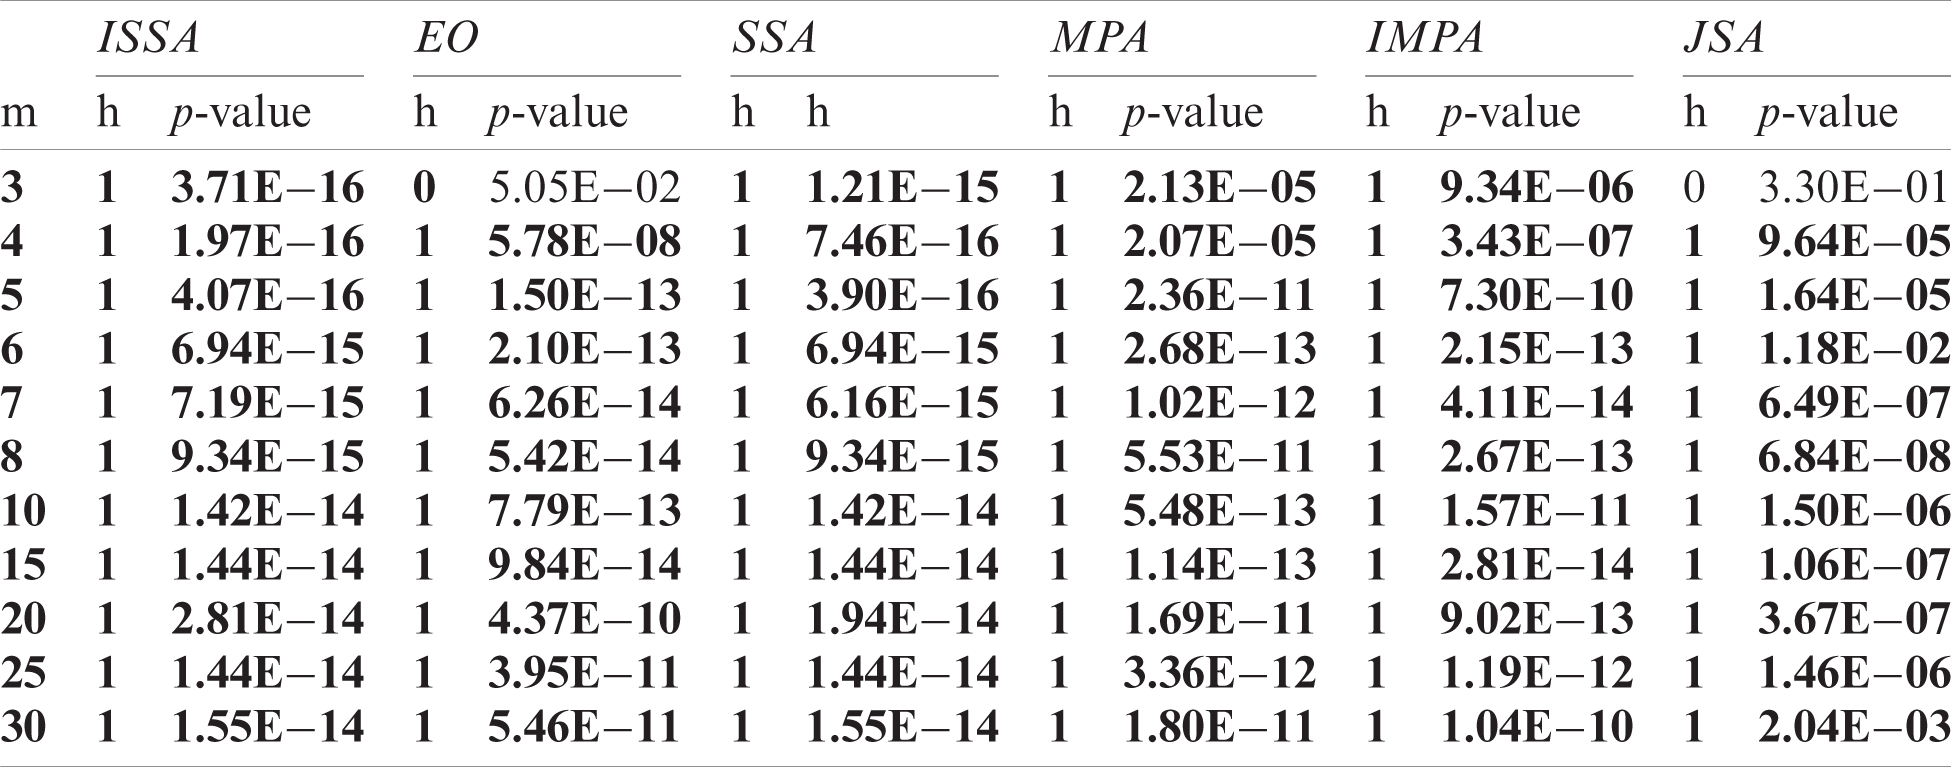
The objective values yielded by each algorithm on 40 independent runs of images Br1, Br9, and Br3 were experimentally compared with those of the IJSA using the Mann-Whitney U-test [38] at a confidence level of 5%, and the outcomes are presented in Tabs. 2–4. The p-value indicates whether the null hypothesis was accepted (the outcomes did not differ) or not (the outcomes differed). This was the case when p < 0.05; otherwise, the null hypothesis is accepted. In the tables, the columns labeled h feature only two values: 0 indicates acceptance of the null hypothesis and 1 non-acceptance. The alternative hypothesis was accepted for most threshold levels, confirming that IJSA was superior to the other algorithms.
Table 2: Comparison of the values of the objective between IJSA and the others using the Mann Whitney U test for Br1 under various m
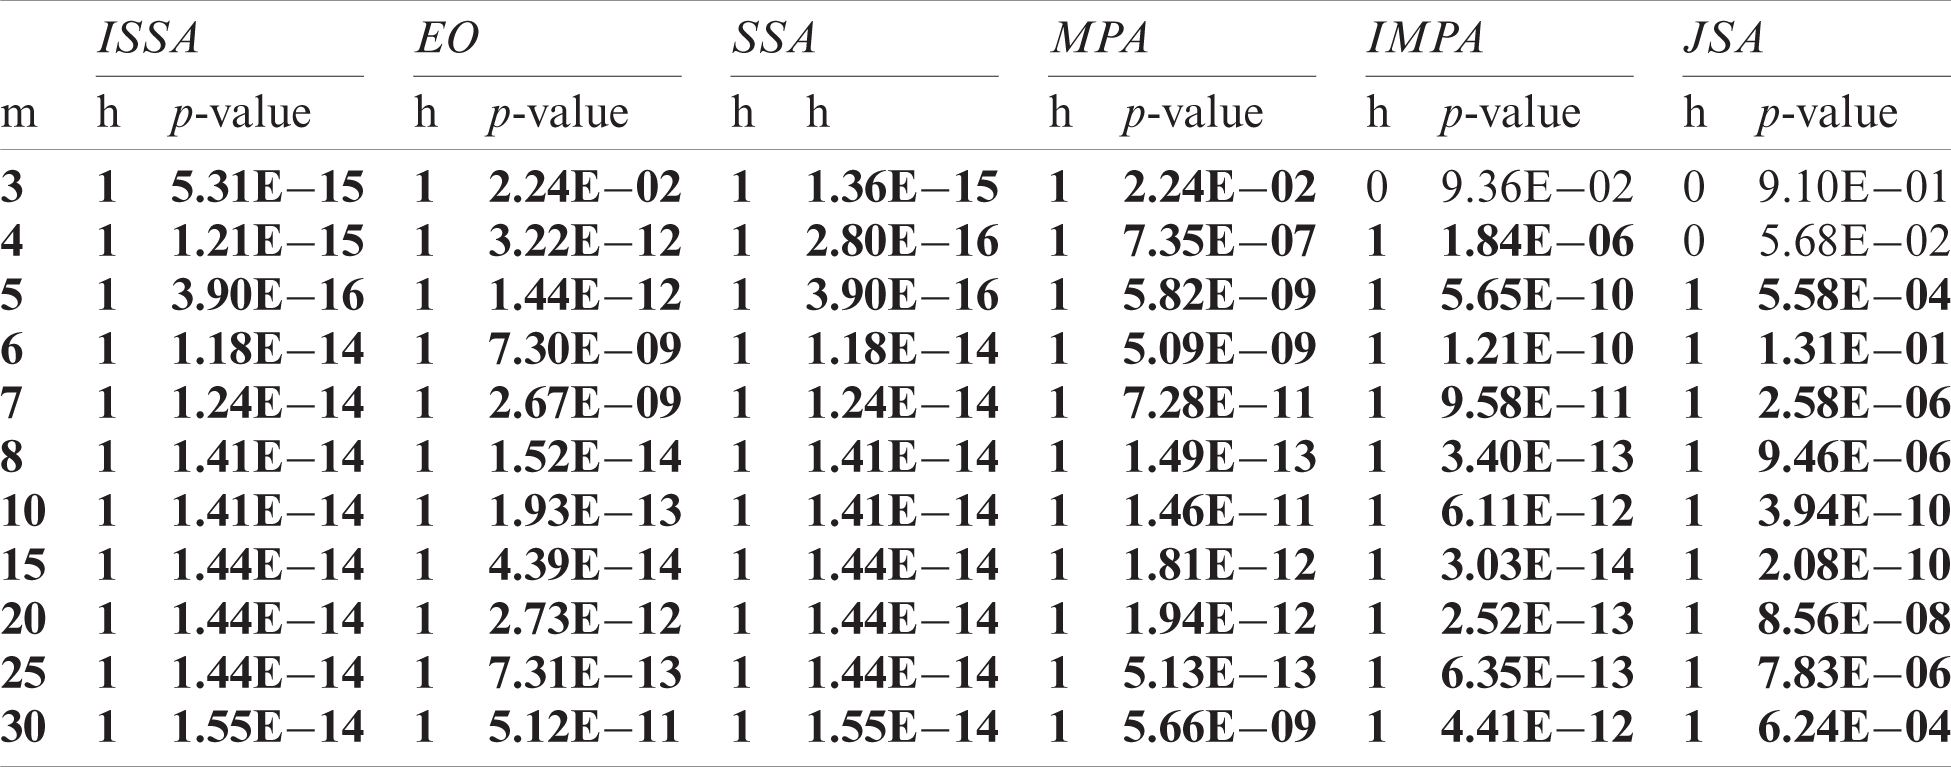
Table 3: Comparison of the values of the objective between IJSA and the others using the Mann Whitney U test for Br9 under various m
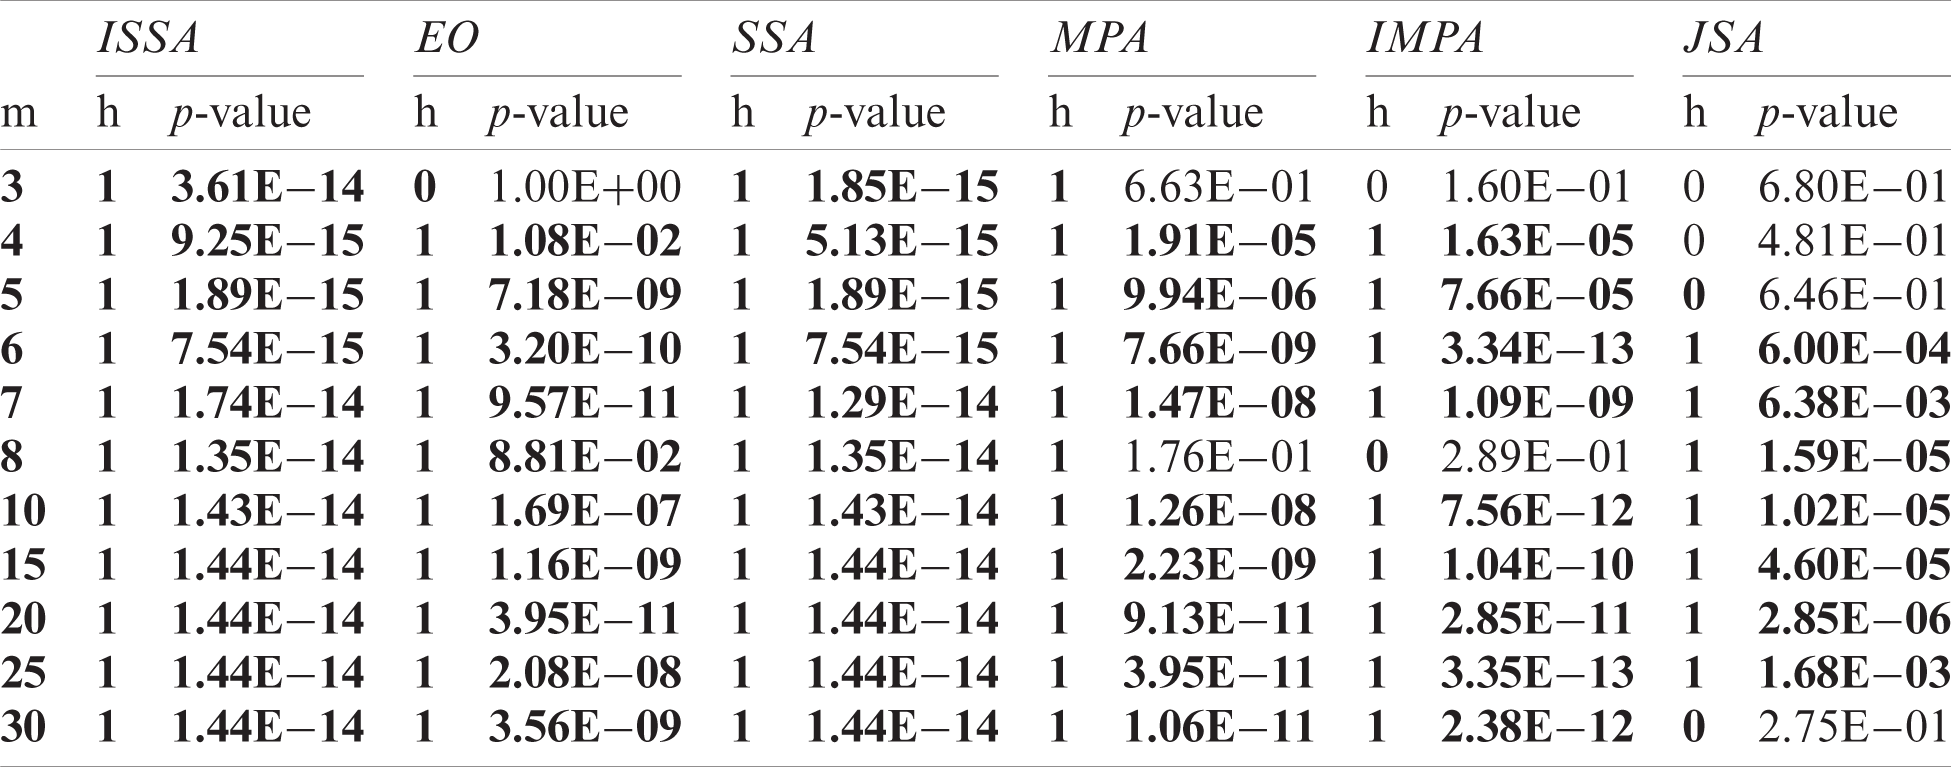
Table 4: Comparison of the values of the objective between IJSA and the others using the Mann Whitney U test for Br3 under various m
We have presented a new medical image segmentation algorithm based on the novel JSA meta-heuristic method, the performance of which was improved to extract the optimal thresholds of brain MR images. The improvement to IJSA was based on two novel strategies: ranking-based updating, and a new adaptive method. Ranking-based updating was used to replace inappropriate solutions within populations with others generated via novel updating to improve the qualities of solutions that were removed. The new adaptive strategy (minimally) promotes JSA exploitation around the best-so-far solution to avoid descents into local minima. The two strategies were integrated effectively with the JSA to yield the IJSA that optimally thresholded brain MR images. Seven brain MR images were segmented at threshold levels of 3, 4, 5, 6, 7, 8, 10, 15, 20, 25, and 30. The IJSA was compared with several recent segmentation algorithms, including the improved and standard MPAs, the modified and standard DDAs, EO, and the standard JSA, in terms of fitness, SSIM, PSNR, SD, and FSIM. The experimental outcomes and the Wilcoxon rank-sum test proved the superiority of the proposed algorithm in terms of all measures except the SSIM, for which the IJSA was competitive. In future work we will link the new algorithm to a conventional neural network to improve the classification accuracy of brain tumor MR images.
Funding Statement: This research was supported by the Korea Institute for Advancement of Technology (KIAT) grant funded by the Korea Government (MOTIE) (P0012724, The Competency Development Program for Industry Specialist) and the Soonchunhyang University Research Fund.
Ethical Approval: This article does not contain any studies with human participants or animals performed by any of the authors.
Conflicts of Interest: The authors declare that they have no conflicts of interest to report regarding the present study.
1. J. Kuruvilla, D. Sukumaran, A. Sankar and S. P. Joy, “A review on image processing and image segmentation,” in 2016 Int. Conf. on Data Mining and Advanced Computing, New York, USA, IEEE, pp. 198–203, 2016. [Google Scholar]
2. R. Muthukrishnan and M. Radha, “Edge detection techniques for image segmentation,” International Journal of Computer Science & Information Technology, vol. 3, no. 6, pp. 259–267, 2011. [Google Scholar]
3. N. D. Indira, K. R. Babu, M. A. Kumar, D. S. Kiran, D. P. Sashank et al., “Brain tumor detection from MRI images using optimization segmentation techniques,” International Journal of Advanced Science and Technology, vol. 29, no. 4, pp. 7858–7865, 2020. [Google Scholar]
4. B. N. Narayanan, R. C. Hardie, T. M. Kebede and M. J. Sprague, “Optimized feature selection-based clustering approach for computer-aided detection of lung nodules in different modalities,” Pattern Analysis and Applications, vol. 22, no. 2, pp. 559–571, 2019. [Google Scholar]
5. A. Aksac, T. Ozyer and R. Alhajj, “Complex networks driven salient region detection based on superpixel segmentation,” Pattern Recognition, vol. 66, no. 1, pp. 268–279, 2017. [Google Scholar]
6. P. Prathusha and S. Jyothi, “A Novel edge detection algorithm for fast and efficient image segmentation,” in Data Engineering and Intelligent Computing, Singapore: Springer, pp. 283–291, 2018. [Google Scholar]
7. J. Han, C. Yang, X. Zhou and W. Gui, “A new multi-threshold image segmentation approach using state transition algorithm,” Applied Mathematical Modelling, vol. 44, no. 1, pp. 588–601, 2017. [Google Scholar]
8. A. Dirami, K. Hammouche, M. Diaf and P. Siarry, “Fast multilevel thresholding for image segmentation through a multiphase level set method,” Signal Processing, vol. 93, no. 1, pp. 139–153, 2013. [Google Scholar]
9. J. N. Kapur, P. K. Sahoo and A. K. Wong, “A new method for gray-level picture thresholding using the entropy of the histogram,” Computer Vision, Graphics, and Image Processing, vol. 29, no. 3, pp. 273–285, 1985. [Google Scholar]
10. D. Oliva, M. Abd Elaziz and S. Hinojosa, “Fuzzy entropy approaches for image segmentation,” in Metaheuristic Algorithms for Image Segmentation: Theory and Applications, Cham: Springer, pp. 141–147, 2019. [Google Scholar]
11. N. Otsu, “A threshold selection method from gray-level histograms,” IEEE Transactions on Systems, Man, and Cybernetics, vol. 9, no. 1, pp. 62–66, 1979. [Google Scholar]
12. A. K. Bhandari and I. V. Kumar, “A context sensitive energy thresholding based 3D Otsu function for image segmentation using human learning optimization,” Applied Soft Computing, vol. 82, no. 1, pp. 105570, 2019. [Google Scholar]
13. M. Abdel-Basset, V. Chang and R. Mohamed, “HSMA_WOA: A hybrid novel Slime mould algorithm with whale optimization algorithm for tackling the image segmentation problem of chest X-ray images,” Applied Soft Computing, vol. 95, no. 1, pp. 106642, 2020. [Google Scholar]
14. M. Abdel-Basset, R. Mohamed, R. K. Chakrabortty, M. Ryan and S. Mirjalili, “New binary marine predators optimization algorithms for 0–1 knapsack problems,” Computers & Industrial Engineering, vol. 151, pp. 106949, 2020. [Google Scholar]
15. M. Abdel-Basset, R. Mohamed, M. Elhoseny, A. K. Bashir, A. Jolfaei et al., “Energy-aware marine predators algorithm for task scheduling in IoT-based fog computing applications,” IEEE Transactions on Industrial Informatics, 2020. https://doi.org/10.1109/TII.2020.3001067. [Google Scholar]
16. M. Abdel-Basset, R. Mohamed, R. K. Chakrabortty, K. Sallam and M. J. Ryan, “An efficient teaching-learning-based optimization algorithm for parameters identification of photovoltaic models: Analysis and validations,” Energy Conversion and Management, vol. 227, no. 1, pp. 113614, 2020. [Google Scholar]
17. M. Abdel-Basset, R. Mohamed, K. M. Sallam, R. K. Chakrabortty and M. J. Ryan, “An efficient-assembler whale optimization algorithm for DNA fragment assembly problem: Analysis and validations,” IEEE Access, vol. 8, no. 1, pp. 222144–222167, 2020. [Google Scholar]
18. M. Abdel-Basset, D. El-Shahat, K. Deb and M. Abouhawwash, “Energy-aware whale optimization algorithm for real-time task scheduling in multiprocessor systems,” Applied Soft Computing, vol. 93, no. 1, pp. 106349, 2020. [Google Scholar]
19. M. Abouhawwash, M. Jameel and K. Deb, “A smooth proximity measure for optimality in multi-objective optimization using Benson’s method,” Computers & Operations Research, vol. 117, no. 1, pp. 104900, 2020. [Google Scholar]
20. M. Abdel-Basset, R. Mohamed and M. Abouhawwash, “Balanced multi-objective optimization algorithm using improvement based reference points approach,” Swarm and Evolutionary Computation, vol. 60, no. 1, pp. 100791, 2021. [Google Scholar]
21. S. Vijh, S. Sharma and P. Gaurav, “Brain tumor segmentation using otsu embedded adaptive particle swarm optimization method and convolutional neural network,” in Data Visualization and Knowledge Engineering, Cham: Springer, pp. 171–194, 2020. [Google Scholar]
22. S. Das, S. De, S. Dey and S. Bhattacharyya, “Magnetic resonance image segmentation using a quantum-inspired modified genetic algorithm (QIANA) based on FRCM,” in Recent Advances in Hybrid Metaheuristics for Data Clustering, pp. 129–150, 2020. https://doi.org/10.1002/9781119551621.ch8. [Google Scholar]
23. S. Kotte, R. K. Pullakura and S. K. Injeti, “Optimal multilevel thresholding selection for brain MRI image segmentation based on adaptive wind driven optimization,” Measurement, vol. 130, no. 1, pp. 340–361, 2018. [Google Scholar]
24. V. Soleimani and F. H. Vincheh, “Improving ant colony optimization for brain MRI image segmentation and brain tumor diagnosis,” in 2013 First Iranian Conf. on Pattern Recognition and Image Analysis, New York, USA, IEEE, pp. 1–6, 2013. [Google Scholar]
25. O. Tarkhaneh and H. Shen, “An adaptive differential evolution algorithm to optimal multi-level thresholding for MRI brain image segmentation,” Expert Systems with Applications, vol. 138, no. 1, pp. 112820, 2019. [Google Scholar]
26. M. K. Alsmadi, “A hybrid firefly algorithm with fuzzy-C mean algorithm for MRI brain segmentation,” American Journal of Applied Sciences, vol. 11, no. 9, pp. 1676–1691, 2014. [Google Scholar]
27. V. Rajinikanth, S. C. Satapathy, S. L. Fernandes and S. Nachiappan, “Entropy based segmentation of tumor from brain MR images-a study with teaching learning based optimization,” Pattern Recognition Letters, vol. 94, no. 1, pp. 87–95, 2017. [Google Scholar]
28. E. Hancer, C. Ozturk and D. Karaboga, “Extraction of brain tumors from MRI images with artificial bee colony based segmentation methodology,” in 2013 8th Int. Conf. on Electrical and Electronics Engineering, New York, USA, IEEE, pp. 516–520, 2013. [Google Scholar]
29. P. D. Sathya and R. Kayalvizhi, “Optimal segmentation of brain MRI based on adaptive bacterial foraging algorithm,” Neurocomputing, vol. 74, no. 14, pp. 2299–2313, 2011. [Google Scholar]
30. M. Abdel-Basset, R. Mohamed, M. Elhoseny, R. K. Chakrabortty and M. Ryan, “A Hybrid COVID-19 detection model using an improved marine predators algorithm and a ranking-based diversity reduction strategy,” IEEE Access, vol. 8, no. 1, pp. 79521–79540, 2020. [Google Scholar]
31. J. S. Chou and D. N. Truong, “A novel metaheuristic optimizer inspired by behavior of jellyfish in ocean,” Applied Mathematics and Computation, vol. 389, no. 1, pp. 125535, 2021. [Google Scholar]
32. S. Wang, H. Jia and X. Peng, “Modified salp swarm algorithm based multilevel thresholding for color image segmentation,” Mathematical Biosciences and Engineering, vol. 17, no. 1, pp. 700–724, 2020. [Google Scholar]
33. M. Abdel-Basset, V. Chang and R. Mohamed, “A novel equilibrium optimization algorithm for multi-thresholding image segmentation problems,” Neural Computing and Applications, vol. 139, no. 2, pp. 1–34, 2020. [Google Scholar]
34. A. H. Gandomi, X. S. Yang, S. Talatahari and A. H. Alavi, “Firefly algorithm with chaos,” Communications in Nonlinear Science and Numerical Simulation, vol. 18, no. 1, pp. 89–98, 2013. [Google Scholar]
35. A. Hore and D. Ziou, “Image quality metrics: PSNR vs. SSIM,” in 2010 20th Int. Conf. on Pattern Recognition, New York, US, IEEE, pp. 2366–2369, 2010. [Google Scholar]
36. L. Zhang, L. Zhang, X. Mou and D. Zhang, “FSIM: A feature similarity index for image quality assessment,” IEEE Transactions on Image Processing, vol. 20, no. 8, pp. 2378–2386, 2011. [Google Scholar]
37. S. Suresh and S. Lal, “An efficient cuckoo search algorithm based multilevel thresholding for segmentation of satellite images using different objective functions,” Expert Systems with Applications, vol. 58, no. 1, pp. 184–209, 2016. [Google Scholar]
38. W. Haynes, “Wilcoxon rank sum test,” Encyclopedia of Systems Biology, vol. 3, no. 1, pp. 2354–2355, 2013. [Google Scholar]
 | This work is licensed under a Creative Commons Attribution 4.0 International License, which permits unrestricted use, distribution, and reproduction in any medium, provided the original work is properly cited. |