DOI:10.32604/cmc.2021.016957
| Computers, Materials & Continua DOI:10.32604/cmc.2021.016957 | |
| Article |
An Approach Using Fuzzy Sets and Boosting Techniques to Predict Liver Disease
1Maulana Azad National Institute of Technology, Bhopal, India
2Central University of Jharkhand, Ranchi, India
3Maulana Azad National Institute of Technology, Bhopal, India
*Corresponding Author: Pushpendra Kumar. Email: pushpendra7589@gmail.com
Received: 16 January 2021; Accepted: 04 March 2021
Abstract: The aim of this research is to develop a mechanism to help medical practitioners predict and diagnose liver disease. Several systems have been proposed to help medical experts by diminishing error and increasing accuracy in diagnosing and predicting diseases. Among many existing methods, a few have considered the class imbalance issues of liver disorder datasets. As all the samples of liver disorder datasets are not useful, they do not contribute to learning about classifiers. A few samples might be redundant, which can increase the computational cost and affect the performance of the classifier. In this paper, a model has been proposed that combines noise filter, fuzzy sets, and boosting techniques (NFFBTs) for liver disease prediction. Firstly, the noise filter (NF) eliminates the outliers from the minority class and removes the outlier and redundant pair from the majority class. Secondly, the fuzzy set concept is applied to handle uncertainty in datasets. Thirdly, the AdaBoost boosting algorithm is trained with several learners viz, random forest (RF), support vector machine (SVM), logistic regression (LR), and naive Bayes (NB). The proposed NFFBT prediction system was applied to two datasets (i.e., ILPD and MPRLPD) and found that AdaBoost with RF yielded 90.65% and 98.95% accuracy and F1 scores of 92.09% and 99.24% over ILPD and MPRLPD datasets, respectively.
Keywords: Fuzzy set; imbalanced data; liver disease prediction; machine learning; noise filter
Liver diseases are the leading cause of death in India and across the world. Approximately two million people die annually because of liver disease throughout the world. In India alone, 216,865 people died from liver disease in 2014, representing 2.44% of all deaths in the country. In 2017, the number of deaths increased to 259,749, representing 2.95% of all deaths [1].
Diagnosing liver disease in its early stages is a complicated task, as the liver continues to perform normally until it is severely damaged [2]. The diagnosis and treatment of liver disease are performed by medical experts. However, inappropriate treatment sometimes wastes time and money and causes the loss of life. Consequently, the development of an efficient and automatic liver disease prediction system is necessary for efficient and early diagnosis. Automated liver prediction systems take advantage of the data generated from the liver function test (LFT). This system can support the medical practitioner in diagnosing liver disease with less effort and more accuracy. The classification technique of a machine learning algorithm is applied when developing automated disease prediction systems [3,4]. The purpose of the classification algorithm is to predict the class label of an unknown instance [5] and work adequately when the instances of the dataset are uniformly distributed among all the classes (balanced) [6]. Most healthcare datasets, such as those for breast cancer [7,8], heartbeat [9], diabetes [10–13], kidney [14], and liver disorders [15–17], involve class imbalance. The standard classification performs poorly when a dataset is not uniformly distributed among all the classes (imbalanced) because minority class data are classified as majority class data [18–20].
Four procedures have been proposed to mitigate the issues related to class imbalance. These are (a) algorithm modifications, (b) a sampling-based technique, (c) a cost-sensitive approach, and (d) ensemble learning techniques.
Algorithm modifications: This procedure adjusts the conventional algorithm by biasing the learning to find a solution to the imbalance problem [21]. This strategy does not disturb the original pattern of the data, whereas this methodology requires an awareness of the corresponding classifier and application [21,22].
Sampling-based technique (SBT) [23–26]: Sampling can be accomplished either by oversampling or undersampling. Oversampling adds new or duplicate records to the minority class until the desired class proportion is obtained, whereas undersampling removes records from the majority class until the desired class ratio is achieved. The disadvantage of undersampling is that information may be lost if significant data are removed, while its advantage is that it decreases learning times by reducing the learning data size. Oversampling suffers from overfitting and increased model learning times.
Cost-sensitive approach: This approach utilizes the variable cost matrix for instances that are misclassified by the model. The cost of misclassification needs to be defined in this approach, which is not usually given in datasets [24,25,27,28].
Ensemble learning techniques (ELT): Reference [29] Ensemble learning (EL) uses multiple learning algorithms to accomplish the same task. ETL has a better classification and generalization ability than machine learners that use a single learner. In recent times, an EL that combines ELT and SBT gained recognition for its ability to solve class imbalance issues.
The objective of this work is to develop a noise filter, fuzzy sets, and boosting technique (NFFBT) approach to predict liver disorder. The proposed NFFBT approach aids medical practitioners in interpreting the consequences of LFT. Existing liver disorder detection techniques mostly apply the boosting technique to handle imbalanced issues of LFT datasets only. Meanwhile, the proposed NFFBT approach applies a noise filter to eliminate all noise from the majority and minority classes. This preserves the dataset’s characteristics and reduces the model’s training time. Then, the fuzzification system—which eliminates the uncertainty in the relationship among the features of datasets—and the AdaBoost boosting algorithm are applied with different classifiers to handle issues of class imbalance. The architecture of the noise filter is shown in Fig. 1.
The rest of this paper is arranged as follows. Section 2 discusses related works and the authors’ vested motivation for this research work. A description of the proposed methodology for NFFBT development is presented in Section 3. The results and discussion are presented in Section 4. Finally, a summary of the findings and the conclusions of this research work are given in Section 5.

Figure 1: Architecture of noise filter
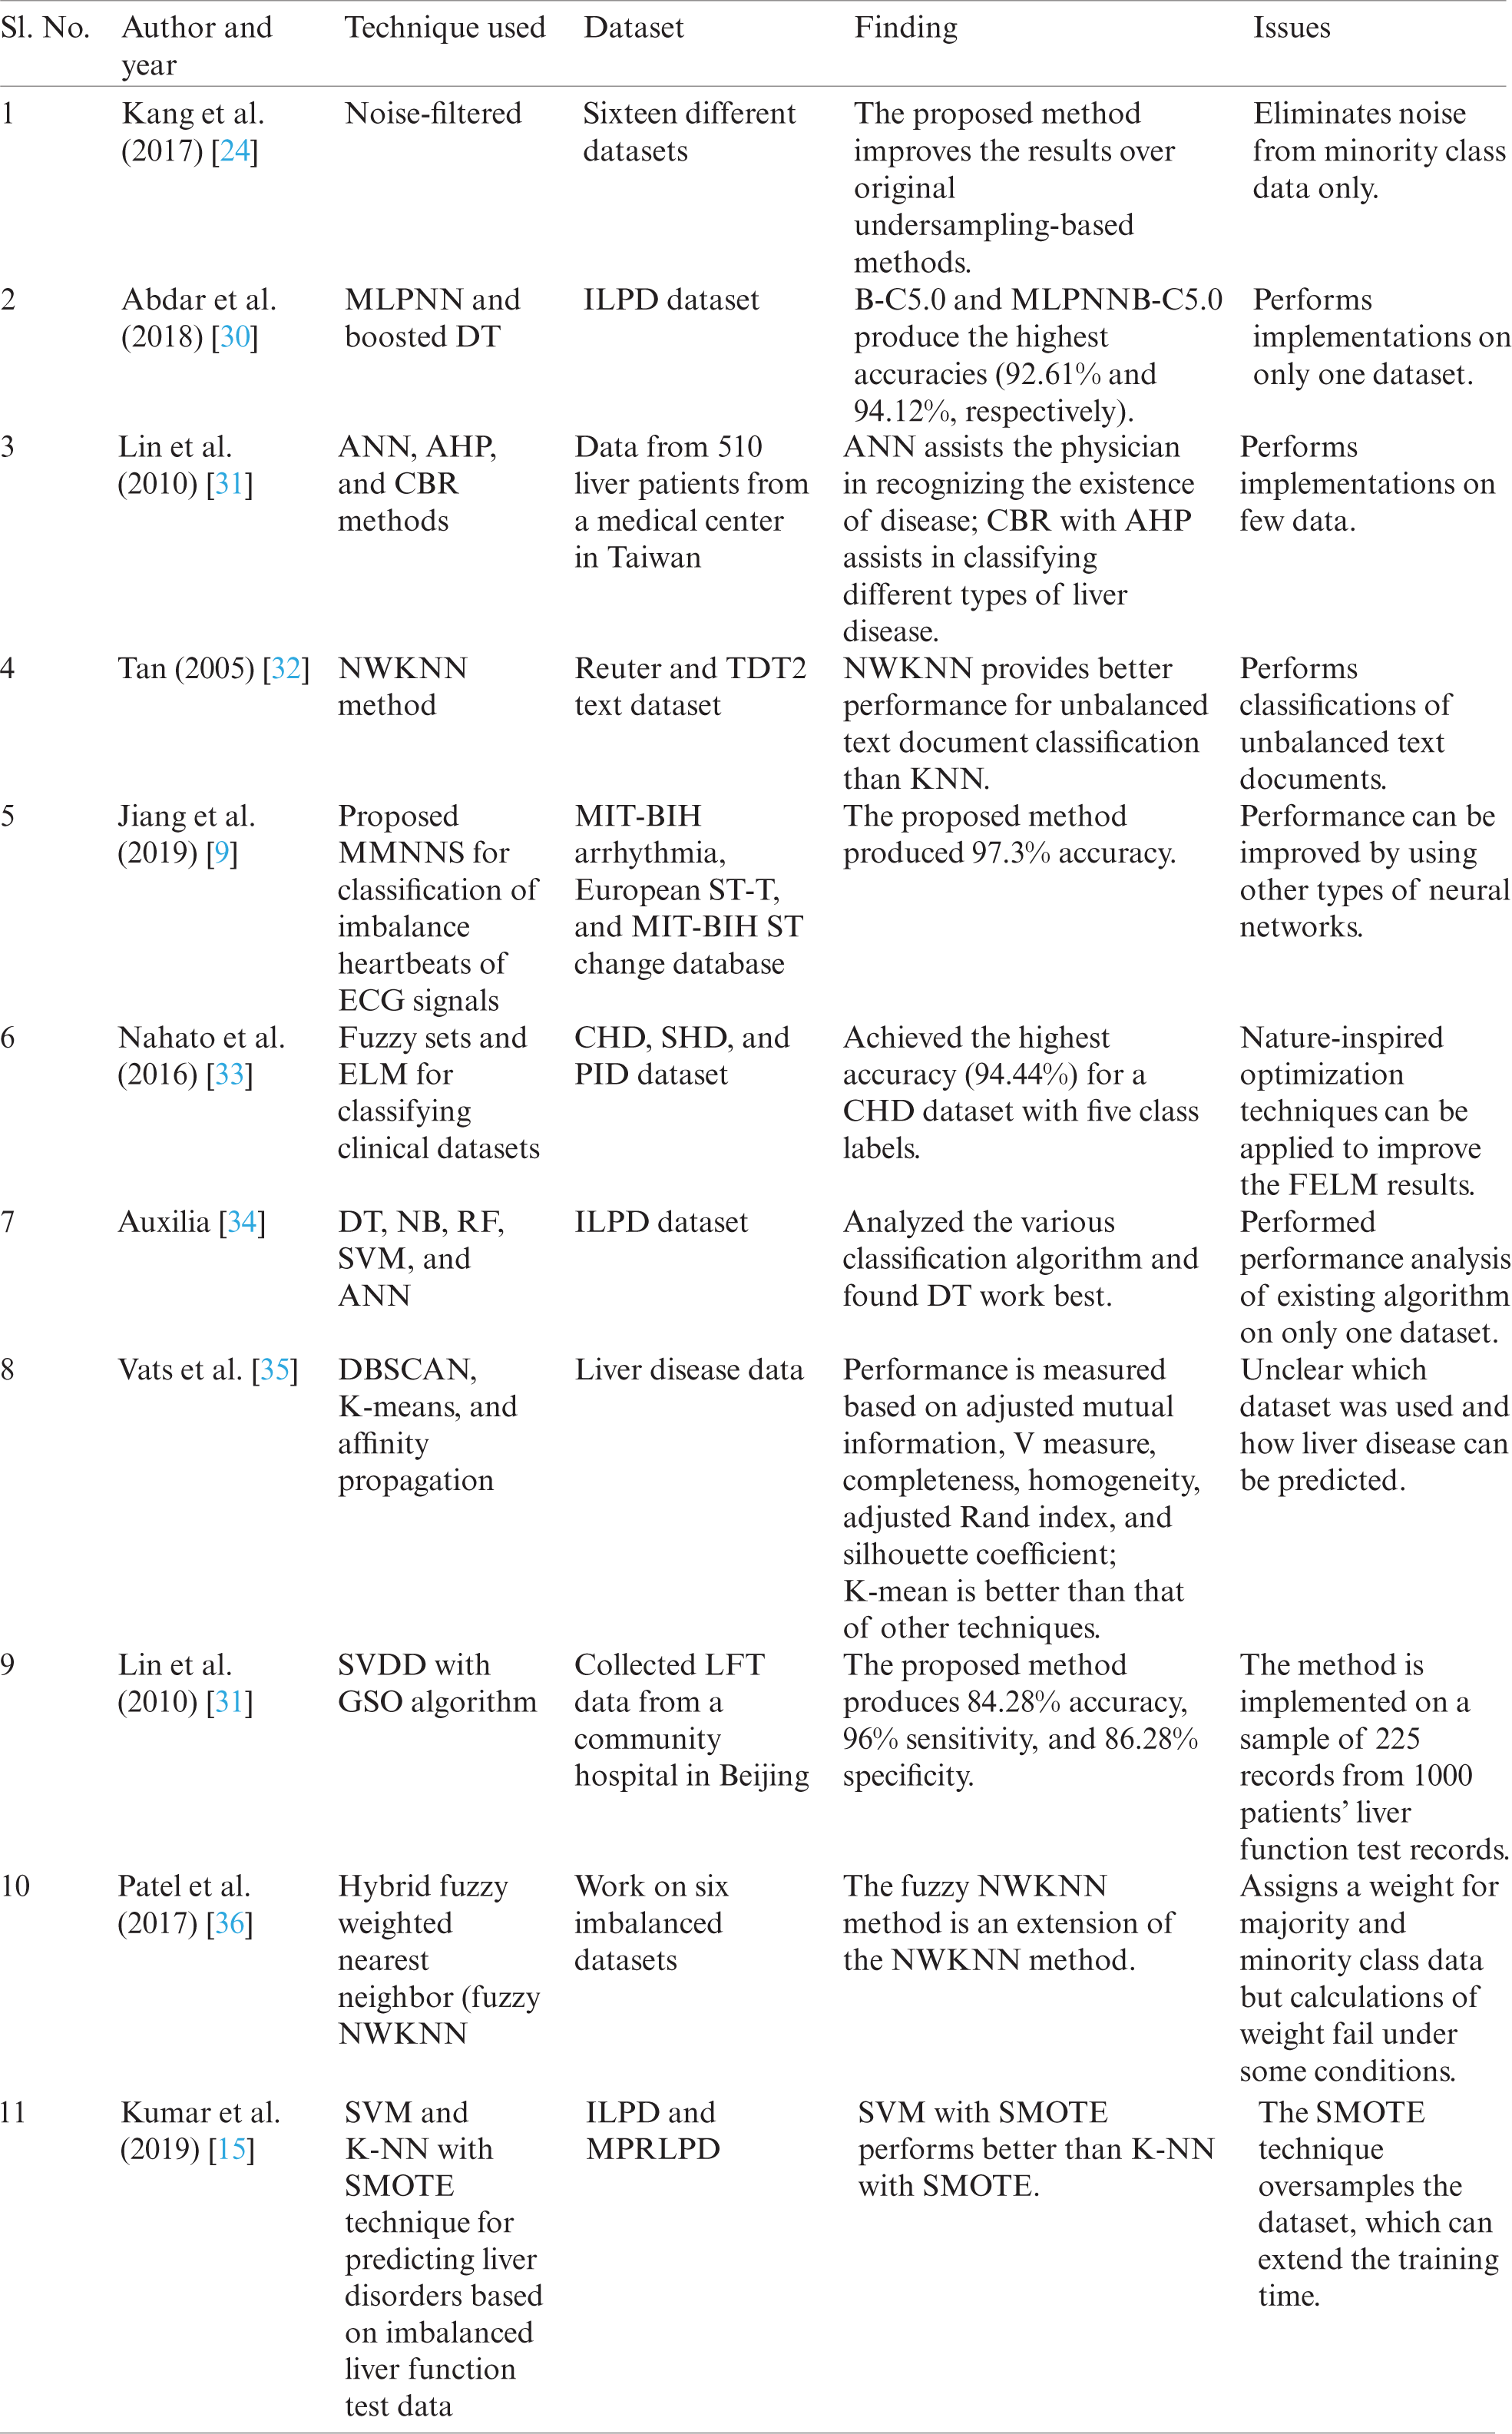
In the last few years, a lot of studies have been performed on liver disorder predictions using classification techniques. In these studies, the decisions made by the prediction systems and input data from patients impacted liver disease diagnoses. Literature reviews concerned with the proposed methodology are summarized in Tab. 1.
Table 1: Summary of literature reviews concerned with the proposed methodology
From the above studies, it is observed that there is still a need to develop an efficient and effective system for liver disease detection using a machine learning approach.
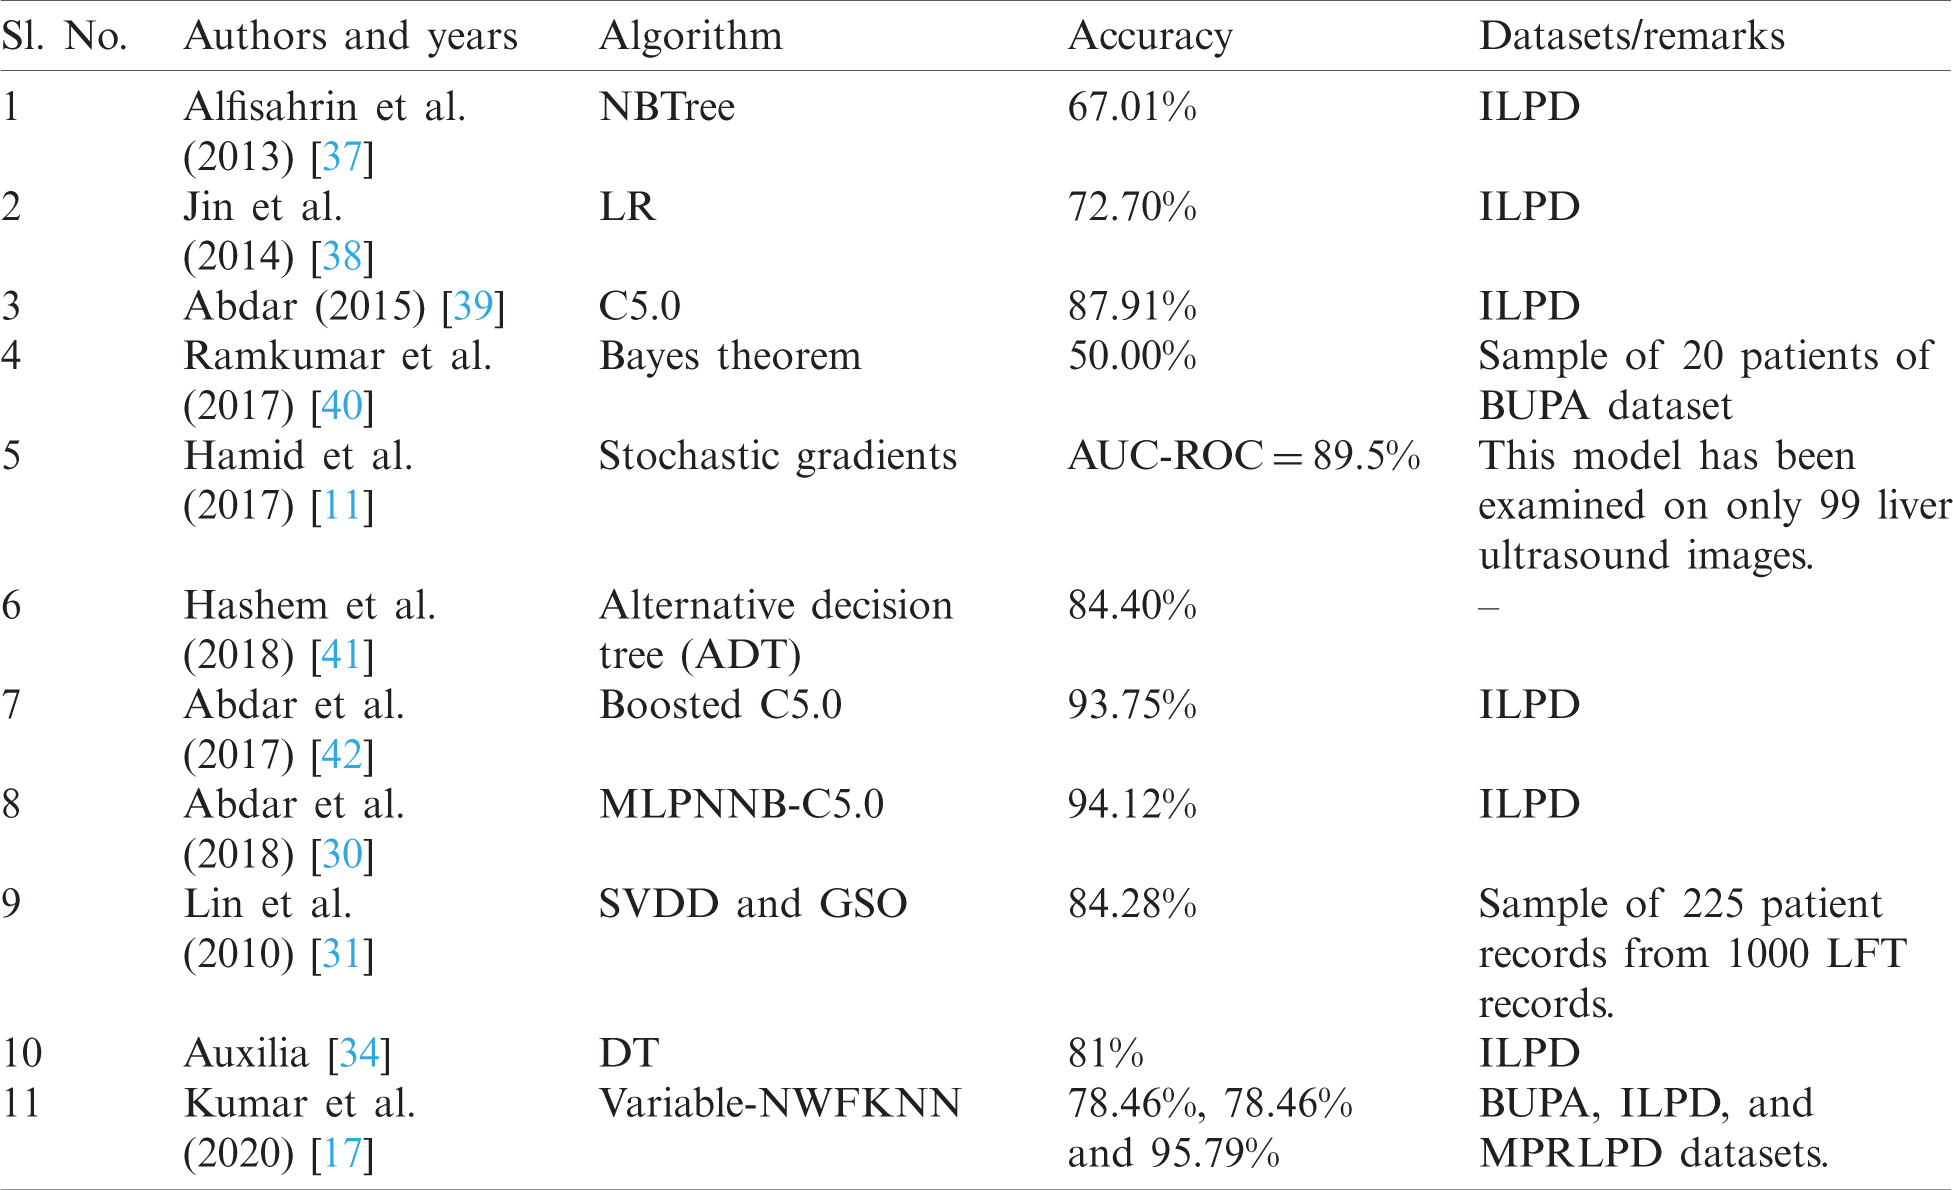
Tab. 2 compares previous studies about liver disease prediction. From the comparison, it is observed that these studies have not considered outliers of the majority and minority classes and have neglected the class imbalance issues of LFT datasets. This paper will address these issues.
Table 2: Summary of literature reviews about liver disease prediction
The proposed method consists of three stages: noise filtering, fuzzification, and the application of the AdaBoost boosting algorithm with different classifiers.
The noise filter mechanism eliminates outliers from the dataset. It is an essential technique for noise removal, as real-world datasets are often noisy (LFT datasets are no exception). KNN filter and redundancy-driven Tomek-linked-based undersampling techniques are used to remove noise from minority and majority classes.
The KNN filter [21] eliminates outliers from the minority class. It categorizes minority instances into highly desirable samples, moderately desirable samples, and outliers. A sample from the minority class is labeled highly desirable if all the nearest neighbors of that instance belong to the minority class. A sample from the minority class is labeled moderately desirable if all the nearest neighbors of that instance belong to both the minority and majority class. A sample from the minority class is labeled an outlier (or noise) if all the nearest neighbors of that instance belong to the majority class. The procedure of the KNN filter is given in Algorithm 1.
For dataset D,

3.1.2 Redundancy-Driven Tomek-Linked Based Under Sampling (R_TLU)
R_TLU [23,43] eliminates Tomek-linked pairs and redundancy from the majority class. A pair of the pattern pm and pn are called a Tomek-link pair if
In 1965, Zadeh [44] introduced the concept of the fuzzy set, which deals with uncertainty arising due to the strength of the relationships among the elements of a set [37]. Let
Here,
3.3 Description and Fuzzification of Datasets
Numerous studies were performed using machine learning techniques. However, liver disease predictions remain underexplored. So, the ILPD and MPRLPD datasets are used in the evaluation of this study. The ILPD dataset consists of 583 records obtained from two classes of liver patients (416 patients suffering from a liver disorder and 167 suffering from non-liver disorders). This dataset was collected from the UCI repository [45], and it has 10 features. The MPRLPD dataset consists of 7865 liver patient records. Of these patients, 6282 had some kind of liver disease, and the other 1583 were healthy. This dataset consists of 12 features and was collected from Madhya Pradesh in the Bhopal region of India. The dataset’s statistics (after eliminating noise, or outliers, from the minority and majority classes) are shown in Tab. 3.
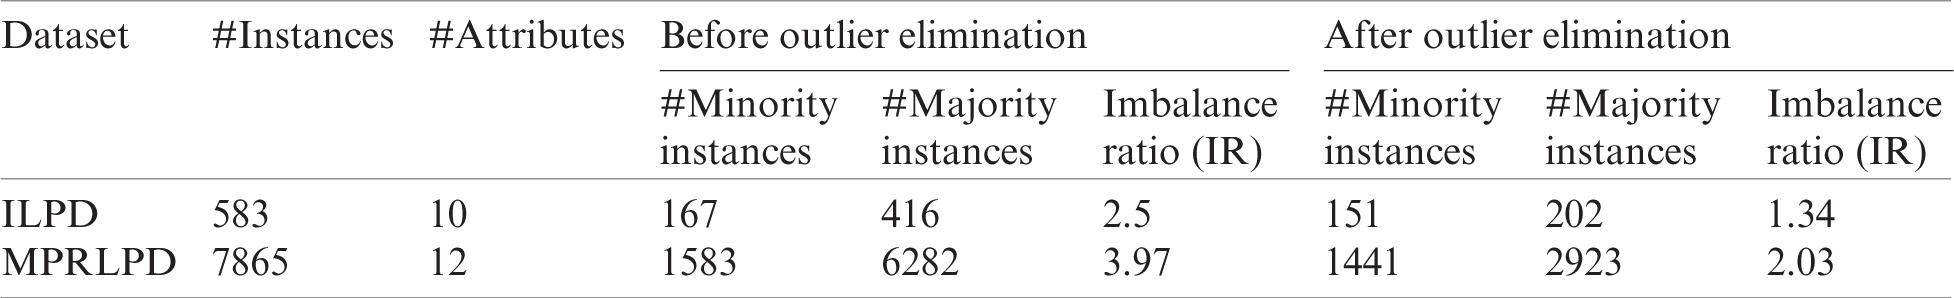


Figure 2: Fuzzification of the numerical features of ILPD datasets
3.3.1 Fuzzification of the ILPD Dataset
ILPD [45] dataset has nine attributes with the numerical datatype. During fuzzification, six features, namely age, AlkPhos, SGPT, SGOT, TP, and albumin, are represented by three fuzzy variables. Total bilirubin (TB) and direct bilirubin (DB) are represented by four variables. The remaining attribute (A/G ratio) is represented by two variables. Fig. 2 illustrates the fuzzification of the ILPD dataset using the membership function mentioned in Eq. (2).
3.3.2 Fuzzification of the MPRLPD Dataset
The MPRLPD dataset has 11 attributes with a numerical datatype. During fuzzification, seven attributes, namely age, TB, IB, SGPT, SGOT, TP, and A/G ratio, are represented by three variables, whereas AlkPhos is represented by three and four variables for children and adults, respectively. The remaining attributes (DB and albumin) are represented by four and two variables, respectively.
The classification subsystem implements the boosting technique to improve the performance of the classifier for imbalanced datasets. The boosting technique builds a strong classifier from several weak classifiers. Weak classifiers are algorithms whose error rate is less than random guessing (50%). In the proposed work, classification is done using the AdaBoost boosting algorithm [46,47]. The steps used in the AdaBoost algorithm are given below.
Initialization step:
Iteration step: for
1) Based on the weight
2) Compute total error as
3) Compute weight
4) Update the weight for misclassified patterns
5) Normalize the weight so that
6) Output of the final classifier
This section presents the evaluation of the NFFBT approach’s performance. The proposed approach is evaluated based on two datasets. One dataset is a benchmark dataset collected from the UCI repository, and the other is collected from a local hospital in Bhopal, India. Both datasets have two classes. RF [47], SVM [48], LR [49], and NB [6] machine learning algorithms are applied with a boosting technique on data prepared using the NFFBT approach (outlier-free datasets), as well as on original datasets. MATLAB R 2014a and Python are used to conduct the experiment. The NFFBT approach is implemented using MATLAB R 2014a, and classifications are performed using Python.
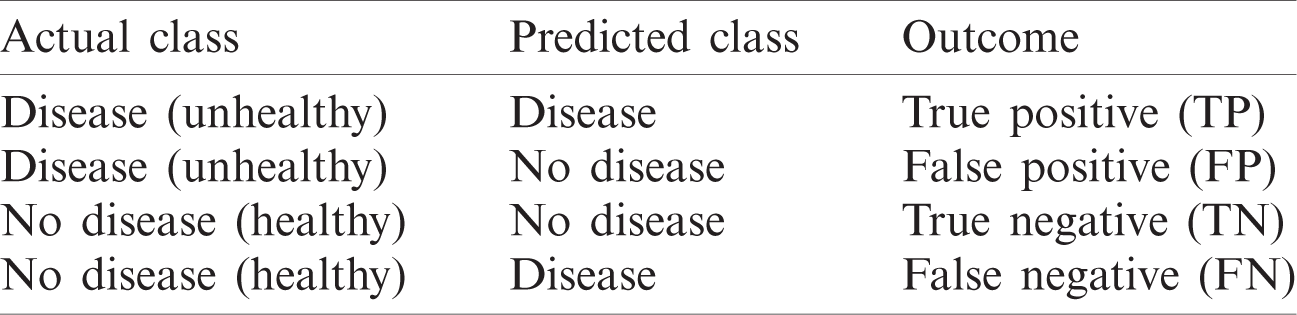
The performance of the proposed model is validated according to measures that are calculated based on the values of the confusion matrix. The confusion matrix [50] summarizes the predicted results of a classifier (Tab. 4). The performance measures—namely accuracy (Accu), specificity (Spec), sensitivity (Sens), precision (Prec), false positive rate (
Table 4: Confusion matrix (CM)
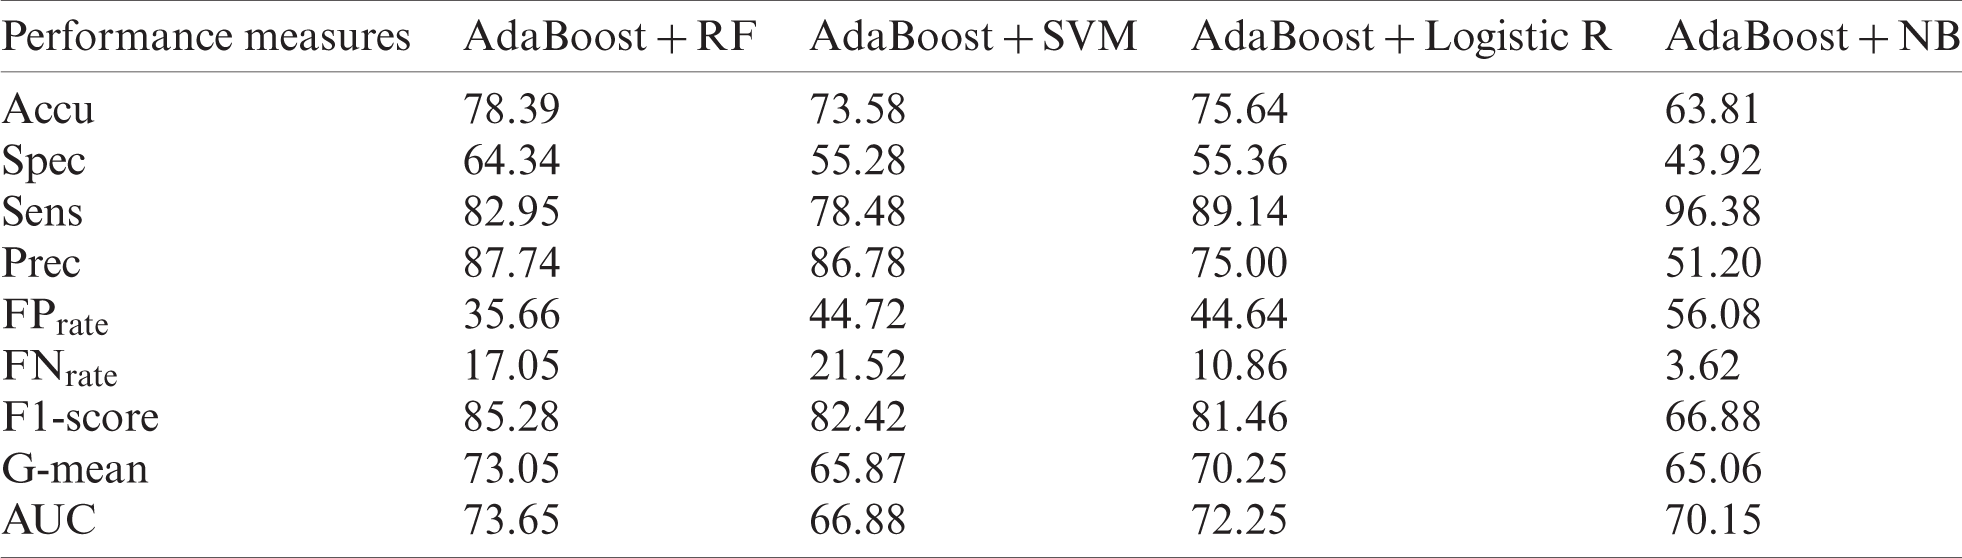
Tabs. 6 and 8 show the results of original datasets, whereas Tabs. 7 and 9 show the results on outlier-free datasets. Tab. 6 contains the results of the original ILPD dataset. For this dataset, Accu (78.39%), Spec (64.34%), Prec (87.74%),
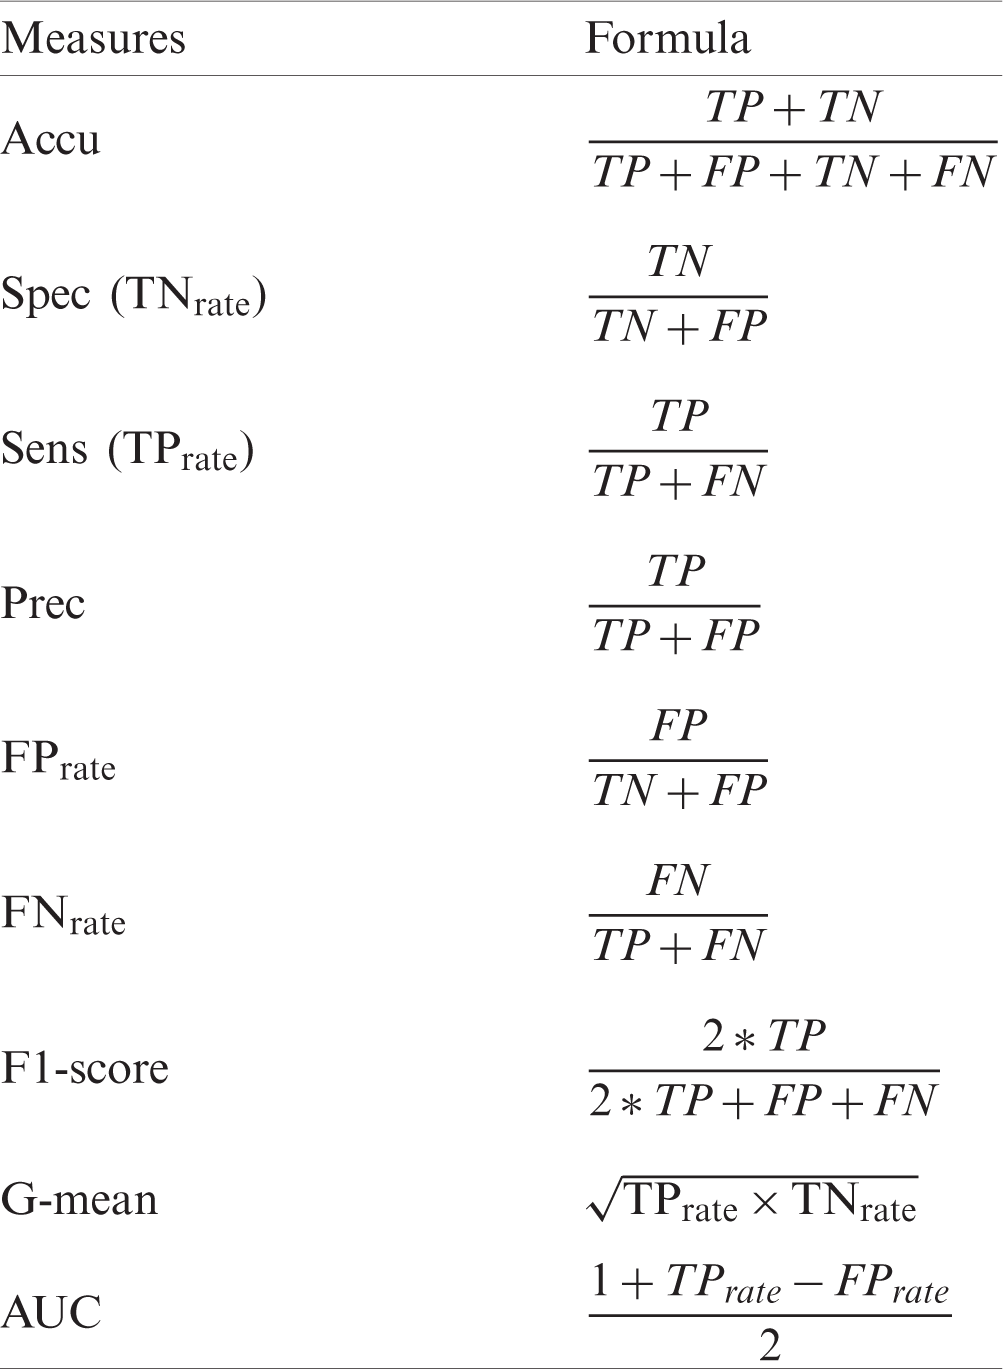
Table 6: Original ILPD dataset
The ILPD dataset is processed using the NFFBT technique, for which AdaBoost is used along with RF, SVM, LR, and NB for the outlier-free ILPD dataset (Tab. 7). It is found that AdaBoost with RF produces better results than other mentioned classifiers for Accu (90.65%), Spec (92.75%), Sens (89.30), Prec (95.05%),
Table 7: Outlier-free ILPD dataset
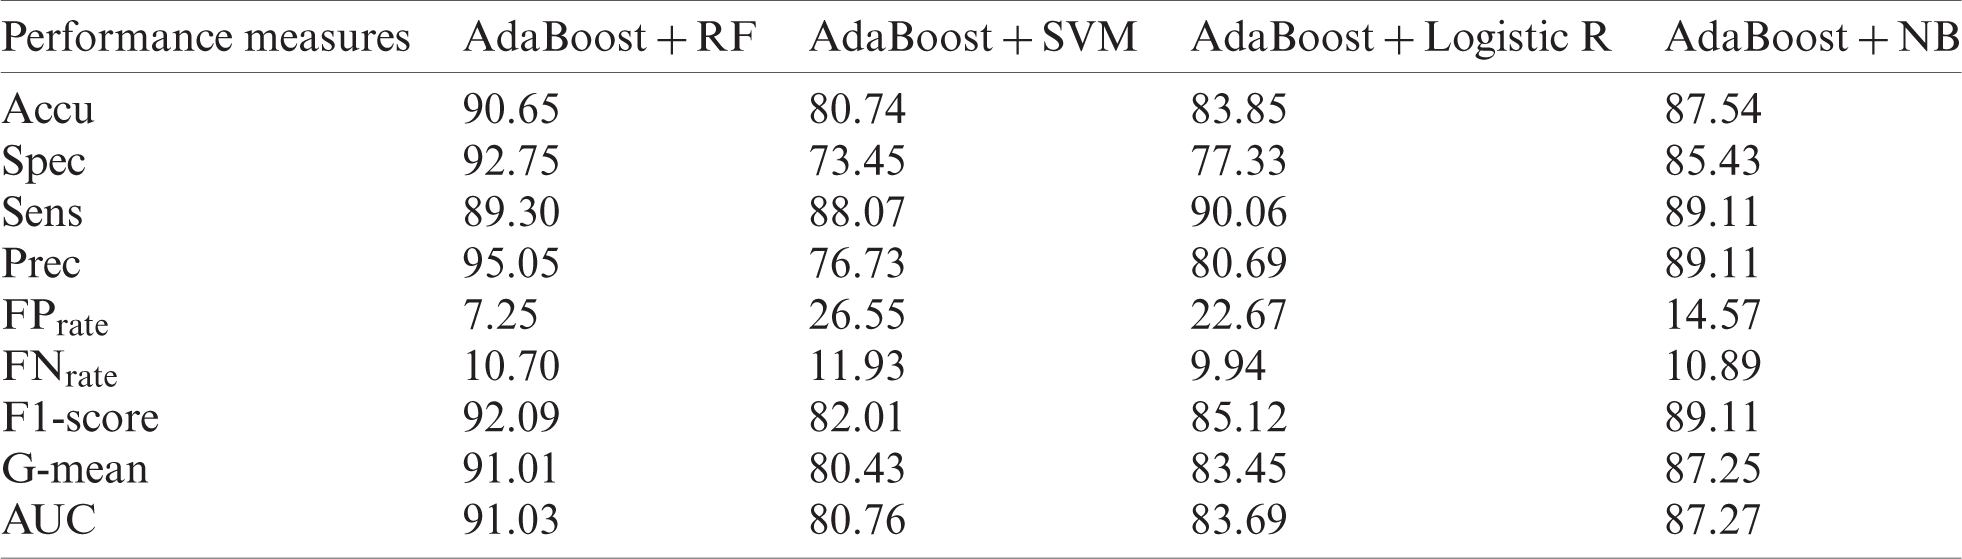
Accuracy is a valid metric for the efficiency of a classifier for experiments performed using balanced datasets. In this study, both the ILPD and MPRLPD datasets are imbalanced. Therefore, in this case, the F1-score is expected to indicate balance between precision and recall. The F1-scores of
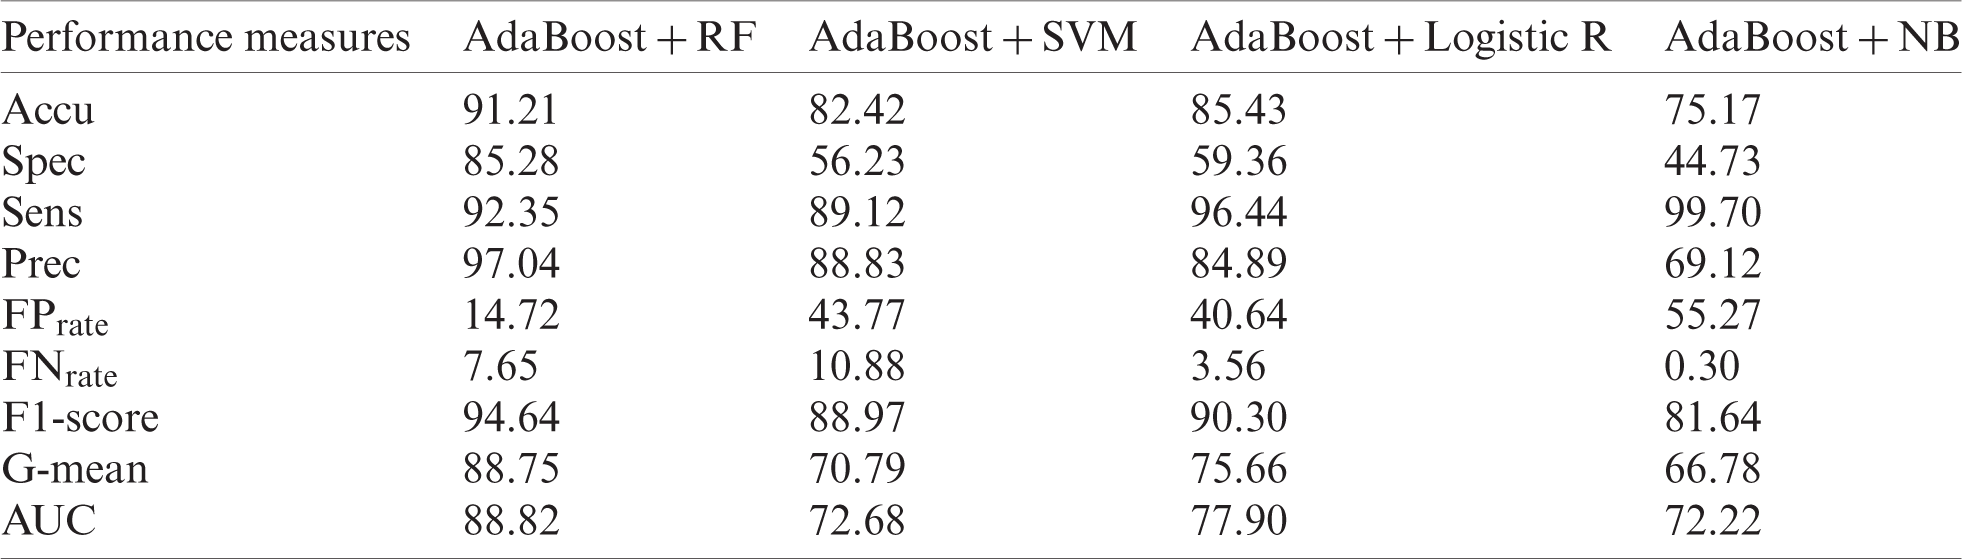
Tab. 8 shows the results of the original MPRLPD. AdaBoost with RF produced the best results for Accu (91.21%), Spec (85.28%), Prec (97.04%),
Table 8: Original MPRLPD dataset
Tab. 9 shows the results of the improved MPRLPD dataset using the NFFBT approach. AdaBoost with RF produced the best results for Accu (98.98%), Spec (98.00%), Sens (99.42%), Prec (99.01%),
The Prec value of 99.01% in Tab. 9 indicates that the
Table 9: Outlier-free MPRLPD dataset
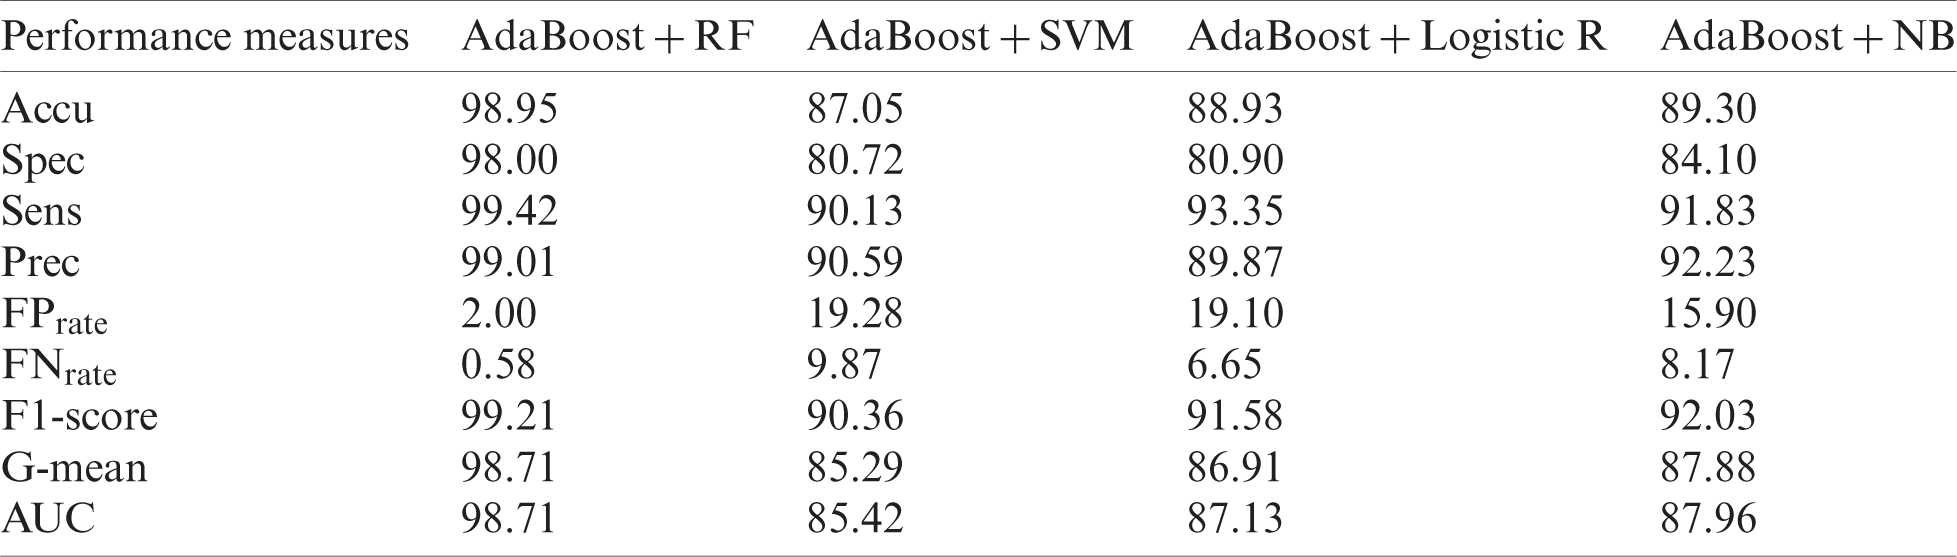
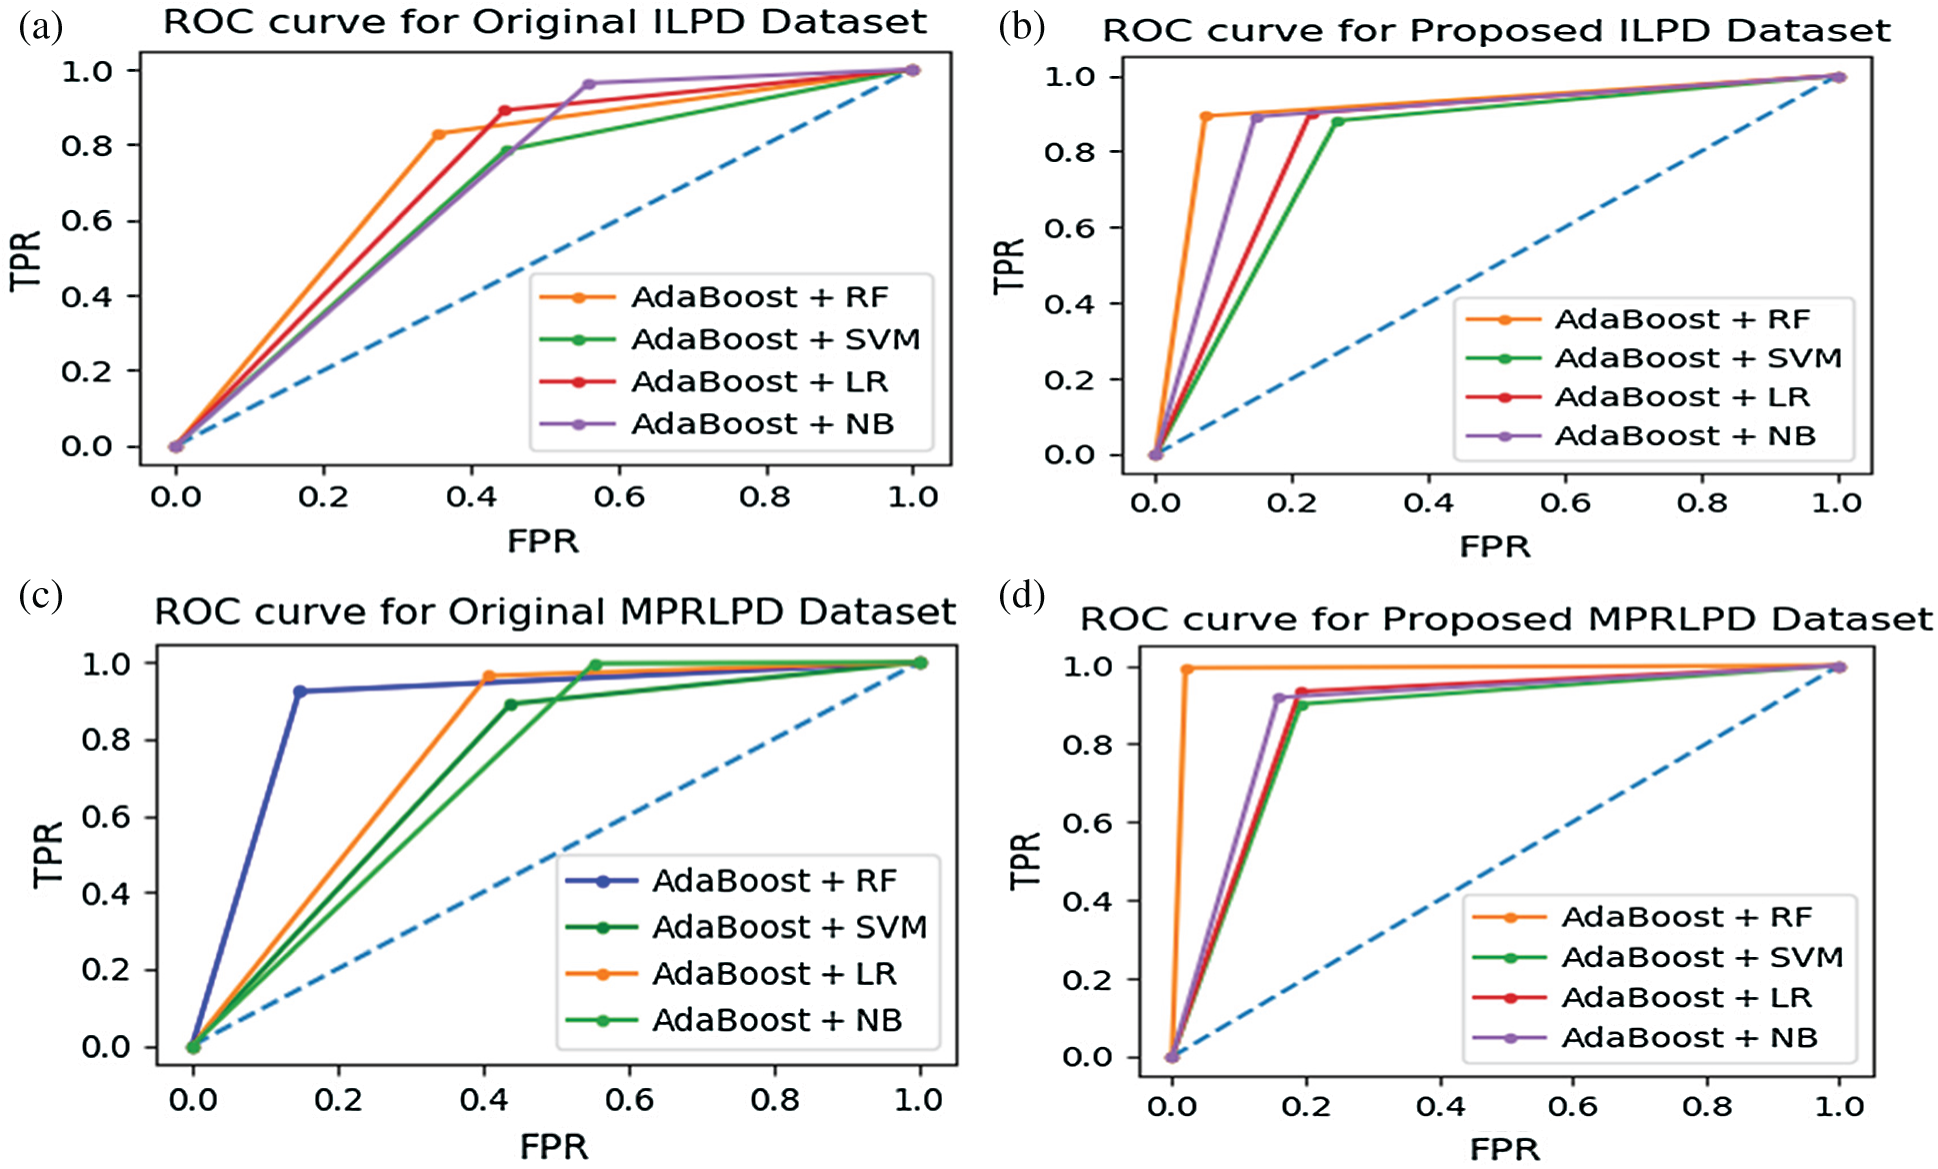
Figure 3: (a & b) The ROC curve for the ILPD dataset; (c & d) the ROC curve for the MPRLPD dataset
Because liver disease is a significant cause of death in India and globally, patients need to be diagnosed accurately. If a liver patient is diagnosed as false positive, then that patient’s healthy status would be at risk. Hence, in cases with a high percentage of false positives, Spec is the best evaluation metric. In Tab. 9, the Spec value for
The ROC curve is framed by plotting
AUC is a measure of the separation capability of classifiers in a particular dataset. The ROC curve is drawn from the results of the proposed NFFBT in the ILPD and MPRLPD datasets. A comparison of Fig. 3a and 3b shows that all the four techniques (i.e.,
In this paper, an NFFBT approach is proposed. This approach works in two main phases. First noise is eliminated using KNN filter and R_TLU techniques. The KNN filter eliminates outliers from the minority class, and R_TLU eliminates outliers from the majority class. After that, datasets are fuzzified so that uncertainty can be handled. In the second phase, the fuzzified datasets are classified using AdaBoost with RF, SVM, LR, and NB.
ILPD and MPRLPD datasets have been used in experiments to evaluate the performance of the NFFBT approach. These datasets are imbalanced, and so the AdaBoost algorithm is applied to the dataset because it can classify the imbalanced datasets. The AdaBoost boosting algorithm is applied with different classifiers, both without outlier removal (original dataset) and after removing noise from and fuzzifying (NFFBT) the datasets.
The results show improvements in Accu (12.26%), Spec (28.41%), Sens (6.35%), Prec (7.31%),
These results confirm the advantageous performance of the proposed NFFBT approach when compared to AdaBoost with RF. Based on the results, we argue that the NFFBT can be used by healthcare organizations and liver research institutes to classify imbalanced LFT data. It can also be utilized as a screening tool by doctors to predict and diagnose liver disease.
In the future, similar experiments can be done for imbalanced datasets in other domains like finance, cyber forensics, and athlete doping tests, among many others.
Funding Statement: The authors received no specific funding for this study.
Conflicts of Interest: The authors declare that they have no conflicts of interest to report regarding the present study.
1. L. Media, “World Health Ranking,” 2017. [Online]. Available: https://www.worldlifeexpectancy.com/india-liver-disease. [Google Scholar]
2. R.-H. Lin, “An intelligent model for liver disease diagnosis,” Artificial Intelligence in Medicine, vol. 47, no. 1, pp. 53–62, 2009. [Google Scholar]
3. G. T. Reddy, M. P. K. Reddy, K. Lakshmanna, D. S. Rajput, R. Kaluri et al., “Hybrid genetic algorithm and a fuzzy logic classifier for heart disease diagnosis,” Evolutionary Intelligence, vol. 13, no. 2, pp. 185–196, 2020. [Google Scholar]
4. S. M. Basha, D. S. Rajput, N. C. S. N. Iyengar and D. R. Caytiles, “A novel approach to perform analysis and prediction on breast cancer dataset using R,” International Journal of Grid and Distributed Computing, vol. 11, no. 2, pp. 41–54, 2018. [Google Scholar]
5. S. Colaco, S. Kumar, A. Tamang and V. G. Biju, “A review on feature selection algorithms,” in Emerging Research in Computing, Information, Communication and Applications. Singapore: Springer, pp. 133–153, 2019. [Google Scholar]
6. J. Han, J. Pei and M. Kamber, Data Mining: Concepts and Techniques. Amsterdam, Netherlands: Elsevier, 2011. [Google Scholar]
7. E. J. Bond, X. Li, S. C. Hagness and B. D. V. Veen, “Microwave imaging via space-time beamforming for early detection of breast cancer,” IEEE Transactions on Antennas and Propagation, vol. 51, no. 8, pp. 1690–1705, 2003. [Google Scholar]
8. C. Yu, H. Chen, Y. Li, Y. Peng, J. Li et al., “Breast cancer classification in pathological images based on hybrid features,” Multimedia Tools and Applications, vol. 78, no. 15, pp. 21325–21345, 2019. [Google Scholar]
9. J. Jiang, H. Zhang, D. Pi and C. Dai, “A novel multi-module neural network system for imbalanced heartbeats classification,” Expert Systems with Applications X, vol. 1, pp. 1–15, 2019. [Google Scholar]
10. M. A. Chikh, M. Saidi and N. Settouti, “Diagnosis of diabetes diseases using an artificial immune recognition system 2 (AIRS2) with fuzzy K-nearest neighbor,” Journal of Medical Systems, vol. 36, no. 5, pp. 2721–2729, 2012. [Google Scholar]
11. K. Hamid, A. Asif, W. Abbasi and D. Sabih, “Machine learning with abstention for automated liver disease diagnosis,” in Proc. Int. Conf. on Frontiers of Information Technology, Islamabad, Pakistan, pp. 356–361, 2017. [Google Scholar]
12. U. Ishtiaq, S. A. Kareem, E. R. M. F. Abdullah, G. Mujtaba, R. Jahangir et al., “Diabetic retinopathy detection through artificial intelligent techniques: A review and open issues,” Multimedia Tools and Applications, vol. 79, no. 21–22, pp. 1–44, 2019. [Google Scholar]
13. N. Deepa, B. Prabadevi, P. K. Maddikunta, T. R. Gadekallu T. Baker et al., “An AI-based intelligent system for healthcare analysis using Ridge–Adaline stochastic gradient descent classifier,” Journal of Supercomputing, pp. 1–20, 2020. [Google Scholar]
14. S. P. Potharaju and M. Sreedevi, “Ensembled rule based classification algorithms for predicting imbalanced kidney disease data,” Journal of Engineering Science and Technology Review, vol. 9, no. 5, pp. 201–207, 2016. [Google Scholar]
15. P. Kumar and R. S. Thakur, “Early detection of the liver disorder from imbalance liver function test datasets,” International Journal of Innovative Technology and Exploring Engineering, vol. 8, no. 4, pp. 179–186, 2019. [Google Scholar]
16. P. Kumar and R. S. Thakur, “Diagnosis of liver disorder using fuzzy adaptive and neighbor weighted K-NN method for LFT imbalanced data,” in Proc. Int. Conf. on Smart Structures and Systems, Chennai, India, pp. 1–5, 2019. [Google Scholar]
17. P. Kumar and R. S. Thakur, “Liver disorder detection using variable-neighbor weighted fuzzy K nearest neighbor approach,” Multimedia Tools and Applications, vol. 38, no. 6, pp. 1–21, 2020. [Google Scholar]
18. H. He and Y. Ma, Imbalanced Learning: Foundations, Algorithms, and Applications. Hoboken, New Jersey, United States: John Wiley & Sons, 2013. [Google Scholar]
19. D. A. Cieslak and N. V. Chawla, “Learning decision trees for unbalanced data,” in Joint European Conf. on Machine Learning and Knowledge Discovery in Databases, Berlin, Heidelberg, pp. 241–256, 2008. [Google Scholar]
20. R. Batuwita and V. Palade, “FSVM-CIL: Fuzzy support vector machines for class imbalance learning,” IEEE Transactions on Fuzzy Systems, vol. 18, no. 3, pp. 558–571, 2010. [Google Scholar]
21. H. Patel and G. S. Thakur, “Improved fuzzy-optimally weighted nearest neighbor strategy to classify imbalanced data,” International Journal of Intelligent Engineering and Systems, vol. 10, no. 2, pp. 156–162, 2017. [Google Scholar]
22. C. Seiffert, T. M. Khoshgoftaar, J. Van Hulse and A. Napolitano, “RUSBoost: A hybrid approach to alleviating class imbalance,” IEEE Transactions on Systems, Man, and Cybernetics-Part A: Systems and Humans, vol. 40, no. 1, pp. 185–197, 2009. [Google Scholar]
23. S. Kumar, S. K. Biswas and D. Devi, “TLUSBoost algorithm: A boosting solution for class imbalance problem,” Soft Computing, vol. 23, no. 21, pp. 10755–10767, 2019. [Google Scholar]
24. Q. Kang, X. Chen, S. Li and M. Zhou, “A noise-filtered under-sampling scheme for imbalanced classification,” IEEE Transactions on Cybernetics, vol. 47, no. 12, pp. 4263–4274, 2016. [Google Scholar]
25. L. Peng, H. Zhang, B. Yang and Y. Chen, “A new approach for imbalanced data classification based on data gravitation,” Information Sciences, vol. 288, no. 6, pp. 347–373, 2014. [Google Scholar]
26. T. Reddy, S. Bhattacharya, P. K. R. Maddikunta, S. Hakak, W. Z. Khan et al., “Antlion re-sampling based deep neural network model for classification of imbalanced multimodal stroke dataset,” Multimedia Tools and Applications, pp. 1–25, 2020. [Google Scholar]
27. N. V. Chawla, A. Lazarevic, L. O. Hall and K. W. Bowyer, “SMOTEBoost: Improving prediction of the minority class in boosting,” in Proc. European Conf. on Principles of Data Mining and Knowledge Discovery, Berlin, Heidelberg, pp. 107–119, 2003. [Google Scholar]
28. H. Patel, D. Singh Rajput, G. Thippa Reddy, C. Iwendi, A. Kashif Bashir et al., “A review on classification of imbalanced data for wireless sensor networks,” International Journal of Distributed Sensor Networks, vol. 16, no. 4, pp. 1–15, 2020. [Google Scholar]
29. S. Kumar, J. Madhuri and M. Goswami, “A review on ensembles-based approach to overcome class imbalance problem,” in Proc. Emerging Research in Computing, Information Communication and Applications, Singapore, Springer, pp. 155–172, 2019. [Google Scholar]
30. M. Abdar, N. Y. Yen and J. C.-S. Hung, “Improving the diagnosis of liver disease using multilayer perceptron neural network and boosted decision trees,” Journal of Medical and Biological Engineering, vol. 38, no. 6, pp. 953–965, 2018. [Google Scholar]
31. R. H. Lin and C. L. Chuang, “A hybrid diagnosis model for determining the types of the liver disease,” Computers in Biology and Medicine, vol. 40, no. 7, pp. 665–670, 2010. [Google Scholar]
32. S. Tan, “Neighbor-weighted k-nearest neighbor for unbalanced text corpus,” Expert Systems with Applications, vol. 28, no. 4, pp. 667–671, 2005. [Google Scholar]
33. K. B. Nahato, K. H. Nehemiah and A. Kannan, “Hybrid approach using fuzzy sets and extreme learning machine for classifying clinical datasets,” Informatics in Medicine Unlocked, vol. 2, no. 1, pp. 1–11, 2016. [Google Scholar]
34. L. A. Auxilia, “Accuracy prediction using machine learning techniques for indian patient liver disease,” in Proc. 2nd Int. Conf. on Trends in Electronics and Informatics, Tirunelveli, India, IEEE, pp. 45–50, 2018. [Google Scholar]
35. V. Vats, L. Zhang, S. Chatterjee, S. Ahmed, E. Enziama et al., “A comparative analysis of unsupervised machine techniques for liver disease prediction,” in Proc. IEEE Int. Symp. on Signal Processing and Information Technology, Louisville, KY, USA, pp. 303–307, 2018. [Google Scholar]
36. H. Patel and G. S. Thakur, “Classification of imbalanced data using a modified fuzzy-neighbor weighted approach,” International Journal of Intelligent Engineering and Systems, vol. 10, no. 1, pp. 56–64, 2017. [Google Scholar]
37. S. N. N. Alfisahrin and T. Mantoro, “Data mining techniques for optimization of liver disease classification,” in Proc. Int. Conf. on Advanced Computer Science Applications and Technologies, Kuching, Malaysia, IEEE, pp. 379–384, 2013. [Google Scholar]
38. H. Jin, S. Kim and J. Kim, “Decision factors on effective liver patient data prediction,” International Journal of Bio-Science and Bio-Technology, vol. 6, no. 4, pp. 167–178, 2014. [Google Scholar]
39. M. Abdar, “A survey and compare the performance of IBM SPSS modeler and rapid miner software for predicting liver disease by using various data mining algorithms,” Cumhuriyet Üniversitesi Fen-Edebiyat Fakültesi Fen Bilimleri Dergisi, vol. 36, no. 3, pp. 3230–3241, 2015. [Google Scholar]
40. N. Ramkumar, S. Prakash, S. A. Kumar and K. Sangeetha, “Prediction of liver cancer using conditional probability Bayes theorem,” in Proc. Int. Conf. on Computer Communication and Informatics, Coimbatore, India, IEEE, pp. 1–5, 2017. [Google Scholar]
41. S. Hashem, G. Esmat, W. Elakel, S. Habashy, S. A. Raouf et al., “Comparison of machine learning approaches for prediction of advanced liver fibrosis in chronic hepatitis C patients,” IEEE/ACM Transactions on Computational Biology and Bioinformatics, vol. 15, no. 3, pp. 861–868, 2017. [Google Scholar]
42. M. Abdar, M. Zomorodi-Moghadam, R. Das and I.-H. Ting, “Performance analysis of classification algorithms on early detection of liver disease,” Expert Systems with Applications, vol. 67, pp. 239–251, 2017. [Google Scholar]
43. D. Devi and B. Purkayastha, “Redundancy-driven modified Tomek-link based undersampling: A solution to class imbalance,” Pattern Recognition Letters, vol. 93, no. 1, pp. 3–12, 2017. [Google Scholar]
44. L. A. Zadeh, “Fuzzy sets,” Information and Control, vol. 8, no. 3, pp. 338–353, 1965. [Google Scholar]
45. UCI, “ILPD (Indian liver patient dataset) dataset,” 2012. [Online]. Available: https://archive.ics.uci.edu/ml/machine-learning-databases/00225/. [Google Scholar]
46. D.-S. Cao, Q.-S. Xu, Y.-Z. Liang, L.-X. Zhang and H.-D. Li, “The boosting: A new idea of building models,” Chemometrics and Intelligent Laboratory Systems, vol. 100, no. 1, pp. 1–11, 2010. [Google Scholar]
47. V. Svetnik, A. Liaw, C. Tong, J. C. Culberson, R. P. Sheridan et al., “Random forest: A classification and regression tool for compound classification and QSAR modeling,” Journal of Chemical Information and Computer Sciences, vol. 43, no. 6, pp. 1947–1958, 2003. [Google Scholar]
48. N. Cristianini and J. Shawe-Taylor, An Introduction to Support Vector Machines and Other Kernel-Based Learning Methods. Cambridge: Cambridge University Press, 2000. [Google Scholar]
49. H. Park, “An introduction to logistic regression: From basic concepts to interpretation with particular attention to nursing domain,” Journal of Korean Academy of Nursing, vol. 43, no. 2, pp. 154–164, 2013. [Google Scholar]
50. M. Sokolova and G. Lapalme, “A systematic analysis of performance measures for classification tasks,” Information Processing & Management, vol. 45, no. 4, pp. 427–437, 2009. [Google Scholar]
 | This work is licensed under a Creative Commons Attribution 4.0 International License, which permits unrestricted use, distribution, and reproduction in any medium, provided the original work is properly cited. |