DOI:10.32604/cmc.2021.017371
| Computers, Materials & Continua DOI:10.32604/cmc.2021.017371 | |
| Article |
Development of Social Media Analytics System for Emergency Event Detection and Crisis Management
1Department of Information System, College of Computer Science and Information Technology, King Faisal University, Al-Ahsa, 31982, Saudi Arabia
2Faculty of Computers and Artificial Intelligence, Cairo University, Egypt
3Faculty of Computing & Information, Cairo University, Egypt
4Faculty of Engineering, Cairo University, Egypt
*Corresponding Author: Shaheen Khatoon. Email: ssyed@kfu.edu.sa
Received: 28 January 2021; Accepted: 04 March 2021
Abstract: Social media platforms have proven to be effective for information gathering during emergency events caused by natural or human-made disasters. Emergency response authorities, law enforcement agencies, and the public can use this information to gain situational awareness and improve disaster response. In case of emergencies, rapid responses are needed to address victims’ requests for help. The research community has developed many social media platforms and used them effectively for emergency response and coordination in the past. However, most of the present deployments of platforms in crisis management are not automated, and their operational success largely depends on experts who analyze the information manually and coordinate with relevant humanitarian agencies or law enforcement authorities to initiate emergency response operations. The seamless integration of automatically identifying types of urgent needs from millions of posts and delivery of relevant information to the appropriate agency for timely response has become essential. This research project aims to develop a generalized Information Technology (IT) solution for emergency response and disaster management by integrating social media data as its core component. In this paper, we focused on text analysis techniques which can help the emergency response authorities to filter through the sheer amount of information gathered automatically for supporting their relief efforts. More specifically, we applied state-of-the-art Natural Language Processing (NLP), Machine Learning (ML), and Deep Learning (DL) techniques ranging from unsupervised to supervised learning for an in-depth analysis of social media data for the purpose of extracting real-time information on a critical event to facilitate emergency response in a crisis. As a proof of concept, a case study on the COVID-19 pandemic on the data collected from Twitter is presented, providing evidence that the scientific and operational goals have been achieved.
Keywords: Crisis management; social media analytics; machine learning; natural language processing; deep learning
During the last few decades, the frequency of the occurrence of natural disasters has increased, according to Emergency Event Database [1]. These disasters include floods, earthquakes, sandstorms, disease epidemics, and human-made disasters such as industrial accidents and terrorism incidents. According to the same report, Saudi Arabia is prone to three major natural disasters, namely floods, epidemics, and sandstorms, besides industrial hazards and accidents. The kingdom has recorded 14 natural disasters affecting nearly 30,000 people and resulting in an economic loss of approximately $450 million over the past three decades [2]. The Presidency of Meteorology and Environment along with the Civil Defense Directorate, have taken the step to advance Disaster Risk Management (DRM). They identified the following three priorities for hazard prevention and mitigation: 1) performing risk assessments and updating preparedness strategies 2) strengthening urban resilience and planning and 3) ensuring effective operation of early warning systems. Due to the increased threats of terrorism-related activities and incidents, the Ministry of Interior sponsors several initiatives for strengthening national security [2]. Several awareness programs have been launched to educate the public on how to respond during and after natural and human-made disasters and violent extremism. However, the country has yet to develop a comprehensive DRM framework for automatically predicting natural hazards, early warning, and risk assessment systems.
Recently, the ubiquitous connectivity and proliferation of social networks opened up new opportunities for crisis management through crowdsourcing. One such crowdsourcing tool is Ushahidi [3]. It was initially developed to visualize crowdsource reports of violence in Kenya after the post-election violence in 2008. Since then, it is expanding and has become an excellent example of crowdsourcing for raising awareness on different social issues. In modern days, whenever any crisis occurs, the national security agencies, civil defense, emergency and humanitarian professionals, media outlets, and the general public join hands and collaborate using modern technologies such as social media. The potential use of social media had caught the attention of the crisis management research community when close attention was given to social media by Red Cross in its Emergency Social Data Summit held in August 2010 [4]. Since then, the research community has started exploring how to monitor, analyze and display data extracted from social media. A recent survey [5] on the role of big data in disaster management shows that social media has been used as the most prominent information source in various disaster management phases, such as long-term risk assessment and reduction, forecasting and prediction, monitoring and detection, early warning, and post-disaster coordination and response. However, extracting meaningful information from such a large, diverse, dynamic, but potentially useful data source is a big challenge which has just begun being to be addressed by the research community.
In this project, we investigate a cloud computing-based big data framework that will enable us to utilize heterogeneous data sources and sophisticated machine learning techniques to gather and process information intelligently, and provide emergency workers useful insights for making informed decisions, as well as guide the general public on how to stay safe during emergencies. Such a comprehensive framework will help the Kingdom to develop comprehensive Disaster Risk Management (DRM) capability for automatically predicting hazards, early warning, risk assessment, and risk mitigation, including coordination of emergency activities and evacuation. The main thrust is to develop an information system product by dynamically extracting data from diverse social media channels, and storing, managing, analyzing, and interpreting these data in a real-time fashion. Additionally, to disseminate resultants information to decision-makers in a format appropriate for carrying out their tasks. The proposed framework performs the following tasks. First, it dynamically captures multilingual (Arabic, English, and other languages) multimodal (text, audio, video, and images) data from various social media channels in real-time. Second, it applies language-specific models to translate multilingual and multimodal contents into a unified ontology (knowledge-base). Third, it uses machine learning and artificial intelligence techniques for intelligent inference from the knowledge base. Last, it interprets results, present information on an interactive dashboard, and disseminate information to relevant stakeholders.
As a part of the project, this paper investigates the existing platforms developed to support crisis-related activities and highlights their benefits and shortcomings. An end-to-end disaster support system is proposed to build upon existing platforms on social media use during mass emergencies and disasters. Then, a methodological approach based on the state-of-the-art AI techniques ranging from unsupervised to supervised learning for an in-depth analysis of social media data collected during disasters is described.
Next, a case study where we apply the proposed methodology on the Twitter data collected during the COVID-19 pandemic for a comprehensive understanding of these real-world devastating crisis events is also described. Specifically, we use topic modeling techniques to understand the different topics discussed in disaster-related posts. To help concerned authorities quickly sift through big crisis data, we employ clustering techniques to group semantically similar messages and find high-level categories. To help humanitarian organizations fulfill their specific information needs, we use deep learning-based classification techniques to classify social media messages into humanitarian categories.
The rest of the paper is organized as follows: Section 2 investigates the existing platforms developed to support crisis-related activities and highlights their benefits and shortcomings. Section 3 discusses the architecture of the IT solution proposed to develop DRM capability for end-to-end crisis response and management. Section 4 describes the machine learning pipeline for in-depth analysis and mapping social media posts to relevant humanitarian categories for effective response. The proposed machine learning pipeline results are discussed in Section 5 using a COVID-19 case study. Finally, the conclusion and future directions are presented in Section 6.
This section discusses different social media platforms developed to extract crisis-related information from social media to support disaster-related activities.
The platform “Tweek the Tweet” [6] is a two-way communication channel over Twitter, which connects people and functional authorities to communicate crisis-related information. A series of information processing techniques are used to extract geo-locations, create incident reports on Tweets, and classify them into different categories based on a hashtag. The reports are then published on the Web in various formats, where users can see aggregated information on the type of disaster and places where information has been reported. Tweak the Tweet has been deployed for more than 40 events between 2010 and 2013, including the 2010 Haiti Earthquake, Hurricane Irene in 2011, Colorado wildfires in 2012, and Hurricane Sandy. This tool is useful for humanitarian organizations to sift through evolving events categorized across different hashtags. However, identifying the type of help required by the victims for emergency response requires manual intervention, and there is great potential to apply machine learning to facilitate the work of first responders.
Likewise, MicroMappers [7] is a crowdsourcing platform that enables people to contribute voluntarily during disasters for humanitarian organizations’ effective response. The driving notion is that social media contents may contain information related to a disaster, such as people asking for or offering help, reporting injuries or death, cautioning others to stay away from the danger, and so on. To sort through what is useful and what is not useful, MicroMapper utilizes volunteers to label geotagged contents into four categories: “request for help,” “infrastructure damage,” “not relevant,” and “not English.” The relevant contents are grouped to construct a map sent to agencies providing aid on the ground that need the most up-to-date status of an area. This platform was actively used when Hurricane Matthew hit areas across the Western Atlantic in 2016, collecting over 250,000 images and six million text messages. This tool tries to convert users’ posts into actionable information. However, the system’s success largely depends on volunteers, who manually tag the posts into different categories.
Ushahidi [3] is another open-source crowdsourcing platform developed to monitor violence during a crisis and raise awareness about attackers. It was initially designed to visualize crowdsource reports of violence in Kenya after the post-election violence in 2008. Since then, it is expanding and has become an excellent example of crowdsourcing for raising awareness on different social issues. This tool offers an admin and public interface, where admins create a survey by defining the disaster type with various fields relevant to a particular disaster event and workflows for various tasks needed to be performed or coordinated. Users can submit a survey manually using predefined survey templates by filling in the relevant information. Admin checks and edits the user’s posts as it arrives and performs the necessary tasks before publishing it to the public. For example, for a traffic accident with human injury, the user may report the date, time, location, and injury information. At the same time, the admin will verify the information, notify the authority (traffic police and hospital), and, if necessary, follow up and coordinate with them accordingly. The formal response agencies, humanitarian organizations, and other end users can use the client interface to identify, filter, and organize the overwhelming amount of social media data for any given crisis to make time-critical decisions. Besides, the effectiveness of the tool in crisis monitoring, largely depends on volunteers to manually create and fill in templates with relevant information before making them available to the public. The system has the great potential to integrate AI and Machine learning to annotate such semi-structured data or extract useful pieces of knowledge and information from them to support humanitarian organizations.
SensePlace2 [8] is another web-based platform which was developed to support situational awareness in crisis management. It was designed to collect crisis-related tweets with place and time information and then visualize them using maps and time plots. Geotags are extracted using geo-location in the tweet, location of users’ posting the Tweet, place-based hashtags, and named entity extraction. An interactive visual interface allows users to search and filter tweets by concept, time, and spatial query specification and visualize heat-maps based on geotags.
Although, the system has a strong focus on situational awareness, which is useful to visualize temporal, spatial, and thematic aspects of a crisis, however, it does not create actionable reports for crisis management and decision making. survey manually using predefined survey.
Emergency Situation Awareness (ESA1) [9] is a web-based system that aims to enhance situational awareness, particularly for earthquakes. It collects, filters, and analyses Tweets from a specific region of interest and presents information in time and space maps. Event detection, text classification, online clustering, and geotagging are applied to detect tweets of interest for emergency managers. The emergency manager can sift through interesting tweets to identify the type of event or its severity. Similarly, Twitcident [10] is another situation awareness tool, which filters crisis-related tweets by semantically enriching the incidents from Twitter and Web. The semantic enrichment module uses named entity recognition and external Web resources to extract attribute-value pairs of relevant tweets. It then classifies tweets based on hand-crafted rules for attribute-value pairs into different categories such as damage, risk, injuries etc. Following that, users can create reports on incident-related messages by querying attribute-value pairs.
AIDR (Artificial Intelligence for Disaster [11] is a web application designed to filter crisis-related tweets and utilize crowdsourcing to classify tweets in one of the predefined categories, e.g., donation, damage, and so on. It then employs a small set of labeled tweets to train the classifier. The system generates an output of messages sorted into categories to create crisis maps and other types of reports. Twitter for Disaster Response-Tweedr [12] applies keyword and regionally based queries to collect crisis-related information from Twitter. It then applies clustering and classification techniques to extract actionable information for disaster relief. Several classification algorithms, such as sLDA, SVM, and logistic regression, are used to recognize tweets reporting losses or damage. However, labeled examples are needed to classify new event in one of the predefined categories. Similarly, CrisisTracker [13] taps into social media to track a set of keywords related to crisis and uses clustering to construct related stories. It engages volunteers to further curate stories by manually tagging them according to the disaster category reported in related stories. Yet, the system’s success depends on volunteers’ size and motivations to correctly label each story.
Most of the systems discussed above are built around the concept of a visual display according to temporal, spatial, and thematic aspects of crisis-related social media data for situational awareness. The visual elements are powered by different computational capabilities, such as extracting relevant information using specific criteria and Natural Language Processing (NLP) techniques, including Named Entity Recognition (NER) and linking entities to concepts. The findings from these platforms suggest that the more situational awareness the formal humanitarian organizations and people have, the better prepared they are to make informed decisions. Some of these platforms focus on creating actionable reports to support disaster response and relief activities. However, the information needed to create actionable reports requires crowdsourcing to manually tag predefined categories, which is neither scalable nor feasible. Furthermore, there is a lack of literature on cohesive information extraction pipeline to automatically extract relevant information, create actionable reports, and deliver information seamlessly to relevant response agencies. This paper proposes a machine learning pipeline that extracts relevant information for disaster relief workers through a cohesive pipeline, consisting of information extraction, clustering, and classification.
3 Architecture of Social Media Analytics for Emergency Event Detection and Crisis Management
This research project aims to develop a cloud-based integrated solution for disaster and emergency management using social media analytics. The main thrust is augmenting existing sensor-based Disaster Risk Management (DRM) systems with social media capabilities by keeping the public in the loop (human sensors). The development of such a system will enable relevant disaster management authorities to integrate and access data from several internet-based social data sources and apply semantic analysis to generate actions to be executed in response to presented contents. The generated results will be used by relevant emergency monitoring and disaster management agencies for emergency response, early warning, risk assessment, and risk mitigation, including coordination of emergency activities.
Fig. 1 depicts the overall research framework and highlights its three major components: (1) event (incident) identification and representation using real-time data stream coming from heterogeneous sources such as social networks, (2) automatic reasoning and Inferencing by applying intelligent techniques to derive knowledge and actionable insights from data, (3) incident monitoring and visualization by developing intuitive interfaces to provide emergency professionals with intelligence derived from the knowledge-base. In the following section, the detail of each component is provided.
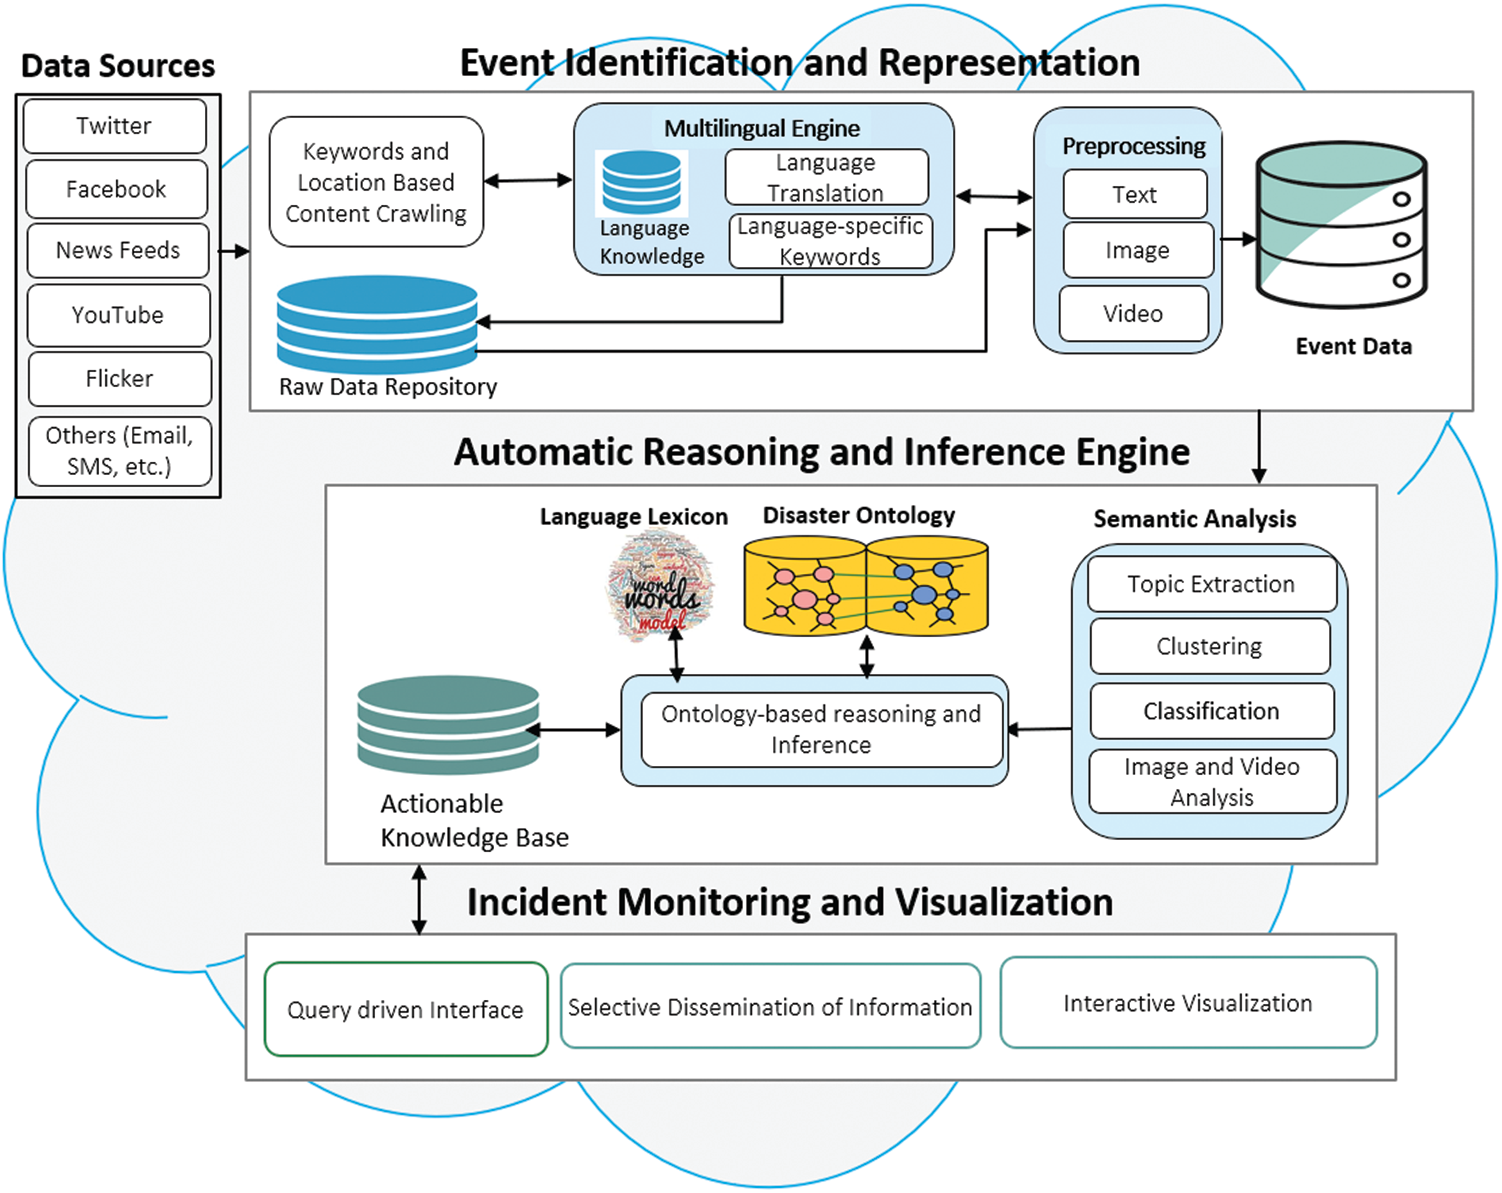
Figure 1: Abstract architecture of social media analytics for emergency event detection and crisis management
3.1 Event Identification and Representation
The workflow can either be triggered automatically upon detecting an event. Alternatively, it can be initiated manually by an operator on deployment.
Several parameters need to be specified to start the crawler. The location-based crawler requires a predefined area of interest and time window size for all social media networks configured for crawling. The location will be provided using static location coordinates (i.e., longitude, latitude) through Google API. An operator needs to specify search-terms or use predefined terms stored in the language database to initiate the search in the keyword search. The crawler will then start searching the posts matching with search terms. The multi-language component’s goal is to provide the capability of crawling the content uploaded in different languages. For achieving that, our system provides a language translation service using Google/Microsoft language translation APIs to translate posts in the target language and store language-specific keywords in the language knowledge-base. Upon setting up these parameters, the application starts receiving data from social media sites, such as Twitter, Facebook, YouTube, a news feed, etc. The content from one or more sources may contain various forms, including text (posts, comments on blog posts, news, etc.) and media uploaded with the post (image and video contents with rich metadata information such as location and text). Following the data collection and translation, the data crawled is transformed into a suitable format to apply preprocessing techniques on text, image, and video, before applying semantic analysis.
3.2 Automatic Reasoning and Inference
The data is transformed in a format suitable to apply subsequent analysis and stored in the event database following preprocessing. The automatic reasoning and inference module performs analysis upon the event data, such as semantic analysis, topic extraction, classification, image, and video analysis. As a result, the system identifies themes and cluster together similar posts, topics, conversations, and content. Classification allows the contents to map into predefined categories. However, as social media contents change quickly, it is not practically feasible to define every disaster category. A disaster ontology will be developed to map metadata derived from social data to the matching class in ontology. Hence, ontology creation and alignment are the immediate future work under this research project. At this stage, we assume that ontology will have classes for different disaster types, as well as information about relevant relief organization and the location of those organizations.
3.3 Incident Monitoring and Visualization
To effectively monitor and visualize crisis-related social media contents, a web-based interface will be developed with the following functionalities:
Selected Dissemination of Information (SDI): To effectively share the right information seamlessly with the right people, an SDI component will be developed. Such an efficient filtering system will identify only the right contents to be shared out of a massive volume of information. For example, if the extracted knowledge is about a traffic accident, the traffic police will be notified to summarize the location, the number of injuries and deaths, the services needed among others. Similarly, the information related to medical emergencies will be shared with emergency services, such as ambulance services. While national security incidents will be shared with the National Intelligence, and so on.
Interactive Visualization: A comprehensive dashboard to visualize incident-related information will be developed. This information will be visualized using maps, time plots, incidents graphs showing a relationship between events, and statistics about the different incidents.
Query and Navigation Interfaces: Intuitive query and navigation interfaces will be developed to allow users to filter through the detail of incidents and events. The query interface would let users get additional detail on each incident type (such as location, damage type etc.).
4 Machine Learning Pipeline for Extraction and Classification of Emergency Events
As a part of the bigger project, described in Section 3, in this paper, we proposed a machine learning pipeline to uncover useful patterns of emergency events using one source of social media data (Twitter) on one type of data (Text). We used several natural language processing techniques to process social media posts. Our machine learning pipeline includes data preparation and textual analysis. Data preparation consists of two steps: (1) data collection and preprocessing (2) feature extraction. After preprocessing the raw dataset and extracting the features, we proceed to the textual analysis stage, including (1) topic modeling, (2) clustering, and (3) classification. As a result, disaster responders can sift through interesting social media data according to a specific humanitarian category. The following sub-sections explain the specific steps, equations, and algorithms in the proposed pipeline.
4.1 Data Collection and Preprocessing
The first module is prepared to collect and prepare the data for analysis. We used Twitter’s streaming API using filters in terms of search terms. Twitter data is unstructured and varies significantly in readability, grammar, and sentence structure. The accuracy of any natural language processing techniques largely depends on the informal nature of the language in tweets. The first step in constructing this pipeline is to prepare the dataset in which the noise is reduced to an acceptable level, and relevant tweets should not be omitted at the preprocessing stage. So, we perform preprocessing of tweet text before using them to conduct language analysis.
We remove URL’s, mentions, hashtags, emojis, smileys, special characters, and stop words as they do not add valuable semantic information for further analysis. The remaining words are tokenized and converted into lowercase to decrease the influence of typos. In the next step, a normalization component is developed to make the tweets more formal. Tweet textual contents are usually in ill-form and full of misspellings, e.g., earthquak (earthquake), missin (missing), ovrcme (overcome), short words, e.g., pls (please), srsly (seriously), govt (government), msg (message) and repeated words e.g. soooo depressed (so depressed), okkk (ok). Additionally, people use phonetic substitution, e.g., 2nd (second), 2morrow (tomorrow), 4ever (forever), 4g8 (forget), w8 (wait), and words without spaces, e.g., prayforIran (pray for Iran), weneedsdonations (we need donations) to stuff more words in given limitation of the Twitter post under 140 charters [14].
The first module employs a series of regular expressions and linguistic utilities to normalize the text of the tweets. Spelling correction function, for example, utilized scspell (spell checker source code), 2 a spelling checking dictionary which allows to match each word in the given text against the English dictionary and replace misspelled and short words with its correct form. We manually build an initial dictionary of 1559 words with abbreviations and short cuts and their correct forms for abbreviations and phonetic variations, e.g., gbtw, get back to work; 2easy, too easy. We used Netlingo3 and Webopedia4 dictionaries available online to prepare a predefined list of ill-form and respective correct-form pair. The normalization function uses the above resources to replace each ill-form word from input text with each of its correct forms.
After normalization, we found several unrecognized terms which are not available in the English dictionary. For those terms, we used the WordNet5 lexicon to look up for words’ synset and eliminate those words the synset of which is not found. Finally, WordNet synset is used to extract the synonym of words (e.g., calamity, mishap, tragedy mapped into an accident) to increase the output significance. We eliminated tweets containing less than three words after removing stop words from the final corpus, as they were deemed them too short for training subsequent language models.
After basic preprocessing, we created the text corpus for further linguistic analysis by converting preprocessed text corpus into uni-grams and bigram’s bag-of-words vector. Previous studies have found that these two features outperform when used for similar classification tasks [15,16]. Finally, we used tf-idf (short for term frequency-inverse document frequency) to calculate the weight for each term to obtain terms’ vector [17]. In a tf-idf scheme, the basic vocabulary is formed by choosing the number of times a term appears in the document collection, here called term frequency (tf). After length normalization of term frequency, inverse document frequency is counted, for measuring the number of occurrences of a word in the entire corpus. As a result is a document-by-term matrix, is created, each row of which contains the tf-idf values for every document in the corpus. The advantage of tf-idf scheme is that it reduces documents of arbitrary length to fixed-length lists of numbers, and identifies the set of words that are more discriminative for documents in the collection. Since this paper aims to identify topics and find dominant words for each topic, finding some informative but infrequent words is more suitable than treating each word equally as in simple term frequency-based bag-of-words model in which infrequent words might rank low or even left undetected. Term frequency and inverse document frequency is calculated as:
where dft is the number of documents containing the term t appears, and N is the number of documents in the corpus. Then, the weight (Wt, d) vector for each term t in document d is calculated as:
By calculating all terms in the corpus, we create the vectors for each document. In this study, posts are considered as documents for constructing the terms vectors. We denote each document by a vector
The next module in the pipeline facilitates the automatic extraction of thematic structure from the preprocessed textual corpus. This is done with the use of topic modeling, which is the most commonly unsupervised learning technique used for the above-mentioned purpose. We used LDA [18] as a topic model to extract latent topics from a large Tweeter dataset. Unlike supervised learning, which requires prior annotations or labeling, LDA is an unsupervised learning algorithm, which uses probabilistic clustering based on the data itself, allowing us to conduct exploratory analyses on large unstructured textual data without requiring any prior knowledge.
LDA is a generative probabilistic model which assumes that each topic is a mixture of a set of words, and each document is a mixture of probable topics. LDA has the capability to identify the topic by considering the topics as latent random variables valued from the text document by using a hierarchical Bayesian analysis technique [18]. We used LDA to draw topics from a large corpus of text and then predict labels for a new document. Its use enables us to efficiently categorize large bodies of data based on latent topics and predicting the label for incoming new data without any human intervention. Initially, we treat the topic proportions of a document as a draw from LDA Dirichlet distribution. Next, we obtain the words in the document by repeatedly choosing a topic assignment from those proportions, then drawing a word from the corresponding topic.
LDA’s main weakness problem here is that it returns topics as numbered distributions rather than topic names. To overcome this, Ramage et al. [19] proposed a variation of LDA known as Labelled Latent Dirichlet Allocation (L-LDA) that associates a document with easily-interpretable topics. However, the topics and their corresponding labels must be defined manually. It shall be noted that one semantic topic can span across several topics extracted by LDA due to the various combination of words topics are consisted of; hence manual topic interpretation requires domain-specific knowledge. Moreover, it is tedious and time-consuming. The most generic approach to automatic labeling is drawing top n-words, which are represented in a topic distribution induced by LDA and selecting the most frequent words corresponding to a given topic. However, previous work has shown that top terms are not enough for interpreting the coherent meaning of a topic [20]. Furthermore, top terms do not necessarily reveal certain words relevant to the information clustered by a topic. More recent approaches have explored the use of external sources such as Wikipedia and WordNet for deriving candidate labels by means of lexical based algorithms applied to these sources [20,21]. However, those topic labeling approaches focus on topics deriving from well-formatted and static documents. On the other hand, the assignment of appropriate labels to topics which derive from tweets presents different challenges since tweets often contain ill-formed words. Moreover, the use of Twitter as the “what’s happening right now” tool introduces new event dependent relations among words that might not have a counterpart in existing knowledge sources (e.g., Wikipedia).
In contrast to previous approaches, this paper addresses the labeling of topics exposing event-related content that might not have a counterpart on existing external sources. Based on the observation that semantic similarities of a collection of documents can serve as a label representing that collection, we propose the generation of topic label candidates based on the semantic relevance of a document in the observed corpus. In our automatic label identification approach, the task is to discover a sequence of words for each topic
Given the set of documents
Once each document has been weighted, the documents can be ranked by their weights from which top m documents with the most weight can be drawn to choose the sequence of words being used for the topic label. For the top m relevant document, we draw topic words distribution rank by marginal probability of wi in topic j as follows:
where wn is the ranked list of words for topic j in the relevant document set kd. In each iteration, the above equation is applied for picking the sequence of highest weighted terms out of the highest weighted documents. For each word
The top x highest weighted sequence of terms is selected to generate a label. The length of the label could be the top two to four words depending on the desired length of the label. We use an update function that penalizes words that have already been picked. The results of the topic label extraction are assessed and compared with manually labeled data. The accuracy of the topic model is explained in the results section. The summarization method reveals words relevant to the information cluster of a topic that might not appear in top topic keywords merely by extracting top terms of a topic and using them as a topic label. In this way, the labels generated for topics belonging to different categories, generally extend the information provided by the topics’ top terms.
One of the limitations of topic modeling is that individual documents can be represented with a mixture of latent semantic topics in a document collection. It is essential to classify the posts in terms of events related to different humanitarian categories, which will help the emergency operators to sift through the top-ranked posts under the same category for understanding further the issues reported in a post. These classes should ideally be representative of the underlying data, in the sense that they reflect the problems caused by the disaster event. For this purpose, we use clustering techniques on the potentially relevant topics obtained from the topic model in the previous step. Automatically generated clusters are then manually observed by human experts who assign a category name/label to each cluster.
We obtained the topic proportion vector of each document from the LDA topic matrix to apply cluster analysis. Previous studies have demonstrated clustering effectiveness induced by topic modeling [15,22]. The workflow of topic model-derived clustering is shown in Fig. 2.
In the first method, LDA-derived topics are used as the corpus for cluster analysis, where each document (tweet) di is a vector of k topics in a document-topic matrix (Fig. 2a). Each document is assessed for its topic mixture proportion vector
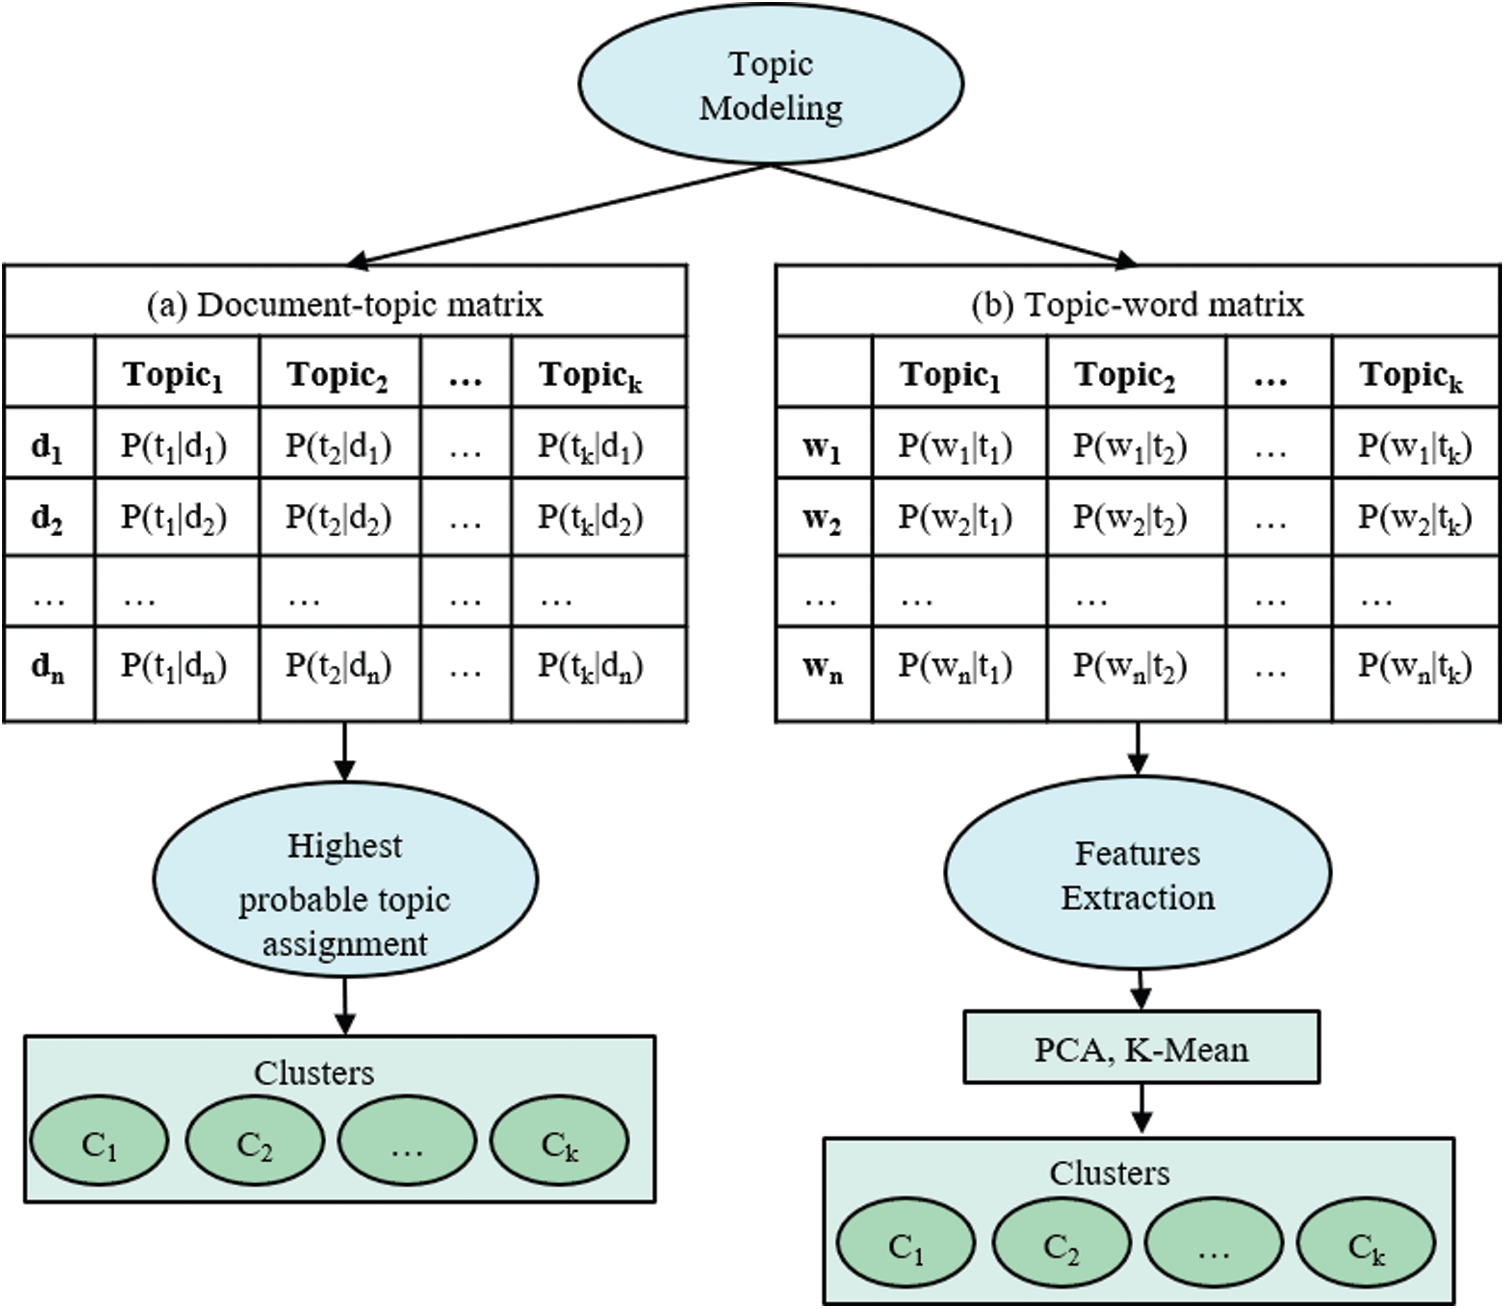
Figure 2: The workflow of the topic model-derived clustering methods
In the second method, we applied feature-based cluster analysis. The algorithm starts by extracting features from the LDA-induced topic-word matrix (Fig. 2b), where each column is a vector of n words (features) corresponding to semantic categories (topics). The words with the highest probability for each topic are selected to create feature vectors (dataset). Following that, the top fifteen words for each topic are selected for clustering analysis. To perform clustering, we first applied the Principal Component Analysis (PCA) [23] to reduce the feature vector’s dimension since the feature vector’s size is equal to the number of unique words in the corpus, which is too large to handle. While using PCA, we fixed a cumulative variance of 50% for the first component. We then applied conventional K-mean clustering [24] on the PCA spanned feature vectors to classify each text in the LDA-induced corpus. We compared the performance of each method and discussed it in the result section.
4.5 Fine-Tuning BERT Classifier
Social media users tend to post real-time situational information that could be used by disaster relief and response agencies for effective decision making. However, it is essential to classify the posts into different humanitarian categories for effective processing. After the classification, the dataset would be more informative for assessing the situation in terms of a specific response agency. Several studies have used [25,26] different classifiers to classify disaster-related social media posts using deep learning techniques, such as Convolutional Neural Network (CNN) [27], Gated Recurrent Unit (GRU) [28], and Long Short-term Memory (LSTM) [29]. A key element that impairs the performance of these techniques is the input embedding. Existing studies have commonly used pre-trained embedding packages to encode the textual information. However, most of the pre-trained packages are unidirectional with fixed parameters; hence they may not adapt to different disaster categories without tuning them.
Devlin et al. [30] recently proposed a state-of-the-art BERT model to enhance language representation. The model is designed to pre-train deep bidirectional representations from the unlabeled data by jointly conditioning both left and right contexts in all layers [30]. Unlike the unidirectional language model, BERT’s input representation is constructed by summing the corresponding token, segment, and position embeddings. Due to enhanced language representation, we adopted pre-trained BERT (BERT
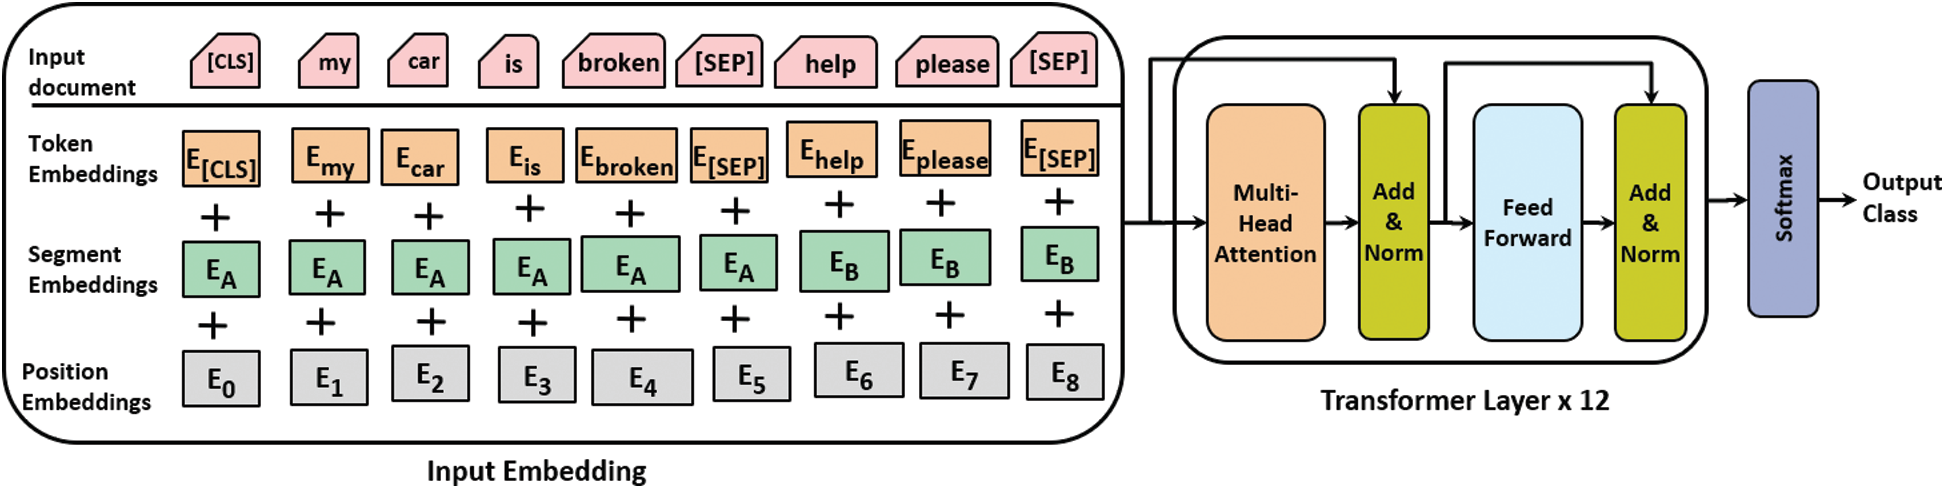
Figure 3: The architecture of the Fine-tuned BERT-base classifier
We adopted multiple baseline models to assess the performance of fine-tuned BERT model. The baseline models include CNN with GlobalMaxPooling, Deep Pyramid Convolutional Neural Network (DPCNN), and Recurrent Neural Network (RNN) with GRU units and attention layer and hidden dense layer on top. The performance of the different model is evaluated by calculating accuracies on validation and test dataset:
We label each post with a humanitarian category using the classifier so that new posts on a given disaster type can be automatically classified with no manual effort. The performance of the BERT-based classifier is discussed in the results section of the case study.
5 Preliminary Results on the COVID-19 Case Study
The proposed architecture has been validated on Twitter data collected from recent biological disasters i.e., COVID-19. We decided to focus on biological disasters and their impact on society provided the world’s current pandemic situation. However, the system can be extended to any other type of natural or human-made disaster. For all experiments, we used the Python programming language.
5.1 Data Collection and Preprocessing
We used Twitter Streaming API to collect data using keywords related to covid-19, Following keywords are used to collect data: coronavirus, corona virus, ncov19, ncov, covid, corvid-19, COVID-19, corona virus outbreak, ncov-19, pandemic, Saudi Arabia coronavirus update, Saudi Arabia COVID-19, coronavirus transmission, corona virus news, coronavirus outbreak, coronavirus weapon, coronavirus epidemic, coronavirus pandemic, coronavirus conspiracy, coronavirus news, nCov2019, #coronavirus, nCov, novel corona virus, Wuhan virus, coronavirus bio-weapon, social distancing, lock down, curfew news.
A total of 150,000 tweets were collected for experimentation purposes. After initial preprocessing and removing duplicates, the dataset size was reduced to 80,000. For each tweet, original post (tweet text), timestamp, and geographic information (coordinates) were obtained. All these fields are considered useful in deriving the patterns and identifying the purpose of the posts.
In the next step, the topic modeling algorithm LDA was applied to extract semantic topics from the preprocessed social data. The workflow of topic modeling consists of data processing, model training, parameter tuning, and identifying relevant topics. To select and realize the most efficient workflow, several topic models are trained by orchestrating preprocessing steps and applying different combinations of hyperparameters. For calculating the most appropriate number of topics, we used the genism coherence model. We choose 8 topics returned by LDA for the selected dataset because this number of topics achieved the highest coherence score (0.45).
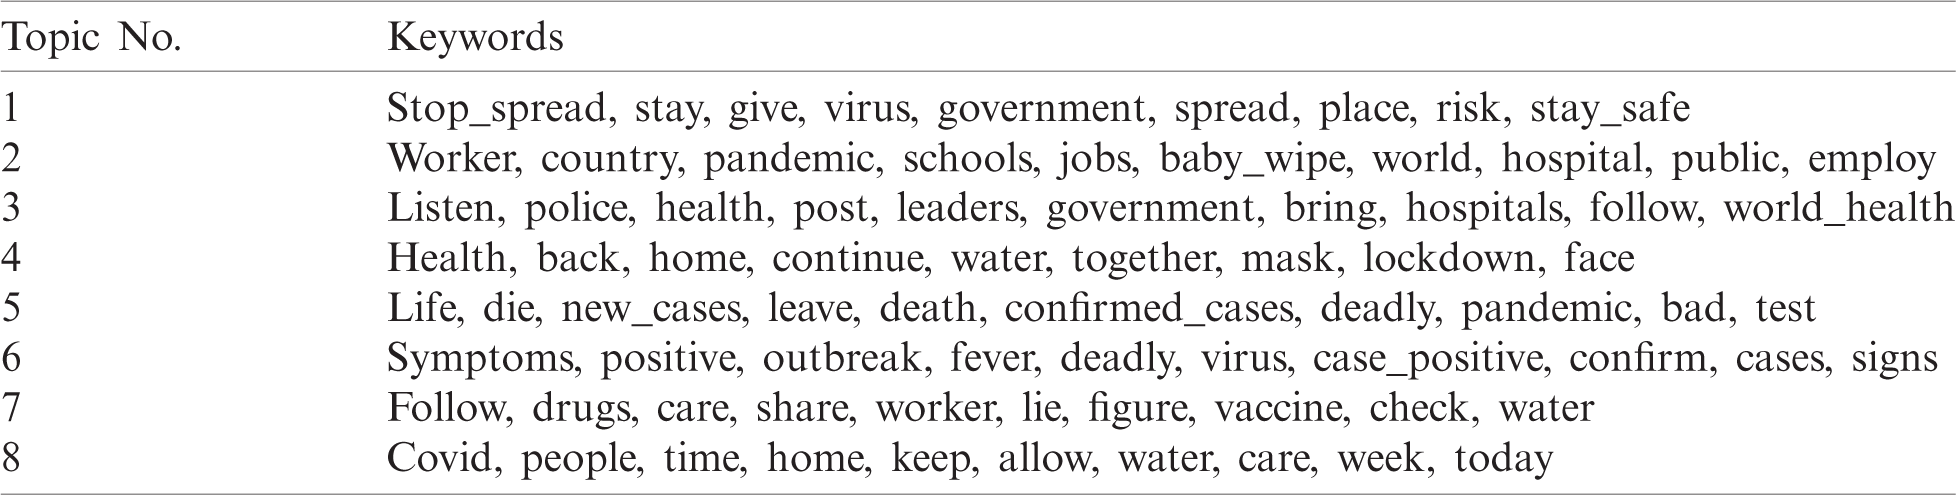
We examined the document-term matrix for 8 topics and obtained the top 10 keywords for each topic. Tab. 1 presents the results of the identified topics and the most popular words within each topic.
Unlike the traditional clustering approach, where each data point belongs to one cluster/topic, in topic modeling, it can belong to different topics. For example, a tweet can talk about different symptoms and treatments. For this reason, in Tab. 1, it can be observed that the same keywords are appearing in multiple topics. Additionally, semantic categories are grouped under topic numbers such as topics 1 and 2. In order to identify the semantic category, such as a topic referring to death reports or treatment, a domain-specific knowledge must be provided. One method is the manual analysis of the words appearing with high probability in the topic-word distribution while another automatic approach is based on matching keywords. For example, crisis-related social media posts are identified and classified in 23 information-specific categories providing a list of keywords dictionary that could also be used for topic identification [32].
Table 1: Latent topics and their top 10 keywords
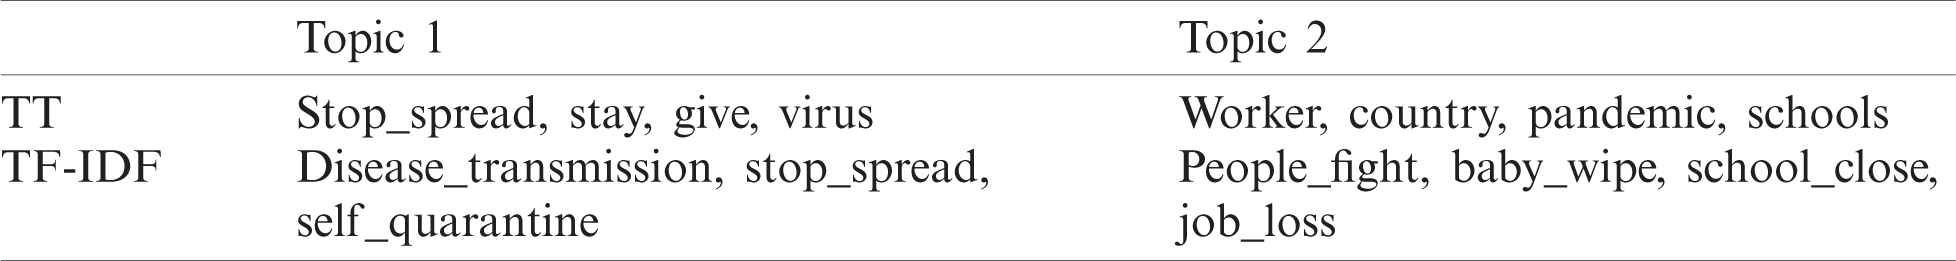
In this scenario, the keyword-based approach faces difficulties, since social media posts contain anything happening in the world, thus creating an exhaustive list of keywords for every event is not practically feasible. The other approach uses top topic words/terms to assign a semantic label to a topic. However, top topic words do not always reveal words relevant to the information cluster of a topic. Our proposed tf-id based summarization algorithm generates the labels for topics belonging to different categories by extending the top topic words to more topic coherent words in the highest-ranked documents under the target topic. In Tab. 2, we compared the top 3 terms sets extracted from LDA for the first two topics (listed under TT), with the label extracted by tf-idf based topic summarization method (listed under tf-idf). We can notice that TT does capture specific information related to an event; yet, it does not provide information regarding the transmission. In this sense, the topic label generated by tf-idf describes the posts related to disease transmission, more accurately. This experiment shows that frequency-based summarization techniques outperform top terms and relevance-based summarization techniques for generating topic labels that improve/can be improved by/upon the top-terms baseline without relying on any external sources. This is an attractive property for automatically generating topic labels for tweets where their event-related content might not have a counterpart on existing external sources.
Table 2: Comparison of top-term vs. tf-idf based topic label
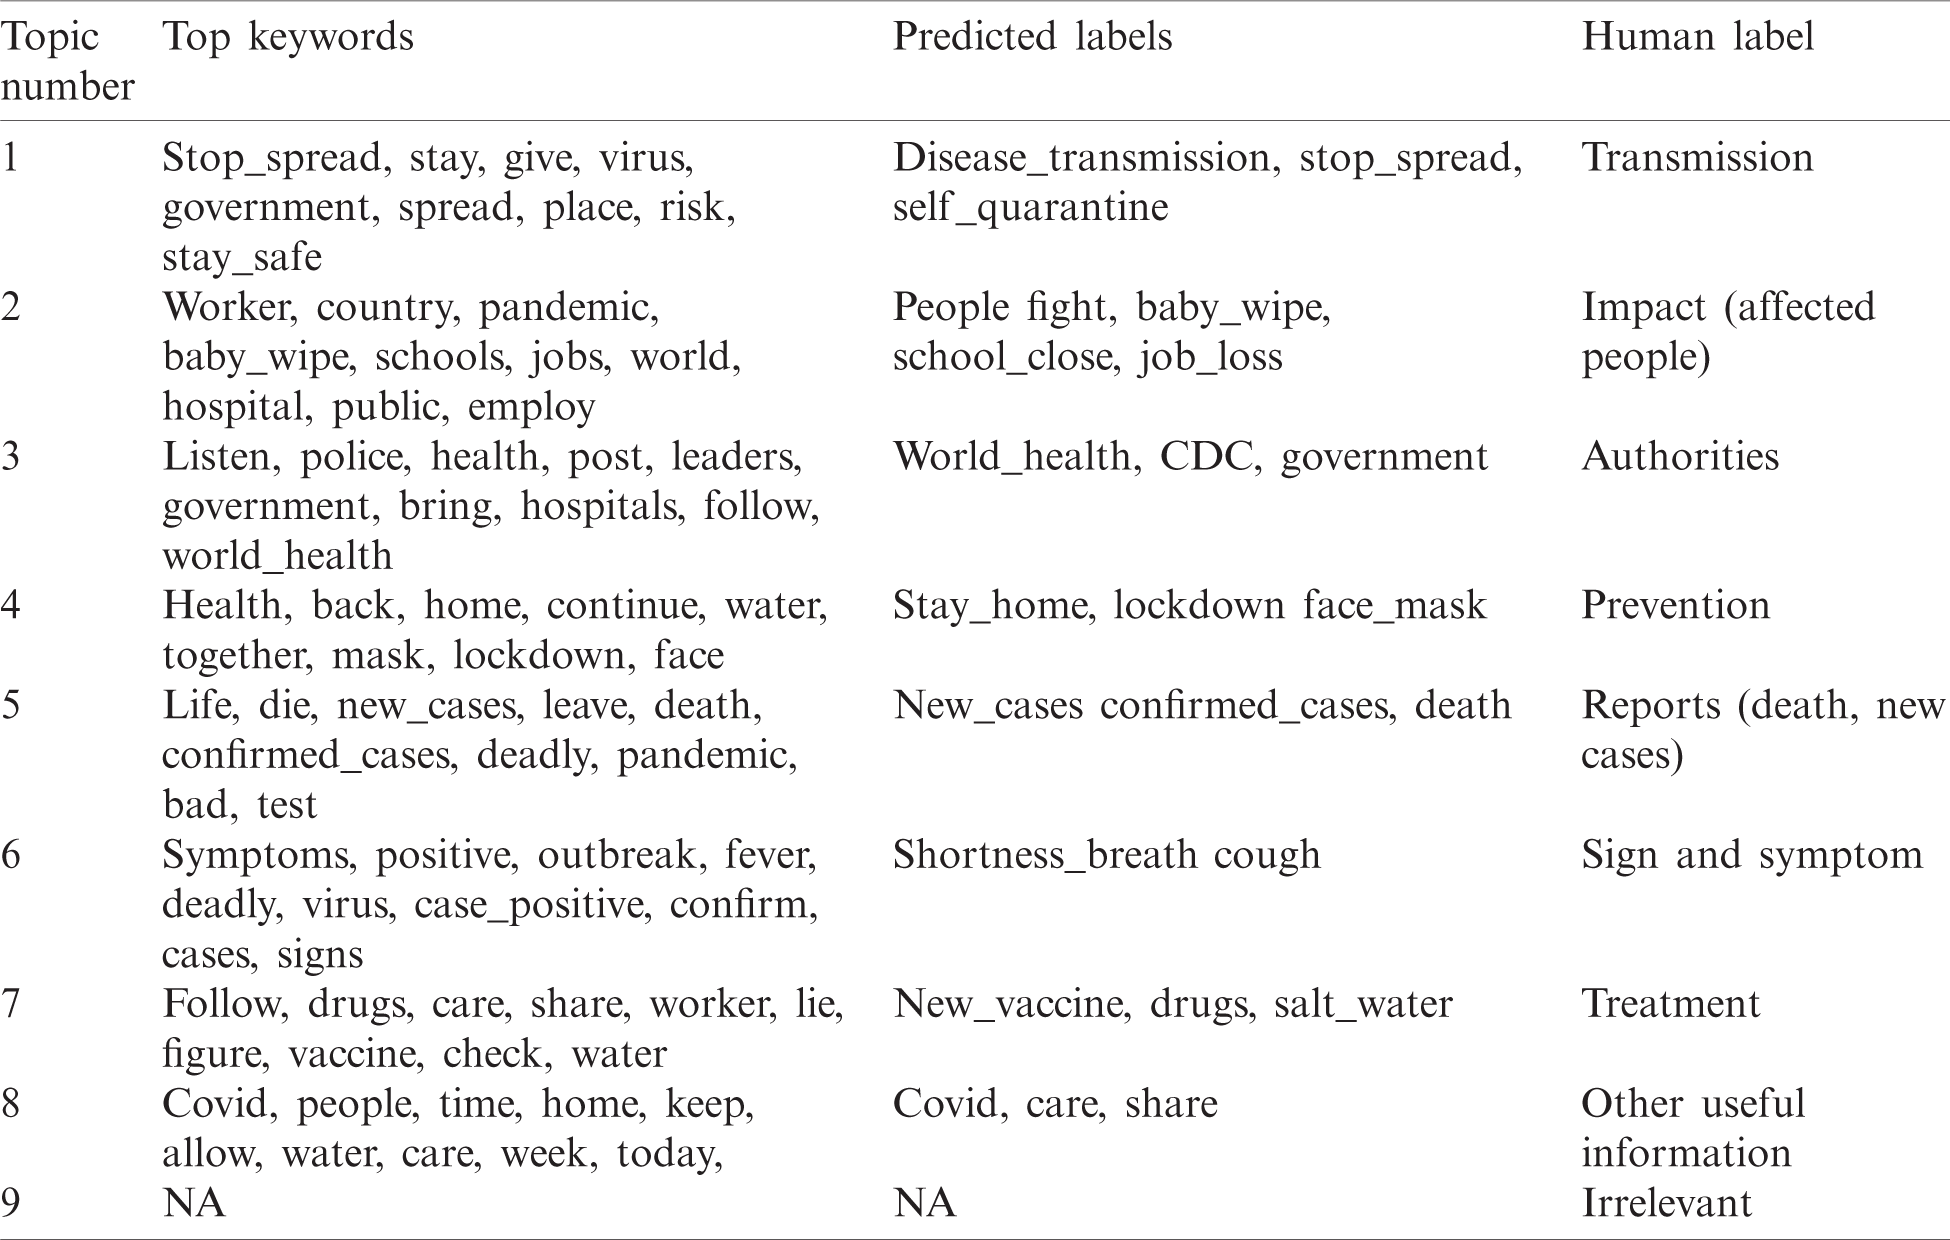
To evaluate the accuracy of the automatic labeling algorithm, we manually label 2000 tweets based on human interpretation and compare results to understand whether it is realistic to achieve/generate/assign/create/give comparable human labels. For this purpose, we randomly generate some Tweets to be used as samples in each topic in order to understand the themes of these topics. Our research team of 20 members discussed terms in each topic and grouped them into nine common themes (see Tab. 4).
Tab. 3 shows the topic number induced by LDA along with the corresponding label generated by the automatic labeling algorithm, and a possible/comparable human interpretation. We selected the same tweets to be labeled by the automatic labeling algorithm and compared results with human-labeled tweets to assess the accuracy of the proposed approach.
Table 3: Comparison of top-term vs. tf-idf based predicted labels and comparable human interpretation
A two-dimensional confusion matrix demonstrates the accuracy of the proposed automatic labeling algorithm by showing the number of actual and predicted labels. The confusion matrix consists of four values: true positives (TP) manually and automatically classified as positive), false negatives (FN) (automatically classified as negative), false positives (FP) only automatically classified as positive and true negatives (TN) both manually and automatically classified as negative (see Fig. 4a). The confusion matrix is used to evaluate the proposed topic model’s performance. It can be observed from Fig. 4b that the model is capable of predicting the correct labels with an error rate of only 3%–5% with the precision and recall of 95% and 96%, respectively, where precision and recall are calculated as follows:
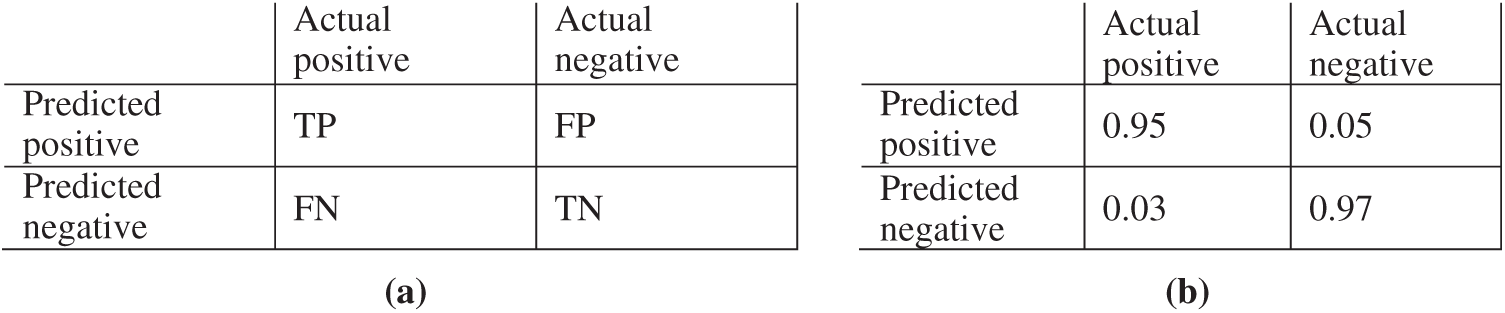
Figure 4: Error analysis of the topic model using a confusion matrix. (a) Confusion matrix, (b) Topic modeling evaluation matrix
The semantic categories for each document induced by the topic model are distributed over multiple topics. We used clustering (described in Section 4.4) to classify documents into distinct clusters. Each clustering function takes the LDA generated corpus as input and assigns documents to disjoint clusters. The results of the 8 topics are shown in Fig. 5. For each such cluster, the system tries to detect and extract only the main semantic class via analyzing all documents in the cluster. Manual analysis by expert annotators shows that cluster ‘0’ represents ‘impact,’ cluster ‘1’ represents ‘authorities,’ cluster ‘2’ represents ‘transmission,’ cluster ‘3’ represents ‘death reports,’ cluster ‘4’ represents ‘preventions,’ cluster 5 represents ‘sign and symptoms,’ cluster ‘6’ represents ‘treatment’ and cluster ‘7’ represents other useful information.
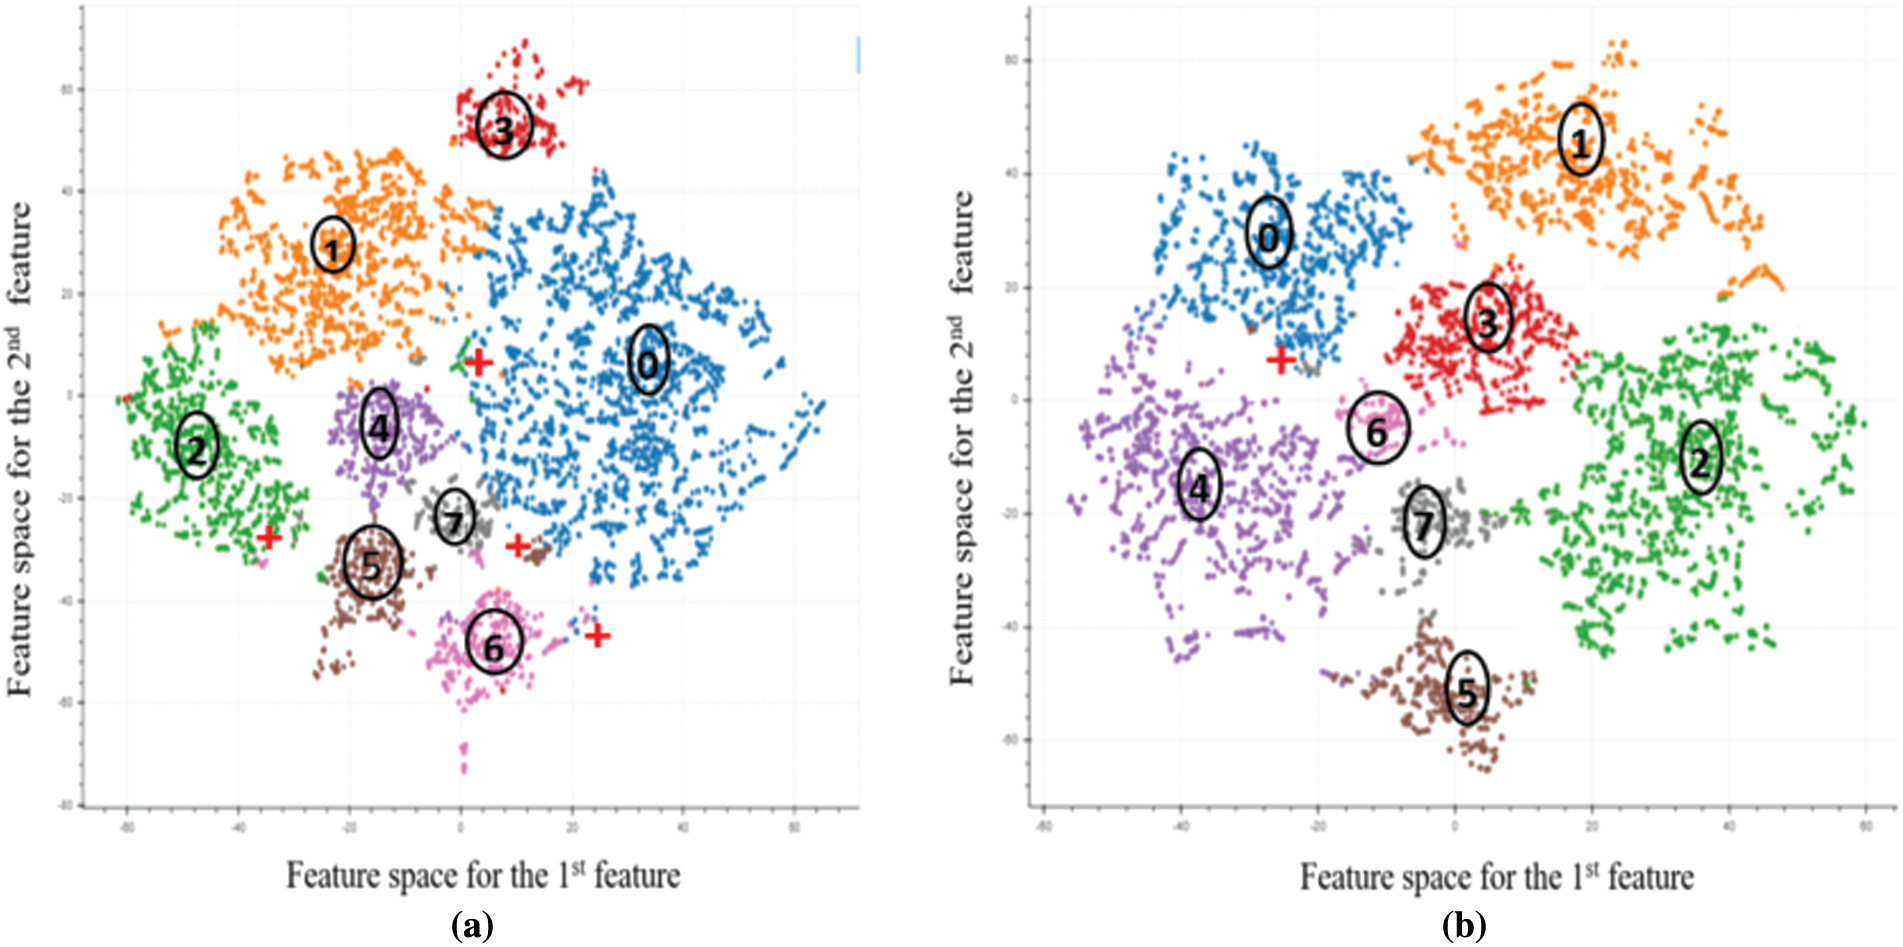
Figure 5: (a) Scatter plots represents the clustering results using the highest probable topic assignment; (b) Scatter plots illustrates the clustering results using feature extractions and k-mean clustering
At first, we used the document topic-matrix generated by the topic model in the previous step to assign each document to its highest probable topic. The scatter plot of the results on 8 topics shown in Fig. 5. It can be observed from Fig. 5a that documents on topics 2 and 5 are heavily misclassified under topic 0 (shown with “+” in Fig. 5a), and that there is overlap between clusters ‘0’ and ‘1’, ‘0’ and ‘7’, ‘0’ and ‘4’ and, ‘0’ and ‘6’. In the second set of experiments, we applied feature-based cluster analysis using LDA-induced word-topic matrix and applied K-mean clustering to improve classification results (see Fig. 5b). From Fig. 5b, we can see that misclassification is almost reduced to zero except for a few documents from cluster ‘7’ which were misclassified under cluster 0. Also, we can observe more disjoint clusters with a slight overlap between clusters 2 and 3, 2 and 1, 2, and 7. The observation indicates that feature-based clustering is performed better than the highest probable topic assignment; however, creating coherent categories from tweets can be computationally difficult due to noisy data. In fact, sometimes it is difficult even for experts quite difficult to identify a semantic category accurately.
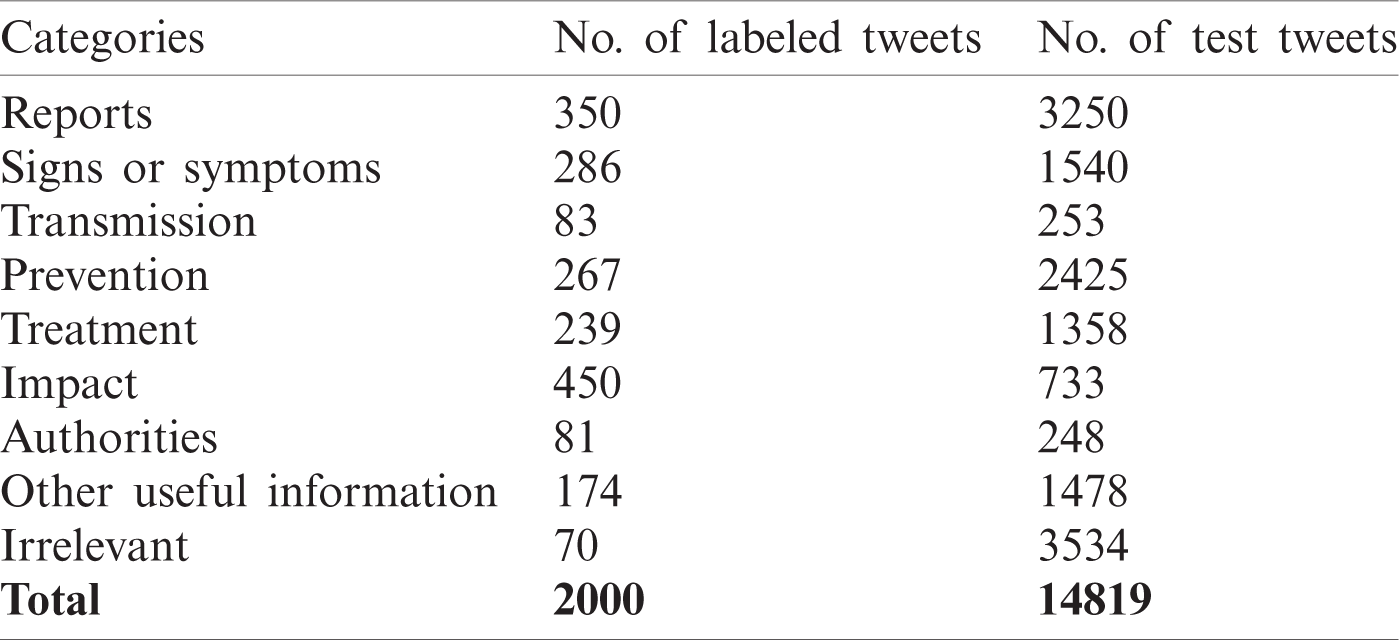
Classifying the social media posts into humanitarian categories is important for capturing the affected areas’ needs. We adopted the humanitarian categories and labeled data from Alam et al. [33] in order to for train and validate the/our models. We defined nine categories and manually labeled 2000 tweets (see Tab. 4) as described below:
1. Reports: the tweets are related to different reports, e.g., reports of deaths due to the disease, confirmed cases, and the number of cases reported.
2. Signs or symptoms: text contains symptoms such as fever, cough, diarrhea, and shortness of breath or questions related to these symptoms.
3. Disease transmission: text or questions related to disease transmission.
4. Disease prevention: questions or suggestions related to the prevention of the disease or refer to a new prevention strategy, e.g., travel ban, self-isolation, wash hands, social distancing, quarantine.
5. Disease treatment: questions or suggestions with regard to disease treatments.
6. Impact: e.g., unemployment, economic impact, reports about people affected by the disease.
7. Authorities: text related to government policies, WHO initiatives, etc.
8. Other useful information: other helpful information that is related to the disease itself.
9. Not related or irrelevant: text irrelevant to the situation.
We trained a classifier by fine-tuning a pre-trained BERT transformer [30]. To encode input sentences in accordance with BERT input format, we first used BERT tokenizer to split sentences into tokens, add special characters, i.e., [CLS] and [SEP], map tokens to IDs., pad, or truncate sentences to the fixed length and create an attention mask. The maximum length of a sequence was defined as 100, with shorter sequences padded and longer sequences truncated to the maximum length. The input sequence was represented by the token, segment, and position embeddings.
We used the BERT
Table 4: Labeled dataset for each category used for training and testing the models
We used some standard classification models such as GRU, CNN with GlobalMaxPooling and GRU, Deep Pyramid Convolutional Neural Network (DPCNN), Recurrent Neural Network (RNN) with GRU units and attention layer, and hidden dense layer on top. The validation and testing accuracy for the fine-tuned BERT and baseline models are shown in Tab. 5.
Table 5: Labeled dataset for each category used for training and testing the models
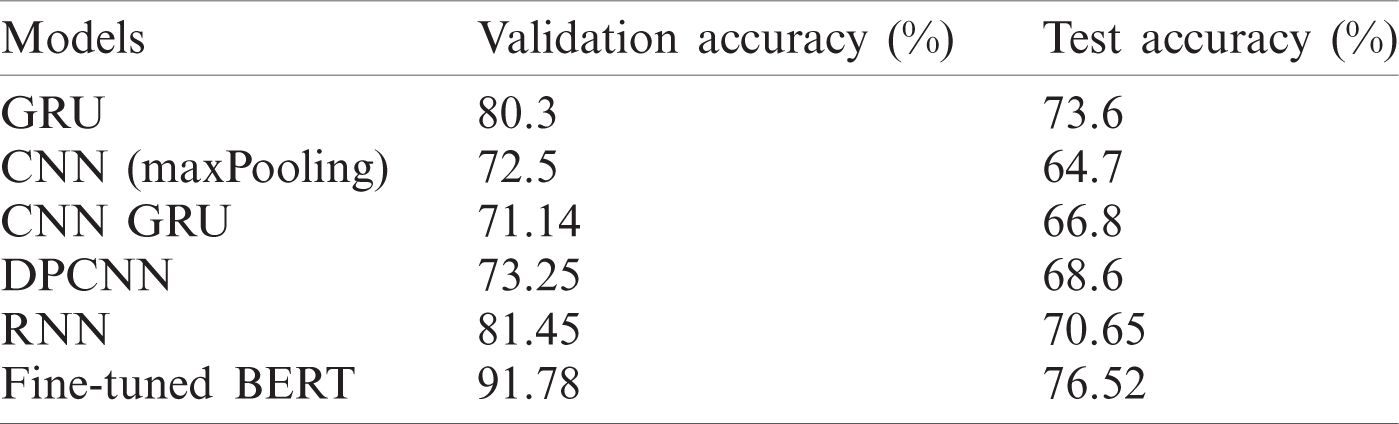
The fined-tuned BERT classifier achieved a validation accuracy of 91.78%, which is much higher than the standard models’ accuracy, ranging from 71% to 81%. The fine-tuned BERT model also outperforms other baseline deep learning models in terms of test accuracy. It is worth mentioning that this is a multi-classification problem (nine class); hence the validation accuracy is not very high compared to binary classification tasks. Also, due to the limited labeled dataset (2000 examples), the model would not learn features from the unseen text, hence achieving a lower test accuracy of 76.52%. A rigorous dataset labeling is required to address these problems. However, the classification results are reasonably acceptable for capturing most of the information categories and providing evidence for the capability of a fine-tuned BERT model used for precise classification.
This work presented a machine learning pipeline to automatically map the disaster events across the different humanitarian organizations for supporting their relief efforts. The pipeline integrates topic modeling, clustering, and classification with the capability to detect evolving disaster events and map them across different humanitarian categories using social media data. The proposed pipeline’s application was demonstrated in a case study related to the COVID-19 virus by using Twitter data. The results suggest the following: (1) the integrating enhanced topic summarization method is useful for detecting coherent topics and can be used to predict corresponding labels for real-time situation analysis; (2) In comparison to traditional clustering techniques the topic induced clustering method is more useful for grouping social media posts across different classes; (3) the fine-tuned BERT-based classifier performs better than standard deep-learning classifiers in classifying the tweets into different humanitarian categories.
The proposed machine learning pipeline offers important directions for future research. First, the proposed pipeline is validated on the COVID-19 case study. To extend the proposed pipeline capabilities to other disaster domains such as flood, traffic industrial accidents, and earthquakes can be further integrated into the pipeline. However, lack of broad humanitarian categories’ availability across different disaster domains might impair the process. Second, the integration of other intelligent techniques to uncover more situation awareness such as disaster-affected areas, entities mentioned in the posts, and additional useful information would better support response organizations in their relief work. Third, integration of other data sources such as different social media channels (Facebook, Instagram etc.), news articles, and remote sensing of data would help to gain better awareness for a disaster-affected region. However, integrating heterogeneous data into a unified format is a challenge. Finally, the integration of techniques used to identify social media posts’ credibility and information bias is an important area to be addressed.
Funding Statement: The authors extend their appreciation to the Deputyship for Research & Innovation, Ministry of Education in Saudi Arabia for funding this research work through the Project Number 523.
Conflicts of Interest: The authors declare that they have no conflicts of interest to report regarding the present study. The sponsor had no role in the study’s design; collection, analyses, or interpretation of data, in the writing of the manuscript, or in the decision to publish the results.
1https://esa.csiro.au/aus/index.html
2https://pypi.org/project/scspell3k/
3https://www.netlingo.com/acronyms.php
4https://www.webopedia.com/quick_ref/textmessageabbreviations.asp
5http://wordnetweb.princeton.edu/perl/webwn: NLTK’s English dictionary and the English database WordNet
1. D. Guha-Sapir, “The emergency events database (EM-DAT),” 2018. [Online]. Available: https://www.emdat.be/. [Google Scholar]
2. World Bank, “Global Facility for Disaster Reduction and Recovery (GFDRR),” 2017. [Online]. Available: https://www.gfdrr.org/index.php/comprehensive-risk-profiling-and-assessment-kingdom-saudi-arabia. [Google Scholar]
3. O. Okolloh, “Ushahidi, or ‘testimony’: Web 2.0 tools for crowdsourcing crisis information,” Participatory Learning and Action, vol. 59, no. 1, pp. 65–70, 2009. [Google Scholar]
4. R. Cross, “Emergency social media summit,” 2010. [Online]. Available: https://redcrosschat.org/about-the-emergency-social-data-summit/. [Google Scholar]
5. M. Yu, C. Yang and Y. Li, “Big data in natural disaster management: A review,” Geosciences, vol. 8, no. 5, pp. 165, 2018. [Google Scholar]
6. K. Starbird and J. Stamberger, “Tweak the tweet: Leveraging microblogging proliferation with a prescriptive syntax to support citizen reporting,” in Proc. of the 7th Int. ISCRAM Conf., Information Systems for Crisis Response and Management, Seattle, WA, vol. 1, pp. 1–5, 2010. [Google Scholar]
7. P. Meier, Digital Humanitarians: How Big Data is Changing the Face of Humanitarian Response, Crc Press, 2015. [Google Scholar]
8. A. M. MacEachren, A. Jaiswal, A. C. Robinson, S. Pezanowski, A. Savelyev et al., “Senseplace2: Geotwitter analytics support for situational awareness,” in IEEE Conf. on Visual Analytics Science and Technology, Providence, RI, USA, pp. 181–190, 2011. [Google Scholar]
9. R. Power, B. Robinson, J. Colton and M. Cameron, “Emergency situation awareness: Twitter case studies,” in Int. Conf. on Information Systems for Crisis Response and Management in Mediterranean Countries, Lecture Notes in Business Information Processing, Toulouse, France, Springer, vol. 196, pp. 218–231, 2014. [Google Scholar]
10. F. Abel, C. Hauff, G.-J. Houben, R. Stronkman and K. Tao, “Twitcident: Fighting fire with information from social web streams,” in Proc. of the 21st Int. Conf. on World Wide Web, New York, United States, Association for Computing Machinery (ACMpp. 305–308, 2012. [Google Scholar]
11. M. Imran, C. Castillo, J. Lucas, P. Meier and S. Vieweg, “AIDR: Artificial intelligence for disaster response,” in Proc. of the 23rd Int. Conf. on World Wide Web, Seoul Korea, Association for Computing Machinery (ACMpp. 159–162, 2014. [Google Scholar]
12. Z. Ashktorab, C. Brown, M. Nandi and A. Culotta, “Tweedr: Mining twitter to inform disaster response,” in Proc. of the 11th Int. ISCRAM Conf., Pennsylvania, USA, pp. 269–272, 2014. [Google Scholar]
13. J. Rogstadius, M. Vukovic, C. A. Teixeira, V. Kostakos, E. Karapanos et al., “CrisisTracker: Crowdsourced social media curation for disaster awareness,” IBM Journal of Research and Development, vol. 57, no. 5, pp. 1–13, 2013. [Google Scholar]
14. M. Imran, P. Mitra and C. Castillo, “Twitter as a lifeline: Human-annotated Twitter corpora for NLP of crisis-related messages,” in 10th Int. Conf. on Language Resources and Evaluation, LREC 2016, Slovenia, European Language Resources Association (ELRApp. 1638–1643, 2016. [Google Scholar]
15. F. Alam, F. Ofli and M. Imran, “Descriptive and visual summaries of disaster events using artificial intelligence techniques: Case studies of Hurricanes Harvey, Irma, and Maria,” Behaviour & Information Technology, vol. 39, no. 3, pp. 288–318, 2020. [Google Scholar]
16. M. Imran, S. Elbassuoni, C. Castillo, F. Diaz and P. Meier, “Extracting information nuggets from disaster-related messages in social media,” in Proc. of the 10th Int. ISCRAM Conf., Baden, Germany, pp. 791–800, 2013. [Google Scholar]
17. C. C. Naun, “Book review: Introduction to modern information retrieval,” Library Resources & Technical Services, vol. 55, no. 4, pp. 239–240, 2011. [Google Scholar]
18. D. M. Blei, A. Y. Ng and M. I. Jordan, “Latent dirichlet allocation,” Journal of Machine Learning Research, vol. 3, no. Jan, pp. 993–1022, 2003. [Google Scholar]
19. D. Ramage, D. Hall, R. Nallapati and C. D. Manning, “Labeled LDA: A supervised topic model for credit attribution in multi-labeled corpora,” in Proc. of the 2009 Conf. on Empirical Methods in Natural Language Processing, Singapore: Association for Computational Linguistics, vol. 1, pp. 248–256, 2009. [Google Scholar]
20. Q. Mei, X. Shen and C. Zhai, “Automatic labeling of multinomial topic models,” in Proc. of the 13th ACM SIGKDD Int. Conf. on Knowledge Discovery and Data Mining, California, USA, Association for Computing Machinery (ACMpp. 490–499, 2007. [Google Scholar]
21. J. H. Lau, K. Grieser, D. Newman and T. Baldwin, “Automatic labelling of topic models,” in Proc. of the 49th Annual Meeting of the Association for Computational Linguistics: Human Language Technologies, Oregon, USA: Association for Computational Linguistics, vol. 1, pp. 1536–1545, 2011. [Google Scholar]
22. W. Zhao, W. Zou and J. J. Chen, “Topic modeling for cluster analysis of large biological and medical datasets,” in Proc. of the 11th Annual MCBIOS Conf., Oklahoma, USA, BioMed Central, vol. 15, pp. 1–11, 2014. [Google Scholar]
23. G. H. Dunteman, Principal Components Analysis (no. 69), Oaks, California: Sage, 1989. [Google Scholar]
24. J. A. Hartigan and M. A. Wong, “Algorithm AS 136: A k-means clustering algorithm,” Journal of the Royal Statistical Society Series c (Applied Statistics), vol. 28, no. 1, pp. 100–108, 1979. [Google Scholar]
25. Z. Zhang, Q. He, J. Gao and M. Ni, “A deep learning approach for detecting traffic accidents from social media data,” Transportation Research Part C: Emerging Technologies, vol. 86, no. 1, pp. 580–596, 2018. [Google Scholar]
26. C. Fan, F. Wu and A. Mostafavi, “A hybrid machine learning pipeline for automated mapping of events and locations from social media in disasters,” IEEE Access, vol. 8, pp. 10478–10490, 2020. [Google Scholar]
27. X. Huang, C. Wang, Z. Li and H. Ning, “A visual-textual fused approach to automated tagging of flood-related tweets during a flood event,” International Journal of Digital Earth, vol. 12, no. 11, pp. 1248–1264, 2019. [Google Scholar]
28. J. Chung, C. Gulcehre, K. Cho and Y. Bengio, “Empirical evaluation of gated recurrent neural networks on sequence modeling,” in NIPS 2014 Workshop on Deep Learning, Quebec, Canada, 2014. [Google Scholar]
29. S. Hochreiter and J. Schmidhuber, “Long short-term memory,” Neural Computation, vol. 9, no. 8, pp. 1735–1780, 1997. [Google Scholar]
30. J. Devlin, M.-W. Chang, K. Lee and K. Toutanova, “Bert: Pre-training of deep bidirectional transformers for language understanding,” 2018. [Online]. Available: https://arxiv.org/abs/1810.04805. [Google Scholar]
31. A. Vaswani, N. Shazeer, N. Parmar, J. Uszkoreit, L. Jones et al., “Attention is all you need,” in Proc. of the 31st Int. Conf. on Neural Information Processing Systems, NY, United States: Curran Associates Inc., pp. 6000–6010, 2017. [Google Scholar]
32. A. Olteanu, C. Castillo, F. Diaz and S. Vieweg, “Crisislex: A lexicon for collecting and filtering microblogged communications in crises,” in Proc. of Eighth Int. AAAI Conf. on Weblogs and Social Media, Michigan, USA, vol. 8, no. 1, 2014. [Online]. Available: https://ojs.aaai.org/index.php/ICWSM/article/view/14538. [Google Scholar]
33. F. Alam, F. Ofli and M. Imran, “Crisismmd: Multimodal twitter datasets from natural disasters,” in Proc. of Twelfth Int. AAAI Conf. on Web and Social Media, California, USA, vol. 12, no. 1, 2018. [Online]. Available: https://ojs.aaai.org/index.php/ICWSM/article/view/14983. [Google Scholar]
 | This work is licensed under a Creative Commons Attribution 4.0 International License, which permits unrestricted use, distribution, and reproduction in any medium, provided the original work is properly cited. |