DOI:10.32604/cmc.2021.017435
| Computers, Materials & Continua DOI:10.32604/cmc.2021.017435 | |
| Article |
Machine Learning-Based Two-Stage Data Selection Scheme for Long-Term Influenza Forecasting
School of Electrical Engineering, Korea University, Seoul, 02841, Korea
*Corresponding Author: Eenjun Hwang. Email: ehwang04@korea.ac.kr
Received: 29 January 2021; Accepted: 01 March 2021
Abstract: One popular strategy to reduce the enormous number of illnesses and deaths from a seasonal influenza pandemic is to obtain the influenza vaccine on time. Usually, vaccine production preparation must be done at least six months in advance, and accurate long-term influenza forecasting is essential for this. Although diverse machine learning models have been proposed for influenza forecasting, they focus on short-term forecasting, and their performance is too dependent on input variables. For a country’s long-term influenza forecasting, typical surveillance data are known to be more effective than diverse external data on the Internet. We propose a two-stage data selection scheme for worldwide surveillance data to construct a long-term forecasting model for influenza in the target country. In the first stage, using a simple forecasting model based on the country’s surveillance data, we measured the change in performance by adding surveillance data from other countries, shifted by up to 52 weeks. In the second stage, for each set of surveillance data sorted by accuracy, we incrementally added data as input if the data have a positive effect on the performance of the forecasting model in the first stage. Using the selected surveillance data, we trained a new long-term forecasting model for influenza and perform influenza forecasting for the target country. We conducted extensive experiments using six machine learning models for the three target countries to verify the effectiveness of the proposed method. We report some of the results.
Keywords: Influenza; data selection; machine learning; forecasting
Seasonal influenza is one of the most globally prevalent infectious diseases, annually causing tens of millions of respiratory illnesses and hundreds of thousands of deaths worldwide [1]. Most countries have established national health institutes and conducted various activities, including disinfection and quarantine, to reduce the losses. One of the most effective ways to prevent an influenza pandemic is to prepare an influenza vaccine on time [2]. However, due to the time-consuming nature of vaccine production, an elaborate vaccine strategy should be prepared at least six months in advance [3]. Substantial uncertainty exists in such a long-term strategy, which leads to an imbalance in the supply and demand of influenza vaccines during influenza seasons. An insufficient number of vaccines cannot prevent an increase in the number of influenza patients. However, an oversupply of vaccines leads to economic loss because obsolete vaccines must be discarded. Therefore, forecasting how many influenza patients will occur after a long period is required to ensure a smooth vaccine supply [4].
With the recent development of machine learning (ML) technology, various ML-based forecasting models have been proposed to achieve better forecasting accuracy [5–8]. These models take data-driven approaches to identify the influence of various factors represented by the input variables and show superior forecasting performance compared to the compartmental and statistical models [9,10]. However, most ML-based forecasting models for influenza perform short-term forecasting. Diverse data sources exist for short-term influenza forecasting, such as Google searches and microblogs. Their effectiveness has already been proven in many studies [11,12]. In contrast, long-term forecasting faces increasing uncertainty from various sources, such as the accumulation of errors and lack of information [13]. Hence, selecting appropriate input variables is important to guarantee good forecasting performance in ML-based long-term influenza forecasting. Otherwise, the forecasting performance may deteriorate [14]. For long-term influenza forecasting, traditional surveillance data can provide much more comprehensive data with a small time lag, which is easier to maintain and more reliable for a long-term decision-making system than Internet data [9]. Traditional surveillance data generally refers to the number of reported cases over time for a particular disease.
In this paper, we propose an ML-based two-stage data selection scheme for worldwide surveillance data to construct a long-term forecasting model for influenza in a target country after 26 weeks (about six months). In the first stage, based on a simple forecasting model using the country’s surveillance data, we measured performance by adding foreign surveillance data shifted by up to 52 weeks. In the second stage, for each set of surveillance data sorted by performance, we incrementally added each set of surveillance data if it positively affects forecasting. Using the resulting surveillance data, we trained another long-term forecasting model of influenza. To evaluate the performance of our proposed method, we conducted extensive experiments using the influenza surveillance data for various countries and several ML models.
The contributions of this paper are as follows:
• We propose a data selection method for foreign surveillance data, which we use as input variables to construct an accurate forecasting model of influenza regardless of the target country or forecasting model.
• We achieved outstanding forecasting accuracy using traditional surveillance data as input variables without external data sources.
• We verified the effectiveness of the proposed method through extensive comparisons with popular ML models.
The remainder of this paper is organized as follows. Section 2 discusses the literature review. Next, Section 3 describes the details of the proposed scheme. Section 4 demonstrates various experiments, and finally, Section 5 presents the conclusions.
This section presents a brief literature review on various models for influenza forecasting. Work on influenza forecasting can be generally classified into three categories. The first category is based on compartment models, which use differential equations to model infectious disease transmission. For instance, Zhang et al. [15] proposed a spatiotemporal risk assessment model based on the susceptible infected recovered model, evaluating four influencing factors: biological, behavioral, and environmental parameters and infectious sources. They displayed the model output in a set of maps to analyze how these factors affect the spread of infectious diseases in Beijing. Because these models require a relatively small number of parameters, these models are limited because they often have a low forecasting accuracy or cannot find a correlation between various data when dealing with big data [16].
The second category is based on statistical or time-series-based models. For instance, Choi et al. [17] employed a Bayesian maximum entropy method of spatiotemporal statistics to analyze the geographical risk patterns of influenza mortality in California during winter. They found that the high risk of influenza initially occurred during December in the west-central region of the state, and the risk distribution was extended in the south and east-central regions of the state. Choi et al. [18] proposed an autoregressive integrated moving average (ARIMA) model for forecasting influenza activity. They collected the number of deaths related to pneumonia and influenza and used their ratio to measure influenza activity. Although these models are flexible in capturing the trending behavior of the affected populations, they sometimes suffer from poor accuracy because the influence of external factors (e.g., climate and environmental factors) is not captured well [19].
The final category is based on ML-based models. Cheng et al. [9] proposed an ensemble approach for short-term influenza forecasting in Taiwan. They used the four ML-based forecasting models random forest (RF), ARIMA, support vector regression, and extreme gradient boosting (XGB) for traditional surveillance data from Taiwan. Then, they integrated their forecasting results using a linear kernel model to produce a more robust model than the individual model. Park et al. [8] used data from other countries to improve the forecasting accuracy of influenza occurrences in a specific country. They obtained the similarity between traditional surveillance data from the target country and other countries with the Euclidean distance. Then, they selected countries with high similarity in influenza patterns and exploited their data as input variables using a light gradient boosting machine (LGBM). Venna et al. [19] proposed a long short-term memory (LSTM)-based multi-stage scheme for influenza forecasting. They employed LSTM to capture the temporal dynamics of seasonal influenza in the first stage. During subsequent stages, the situational time lag between the influenza occurrence and weather variables and the spatial proximity of different geographical regions were captured to adjust the error introduced by the original forecasting model to improve the model performance further. These models take a data-driven approach and grasp the influence of various factors used as input variables, exhibiting superior forecasting results compared to the compartmental and statistical models [9,10].
Most studies on influenza forecasting, including the aforementioned studies, have been for short-term forecasting. In contrast, the studies on long-term influenza forecasting are not yet sufficient. In short-term influenza forecasting, diverse data sources exist, such as Google searches and microblogs, whose effectiveness has already been proven [11,12]. However, long-term forecasting faces growing uncertainty arising from various problems, such as the accumulation of errors and lack of information [13]. Choi et al. [20] presented a long-term influenza forecasting scheme for the United States (US) using influenza activities in other countries. They first collected the data widely used in influenza forecasting, including traditional surveillance data from other countries and search queries from Google Trend (GT). They calculated the cross-correlation between the traditional data from the US and other countries with similar seasonal patterns and influenza outbreaks, and employed highly correlated data as input variables to forecast the next seasonal influenza pattern using ML models. Although they achieved remarkable forecasting accuracy, they manually selected countries with a high correlation to the target country using a statistical method. In this study, we propose a data selection scheme that automatically finds surveillance data from other countries that can contribute to the prediction of the target country using an ML model to improve efficiency and accuracy. We demonstrate that the input configuration based on this selection improves the performance of diverse influenza forecasting models.
In this section, we describe the proposed scheme in detail. Fig. 1 illustrates the overall structure of the scheme, which is composed of three parts: (1) data collection and preprocessing, (2) data selection for configuring input variables for the forecasting model, and (3) influenza forecasting for the target country. In the following sections, we first describe the data collection and preprocessing part, and then the data selection and the forecasting part together.
3.1 Data Collection and Preprocessing
In this study, we collected influenza surveillance data from the FluNet database of the World Health Organization (WHO) [21]. FluNet is a global web-based tool for influenza virological surveillance, which was first launched in 1997. Influenza surveillance data have been uploaded to the FluNet database every week. Among the diverse data provided by FluNet, we used the number of influenza patients in 168 countries from the first week in 2010 to the 52nd week in 2018. We collected data from 2010 because influenza showed a peculiar outbreak pattern in 2009 due to the introduction of a new epidemic strain (INF A H1N1 pdm09) [22]. Some countries uploaded surveillance data only when they had high influenza activity. Hence, we replaced the missing data in the dataset with zero. For the collected surveillance data, we performed a min-max normalization for each country, which is necessary to prevent data selection from focusing on a few specific countries with high average occurrences.
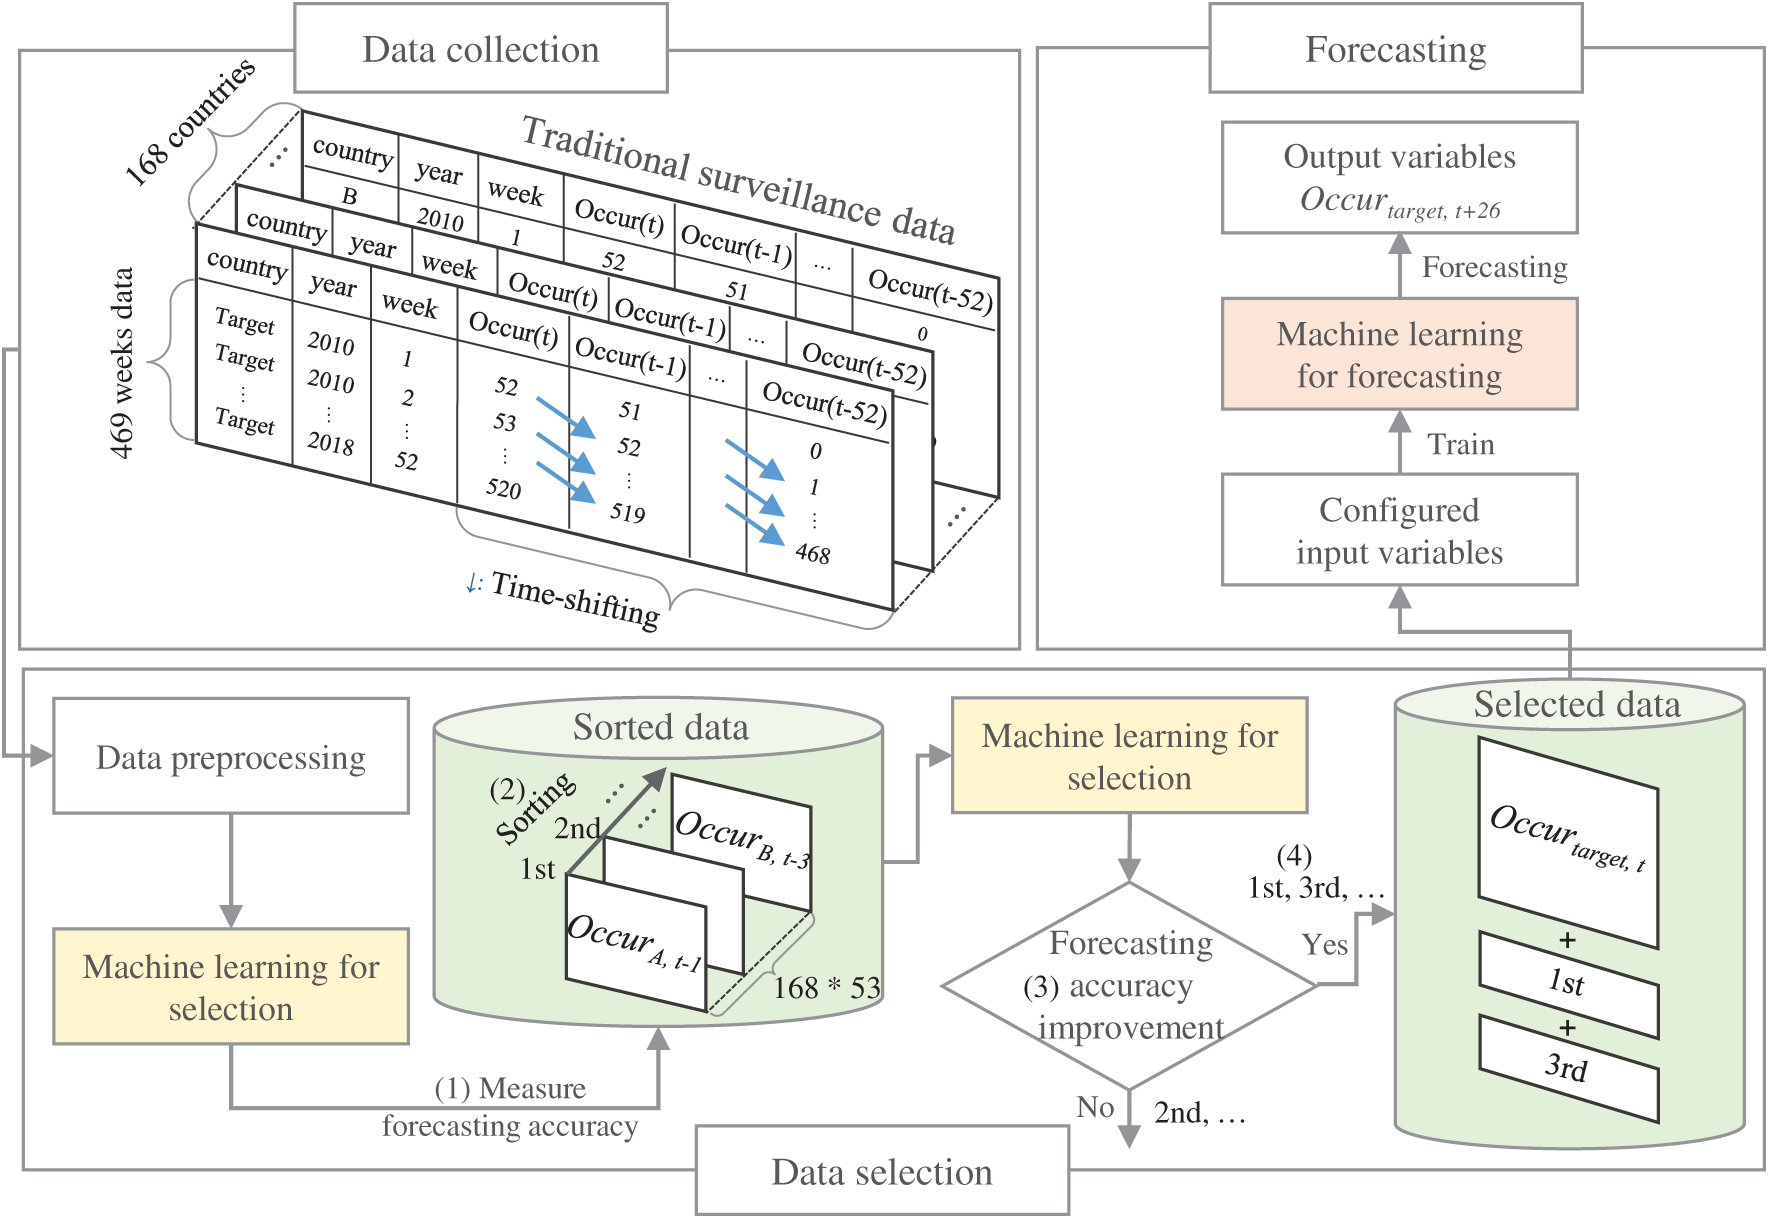
Figure 1: Overall structure of the proposed scheme
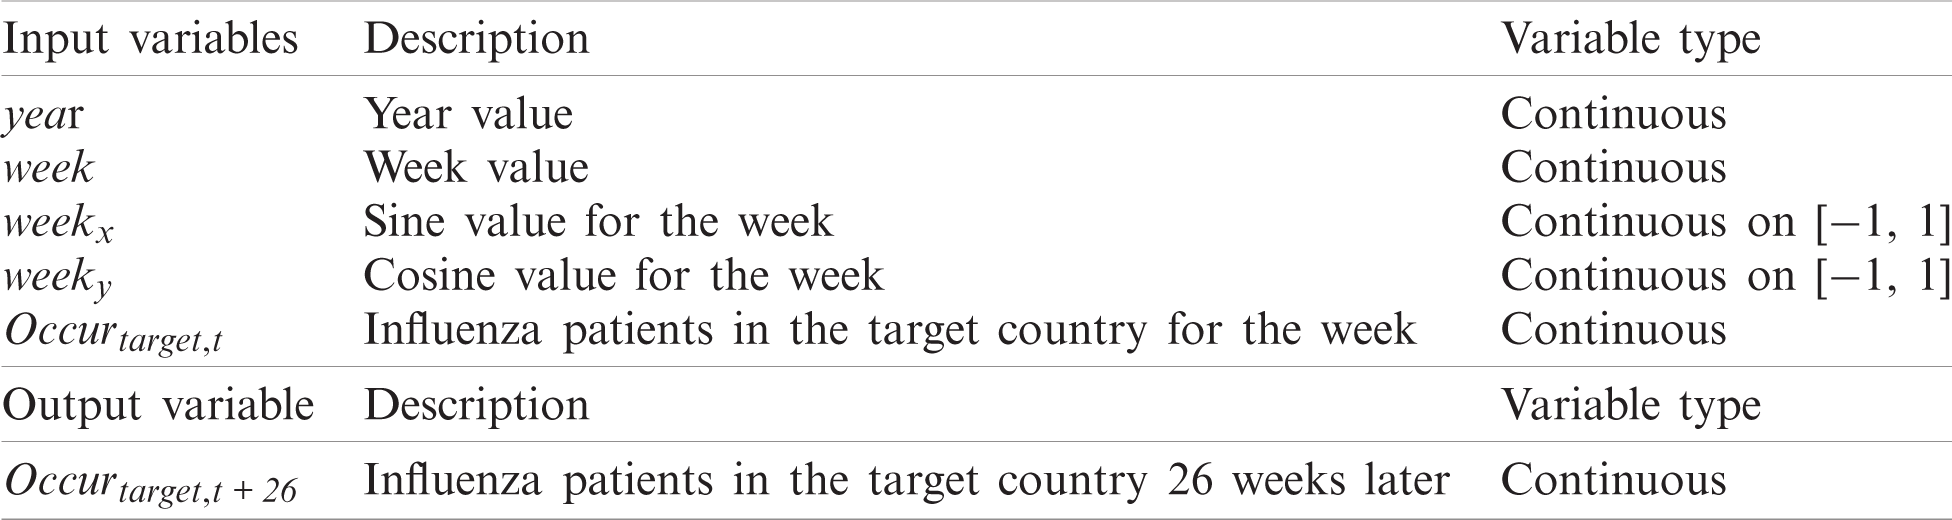
In addition to the surveillance data, we also collected time information, such as the year and week in which the surveillance data were collected. As one year consists of 52 or 53 weeks, we represented the week in the ML model using this week number. In particular, to reflect the periodic property of the week, we transformed the week number into two-dimensional data using Eqs. (1) and (2) [23]. Cycle represents the period of the week. For instance, when we transform the first week of 2015 into two-dimensional data, week and cycle are 1 and 53, respectively, and weekx and weeky are sin((360/53) * 1) and cos((360/53) * 1), respectively. Further explanations of this transformation can be found in [24].
Tab. 1 lists the initial input and output variables that we considered in this paper. Initial input variables of the forecasting ML model are necessary to provide basic information such as time and the number of influenza patients in the target country. The initial input variables include the year, week, weekx, weeky, and
3.2 Data Selection and Forecasting
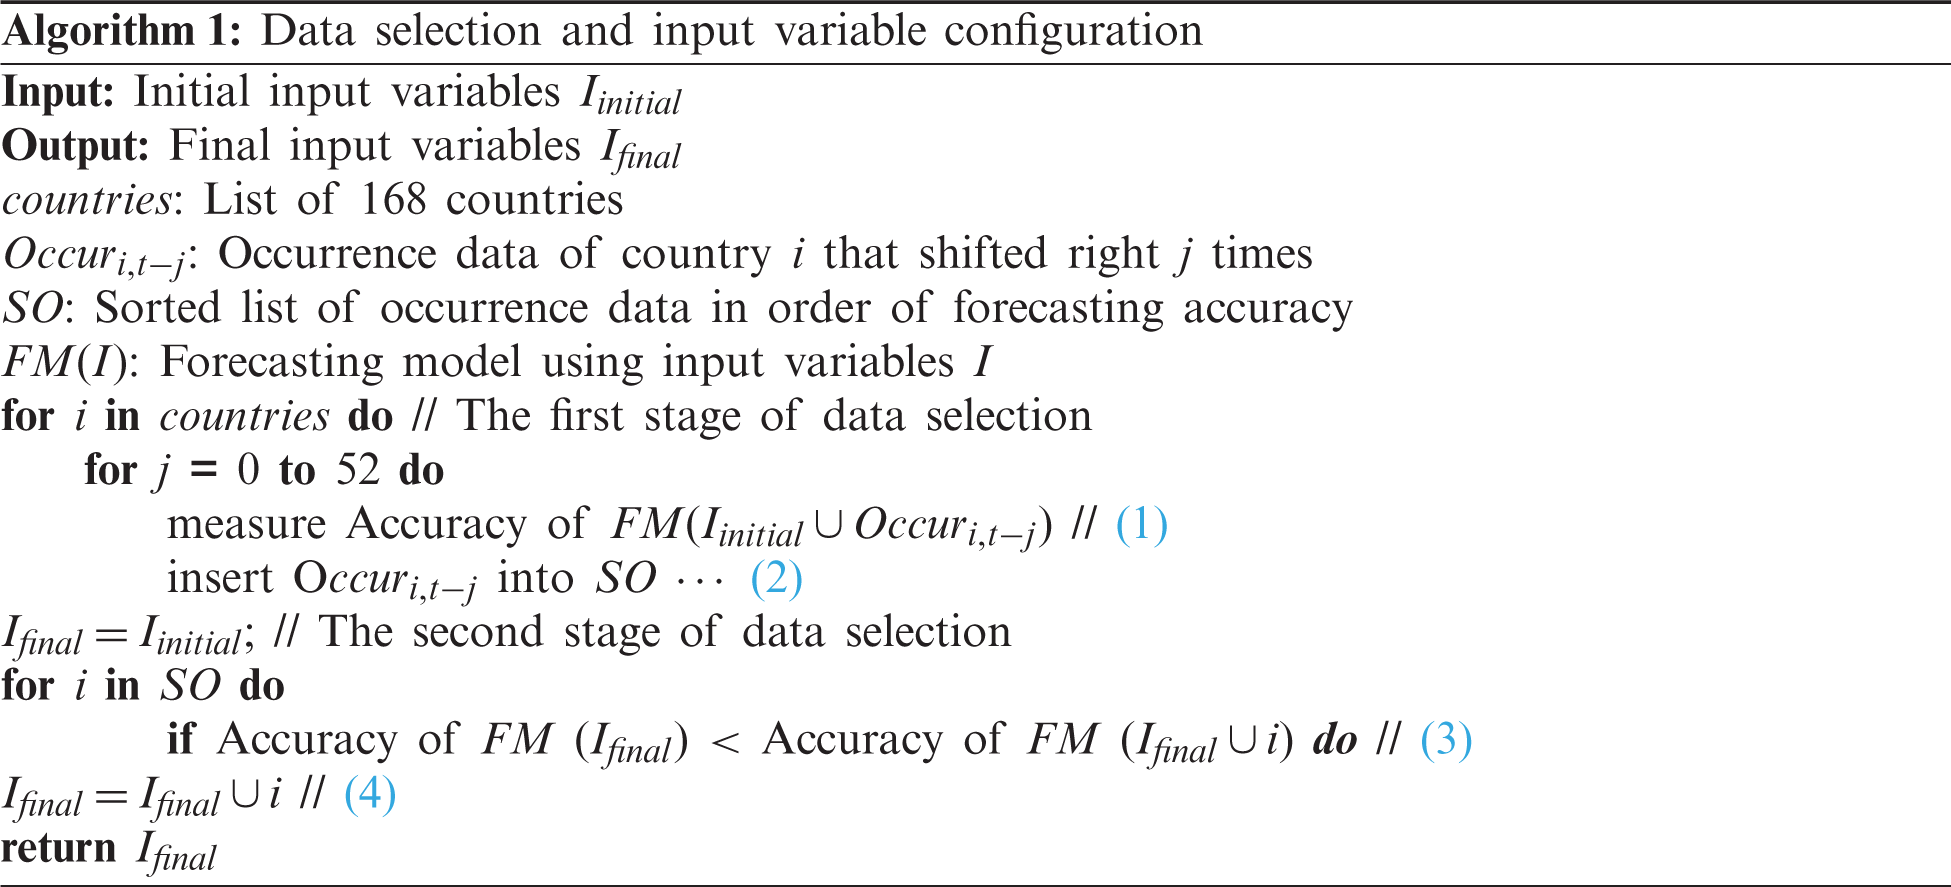
One simple method to construct an influenza forecasting model is to use all surveillance data collected worldwide for training and validation. However, this method takes a long time and can have poor predictive performance. It would be better to consider data that contribute to influenza forecasting from the collected surveillance data to construct a forecasting model more effectively. To do this, we perform data selection in two stages. In the first stage, we construct a simple ML forecasting model using the surveillance data from the target country, which are initial input variables and output variables in Tab. 1. Then, (1) we measure the accuracy of the forecasting model after appending the foreign surveillance data unit to the initial input variables, possibly shifted by up to 52 weeks. In the second stage, (2) we sort all surveillance data units in the order of accuracy. Then, we consider the surveillance data units one by one. (3) If it positively affects forecasting, (4) we select and incrementally add the data to the model as an input variable. Otherwise, we ignore the unit and continue the process. We used this strategy assuming that the data that produced higher forecasting accuracy contain more useful information for forecasting. Finally, the collection of selected surveillance data is used to train the target long-term influenza forecasting model. To evaluate the performance of our proposed method, we conducted extensive experiments using the influenza surveillance data from 168 countries and diverse ML models for data selection and influenza forecasting.
Table 1: Input and output variables for the data selection model
Algorithm 1 describes the overall steps for performing data selection. We considered six ML models for data selection, including the Gradient Boosting Machine (GBM), RF, and linear regression (LR). We also used a validation set to measure the forecasting accuracy. As an evaluation metric, we used the root mean squared error (RMSE).
To demonstrate the effectiveness of the proposed scheme, we constructed six different influenza forecasting models based on the ML models used in data selection using the selected surveillance data as input variables. In summary, we have 36 different combinations of data selection and forecasting methods. The six models are composed of two simple models and four ensemble models. The two simple models are the decision tree (DT) and LR, and the four ensemble models are GBM, XGB, LGBM, and RF.
The hyperparameters of each model, such as the number of estimators or maximum depth of the ensemble models, were decided using the grid search with the validation set. When the validation set is changed, the hyperparameters of each model are reset and redetermined. We implemented all models using Python 3.7.3 with the scikit-learn library [25].
We used time-series cross-validation to evaluate the accuracy of the forecasting models. This method has the advantage that it is closer to real-world practical applications than the traditional evaluation method, which divides a dataset into training and testing sets to train and test models, respectively [26]. We forecast one year for influenza from 2015 to 2018 and used data from a year before the test year as the validation set. For example, when the test year is 2015, we use data from 2010 to 2013 as the training set and data from 2014 as the validation set. Likewise, if we forecast 2016, data from 2010 to 2014 were used as a training set, and data from 2015 were used as a validation set.
We also calculated the RMSE and mean absolute error (MAE) using Eqs. (3) and (4), respectively, to compare accuracy. Here, N is the number of data samples, and An and Fn represent actual influenza occurrence and forecasted influenza occurrence, respectively.
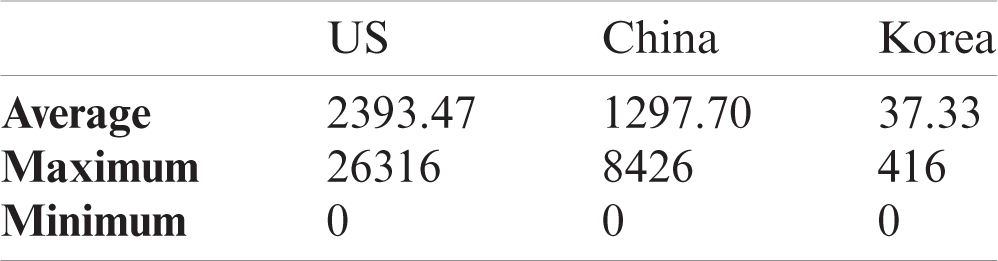
To verify the effectiveness of our data selection scheme, we performed two experiments for three target countries: the US, China, and the Republic of Korea (Korea), and Tab. 2 shows a brief summary of the datasets for the target countries. In the first experiment, we demonstrated why the proposed data selection is valid. In the second experiment, we evaluated the effect of our data selection on the forecasting performance.
Table 2: Dataset summaries of the target countries
5.1 Validity of Data Selection
In this experiment, we present two analysis results to justify our data selection scheme: (1) the RMSE changes according to input variables and (2) the comparison between the target country and the first selected country.
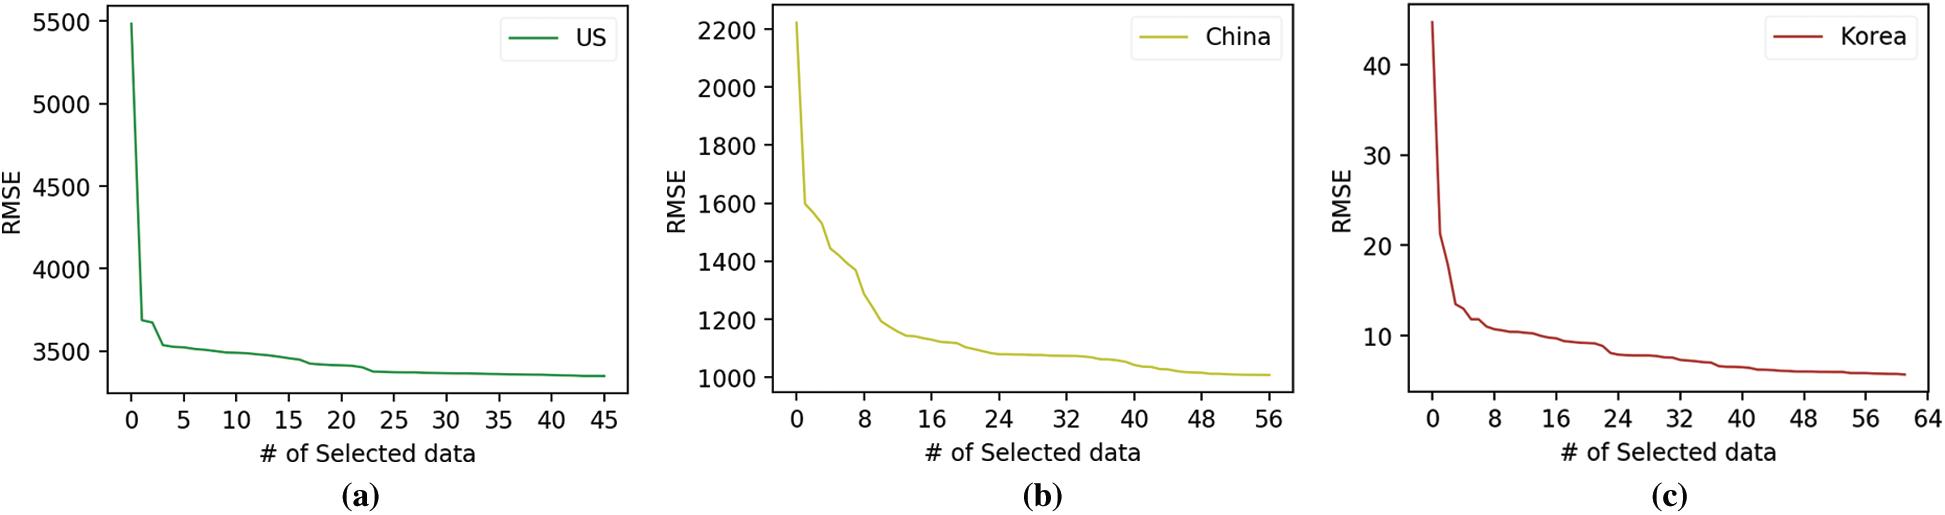
Figure 2: Root mean squared error (RMSE) according to data selection. (a) US. (b) China. (c) Korea.
Fig. 2 depicts the changes in the RMSE of the three target countries according to the input variables when forecasting the influenza occurrence for 2018 using XGB. The x-axis represents the number of selected data, and the y-axis represents the RMSE value. The initial RMSE values in the US, China, and Korea were around 5500, 2200, and 45, respectively, which are forecasting results of ML models constructed using the initial input variables. The number of data points selected by the proposed data selection scheme for the US, China, and Korea is 45, 56, and 61, respectively. All three countries’ graphs depict a sharp decline at the beginning and then a very modest decline. This result indicates that using a few well-selected surveillance data points can significantly improve forecasting performance.
Tab. 3 presents detailed information about the selected data, including the country, how many shifts are performed to the initial surveillance data for the three target countries, and the reduction in RMSE by adding the selected data as input. For instance, in the US, the data from Chile 50 weeks ago (
Table 3: List of selected data and their root mean squared error (RMSE) with reduced value
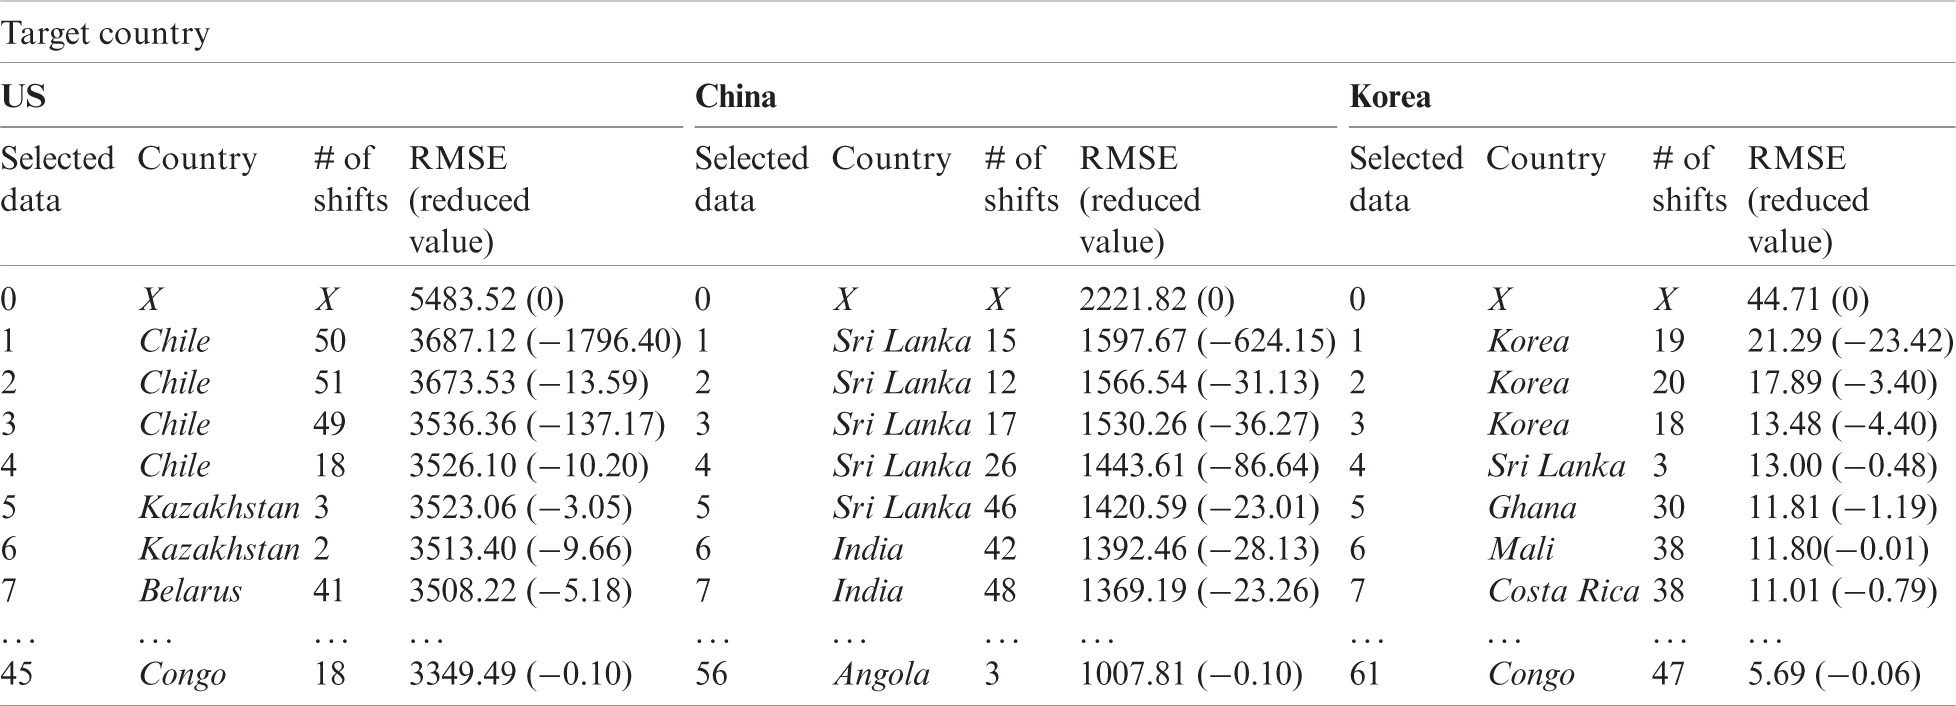

Figure 3: Scaled influenza occurrence of the target country and the first selected country. (a) US (b) China (c) Korea
Fig. 3 illustrates the graphs of the target country after 26 weeks (
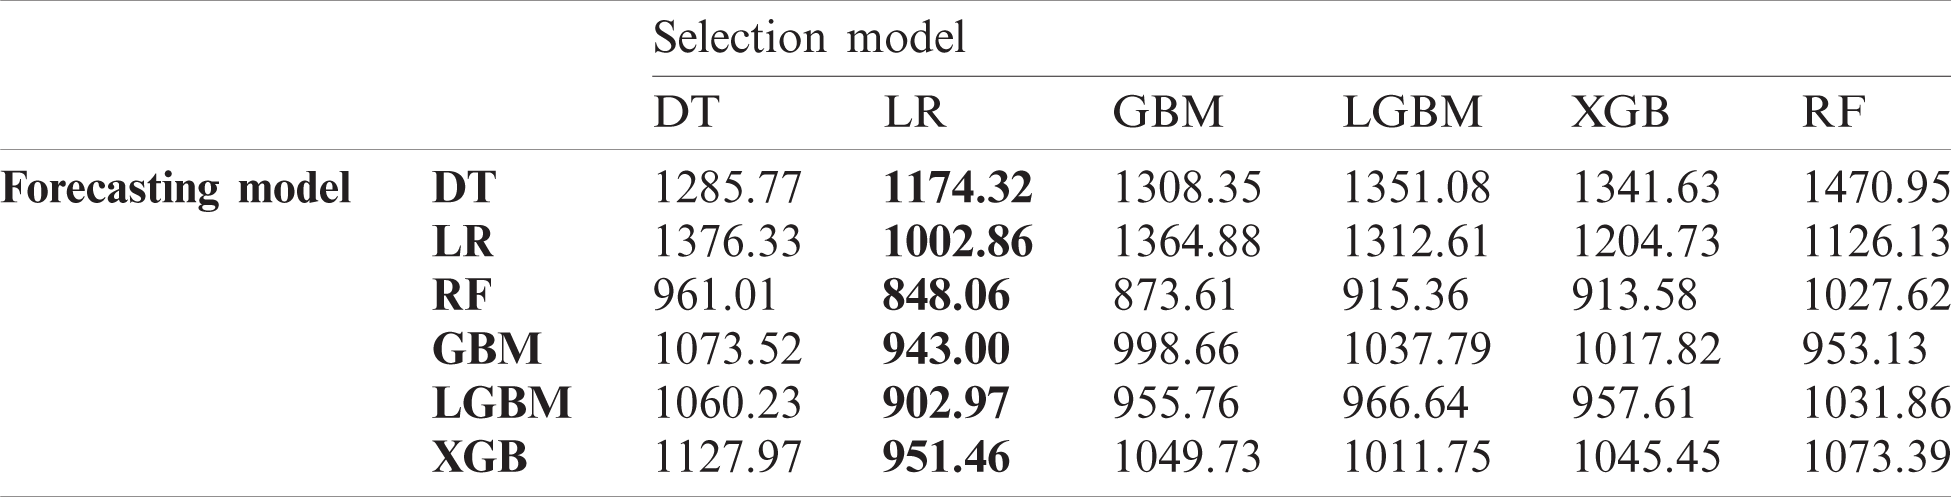
In this experiment, we investigated the effect of the proposed data selection scheme on forecasting performance and then compared the performance of diverse combinations of data selection and forecasting models. Tabs. 4–6 list the RMSE values for the US, China, and Korea, respectively. In the case of the US, the DT exhibits the best performance for data selection in most cases. However, using LR for both data selection and forecasting exhibits the best overall performance. For China, LR exhibits the best performance in data selection, and in Korea, LR has the best performance in data selection in half of all cases.
Table 4: Root mean squared error (RMSE) of data selection and forecasting in the US
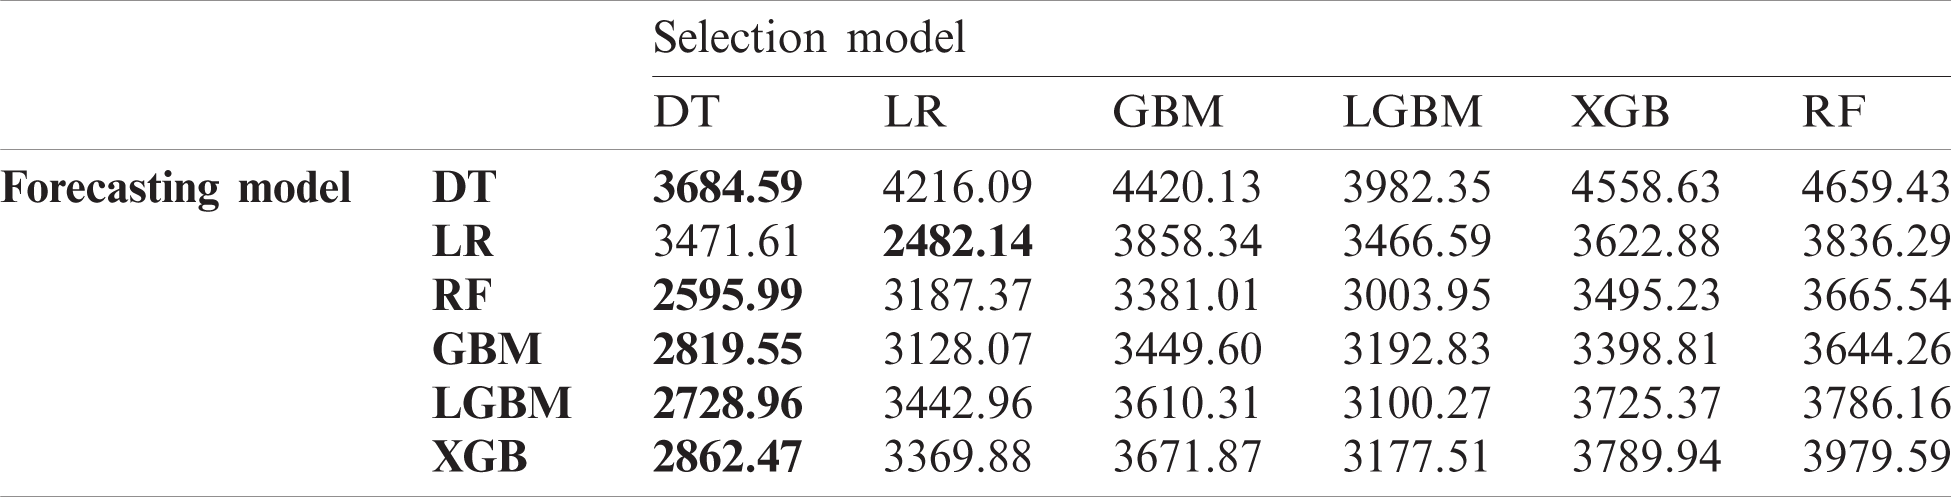
Table 5: Root mean squared error (RMSE) of data selection and forecasting in China
We also compared the accuracy of diverse forecasting models in terms of input variables in influenza forecasting to verify the effectiveness of the configured input variables. For comparison, we considered four input variable sets: (1) I, initial input variables; (2)
Table 6: Root mean squared error (RMSE) of data selection and forecasting in Korea
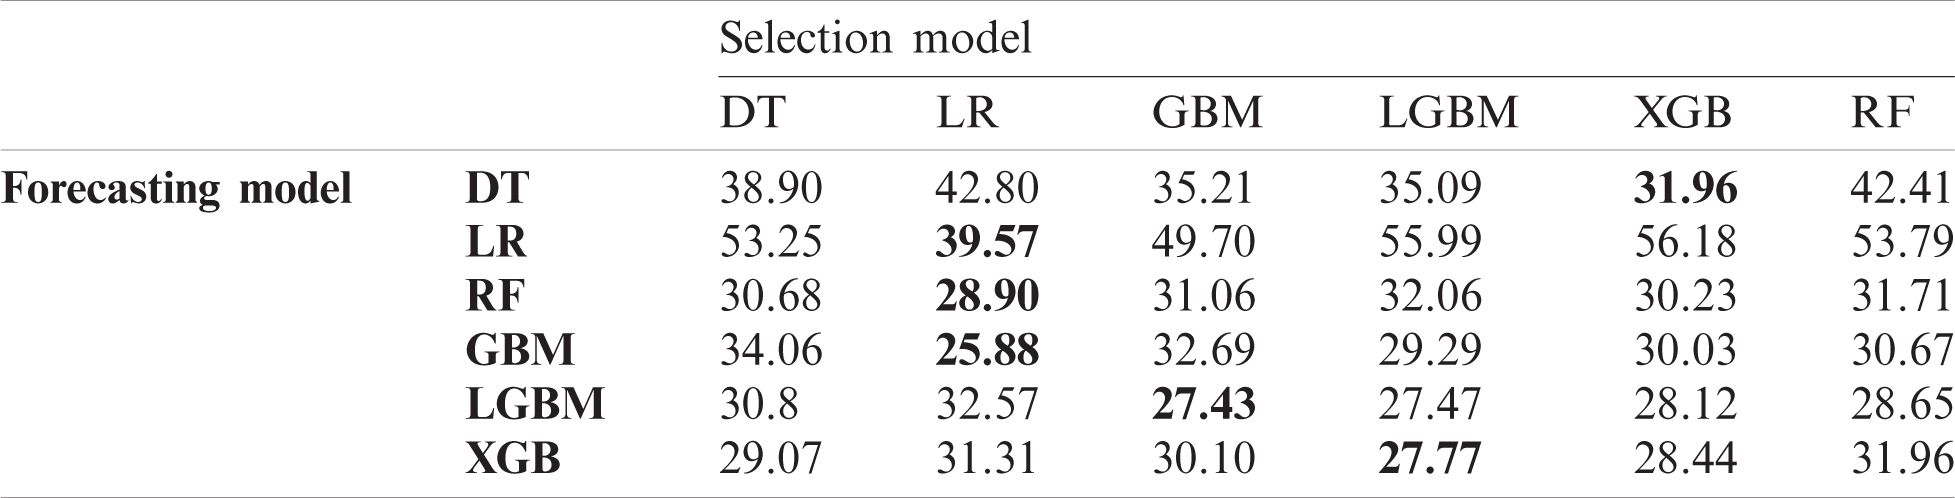
Table 7: Comparison of forecasting result of baseline models and the proposed scheme in the US
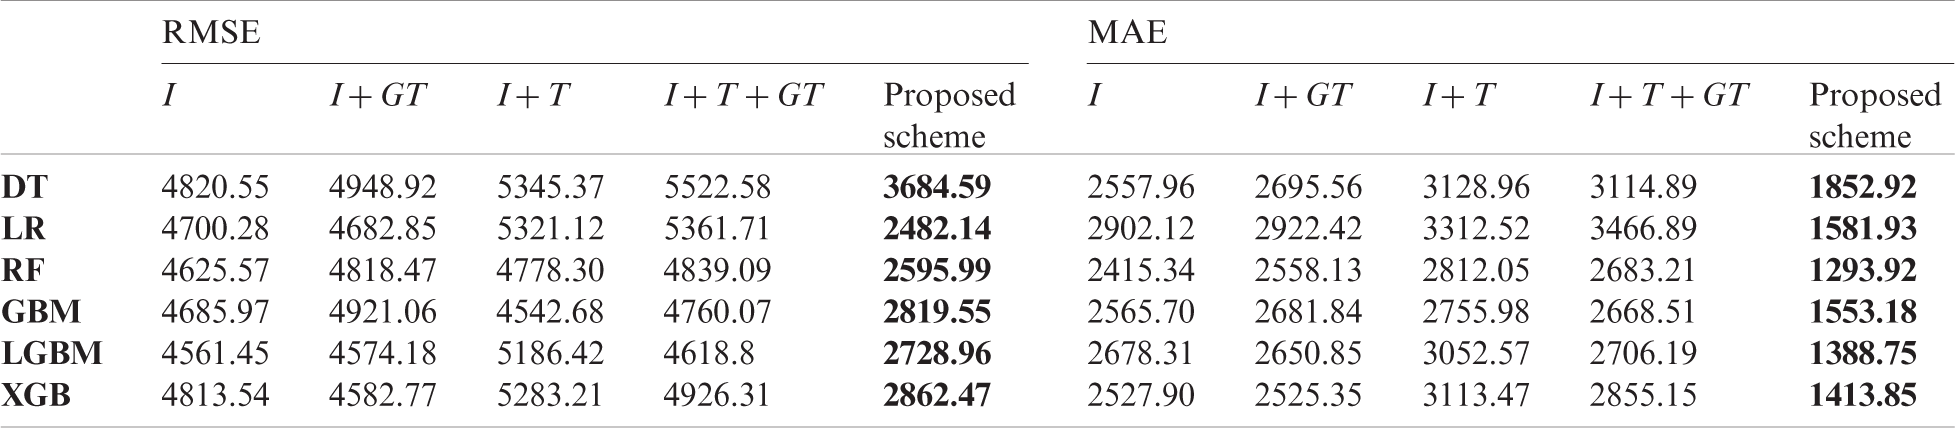
Table 8: Comparison of forecasting result of baseline models and the proposed scheme in China
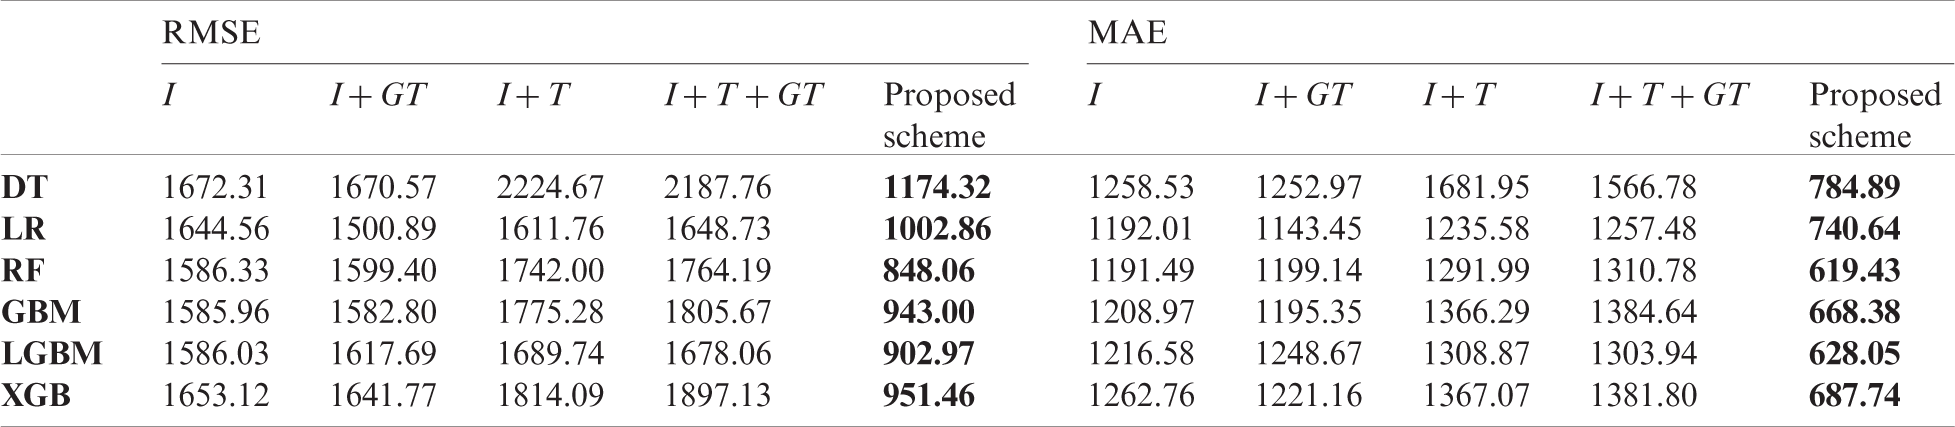
In the comparison, the proposed scheme exhibited the best performance among all input variable sets we constructed. For China and the US, the forecasting performance deteriorated in several cases when using traditional surveillance data or GT data. Although the GT data have been used in short-term influenza forecasting in many papers [27,28], the data are not effective for long-term forecasting. According to Tab. 3, the top three surveillance data that improved the forecasting performance in Korea were from the same country. As a result, in Korea (Tab. 9), past domestic surveillance data contributed to improving forecasting performance in most cases, which indicates that input variables configured using the proposed scheme are more effective for long-term influenza forecasting than other commonly used input variables.
Table 9: Comparison of forecasting result of baseline models and the proposed scheme in Korea
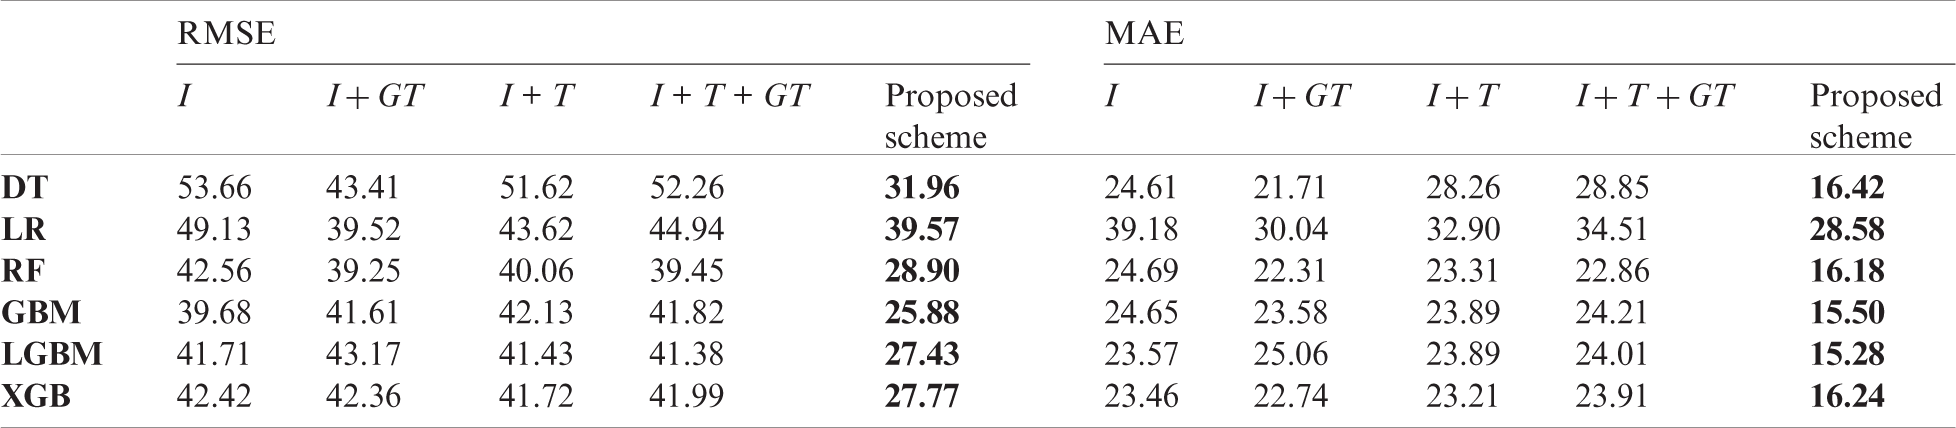
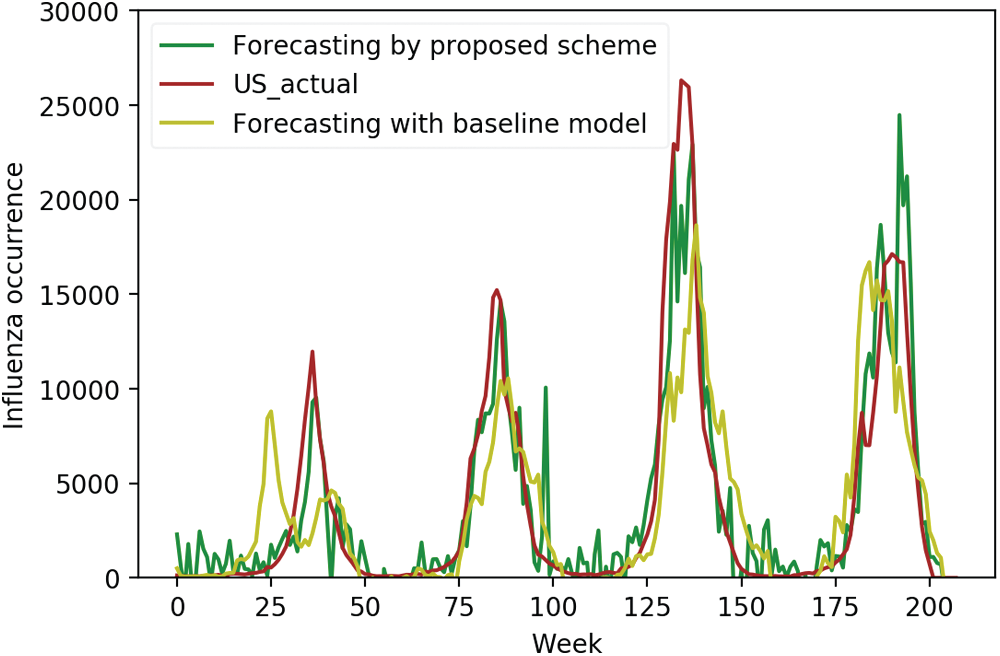
Figure 4: Forecasting in the US using domestic and selected foreign data vs. actual data
We compared the actual occurrence data with predicted occurrences using initial input variables and selected surveillance data as input variables, respectively, to investigate the effectiveness of the proposed scheme more closely. Figs. 4–6 display the comparison results for the US, China, and Korea, respectively. For the US, the forecasting results using the initial input variables showed a slight difference in the first peak time prediction, whereas the proposed scheme gave an accurate prediction for the first peak time. It also showed accurate predictions for the remaining peak times. For China, domestic surveillance data were not sufficient to forecast all peaks accurately. However, the proposed scheme showed accurate forecasting performance. In Korea, forecasting using the proposed scheme matched most of the peak times.
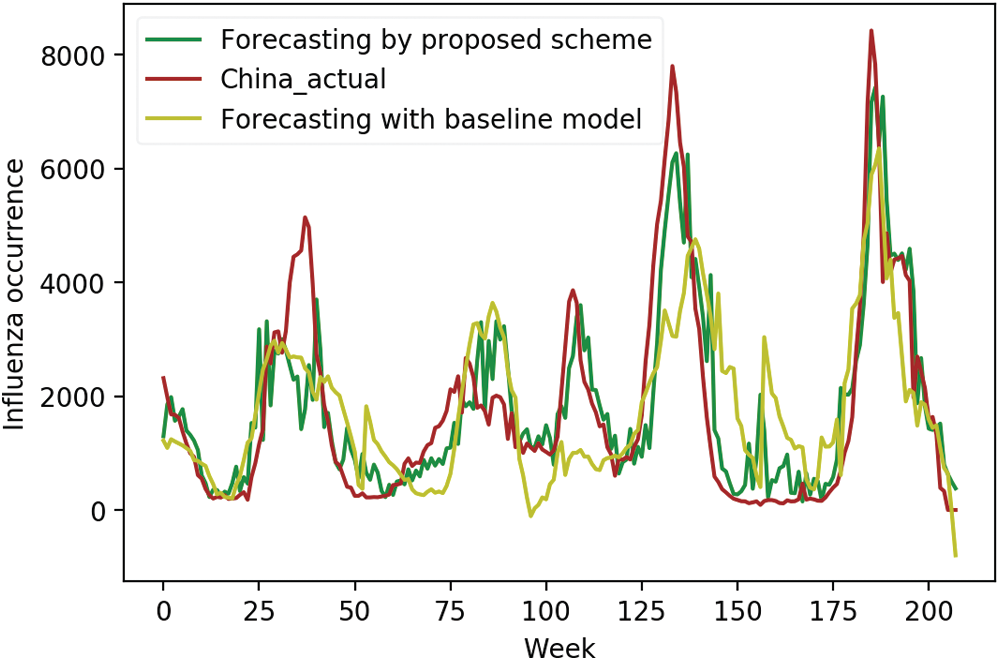
Figure 5: Forecasting in China using domestic and selected foreign data vs. actual data
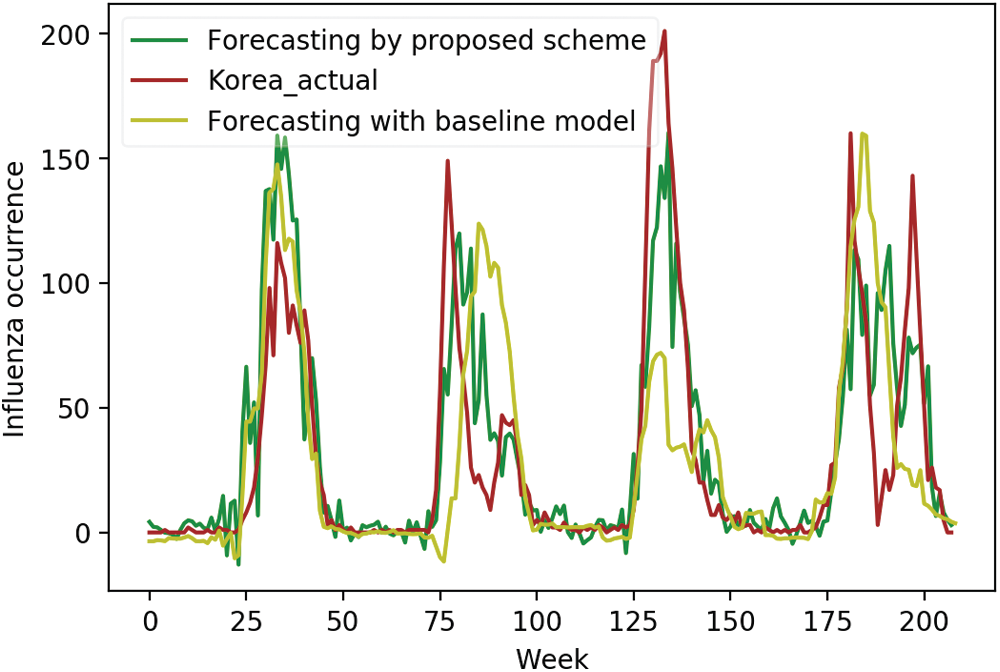
Figure 6: Forecasting in Korea using domestic and selected foreign data vs. actual data
In this paper, we proposed a two-stage data selection scheme for foreign surveillance data to improve the performance of long-item influenza forecasting. We evaluated each foreign surveillance data using a ML-based model constructed for the target country based on domestic surveillance data in the first stage. In the second stage, we evaluated each surveillance data unit in the order of accuracy and incrementally added it into the current model if it improved forecasting performance. We constructed diverse ML-based forecasting models for three countries using the selected data as input variables to evaluate the effect of the proposed data selection scheme. We performed extensive experiments to determine the effects of different combinations of data selection and forecasting models. The experimental results demonstrated that our data selection scheme was remarkably effective in constructing an influenza forecasting model for the target country. Furthermore, the input variable set configured by the proposed scheme stably enhanced the forecasting accuracy compared to the input variable sets using traditional surveillance data of the target country or GT data popularly used in influenza forecasting.
However, the limitation of our data selection scheme is that it evaluates the suitability of input variables through the validation set. If the validation set has many different patterns from the testing set, the input variables configured by the proposed scheme may not improve the forecasting performance. In future work, we will design an influenza forecasting scheme that does not need the validation set for input variable configuration and is more applicable for the real world than this scheme.
Funding Statement: This research was supported by a government-wide R&D fund project for infectious disease research (GFID), Republic of Korea (Grant Number: HG19C0682).
Conflicts of Interest: The authors declare that they have no conflicts of interest to report regarding the present study.
1. World Health Organization, “Influenza fact sheet,” 2018. [Online]. Available: https://www.who.int/news-room/fact-sheets/detail/influenza-(seasonal). [Google Scholar]
2. K. L. Nichol, J. D. Nordin, D. B. Nelson, J. P. Mullooly and E. Hak, “Effectiveness of influenza vaccine in the community-dwelling elderly,” New England Journal of Medicine, vol. 357, no. 14, pp. 1373–1381, 2007. [Google Scholar]
3. J. K. Agor and O. Y. Özaltın, “Models for predicting the evolution of influenza to inform vaccine strain selection,” Human Vaccines & Immunotherapeutics, vol. 14, no. 3, pp. 678–683, 2018. [Google Scholar]
4. M. Biggerstaff, M. Johansson, D. Alper, L. C. Brooks, P. Chakraborty et al., “Results from the second year of a collaborative effort to forecast influenza seasons in the United States,” Epidemics, vol. 24, no. 21, pp. 26–33, 2018. [Google Scholar]
5. A. Signorini, A. M. Segre and P. M. Polgreen, “The use of Twitter to track levels of disease activity and public concern in the U.S. during the Influenza A H1N1 pandemic,” PLoS One, vol. 6, no. 5, pp. 1–10, 2011. [Google Scholar]
6. S. C. Lemon, J. Roy, M. A. Clark, P. D. Friedmann and W. Rakowski, “Classification and regression tree analysis in public health: Methodological review and comparison with logistic regression,” Annals of Behavioral Medicine, vol. 26, no. 3, pp. 172–181, 2003. [Google Scholar]
7. J. Moon, S. Jung, H. Kim and E. Hwang, “Daily occurrence prediction of regional infectious diseases using random forest,” in The Korean Institute of Information Scientists and Engineers, Pyeongchang, Korea, pp. 335–337, 2019. [Google Scholar]
8. S. Park, J. Moon, S. Jung and E. Hwang, “Explainable influenza forecasting scheme using feature selection and SHAP,” in The 6th Int. Conf. on Next Generation Computing, Busan, Korea, pp. 289–292, 2020. [Google Scholar]
9. H. Y. Cheng, Y. C. Wu, M. H. Lin, Y. L. Liu, Y. Y. Tsai et al., “Applying machine learning models with an ensemble approach for accurate real-time influenza forecasting in Taiwan: Development and validation study,” Journal of Medical Internet Research, vol. 22, no. 8, pp. e15394, 2020. [Google Scholar]
10. G. Pinter, I. Felde, A. Mosavi, P. Ghamisi and R. Gloaguen, “COVID-19 pandemic prediction for Hungary; A hybrid machine learning approach,” Mathematics, vol. 8, no. 6, pp. 890–909, 2020. [Google Scholar]
11. M. Santillana, A. T. Nguyen, M. Dredze, M. J. Paul, E. O. Nsoesie et al., “Combining search, social media, and traditional data sources to improve influenza surveillance,” PLoS Computational Biology, vol. 11, no. 10, pp. e1004513, 2015. [Google Scholar]
12. J. Ginsberg, M. H. Mohebbi, R. S. Patel, L. Brammer, M. S. Smolinski et al., “Detecting influenza epidemics using search engine query data,” Nature, vol. 457, no. 7232, pp. 1012–1014, 2009. [Google Scholar]
13. J. Tikka and J. Hollmén, “Sequential input selection algorithm for long-term prediction of time series,” Neurocomputing, vol. 71, no. 13–15, pp. 2604–2615, 2008. [Google Scholar]
14. F. Jiménez, J. Palma, G. Sánchez, D. Marín, M. D. F. Palacios et al., “Feature selection based multivariate time series forecasting: An application to antibiotic resistance outbreaks prediction,” Artificial Intelligence in Medicine, vol. 104, no. 3, pp. e101818, 2020. [Google Scholar]
15. N. Zhang, H. Huang, M. Duarte and J. J. Zhang, “Dynamic population flow based risk analysis of infectious disease propagation in a metropolis,” Environment International, vol. 94, no. 39–42, pp. 369–379, 2016. [Google Scholar]
16. Y. Wu, Y. Yang, H. Nishiura and M. Saitoh, “Deep learning for epidemiological predictions,” in The 41st Int. ACM SIGIR Conf. on Research & Development in Information Retrieval, MI, USA, pp. 1085–1088, 2018. [Google Scholar]
17. K. M. Choi, H. L. Yu and M. L. Wilson, “Spatiotemporal statistical analysis of influenza mortality risk in the State of California during the period 1997–2001,” Stochastic Environmental Research and Risk Assessment, vol. 22, no. 1, pp. 15–25, 2008. [Google Scholar]
18. K. Choi and S. B. Thacker, “An evaluation of influenza mortality surveillance, 1962–1979. I. Time series forecasts of expected pneumonia and influenza deaths,” American Journal of Epidemiology, vol. 113, no. 3, pp. 215–226, 1981. [Google Scholar]
19. S. R. Venna, A. Tavanaei, R. N. Gottumukkala, V. V. Raghavan, A. S. Maida et al., “A novel data-driven model for real-time influenza forecasting,” IEEE Access, vol. 7, pp. 7691–7701, 2018. [Google Scholar]
20. S. B. Choi, J. Kim and I. Ahn, “Forecasting type-specific seasonal influenza after 26 weeks in the United States using influenza activities in other countries,” PLoS One, vol. 14, no. 11, pp. e0220423, 2019. [Google Scholar]
21. World Health Organization, “Flumart outputs,” 2021. [Online]. Available: http://apps.who.int/flumart/Default?ReportNo=12. [Google Scholar]
22. S. Caini, W. J. Alonso, C. E. Séblain, F. Schellevis and J. Paget, “The spatiotemporal characteristics of influenza A and B in the WHO European Region: Can one define influenza transmission zones in Europe?,” Eurosurveillance, vol. 22, no. 35, pp. 1–11, 2017. [Google Scholar]
23. J. Moon, S. Park, S. Rho and E. Hwang, “A comparative analysis of artificial neural network architectures for building energy consumption forecasting,” International Journal of Distributed Sensor Networks, vol. 15, no. 9, pp. 1–19, 2019. [Google Scholar]
24. J. Moon, J. Kim, P. Kang and E. Hwang, “Solving the cold-start problem in short-tern forecasting using tree-based methods,” Energies, vol. 13, no. 4, pp. 886–922, 2020. [Google Scholar]
25. F. Pedregosa, G. Varoquaux, A. Gramfort, V. Michel, B. Thirion et al., “Scikit-learn: Machine learning in Python,” Journal of Machine Learning Research, vol. 12, pp. 2825–2830, 2011. [Google Scholar]
26. J. Moon, J. Park, S. Han and E. Hwang, “Power consumption forecasting scheme for educational institutions based on analysis of similar time series data,” Journal of KIISE, vol. 44, no. 9, pp. 954–965, 2017. [Google Scholar]
27. S. Volkova, E. Ayton, K. Porterfield and C. D. Corley, “Forecasting influenza-like illness dynamics for military populations using neural networks and social media,” PLoS One, vol. 12, no. 12, pp. e0188941, 2017. [Google Scholar]
28. C. Comito, A. Forestiero and C. Pizzuti, “Improving influenza forecasting with web-based social data,” in 2018 IEEE/ACM Int. Conf. on Advances in Social Networks Analysis and Mining, Barcelona, Spain, pp. 963–970, 2018. [Google Scholar]
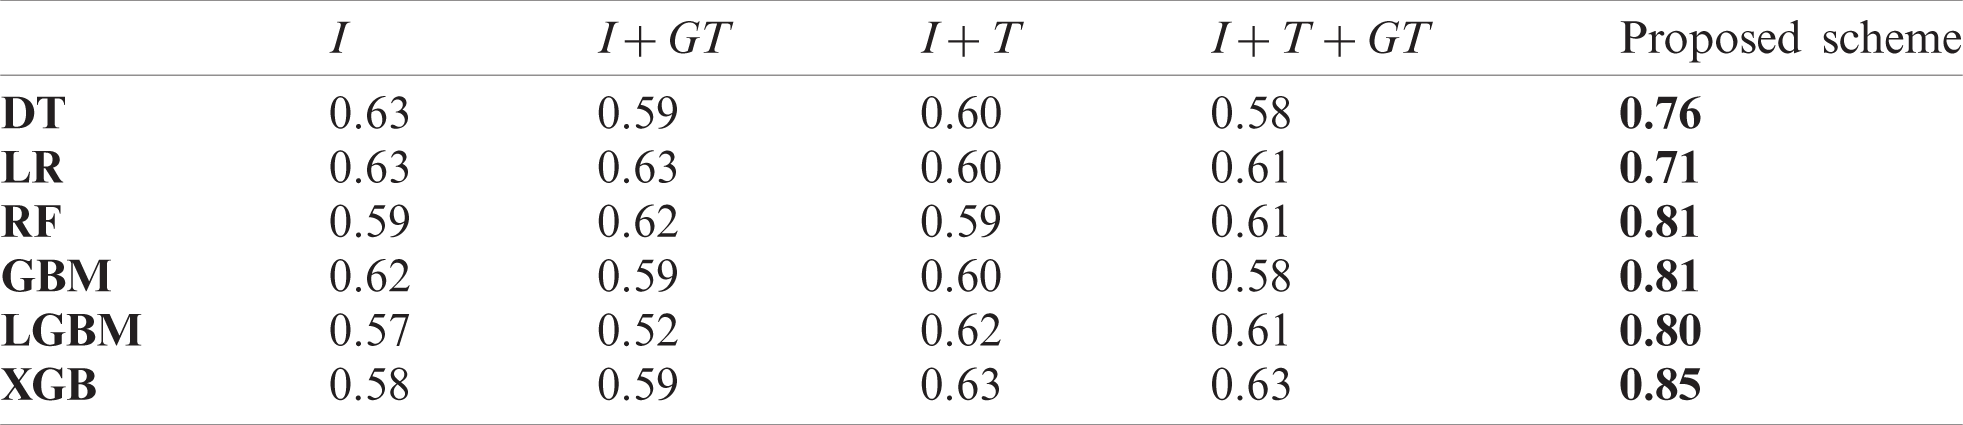
Appendix A. Comparison of Forecasting Results Using PCC Values
We also measured pearson correlation coefficient (PCC) in the same way as the comparison experiment in Section 5.2. Tabs. A1–A3 list the obtained PCC values for the US, China, and Korea, respectively. In the tables, the input variables that demonstrated the best performance in each forecasting model are marked in bold font. The proposed scheme achieved the best in all cases.
Table A1: Comparison of PCC value of baseline models and the proposed scheme in the US
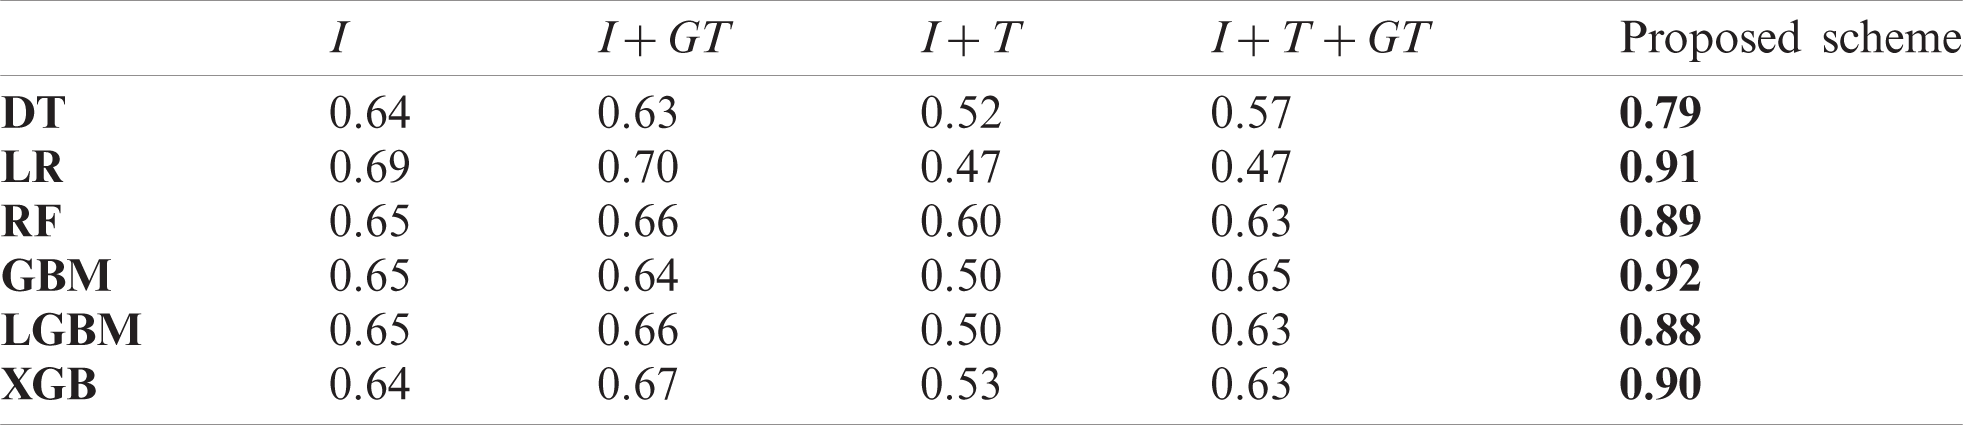
Table A2: Comparison of PCC value of baseline models and the proposed scheme in the China
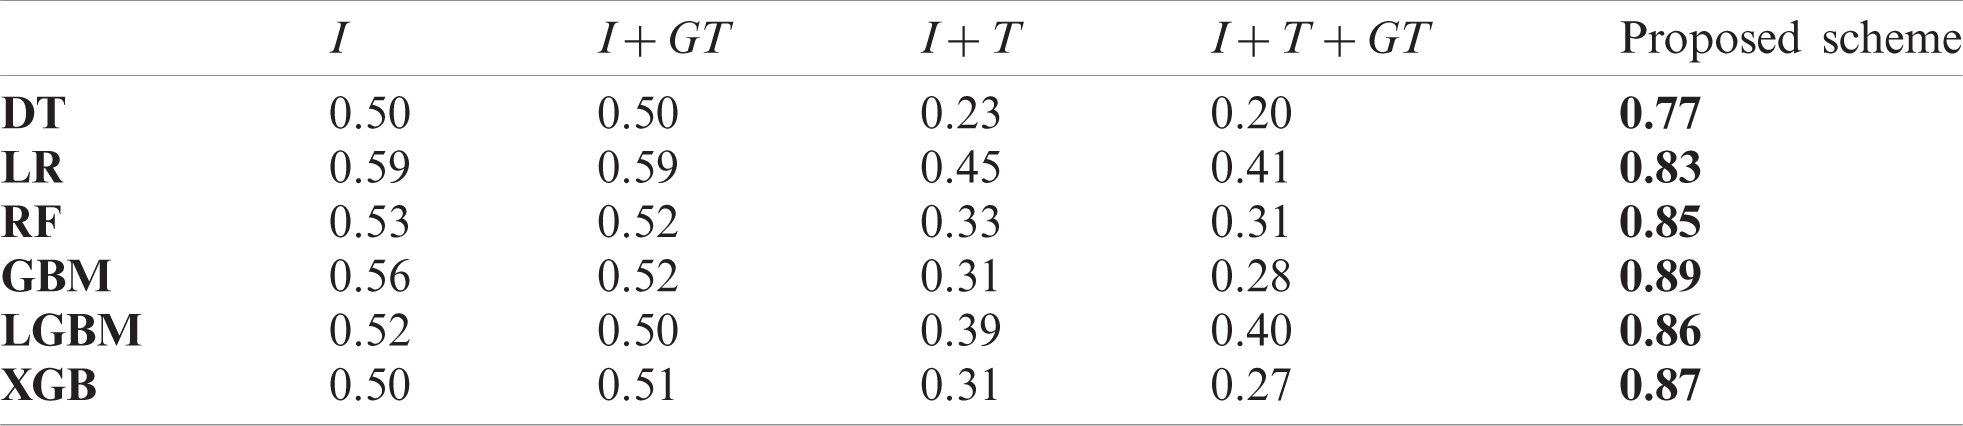
Table A3: Comparison of forecasting result of baseline models and the proposed scheme in the US
 | This work is licensed under a Creative Commons Attribution 4.0 International License, which permits unrestricted use, distribution, and reproduction in any medium, provided the original work is properly cited. |