DOI:10.32604/cmc.2021.014941
| Computers, Materials & Continua DOI:10.32604/cmc.2021.014941 | |
| Article |
A Novel Method Based on UNET for Bearing Fault Diagnosis
1National Centre of Robotics and Automation, HHCMS Lab, Mehran University of Engineering & Technology, Jamshoro, 76020, Sindh, Pakistan
2Department of Electrical Engineering, DHA SUFFA University, Karachi, Sindh, Pakistan
3Department of Electronic Engineering, Mehran University of Engineering and Technology, Jamshoro, 76020, Sindh, Pakistan
*Corresponding Author: Dileep Kumar. Email: dileepkalani1994@gmail.com
Received: 28 October 2020; Accepted: 25 February 2021
Abstract: Reliability of rotating machines is highly dependent on the smooth rolling of bearings. Thus, it is very essential for reliable operation of rotating machines to monitor the working condition of bearings using suitable fault diagnosis and condition monitoring approach. In the recent past, Deep Learning (DL) has become applicable in condition monitoring of rotating machines owing to its performance. This paper proposes a novel bearing fault diagnosis method based on the processing and analysis of the vibration images. The proposed method is the UNET model that is a recent development in DL models. The model is applied to the 2D vibration images obtained by transforming normalized amplitudes of the time-series vibration data samples into the corresponding vibration images. The UNET model performs pixel-level feature learning using the vibration images owing to its unique architecture. The results demonstrate that the model can perform dense predictions without any loss of label information, generally caused by the sliding window labelling method. The comparative analysis with other DL models confirmed the superiority of the UNET model which has achieved maximum accuracy of 98.91% and F1-Score of 99%.
Keywords: Condition monitoring; deep learning; fault diagnosis; rotating machines; vibration
Bearings are critical components in rotating machines used in various applications such as auto-manufacturing, chemical industries, railways, water pumping stations, etc. Their health has significant impacts on the operation of industrial systems and economy of industries, with 45%–55% of faults in industrial motors are caused by bearing faults [1,2]. Therefore, effective fault diagnosis of bearings can significantly increase the reliability and life span of machines in various industrial applications, which in turn reduces maintenance and operation costs [3,4]. Considering the importance of bearings in rotating machines, various methods have been applied by researchers to effectively monitor the bearing condition and to avoid downtime caused by the bearing failure.
Vibration is considered as an early and highly accurate indicator of various faults in mechanical equipment, and its measurement and analysis are widely employed with Artificial Intelligence (AI) based fault diagnosis and prognosis methods [5–7]. Typically, a fault diagnosis procedure comprises of three steps: data acquisition, feature extraction, and fault diagnosis. Firstly, the data acquisition step for machinery fault detection involves signals such as vibration, current, voltage, temperature, and acoustic emissions. Second step includes the extraction of time-domain features (root mean square, skewness, kurtosis, and gap factor), frequency domain (Fourier transform), and time-frequency domain features (wavelet transform, short-time Fourier transform, empirical mode decomposition, and Hilbert-Huang transform) [8–13]. Lastly, fault diagnosis step which has been widely explored by researchers using different model-based techniques and AI-based techniques. Machine Learning (ML) based methods are the foundation for effective fault diagnosis in the arena of AI. Various researches in literature have employed these techniques for fault diagnosis, for instance, Support Vector Machines (SVM), K-Nearest Neighbors (KNN), and Random Forest (RF) [14–16].
ML methods have yet proven to be an effective diagnosis method; however, these methods have some inherent limitations and their performance extremely relies on designed features. For combined bearing fault detection, it often requires advanced signal processing techniques [17]. Moreover, these methods are not effective in a practical industrial environment where background noise and interference of signal components are inevitable [18]. Thus, the progress in AI led to the emergence of DL which has been widely exploited by researchers in various fields of this era. DL as a subfield of AI and has provided an efficient way of automatic representative feature learning, even from raw and noisy input data without any human intervention [19,20]. Compared to ML methods, DL methods automatically learn rich features even from raw data using high-performance computing hardware [7,21–24]. Various DL architectures have been exploited for efficient bearing fault detection including Convolutional Neural Networks (CNN), Long Short-Term Memory (LSTM), Auto-Encoders (AE), Deep Belief Networks (DBN), and Deep Boltzmann Machines (DBM) [3,25–28]. Among these DL models, CNNs has been the most representative model and has demonstrated robust and remarkable performance as a supervised learning approach [29,30]. Furthermore, Full Convolutional Network (FCN) can perform pixel-level semantic segmentation of image data owing to their rich hierarchical architecture. It has also made substantial progress in achieving higher level of feature hierarchy by processing of lower level features. These models learn features through complex mapping which extracts spectral information from individual pixels [3,6]. Considering the merits of CNN model, it has been widely used to diagnose rolling bearing fault using 1D (one dimensional) and 2D (two dimensional) data with 1D-CNN and 2D-CNN configurations, respectively. Guo et al. [31] have used an adaptive CNN (ADCNN) to classify the 4 conditions of the rolling bearing with the Case Western Reserve University (CWRU) bearing data. The initial layers of the model comprise of LeNet-5 and then stacked hierarchical layers which determine two output components: fault type and fault size. The adaptive configuration of the learning rate allowed to maintain a trade-off between accuracy and training speed. This model yielded competitive performance to the earlier models.
In [32], a deep CNN model with multisensory vibration data for classifying the nine bearing conditions have been experimented. Their model was able to learn features from the raw data and avoided overfitting through dropout regularization. Li et al. [33] have employed deep CNN with data augmentation. The model was trained with 400 data samples of the CWRU bearing dataset with the ten bearing conditions. Raw vibration data was the input to the CNN layers then residual layers were stacked for better feature learning. The network was trained with batch-normalization and dropout layers for fast training and avoiding overfitting through data augmentation. Although these DL architectures have demonstrated effective performance in bearing fault diagnosis, but these models face multiclass window problem and loss of information owing to sliding window labelling technique. Thus, these models pose limitations in performing dense predictions.
Unlike the above-cited works, a novel bearing fault diagnosis method based on UNET and vibration images is presented in this paper. The proposed approach overcomes the multiclass window problem that occur in DL models and can predict label for each input data sample in the bearing data. The UNET model achieves pixel-level dense predictions through the down-sampling and up-sampling layers in the architecture. This model is successfully applied in various domains and has revealed excellent performance in terms of dense predictions [34–36]. The main contribution of this research article is twofold. The primary contribution is UNET based novel rolling bearing fault diagnosis method, which can perform dense predictions by overcoming the multiclass window problem, caused by sliding window-labelling technique. To the best of authors’ knowledge, UNET network is applied to diagnose bearing faults for the first time. The second is the dense labelled 2D vibration images without any data-augmentation given as input to the UNET model for sample-based bearing condition classification.
The remaining paper is organized as follows: Section 2 discusses dense labelling and fault classification using UNET, Section 3 explains the UNET architecture and training process, Section 4 discusses the dataset, experiment configuration, and experiment evaluation, Section 5 reports and discusses the results, and Section 6 concludes the investigation.
2 Dense Predictions Using UNET
Conventionally, time-series or sequential signals are divided into fixed-length windows using sliding window techniques. Then, each window is assigned with the same label and this label assigning technique leads to a multiclass window problem. There are two sliding window techniques: the first technique assigns a label by selecting the most frequent sample class and the second technique assigns labels by selecting last sample class of time step. Using both the techniques, classifier generates incorrect output information and causes a decrease in accuracy owing to the multiclass window problem. This problem is solved by dense labelling technique which increases classifiers’ accuracy by providing correct label information. This method assigns label to each sample of dataset rather than labelling based on sliding windows. Hence, it upholds all the label information in dataset. Fig. 1 describes both the labelling techniques. Current sample and next sample are described as S1 and S2. In the case of sliding window labelling method, the most frequent appearing class is assigned with label S1. However, owing to sliding windows it contains information of both classes. Thus, it causes learning incorrect information which in turn brings down the recognition accuracy.
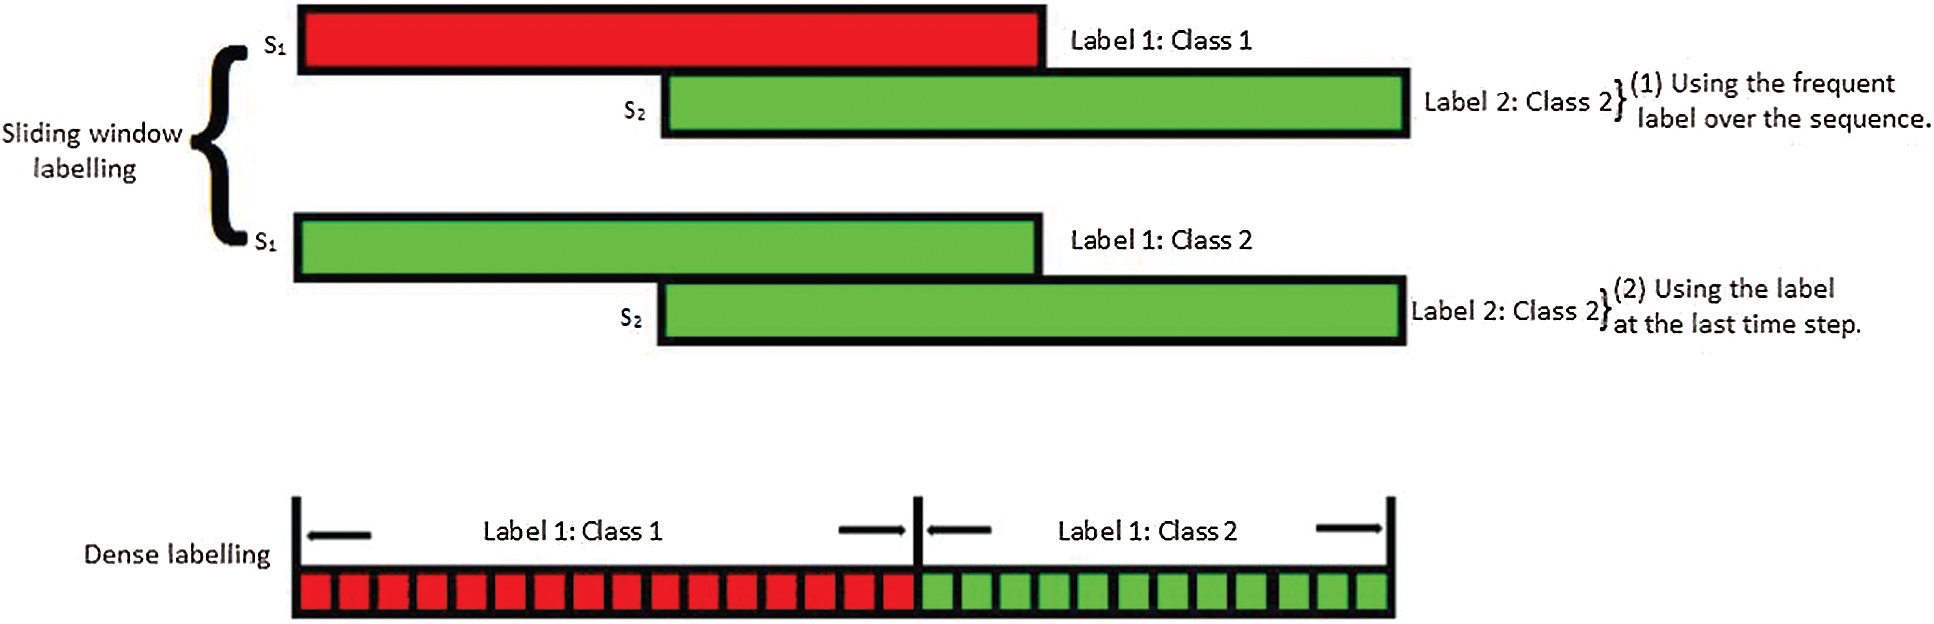
Figure 1: Sliding-window labelling and dense labelling
The traditional CNN restricts implementation of dense prediction, whereas UNET model reduces resolution of top-level output by using the max-pooling operation. For image recognition task, UNET reduces sensitivity of image shift. In the case of time-series data recognition, CNN causes a mismatch between input data length and output label length. To overcome this problem, UNET architecture has been successfully implemented by adding up-convolution layers or up-sampling layers in CNN architecture. It allows the use of dense labelling and preserves same length for input series and output label. Thus, UNET can be applied for dense predictions owing to addressing the multiclass window problem which is often posed by traditional CNN.
3 Bearing Fault Classification Using UNET
UNET is the recent development on CNN that utilizes deep layer architecture for automatic feature learning from input data. The multilayer architecture allows to learn more abstract features and can perform classification at pixel-level. To achieve pixel-level classification, an end-to-end UNET architecture was proposed by Ronneberger et al. [37] for semantic segmentation of the biomedical images. The main objectives were to improve the precise segmentation and localization of neuronal composition in the microscopic images. The goal behind the development of UNET model was to realize pixel-level classification through an in-depth feature processing.
UNET architecture consists of two paths: a contractive path and an expansive path and both are symmetric to each other and yield an architecture like U-shape as shown in Fig. 2 (Thus called as UNET). The network on the left side is contracting path that is like a traditional CNN involving convolution and pooling layers with activations. Thus, learning the image contents. On the right side of Fig. 2 is an expansive path which includes stacked up-sampling layers and the corresponding convolutional layers on the left side. Both the network paths are merged to compensate for the loss of information caused by pooling operation. As a result, the architecture preserves the same resolution of images as in input network layer.
Fig. 2 shows that in the contracting network, in which each block consists of the two repeated and unpadded 3 × 3 convolution layer followed by a ReLU (Rectified Linear Unit) activation and 2 × 2 max-pooling layer with a stride of 2 for down-sampling. Whereas, the expansive network consists of the same number of up-sampling layers as the down-sampling layers. In the end, a full-connection layer and softmax classifier are employed to map input feature vectors with the corresponding output class. In a contractive network, convolutional and pooling layers transform high-resolution images to low-resolution images also called down-sampling. While in an expansive network, the transposed convolutional layers transform low-resolution images to high-resolution images also known as up-sampling. Transposed convolution functions exactly the opposite way of normal convolution thus known as de-convolution. It up-samples the images by learning parameters through backpropagation.
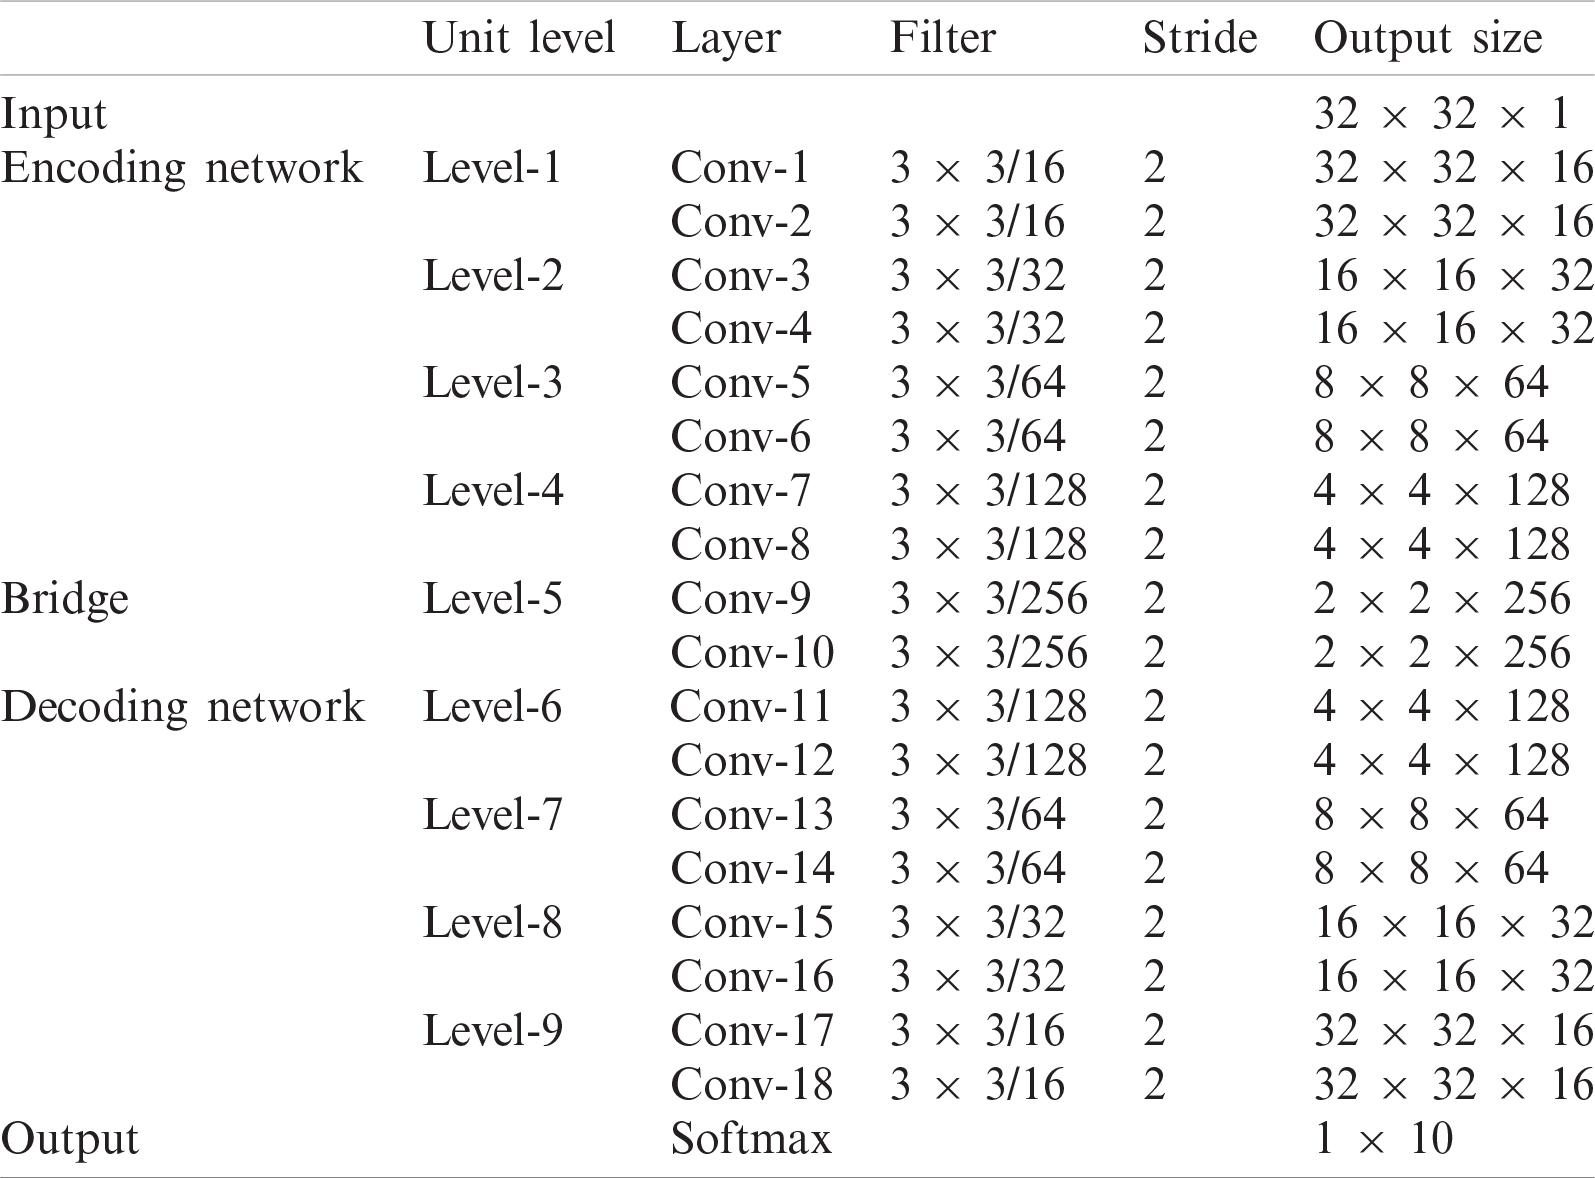
In this paper, a 9-level UNET architecture is employed for efficient pixel-level feature learning in the bearing fault classification. The architecture comprises of three parts: encoding network, decoding network, and a bridge that connects both the networks as given in Tab. 1. The encoding network transforms vibration images into compact representations and the decoding network recovers the transformed representations as pixel-wise categorizations. The complete network is constructed using 3×3 convolution layers, pooling layers, and a ReLU activation function.
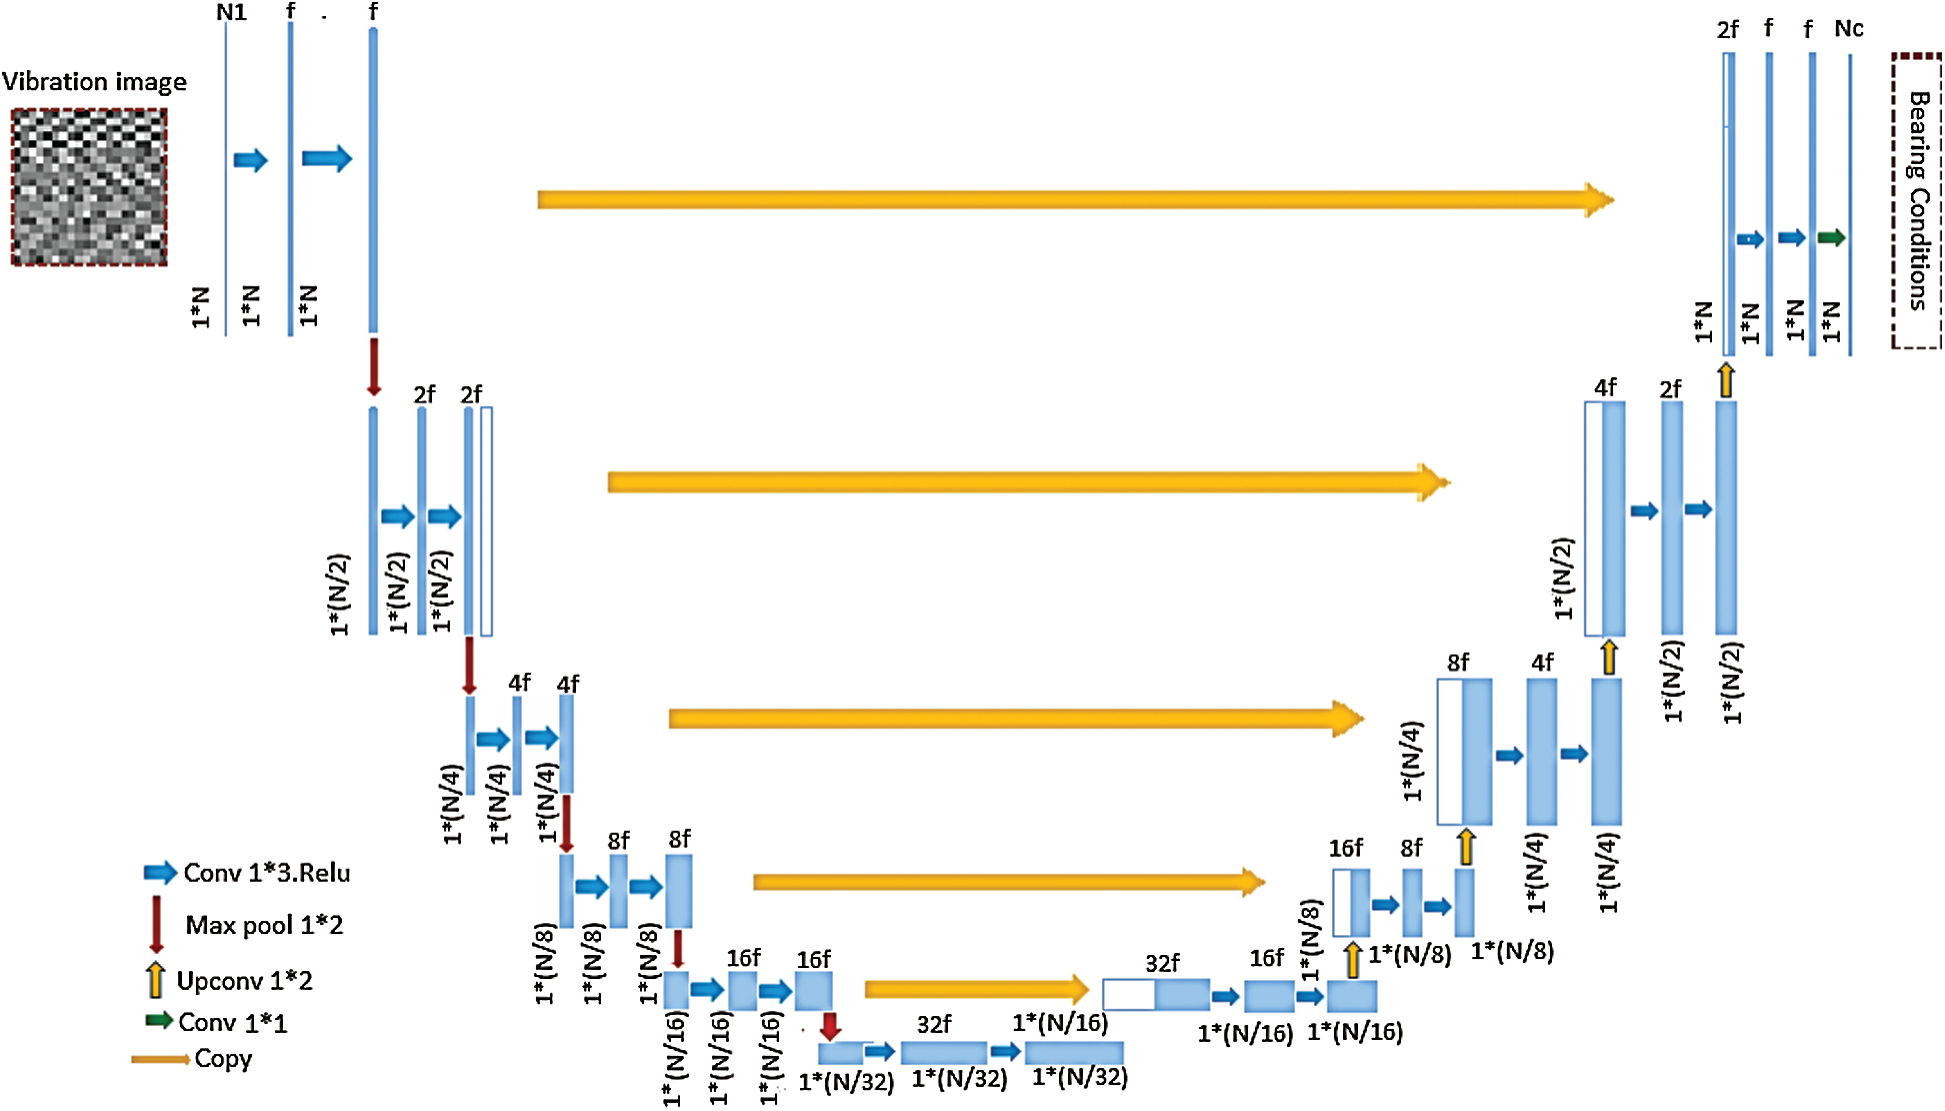
Figure 2: UNET architecture
The employed network architecture is shown in Fig. 2. The network receives input vibration images with size (N, N, C), where N denotes the number of sampling points and C denotes the number of channels. The architecture consists a total of 18 layers including contracting and expanding network layers. The input nodes
where
Table 1: Structure of the UNET network
To achieve effective and accurate dense predictions using UNET, the network training is performed for estimating appropriate parameters (W, b) from a given dataset and corresponding labels. Through minimizing loss of all the samples in training dataset, accurate dense predictions can be made possible. The loss function is expressed in Eq. (2):
where
This section reports experiments performed on a rolling bearing dataset using UNET model. Furthermore, the investigation and evaluation process of performance of UNET is reported in this section. In addition, this section presents a comparison of UNET model performance with other DL architectures, which are employed in the recent research for bearing fault diagnosis. Firstly, the dataset employed in this research is explained, then the experimental configuration and evaluation metrics are discussed.
4.1 Dataset and Vibration Image Construction
In this investigation, the CWRU bearing dataset is used to evaluate performance of the proposed model [38]. The reason behind choosing this dataset is that it is the most widely employed by the researchers as a benchmark dataset for bearing fault diagnosis [4]. Furthermore, this dataset is provided with open access for research community which allows them to evaluate the performance of their proposed algorithms. The experimental setup includes a dynamometer (right), a 2 HP Reliance electric motor (left), and a torque encoder (center) as depicted in Fig. 3. The setup also includes a control system for proper operation of the system; however, it is not shown in the figure. The test bearings are attached to support the motor shaft. Various single point artificial faults of different sizes are introduced to the rolling bearings using electric discharge machining. The vibration is collected using accelerometers attached to the fan-end and derive-end, and base of the motor. These accelerometers are attached using magnetic bases with position at the 12’o clock. The data is acquired using a 16 channel data recorder. The setup is operated under the four different load conditions including 0–3 HP load applied by the dynamometer within range of the speed between 1720 and 1797.
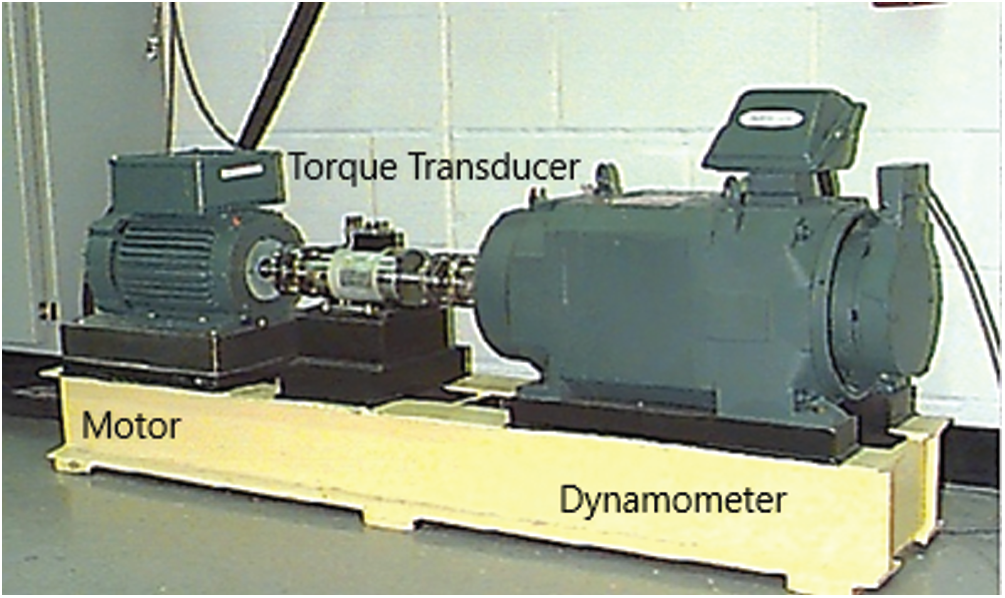
Figure 3: Experimental setup
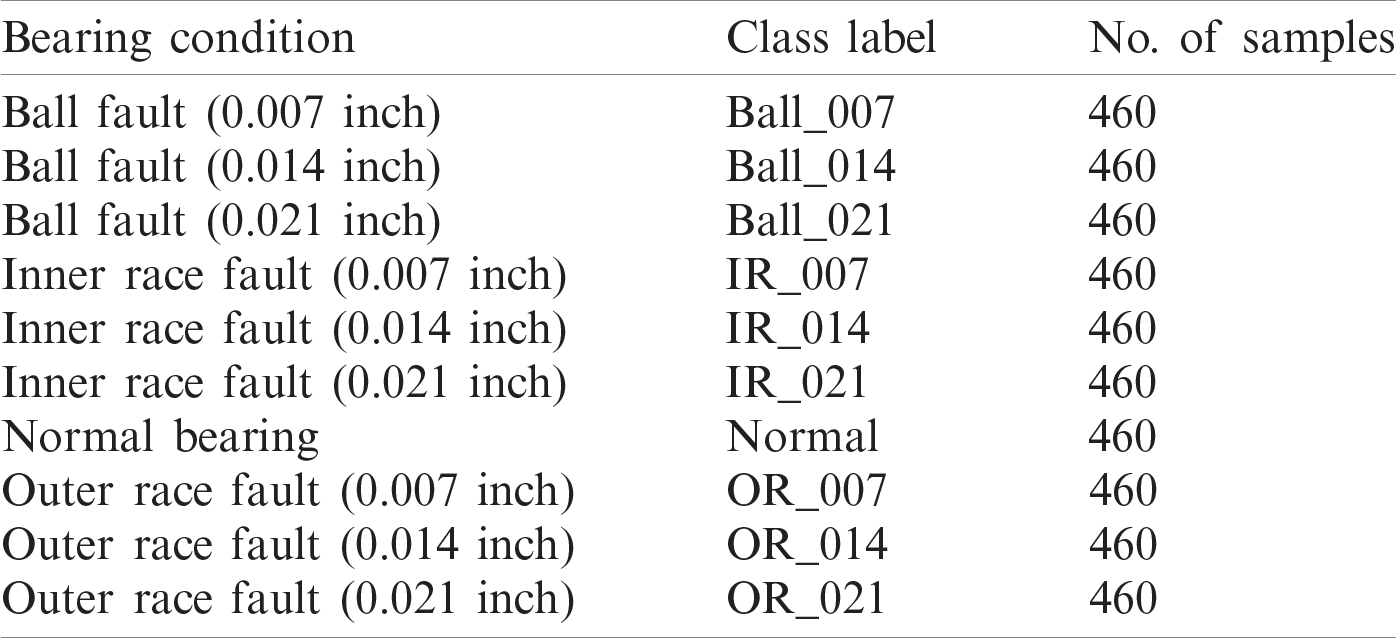
In this paper, a balanced dataset is used, which includes different conditions of the CWRU bearing dataset with 1 HP load. These conditions of bearing include healthy condition and nine bearing faults of different sizes in mils. The dataset includes a total of 10 classes of the vibration data that is collected from the drive-end of the setup with a sampling rate of 48 kHz. The size of each condition is given in Tab. 2 with the appropriate class labels.
Table 2: Bearing fault class labels and data samples
The vibration signatures of bearings obtained as 1D data can be transformed into 2D form as images. The process includes normalization of each sample in vibration signal into the range [−1, 1]. Then, the normalized amplitude of each sample of the signal transformed into the corresponding pixel in the vibration image [39]. This transformation between normalized amplitude of vibration signal and pixels can be expressed as given in Eq. (3):
where P[i, j] is the intensity of the corresponding pixels in M * N vibration image, i = 1:N, and j = 1:M. A [·] represents normalized amplitude of each vibration sample. The number of samples in a vibration signal are transformed into an equal number of pixels in the vibration image.
The dataset including these bearing conditions is transformed into the vibration images with the minimum resolution. The transformation resulted in a total of 4600 vibration images of size 32 × 32 × 1. Fig. 4 shows the transformed vibration images of the ten bearing conditions with the appropriate class labels.
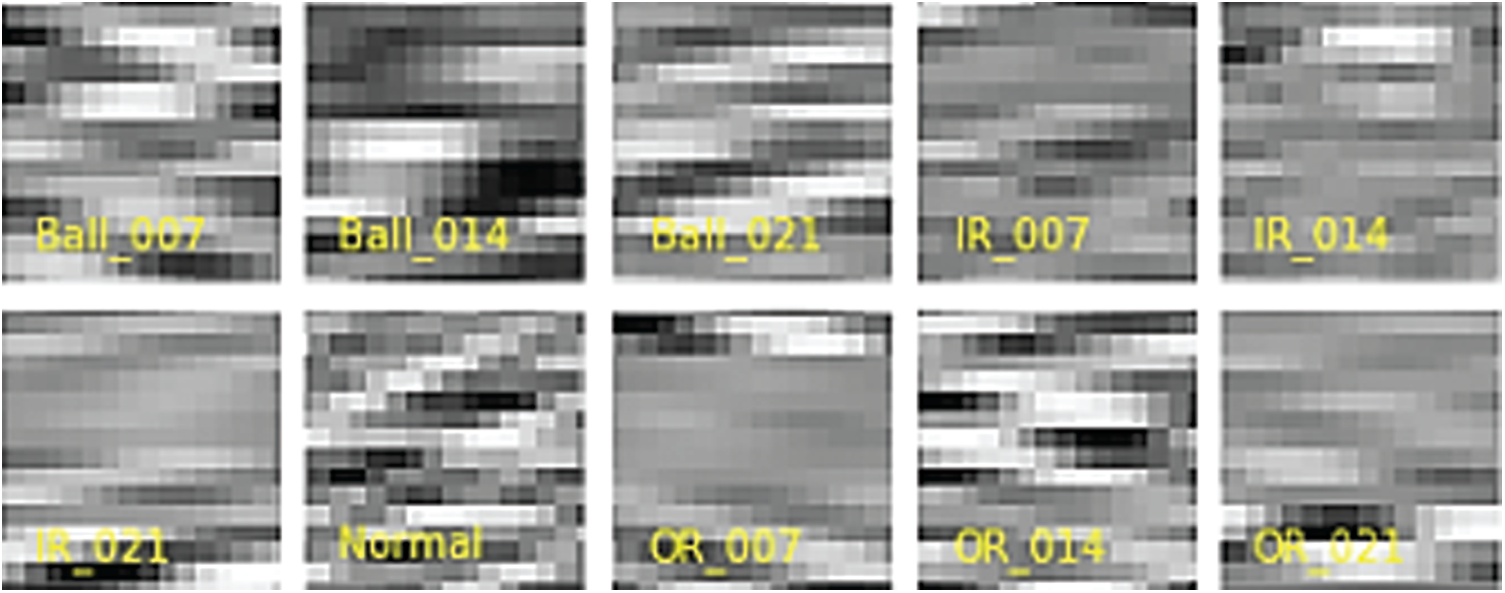
Figure 4: Vibration images of the bearing conditions
To train the UNET network, the vibration images of different bearing conditions are given as input. The size of the each vibration image is 32 × 32 × 1 including height, width, and the number of channels, respectively. The model is trained with the Adam optimizer, batch-size of 128, and the dropout rate of 0.2. The learning rate is set adaptively with the minimum value of 1 × 10⁸. The adaptive learning rate callback allowed to reduce learning by 0.1, if the model validation loss does not improve for five iterations. The early stopping callback allowed to avoid overfitting of the model through stopping the training, if the validation loss does not improve for ten continuous iterations. Subsequently, it saves the learned model parameters. In the end, the softmax loss function is used to classify the ten different conditions of the bearing. The dataset is randomly divided into training, test, and validation set with a percentage of 70%, 20%, and 10%, respectively.
To compare the performance of the proposed model, three DL models are employed which were investigated in the recent researches on this dataset. These models include FCN [40], LeNet-5 [41], and ResNet-50 [42]. These models are described briefly in the following paragraphs.
• FCN: This model consists of 6 layers including: two convolutional layers, two max-pooling layers, and two Full Connection (FC) layers. The model is employed for bearing condition diagnosis with a dropout of 0.2, batch size of 128, and zero padding. At the final stage, a softmax classifier is stacked.
• LeNet-5: It is a 2D network comprises of nine layers including three convolutional layers, three max-pooling layers, and three FC layers. A softmax layer is added at the end of the model to classify the bearing conditions. The dropout is set at 0.2 and batch-size of 128.
• ResNet-50: ResNet-50 model can optimize model parameters through a “shortcut connection or residual unit” in each convolutional block. It also assists in avoiding overfitting without loss of important information. This model consists of two blocks: stacked structure block and two FC blocks. The stacked structure blocks achieve low training parameters through reducing the size of feature map which in turn minimizes hardware requirement. Each stacked block consists of convolution layer, max-pooling layer, and batch-normalization. Meanwhile, FC blocks allow classifying the bearing conditions. Here, this model is utilized with a dropout rate of 0.2 and a batch size of 128.
The hardware used in this investigation is provided with a GPU model GeForce RTX-2060. The system is programmed with Python 3.7.1 and DL frameworks including Keras and Tensorflow.
To compare the performance of the UNET model and comparative models, following evaluation indexes are used as given in Eqs. (4)–(7):
where TP denotes true positives, TN denotes true negatives, FP denotes the false positives, FN denotes false negatives, and m denotes number of examples in data.
In this section, the performance of the four models is compared and summarized based on accuracy and F1-Score indexes. The highest results obtained with the UNET and comparative methods are shown in Tab. 3. The results clearly indicate effectiveness of the UNET method, which outperforms the comparative DL methods owing to its capability of dense predictions. The UNET has achieved the best accuracy of 98.91% and the highest F1-Score of 99% among all the employed DL models on the dataset in this research. FCN has achieved 97.61% of accuracy and 97.6% of F1-Score. While, LetNet-5 has demonstrated the second-best performance with accuracy and F1-Score of 96.74% and 96.8%, respectively. However, ResNet-50 has demonstrated the lowest performance in diagnosing the rolling bearing conditions. The comparative models have yielded lower accuracies than the UNET owing to loss of useful information caused by sliding window labelling technique. Contrarily, UNET model preserves useful information from the vibration images owing its hierarchical network architecture which in turn allowed it to perform better than the comparative models. The achieved results conclude the UNET model as an effective model among all the used DL models in this investigation.
Table 3: The evaluation indexes of the UNET and the comparative methods on CWRU bearing dataset
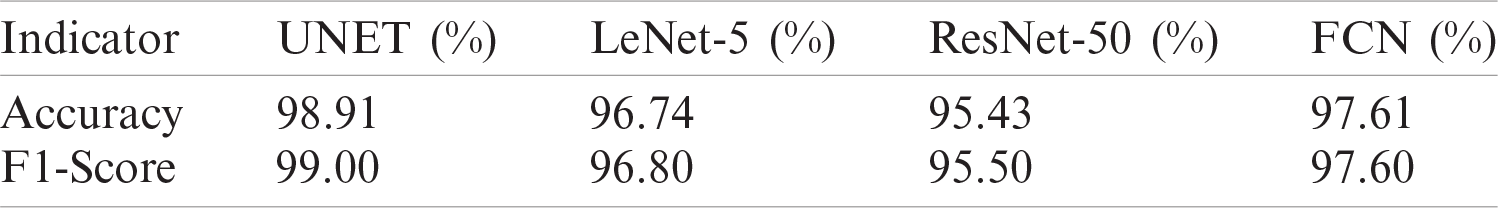
Fig. 5 shows the F1-Score of the UNET model and comparative DL models in terms of the each bearing condition. Comparatively, UNET model has the best F1-Score for each bearing condition.

Figure 5: F1-Score of the UNET and comparative methods for each bearing condition
Fig. 6 shows the confusion matrices of the UNET and comparative DL methods in terms of the each bearing condition. As shown in Fig. 6a, UNET model accuracy for the individual classes varies within the range of 95.65% to 100%. Similarly, individual class accuracy of the LeNet-5 is shown in Fig. 6b, where the accuracy has the minimum value of 84.75% and the maximum of 100%. In Fig. 6c, individual class accuracy of the ResNet-50 model is shown which varies within the range of 82.61% and 100%. Lastly, confusion matrix of the FCN model shows the individual class accuracy changes between 82.61% and 100%. These confusion matrices confirm the UNET model as the best model for the individual bearing condition classification among the employed DL models.

Figure 6: Confusion matrix of the (a) UNET, (b) LeNet-5, (c) ResNet-50, and (d) FCN
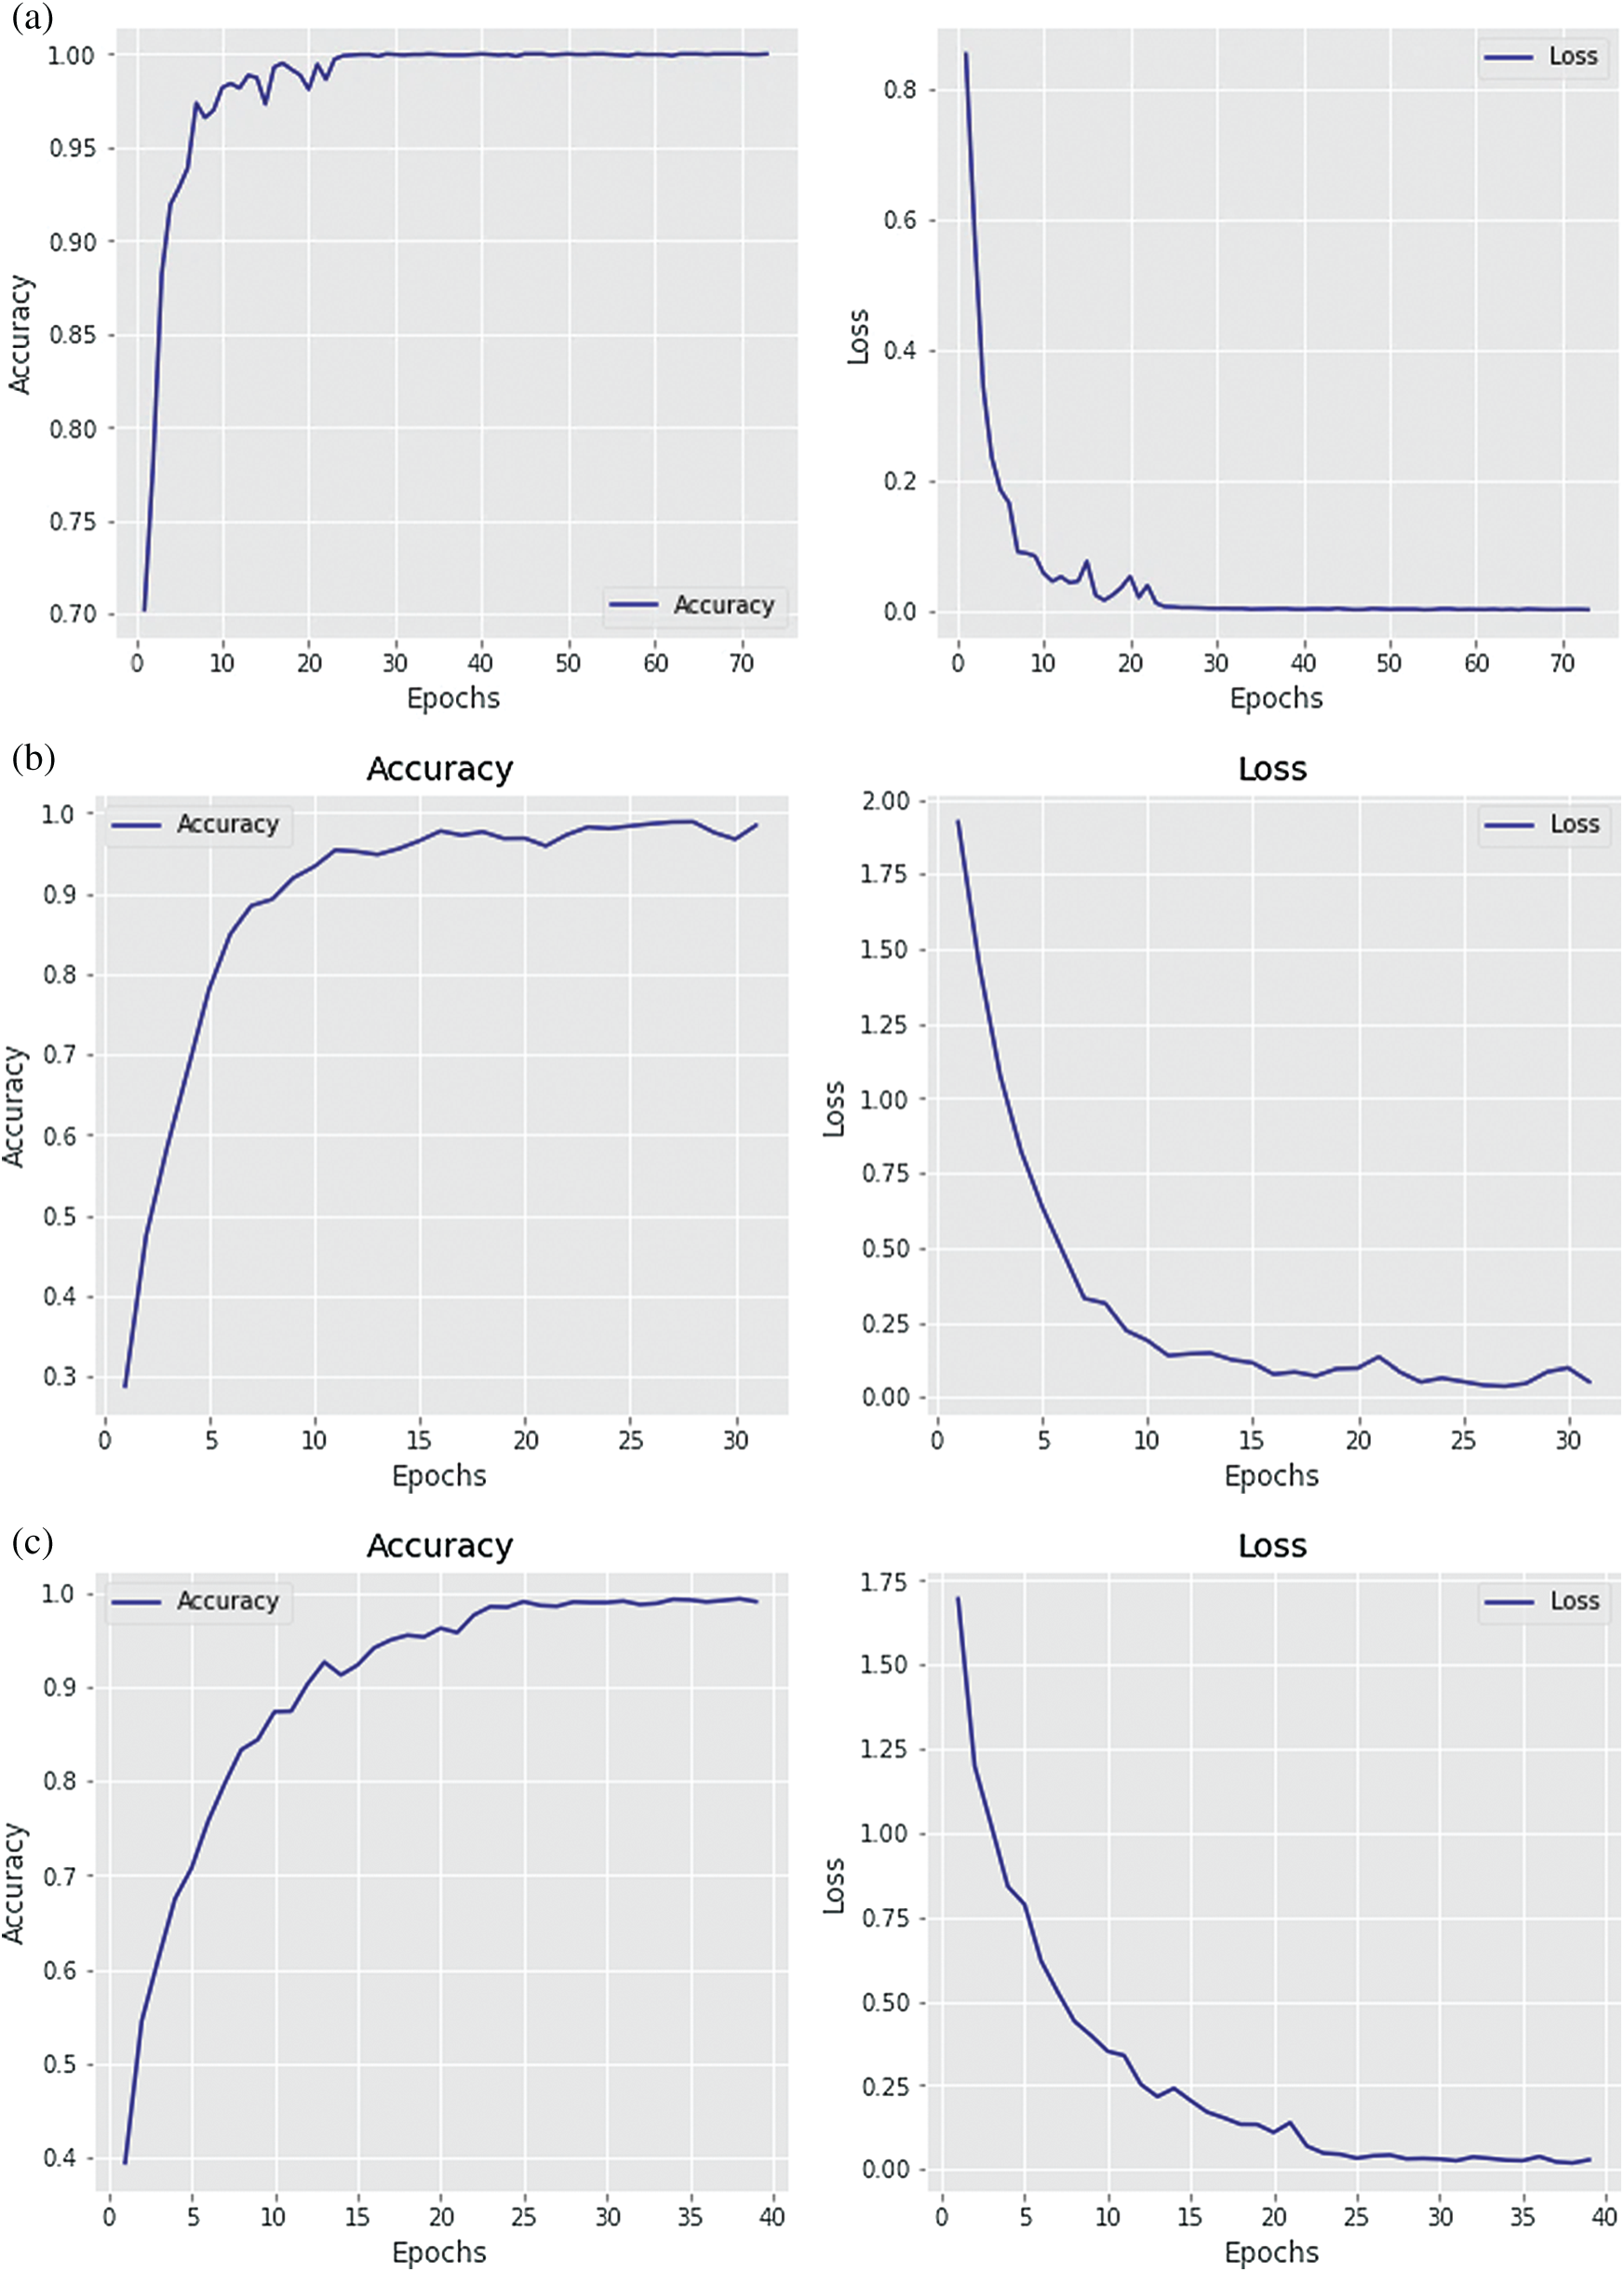
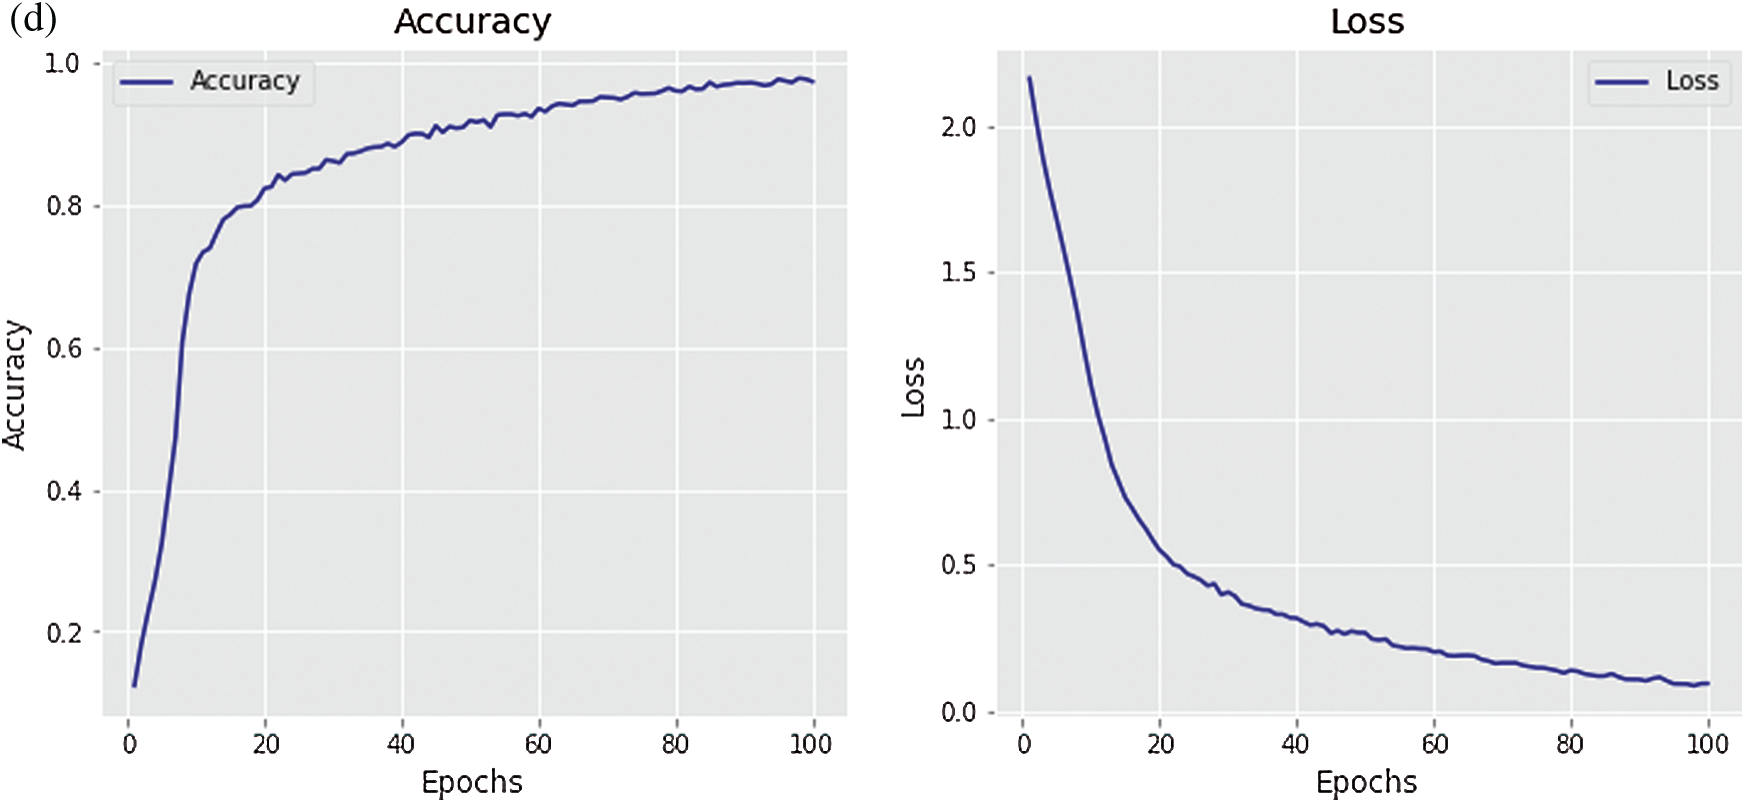
Figure 7: Accuracy and loss of the (a) UNET, (b) LeNet-5, (c) ResNet-50, and (d) FCN
Fig. 7 shows training accuracy and loss function of the employed DL models. These models were trained with early stopping callback which stops the training when a DL model achieves maximum accuracy without overfitting. Thus, number of the epochs varies for each DL model. Fig. 7a shows that the accuracy of the UNET model tends to be stable after the 30th epoch and achieves the accuracy of 98.91% and its loss function value improved after the 25th epoch. The LeNet-5 model achieves the accuracy of 96.74%, but the model response keeps fluctuating as shown in Fig. 7b. Similarly, the ResNet-50 model achieves the accuracy of 95.43% with the fluctuating response for both the accuracy and the loss function as depicted in Fig. 7c. Lastly, Fig. 7d shows accuracy of the FCN that is around 97.61% and its accuracy and the loss function response improve after 20 epochs. It can be noted from the figures that the UNET model depicts the most stable classification performance with the highest classification accuracy.
Although the UNET model was fed with the vibration images of resolution of 32 × 32 × 1, yet it yielded the excellent performance in terms of classifying the bearing conditions owing to the pixel-level learning capabilities. Moreover, with the adaptive learning rate the model learned features hierarchically thorough adjusting the learning rate, if the performance of the model did not improve for certain iterations. Another technique which is known as early stopping, helped to avoid the overfitting, if the model did not improve the performance. The UNET model has depicted robustness in the training process as shown in Fig. 7a.
The UNET model was remarkably able to predict sample-based rolling bearing conditions owing to its inherent property of dense predictions. Its comparison with the other popular DL models revealed that the UNET model has superior and robust performance in terms of rolling bearing fault diagnosis. It was observed from the results that the proposed algorithm possesses the excellent potential for fault diagnosis of rotating machines in various industrial applications.
In this paper, a novel DL method namely UNET is proposed for rolling bearing fault classification based on the vibration images. Compared to the existing DL methods, this model overcomes the multiclass window problem that is inherent in the sliding window labelling method. The UNET model used in this investigation has effectively performed dense predictions of the bearing conditions with an accuracy of 98.91% and F1-Score of 99%. The obtained results confirm that the UNET model outperforms the comparative DL models such as CNN, LeNet-5, and ResNet-50. The model yielded robust and better results than the comparative methods on short-term feature recognition. The robust classification results of the UNET model on this bearing dataset indicates its excellent potential for applications in other domains.
Funding Statement: Authors would like to acknowledge the support of the ‘Haptics, Human Robotics, and Condition Monitoring Lab’ established in Mehran University of Engineering and Technology, Jamshoro under the umbrella of the National Center of Robotics and Automation. This work was supported by the Higher Education Commission Pakistan (Grant No. 2(1076)/HEC/M&E/2018/704).
Conflicts of Interest: The authors declare that they have no conflicts of interest to report regarding this research work.
1. E. Karim, T. Memon and I. Hussain, “FPGA based on-line fault diagnostic of induction motors using electrical signature analysis,” International Journal of Information Technology, vol. 11, no. 2, pp. 165–169, 2019. [Google Scholar]
2. M. Cerrada, R. V. Sánchez, C. Li, F. Pacheco, D. Cabrera et al., “A review on data-driven fault severity assessment in rolling bearings,” Mechanical Systems and Signal Processing, vol. 99, pp. 169–196, 2018. [Google Scholar]
3. N. Enshaei and F. Naderkhani, “Application of deep learning for fault diagnostic in induction machine’s bearings,” in Proc. IEEE Int. Conf. on Prognostics and Health Management, San Francisco, CA, USA, pp. 1–7, 2019. [Google Scholar]
4. Y. Yang, P. Fu and Y. He, “Bearing fault automatic classification based on deep learning,” IEEE Access, vol. 6, pp. 71540–71554, 2018. [Google Scholar]
5. D. K. Soother and J. Daudpoto, “A brief review of condition monitoring techniques for the induction motor,” Transactions of the Canadian Society for Mechanical Engineering, vol. 43, no. 4, pp. 499–508, 2019. [Google Scholar]
6. G. Toh and J. Park, “Review of vibration-based structural health monitoring using deep learning,” Applied Sciences, vol. 10, no. 5, pp. 1–24, 2020. [Google Scholar]
7. M. D. Prieto, G. Cirrincione, A. G. Espinosa, J. A. Ortega and H. Henao, “Bearing fault detection by a novel condition-monitoring scheme based on statistical-time features and neural networks,” IEEE Transactions on Industrial Electronics, vol. 60, no. 8, pp. 3398–3407, 2012. [Google Scholar]
8. A. Malhi and R. Gao, “PCA-based feature selection scheme for machine defect classification,” IEEE Transactions on Instrumentation and Measurement, vol. 53, no. 6, pp. 1517–1525, 2004. [Google Scholar]
9. A. F. Aimer, A. H. Boudinar, N. Benouzza and A. Bendiabdellah, “Bearing fault diagnosis of a PWM inverter fed-induction motor using an improved short time Fourier transform,” Journal of Electrical Engineering and Technology, vol. 14, no. 3, pp. 1201–1210, 2019. [Google Scholar]
10. P. Konar and P. Chattopadhyay, “Bearing fault detection of induction motor using wavelet and support vector machines (SVMs),” Applied Soft Computing, vol. 11, no. 6, pp. 4203–4211, 2011. [Google Scholar]
11. D. S. Singh and Q. Zhao, “Pseudo-fault signal assisted EMD for fault detection and isolation in rotating machines,” Mechanical Systems and Signal Processing, vol. 81, no. 1971, pp. 202–218, 2016. [Google Scholar]
12. S. Osman and W. Wang, “A morphological Hilbert–Huang transform technique for bearing fault detection,” IEEE Transactions on Instrumentation and Measurement, vol. 65, no. 11, pp. 2646–2656, 2016. [Google Scholar]
13. J. Tian, C. Morillo, M. H. Azarian and M. Pecht, “Motor bearing fault detection using spectral kurtosis-based feature extraction coupled with k-nearest neighbor distance analysis,” IEEE Transactions on Industrial Electronics, vol. 63, no. 3, pp. 1793–1803, 2015. [Google Scholar]
14. T. Han, D. Jiang, Q. Zhao, L. Wang and K. Yin, “Comparison of random forest, artificial neural networks and support vector machine for intelligent diagnosis of rotating machinery,” Transactions of the Institute of Measurement and Control, vol. 40, no. 8, pp. 2681–2693, 2018. [Google Scholar]
15. X. Yan and M. Jia, “A novel optimized SVM classification algorithm with multi-domain feature and its application to fault diagnosis of rolling bearing,” Neurocomputing, vol. 313, pp. 47–64, 2018. [Google Scholar]
16. F. Jia, Y. Lei, J. Lin, X. Zhou and N. Lu, “Deep neural networks: A promising tool for fault characteristic mining and intelligent diagnosis of rotating machinery with massive data,” Mechanical Systems and Signal Processing, vol. 72, pp. 303–315, 2016. [Google Scholar]
17. H. Shao, H. Jiang, H. Zhang and T. Liang, “Electric locomotive bearing fault diagnosis using a novel convolutional deep belief network,” IEEE Transactions on Industrial Electronics, vol. 65, no. 3, pp. 2727–2736, 2017. [Google Scholar]
18. H. Zhu, J. Cheng, C. Zhang, J. Wu and X. Shao, “Stacked pruning sparse denoising autoencoder based intelligent fault diagnosis of rolling bearings,” Applied Soft Computing, vol. 88, no. 99, pp. 106060, 2020. [Google Scholar]
19. Y. Yuan, G. Ma, C. Cheng, B. Zhou, H. Zhao et al., “A general end-to-end diagnosis framework for manufacturing systems,” National Science Review, vol. 7, no. 2, pp. 418–429, 2020. [Google Scholar]
20. K. Dev, S. A. Khowaja, A. Jaiswal, A. S. Bist, V. Siani et al., “Triage of potential COVID-19 patients from chest x-ray images using hierarchical convolutional networks,” arXiv preprint arXiv:.00618, 2020. [Online]. Available: https://arxiv.org/abs/2011.00618, (Accessed 02 November 2020). [Google Scholar]
21. D. T. Hoang and H. J. Kang, “A survey on deep learning based bearing fault diagnosis,” Neurocomputing, vol. 335, no. 7, pp. 327–335, 2019. [Google Scholar]
22. S. khan and T. Yairi, “A review on the application of deep learning in system health management,” Mechanical Systems and Signal Processing, vol. 107, no. 2, pp. 241–265, 2018. [Google Scholar]
23. T. Chen, Z. Wang, X. Yang and K. Jiang, “A deep capsule neural network with stochastic delta rule for bearing fault diagnosis on raw vibration signals,” Measurement, vol. 148, pp. 106857, 2019. [Google Scholar]
24. M. Ma, X. Chen, S. Wang, Y. Liu and W. Li, “Bearing degradation assessment based on Weibull distribution and deep belief network,” in Proc. Int. Symp. on Flexible Automation, Cleveland, OH, USA, pp. 382–385, 2016. [Google Scholar]
25. X. Guo, L. Chen and C. Shen, “Hierarchical adaptive deep convolution neural network and its application to bearing fault diagnosis,” Measurement, vol. 93, no. 4, pp. 490–502, 2016. [Google Scholar]
26. L. Yu, J. Qu, F. Gao and Y. Tian, “A novel hierarchical algorithm for bearing fault diagnosis based on stacked LSTM,” Shock and Vibration, vol. 2019, pp. 1–10, 2019. [Google Scholar]
27. S. Deng, Z. Cheng, C. Li, X. Yao, Z. Chen et al., “Rolling bearing fault diagnosis based on deep boltzmann machines,” in Proc. Prognostics and System Health Management Conf., Chengdu, pp. 1–6, 2016. [Google Scholar]
28. H. Shao, H. Jiang, X. Zhang and M. Niu, “Rolling bearing fault diagnosis using an optimization deep belief network,” Measurement Science and Technology, vol. 26, no. 11, pp. 115002, 2015. [Google Scholar]
29. Z. Chen, A. Mauricio, W. Li and K. Gryllias, “A deep learning method for bearing fault diagnosis based on cyclic spectral coherence and convolutional neural networks,” Mechanical Systems and Signal Processing, vol. 140, pp. 106683, 2020. [Google Scholar]
30. Q. Zhou, Y. Li, Y. Tian and L. Jiang, “A novel method based on nonlinear auto-regression neural network and convolutional neural network for imbalanced fault diagnosis of rotating machinery,” Measurement, vol. 161, pp. 107880, 2020. [Google Scholar]
31. X. Guo, L. Chen and C. Shen, “Hierarchical adaptive deep convolution neural network and its application to bearing fault diagnosis,” Measurement, vol. 93, no. 4, pp. 490–502, 2016. [Google Scholar]
32. M. Xia, T. Li, L. Xu, L. Liu and De Silva, “Fault diagnosis for rotating machinery using multiple sensors and convolutional neural networks,” IEEE/ASME Transactions on Mechatronics, vol. 23, no. 1, pp. 101–110, 2017. [Google Scholar]
33. X. Li, W. Zhang, Q. Ding and J. Q. Sun, “Intelligent rotating machinery fault diagnosis based on deep learning using data augmentation,” Journal of Intelligent Manufacturing, vol. 31, no. 2, pp. 433–452, 2020. [Google Scholar]
34. Y. Zhang, Z. Zhang, Y. Zhang, J. Bao, Y. Zhang et al., “Human activity recognition based on motion sensor using U-Net,” IEEE Access, vol. 7, pp. 75213–75226, 2019. [Google Scholar]
35. S. Wei, H. Zhang, C. Wang, Y. Wang and L. Xu, “Multi-temporal SAR data large-scale crop mapping based on U-Net model,” Remote Sensing, vol. 11, no. 1, pp. 1–18, 2019. [Google Scholar]
36. Y. Luo, X. Li, C. Luo, F. Wang, X. Wu et al., “Tissue segmentation in nasopharyngeal CT images using two stage learning,” Computers, Materials & Continua, vol. 65, no. 2, pp. 1771–1780, 2020. [Google Scholar]
37. O. Ronneberger, P. Fischer and T. Brox, “U-net: Convolutional networks for biomedical image segmentation,” in Proc. Int. Conf. on Medical Image Computing and Computer-Assisted Intervention, Munich, Germany, pp. 234–241, 2015. [Google Scholar]
38. K. Loparo, “Case western reserve university bearing data centre website,” 2012. [Online]. Available: https://csegroups.case.edu/bearingdatacenter/pages/welcome-case-western-reserve-university-bearing-data- center-website. [Google Scholar]
39. D. Nguyen, M. Kang, C. H. Kim and J. M. Kim, “Highly reliable state monitoring system for induction motors using dominant features in a two-dimension vibration signal,” New Review of Hypermedia and Multimedia, vol. 19, no. 3–4, pp. 248–258, 2013. [Google Scholar]
40. D. T. Hoang and H. J. Kang, “Rolling element bearing fault diagnosis using convolutional neural network and vibration image,” Cognitive System Research, vol. 53, no. 6, pp. 42–50, 2019. [Google Scholar]
41. L. Wan, Y. Chen, H. Li and C. Li, “Rolling-element bearing fault diagnosis using improved LeNet-5 network,” Sensors, vol. 20, no. 6, pp. 1–23, 2020. [Google Scholar]
42. J. Duan, T. Shi, H. Zhou, J. Xuan and S. J. Wang, “A novel ResNet-based model structure and its applications in machine health monitoring,” Journal of Vibration and Control, vol. 2020, pp. 1–15, 2020. [Google Scholar]
 | This work is licensed under a Creative Commons Attribution 4.0 International License, which permits unrestricted use, distribution, and reproduction in any medium, provided the original work is properly cited. |