DOI:10.32604/cmc.2021.015249
| Computers, Materials & Continua DOI:10.32604/cmc.2021.015249 | |
| Article |
3D Semantic Deep Learning Networks for Leukemia Detection
1University of Wah, Wah Cantt, Pakistan
2COMSATS University Islamabad, Wah Campus, Pakistan
3National University of Technology (NUTECH), IJP Road Islamabad, Pakistan
4Faculty of Applied Computing and Technology, Noroff University College, Kristiansand, Norway
5Department of Computer Science and Engineering, Soonchunhyang University, Asan, 31538, Korea
*Corresponding Author: Yunyoung Nam. Email: ynam@sch.ac.kr
Received: 12 November 2020; Accepted: 13 February 2021
Abstract: White blood cells (WBCs) are a vital part of the immune system that protect the body from different types of bacteria and viruses. Abnormal cell growth destroys the body’s immune system, and computerized methods play a vital role in detecting abnormalities at the initial stage. In this research, a deep learning technique is proposed for the detection of leukemia. The proposed methodology consists of three phases. Phase I uses an open neural network exchange (ONNX) and YOLOv2 to localize WBCs. The localized images are passed to Phase II, in which 3D-segmentation is performed using deeplabv3 as a base network of the pre-trained Xception model. The segmented images are used in Phase III, in which features are extracted using the darknet-53 model and optimized using Bhattacharyya separately criteria to classify WBCs. The proposed methodology is validated on three publically available benchmark datasets, namely ALL-IDB1, ALL-IDB2, and LISC, in terms of different metrics, such as precision, accuracy, sensitivity, and dice scores. The results of the proposed method are comparable to those of recent existing methodologies, thus proving its effectiveness.
Keywords: YOLOv2; darknet53; Bhattacharyya separately criteria; ONNX
Blood is a fluid that transports oxygen, providing energy to body cells that then produce carbon dioxide. It also plays a pivotal role in the immune system; blood circulating in living organisms contains 55% plasma, 40% red cells, 4% platelets, and 1% white blood cells (WBCs) [1]. The five primary types of WBCs are acidophilus, lymphocytes, monocytes, basophils, and neutrophils. These blood cells contain nuclei that differ from those of other cells [2]. WBC abnormalities are diagnosed by a blood smear test. Peripheral blood analysis is utilized for detection of diseases, such as malaria, leukemia, and anemia [3,4]. Such disorders are revealed by an increase and decrease the number of WBCs in the human body. Variations occur in the morphological structure of blood cells in terms of color, shape, and size, and such variations aid in the diagnosis of abnormalities in the WBCs [5]. Thus, segmentation and classification methods are used for the detection of WBCs. The manual evaluation of WBCs is laborious and time consuming [6], and computerized methods are a useful alternative that also minimize the workload of hematologists [7]. Segmentation and classification of WBCs are performed using conventional and deep learning methodologies. In conventional approaches, features are extracted manually; however, in deep learning, images features are learned automatically through a pipeline to improve efficiency [8]. In this study, an automated approach based on deep learning is proposed to segment and classify WBCs more accurately. The foremost contributions of the proposed work are as follows:
• The Open Neural Network Exchange (ONNX) is applied with a YOLOv2 model, which detects the different types of WBCs. The features are extracted using activation-5 of the ONNX model. The extracted features are fed to the YOLOv2 model. The proposed framework accurately detects the region of interest (ROI).
• The features are extracted using darknet-53, and the prominent features are selected based on Bhattacharyya separately criteria and fed to the shallow classifiers for the classification of WBCs.
In the literature, significant work has been done for the detection of WBCs, and some of the recent works are discussed in this section [9,10]. The detection of WBCs comprises four primary steps: pre-processing, localization/segmentation, extracting discriminant features, and classification. Pre-processing is a crucial step that is performed for noise removal and eradicating unwanted distortion to enhance the lesion region used in the subsequent segmentation step [11]. Segmentation is another vital step; it is used to group the homogeneous pixels and segment the required region from the input images. WBC cells are difficult to segment because of variations in their appearance [12]. Traditionally, WBCs were detected manually by pathologists, which is time-consuming and can be inaccurate [13]. Recently, automated approaches have been used for the detection of WBCs. Unsupervised clustering methods [14], thresholding approaches [15], shape-based approaches [16], and saliency-based models [17] are commonly used to localize WBCs. Watershed and histogram orientation approaches are used for the segmentation of WBCs. A large amount of data is presented into a set of vectors in the feature extraction process [18]. Selection of the optimum diagnostic features is an important task for the detection of WBCs [19]. Several types of features with different classifiers were used to differentiate the types of WBCs [20]. Supervised methods, such as SVM, Bayesian, random forest [21], and Bayesian [22], are used for the classification of WBCs. However, even the best feature extraction and selection methods struggle with accurate classification” or something similar [23]. Deep learning (DL) approaches are used widely to extract high-level information automatically [24] for the detection of ROIs, such as in WBC detection and classification [25]. Contour aware neural networks are used to segment the WBCs. Pixel by pixel classification is performed using a fully convolutional neural network (FCN) [26]. Mask R-CNN exhibits better classification as compared with other DL techniques [27].
The proposed approach comprises localization, segmentation, high-level feature extraction/selection, and classification steps for the analysis of WBCs. In the proposed approach, WBCs are detected/localized using ONNX as the backbone of YOLOv2. The localized cells are segmented using the proposed 3-D semantic segmentation model. Finally, the WBCs are classified using multi-SVM. An overview of the proposed method is presented in Fig. 1.
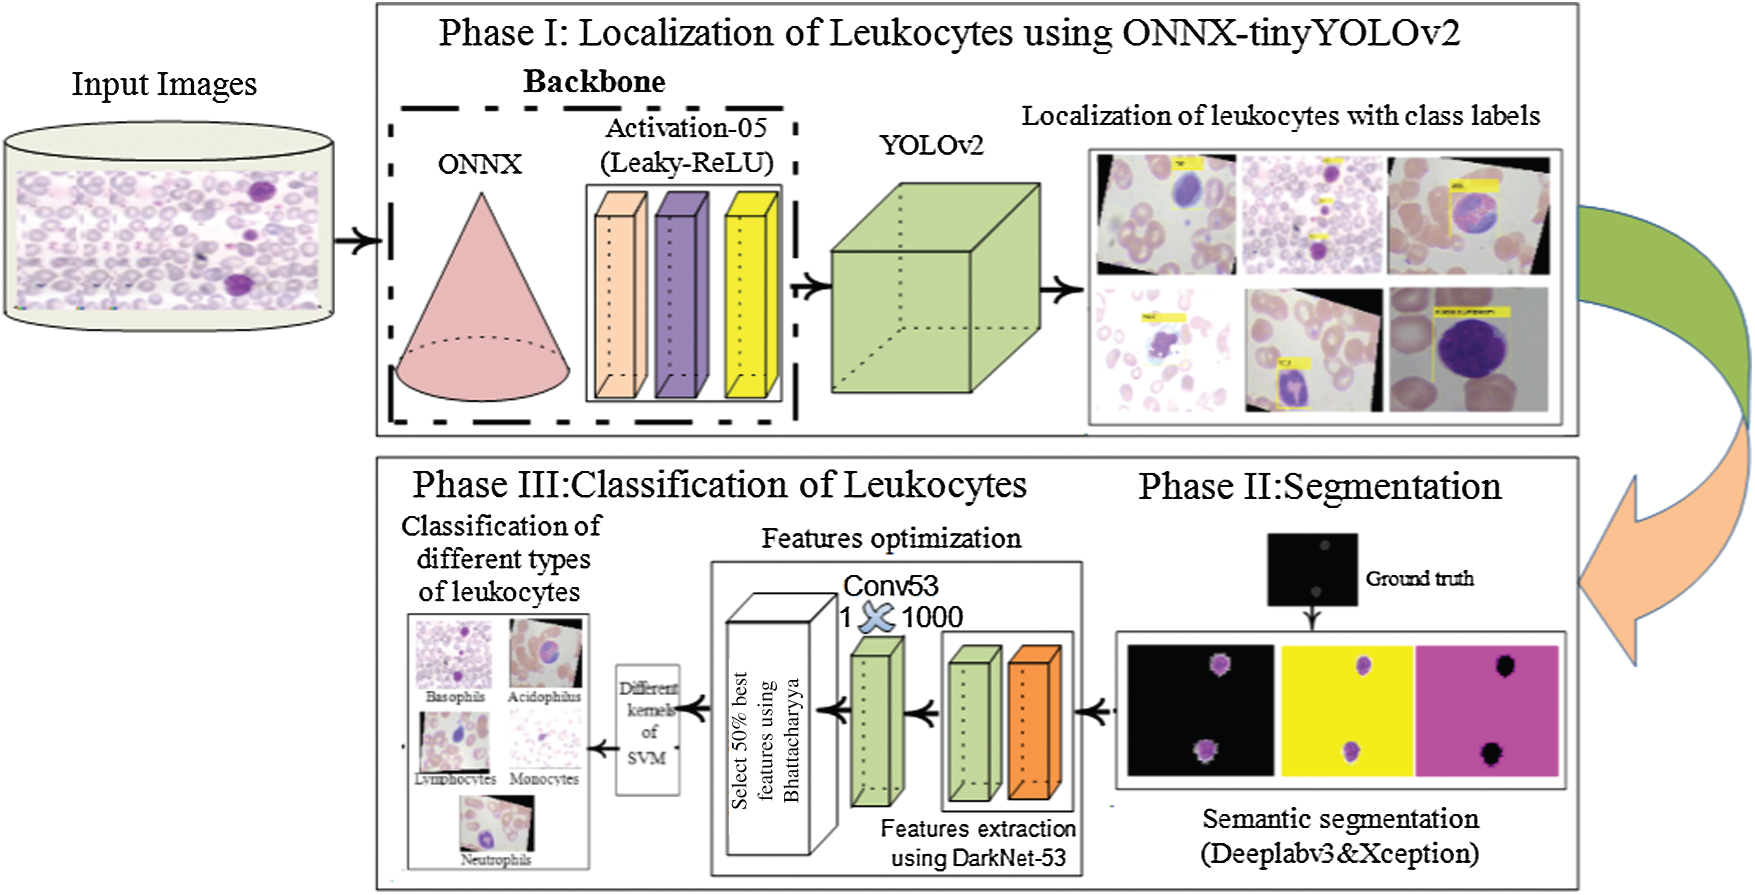
Figure 1: Proposed method architecture for WBCs localization and the segmentation
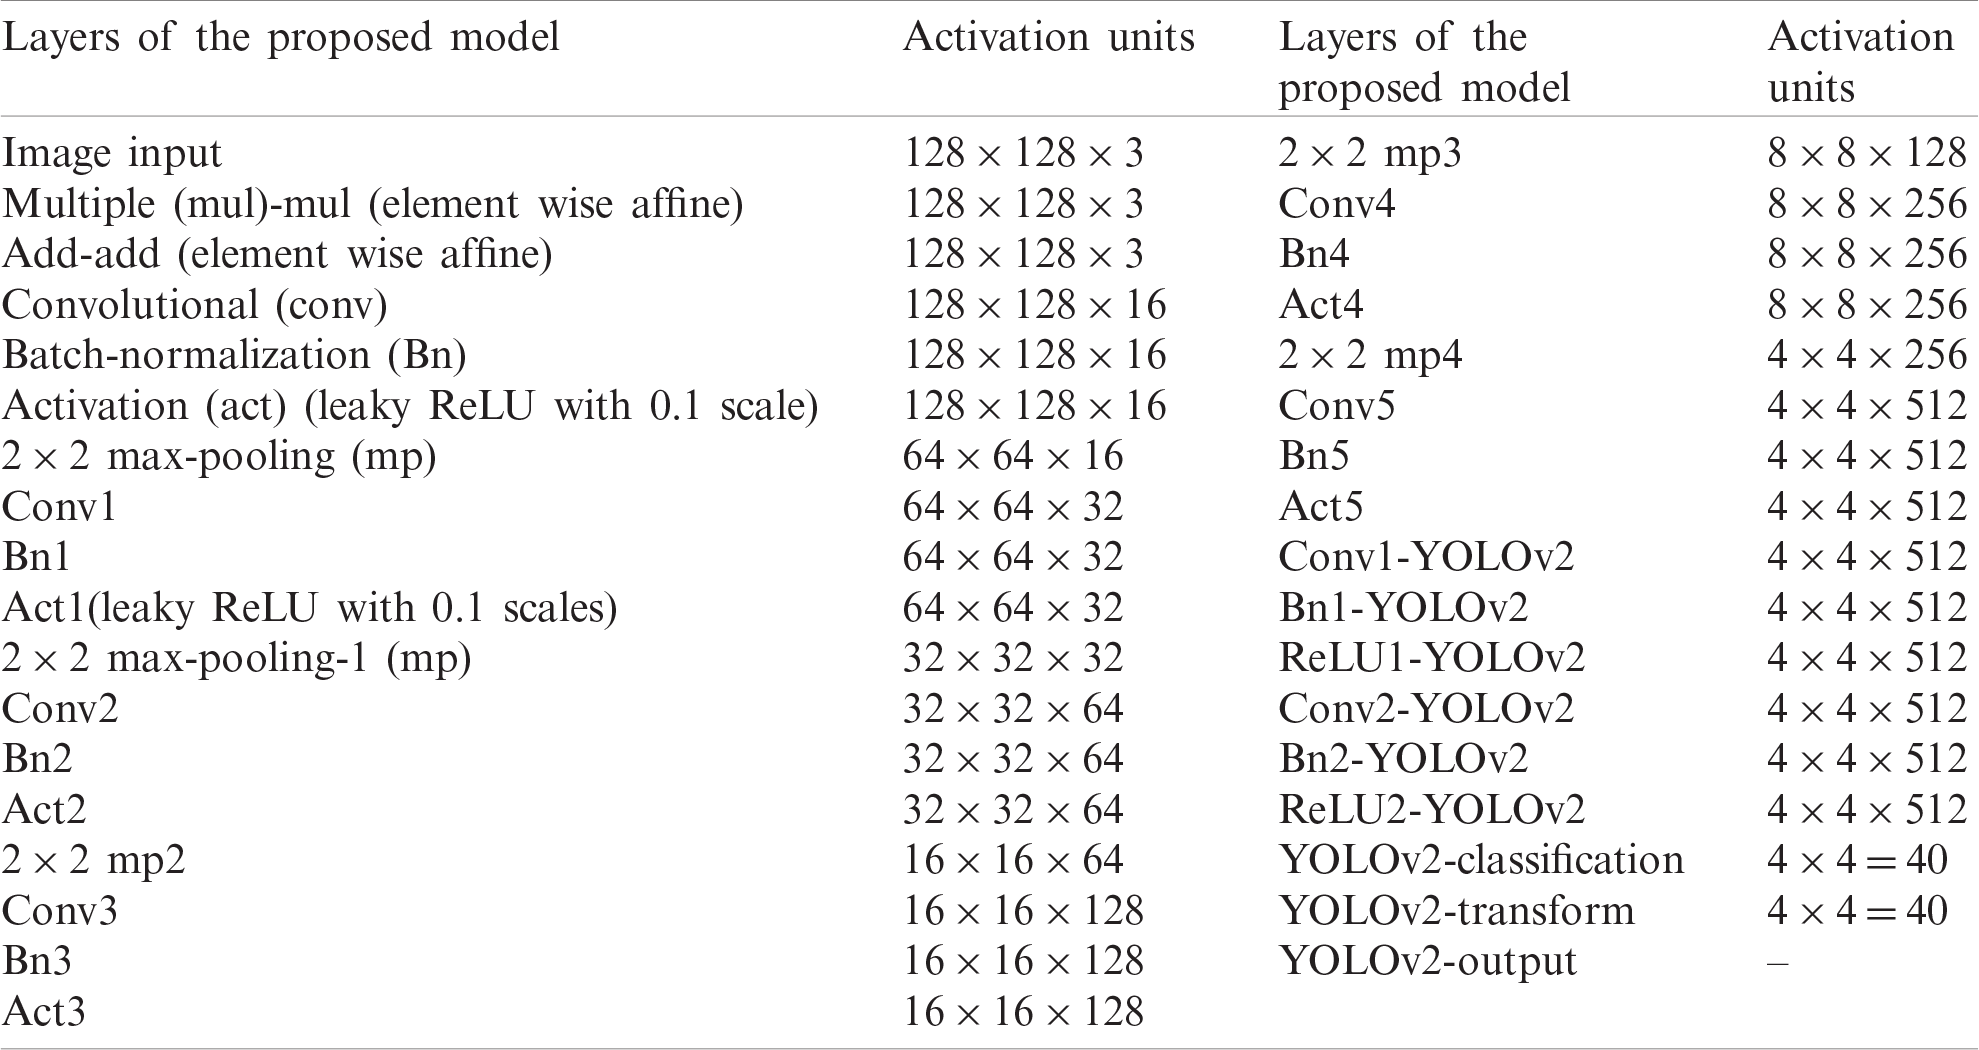
In this research, WBCs are recognized by the suggested WBC-ONNX-YOLOv2 model, as shown in Fig. 2, where features are extricated from activation-5 LeakyReLU of the ONNX model. The extracted features are further fed to the YOLOv2 architecture. The proposed model has 26 layers in the ONNX model, namely 1 input, 6 Conv, 6 Bn, 6 activation, 2 elementwise-affine, and 5 max-pooling layers, and 9 YOLOv2 layers, namely 2 ReLU, 2 Bn, 2 Conv, 1 classification, 1 transform, and 1 output layer.
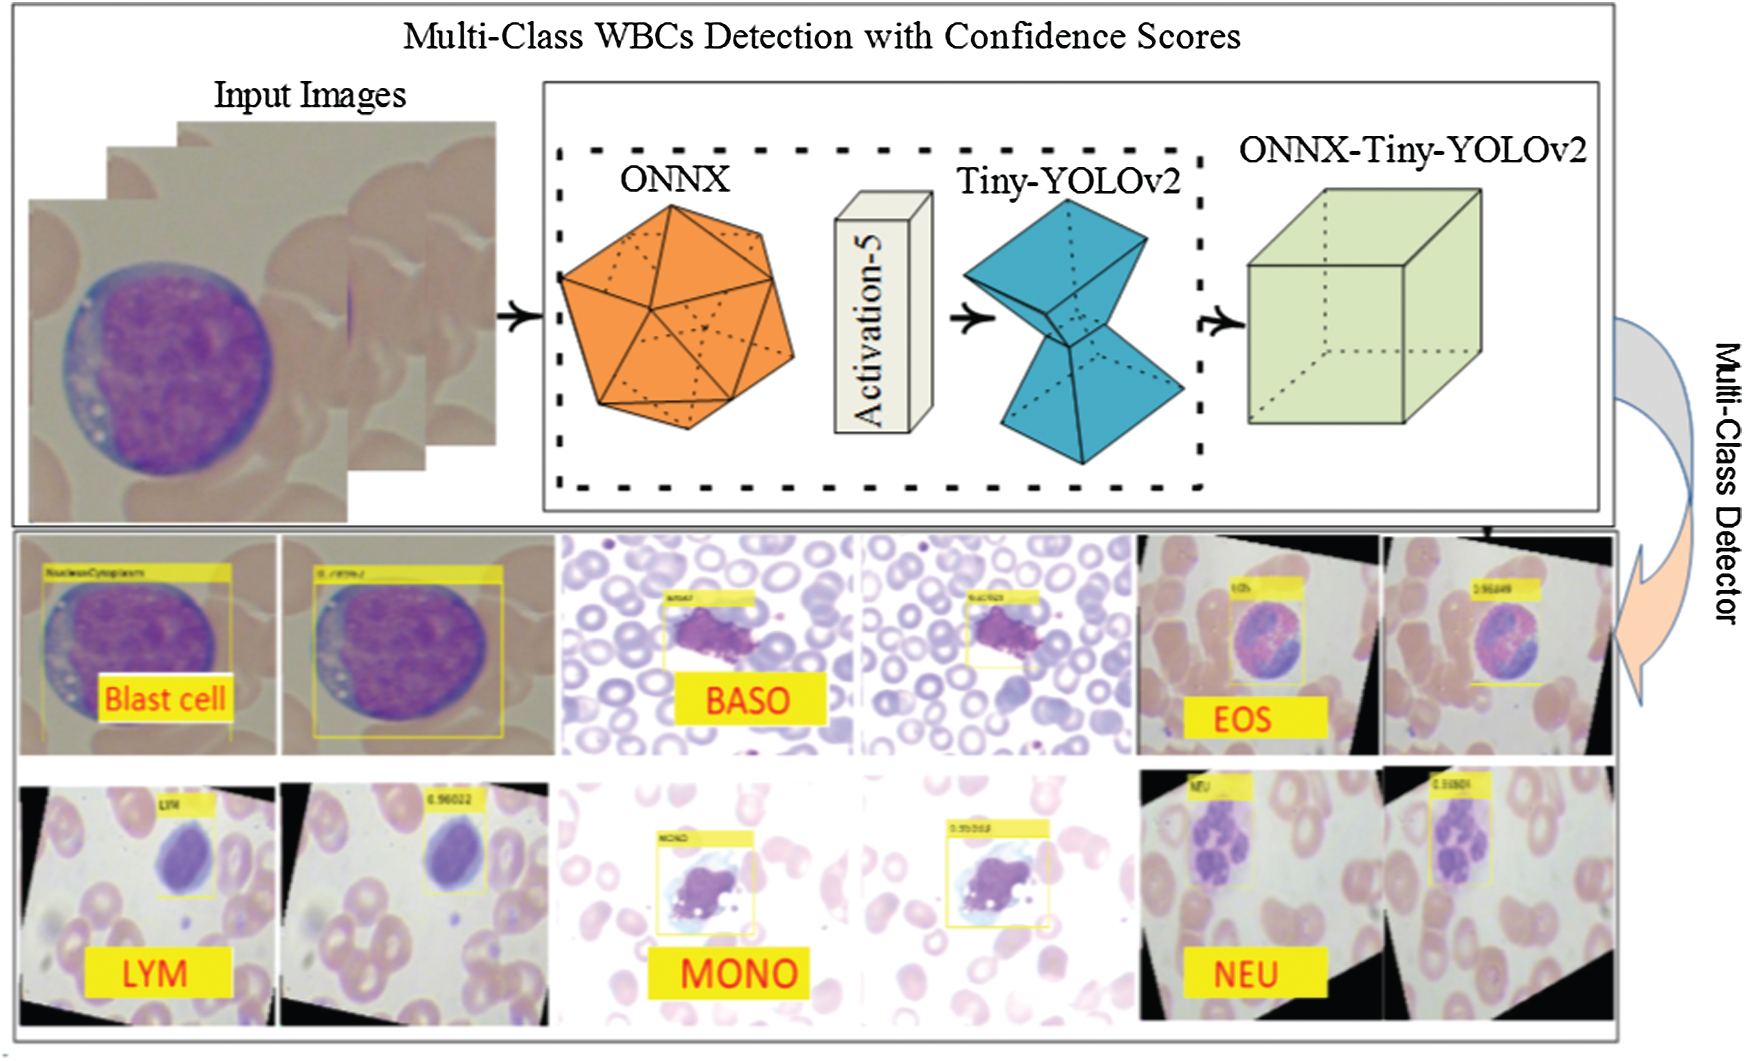
Figure 2: ONNX-YOLOv2 for multi-class detection
The layer-wise proposed model architecture is presented in Tab. 1.
Table 1: The layered architecture of the proposed localization model
The proposed model is trained using selected parameters as reported in Tab. 2.
Table 2: Proposed localization model training parameters
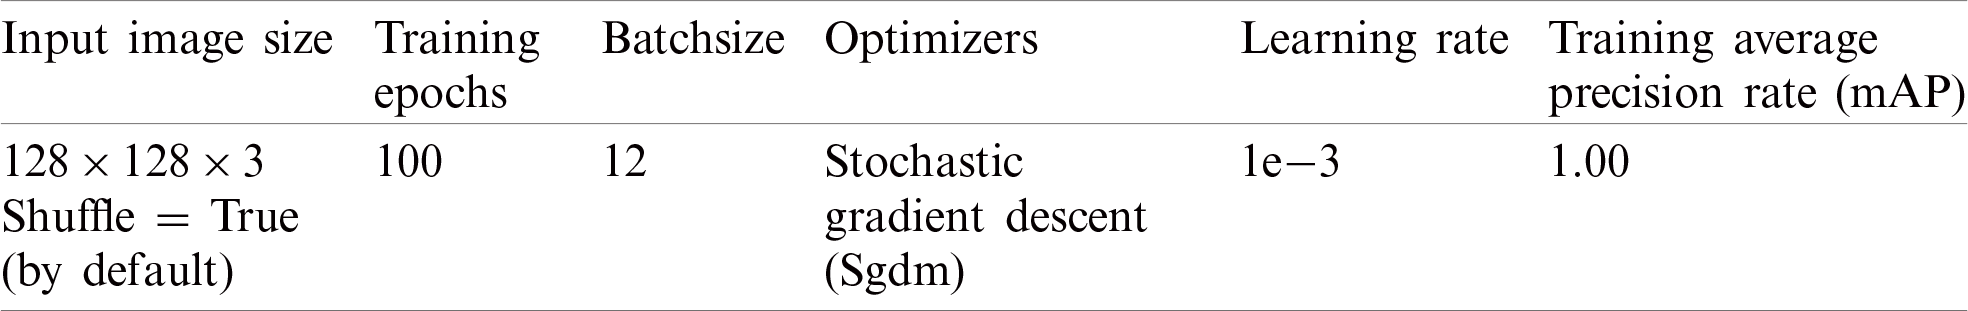
It is trained on 100 epochs, because after 100 epochs, the model performance is almost stable. The number of iterations with the respective loss during training is illustrated graphically in Fig. 3.
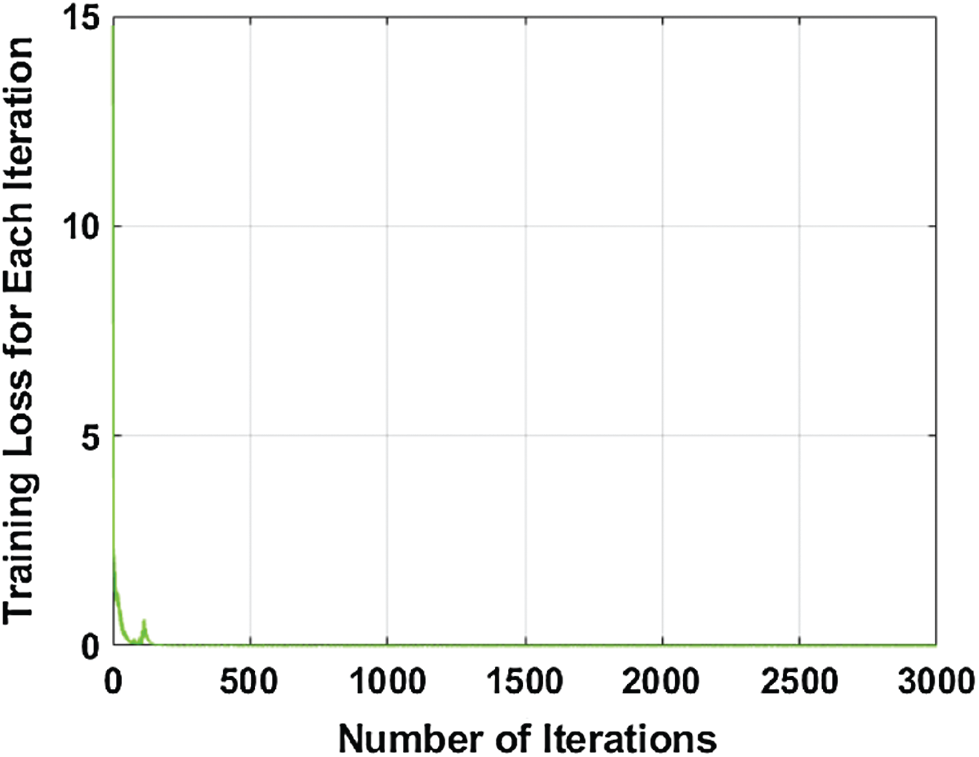
Figure 3: Number of the iteration with respect to training loss
3.2 3D-Segmentation of the Leukocytes
The semantic segmentation model is proposed for the segmentation of WBCs, in which deeplabv3 is used as a bottleneck in the Xception model. The pre-trained Xception model contains 205 layers, comprising 1 input, 88 2-D Conv, 46 Bn, 46 ReLU, 3 max-pooling, 12 addition, 4 crop 2D, 2 transpose Conv, 2 depth Conv, softmax, and pixel classification layers. The segmentation model was trained from scratch on the blood smear images. The training parameters of the presented model are listed in Tab. 3.
Table 3: Training parameters of the segmentation model
The proposed model learning with convolutional layers is plotted with activation units, as presented in Fig. 4.
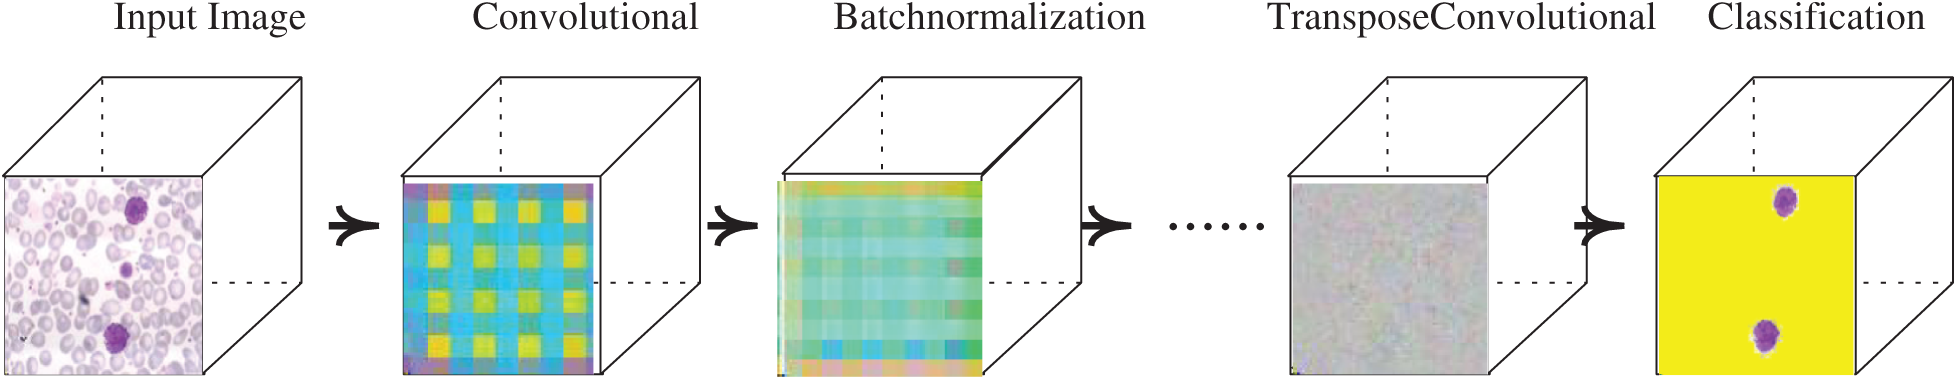
Figure 4: Segmentation model with activation units
3.3 Deep Features Extraction and Classification
The deep features are extracted using a pre-trained darknet53 model, which contains 184 layers, namely 1 input, 53 Conv, 1 global pooling, 52 Bn, 52 LeakyReLU, and 23 addition layers, and softmax with cross-entropy loss. The features are extracted from Conv53 layers with dimensions of
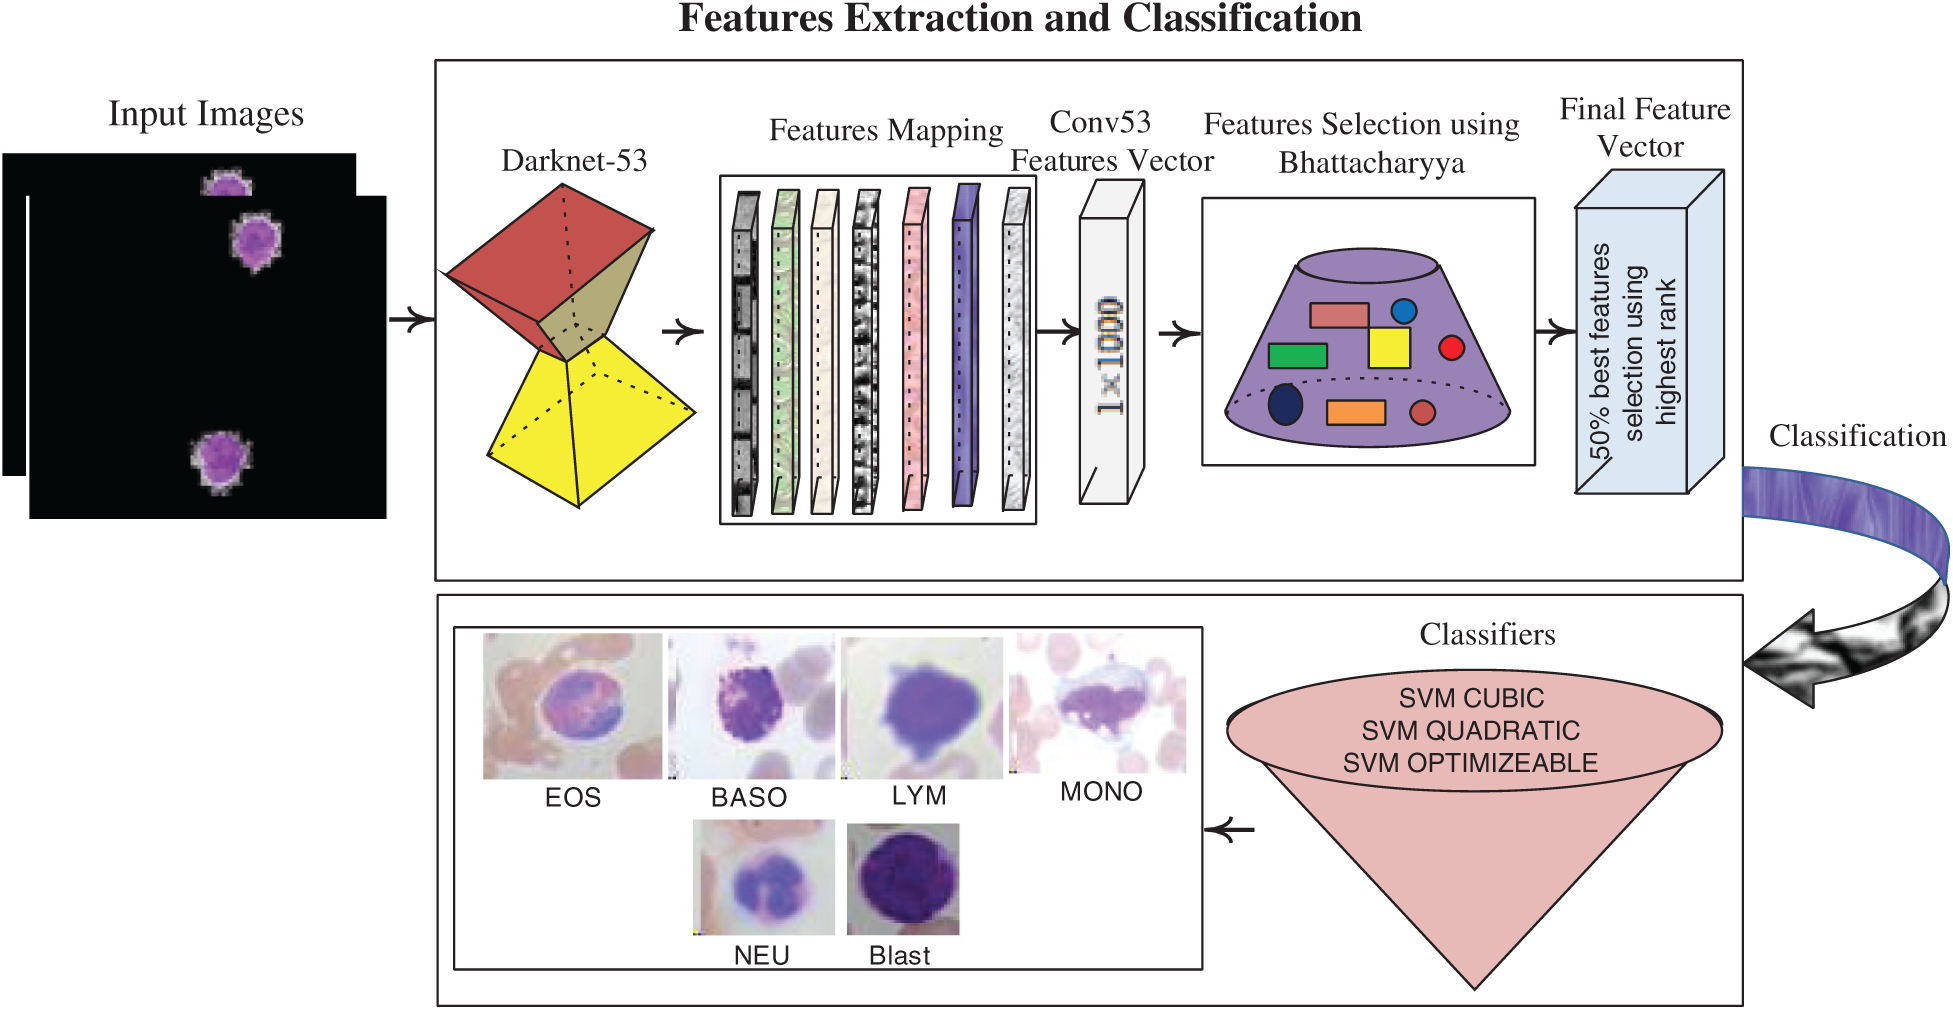
Figure 5: Feature extraction & selection and classification process
The SVM classifier with different kernels is trained on the best-selected feature vectors with optimum parameters, as listed in Tab. 4.
Table 4: Parameters of SVM selection
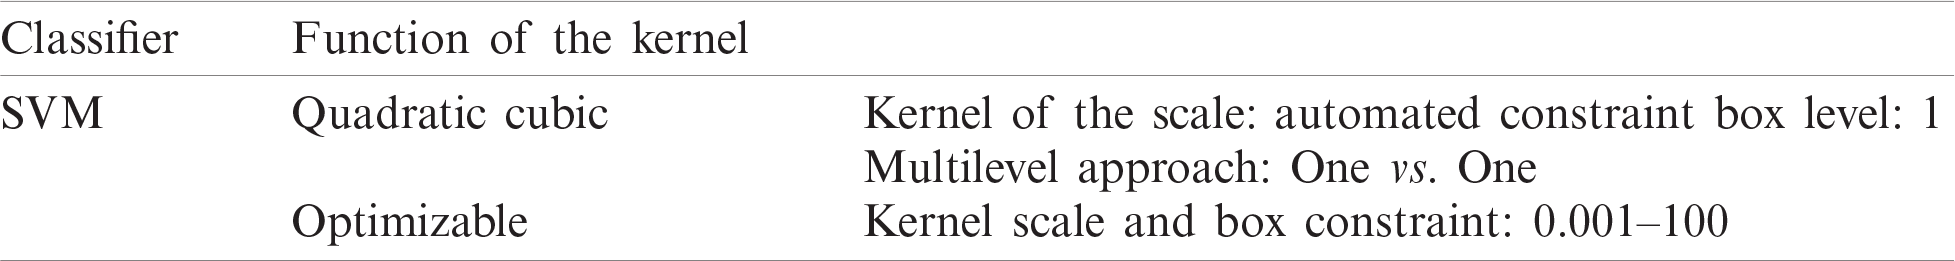
Table 5: Localization results of different kinds of WBCs
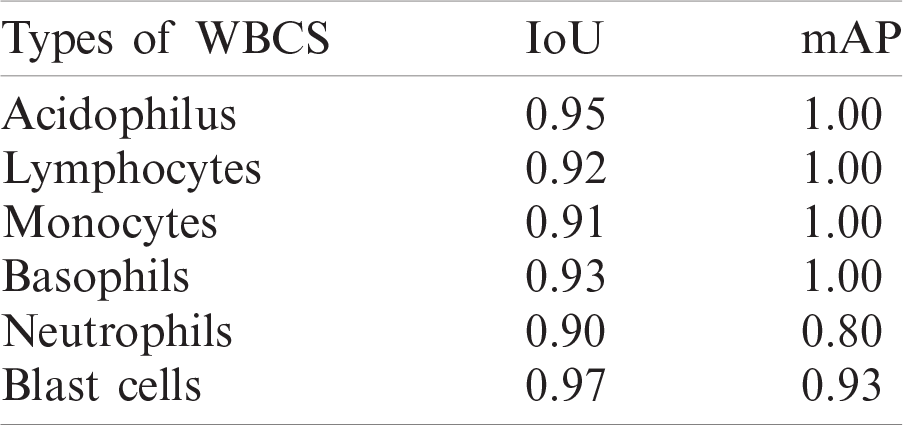
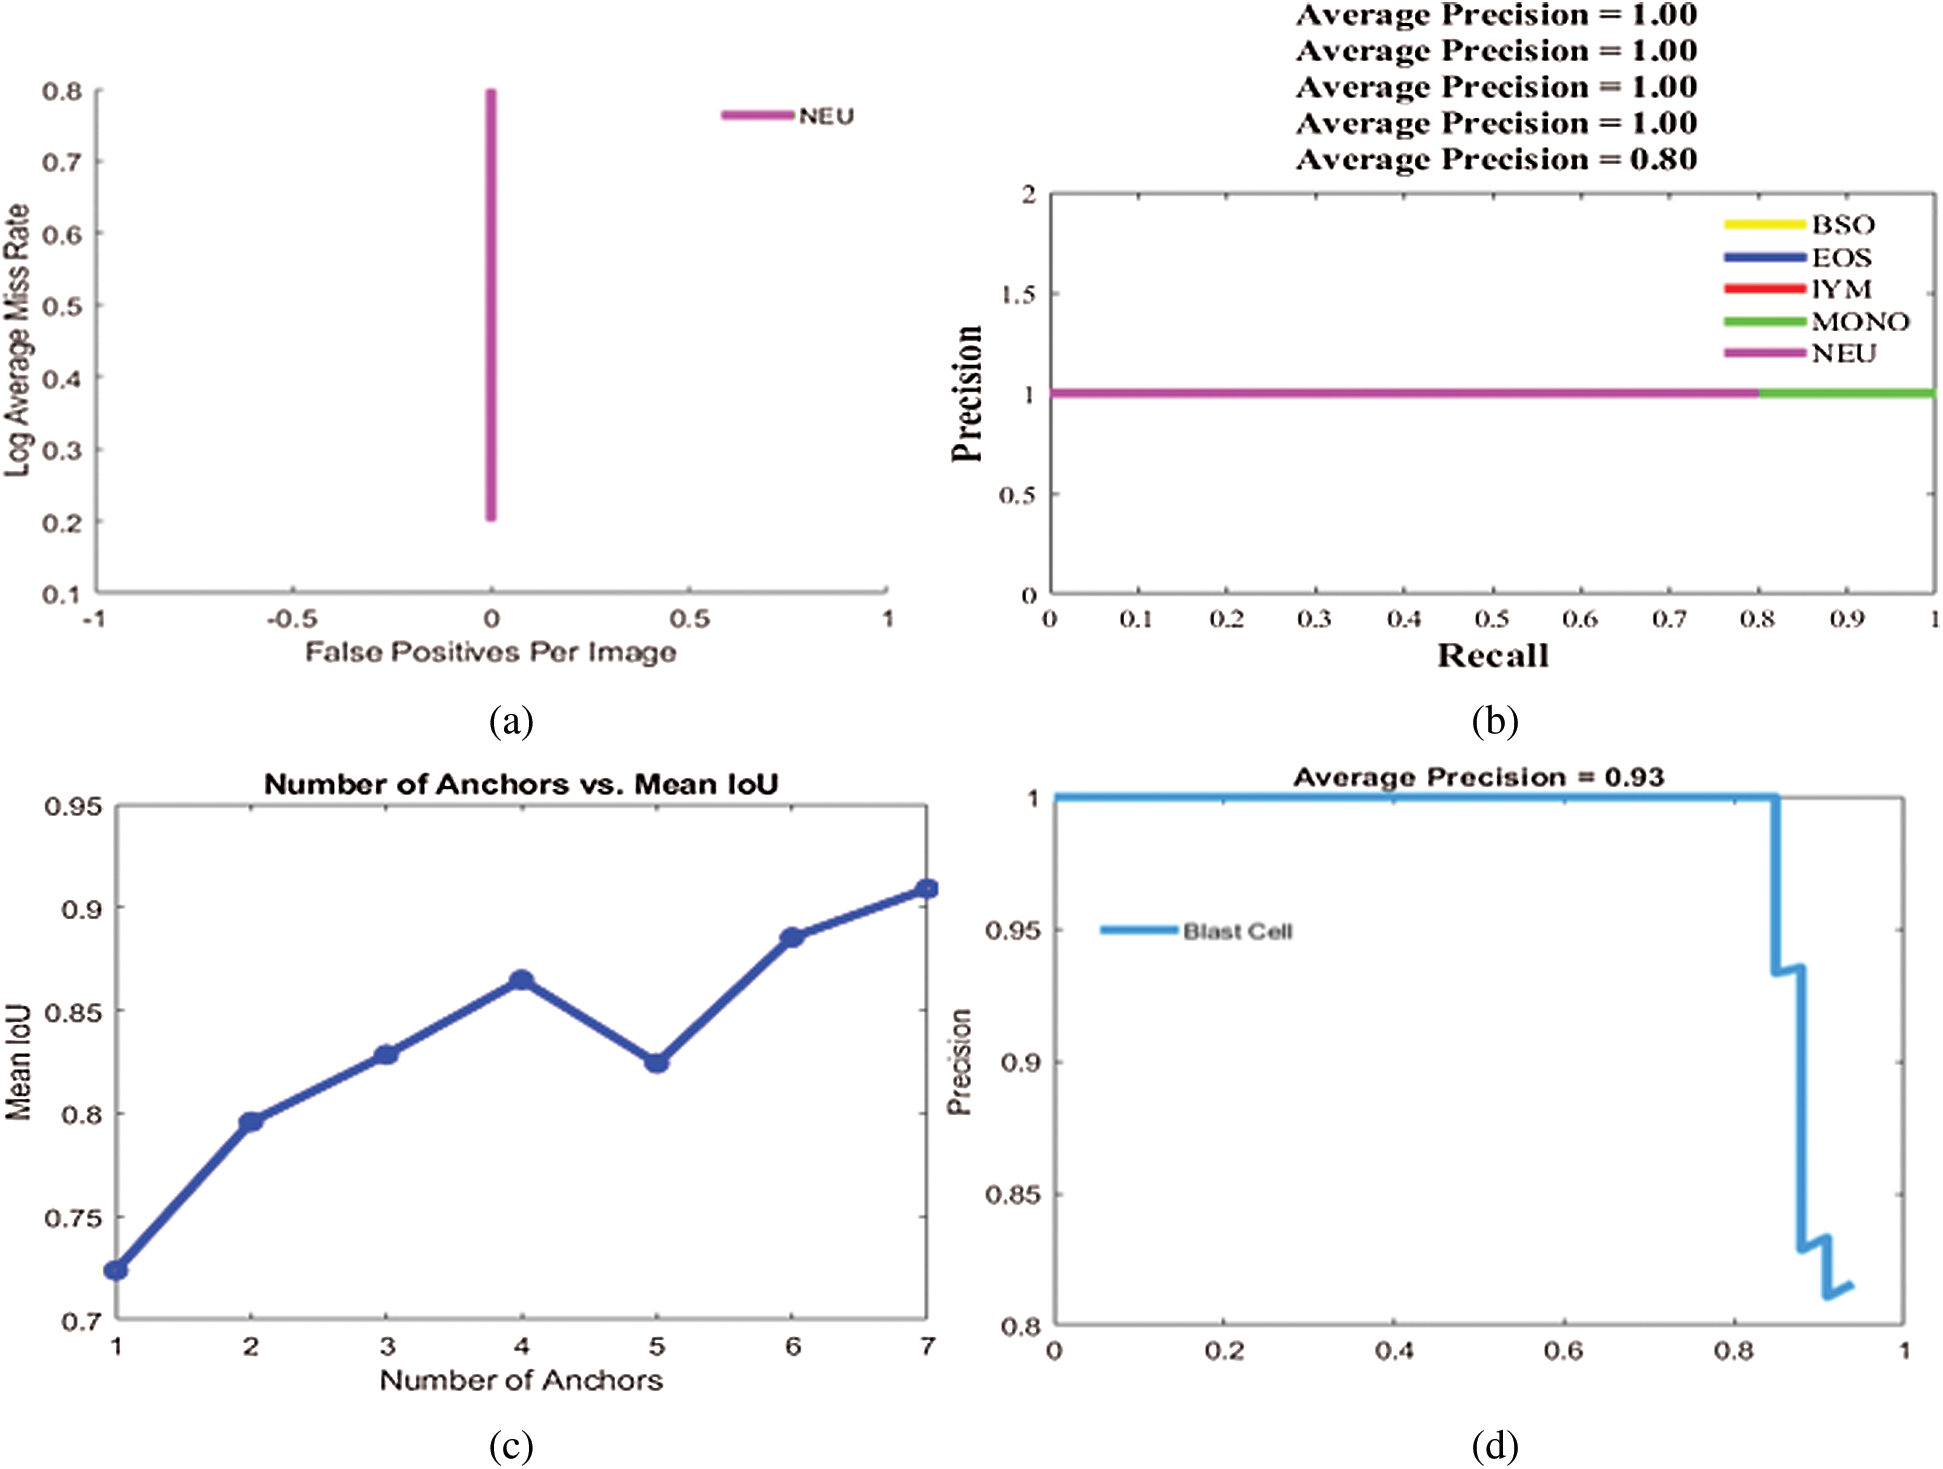
Figure 6: Localization results on benchmark datasets (a) log average rate (b) average precision of different types of WBCs (c) IoU (d) average precision of blast cells
In this research, three publicly available benchmark datasets are used for the method evaluation. ALL-IDB1 contains 107 blood smear images, of which 33 are blasts and 74 are non-blast cells, and ALL-IDB2 contains 260 blood smear images, comprising 130 blasts and 130 non-blast cells [28–31]. The LISC dataset contains blood smear images of WBCs, including eosinophils, neutrophils, monocytes, lymphocytes, and basophils. The numbers of images for each type of WBC are not equal. To balance the different types of imaging data of WBCs, data augmentation is performed by rotating the images at different angles, such as 45
The proposed work performance is validated by performing three experiments. The first experiment is performed to validate the presented localization technique by different metrics such as mean precision (mAP) and intersection over the union (IoU). The second experiment is validated to compute the segmentation model performance, while the third experiment is performed to compute the classification model performance. All experiments in this research are performed on the MATLAB 2020 Ra toolbox with 1050 K Nvidia Graphic Card.
4.2 Experiment #1: Localization of Leukocytes
Experiment 1 was performed to validate the performance of the localization approach on three benchmark datasets, LISC, ALL-IDB1, and ALL-IDB2, using IoU and mAP as metrics, as shown in Tab. 5. In this experiment, six types of WBCs were localized, and the localization results are graphically depicted in Fig. 6.
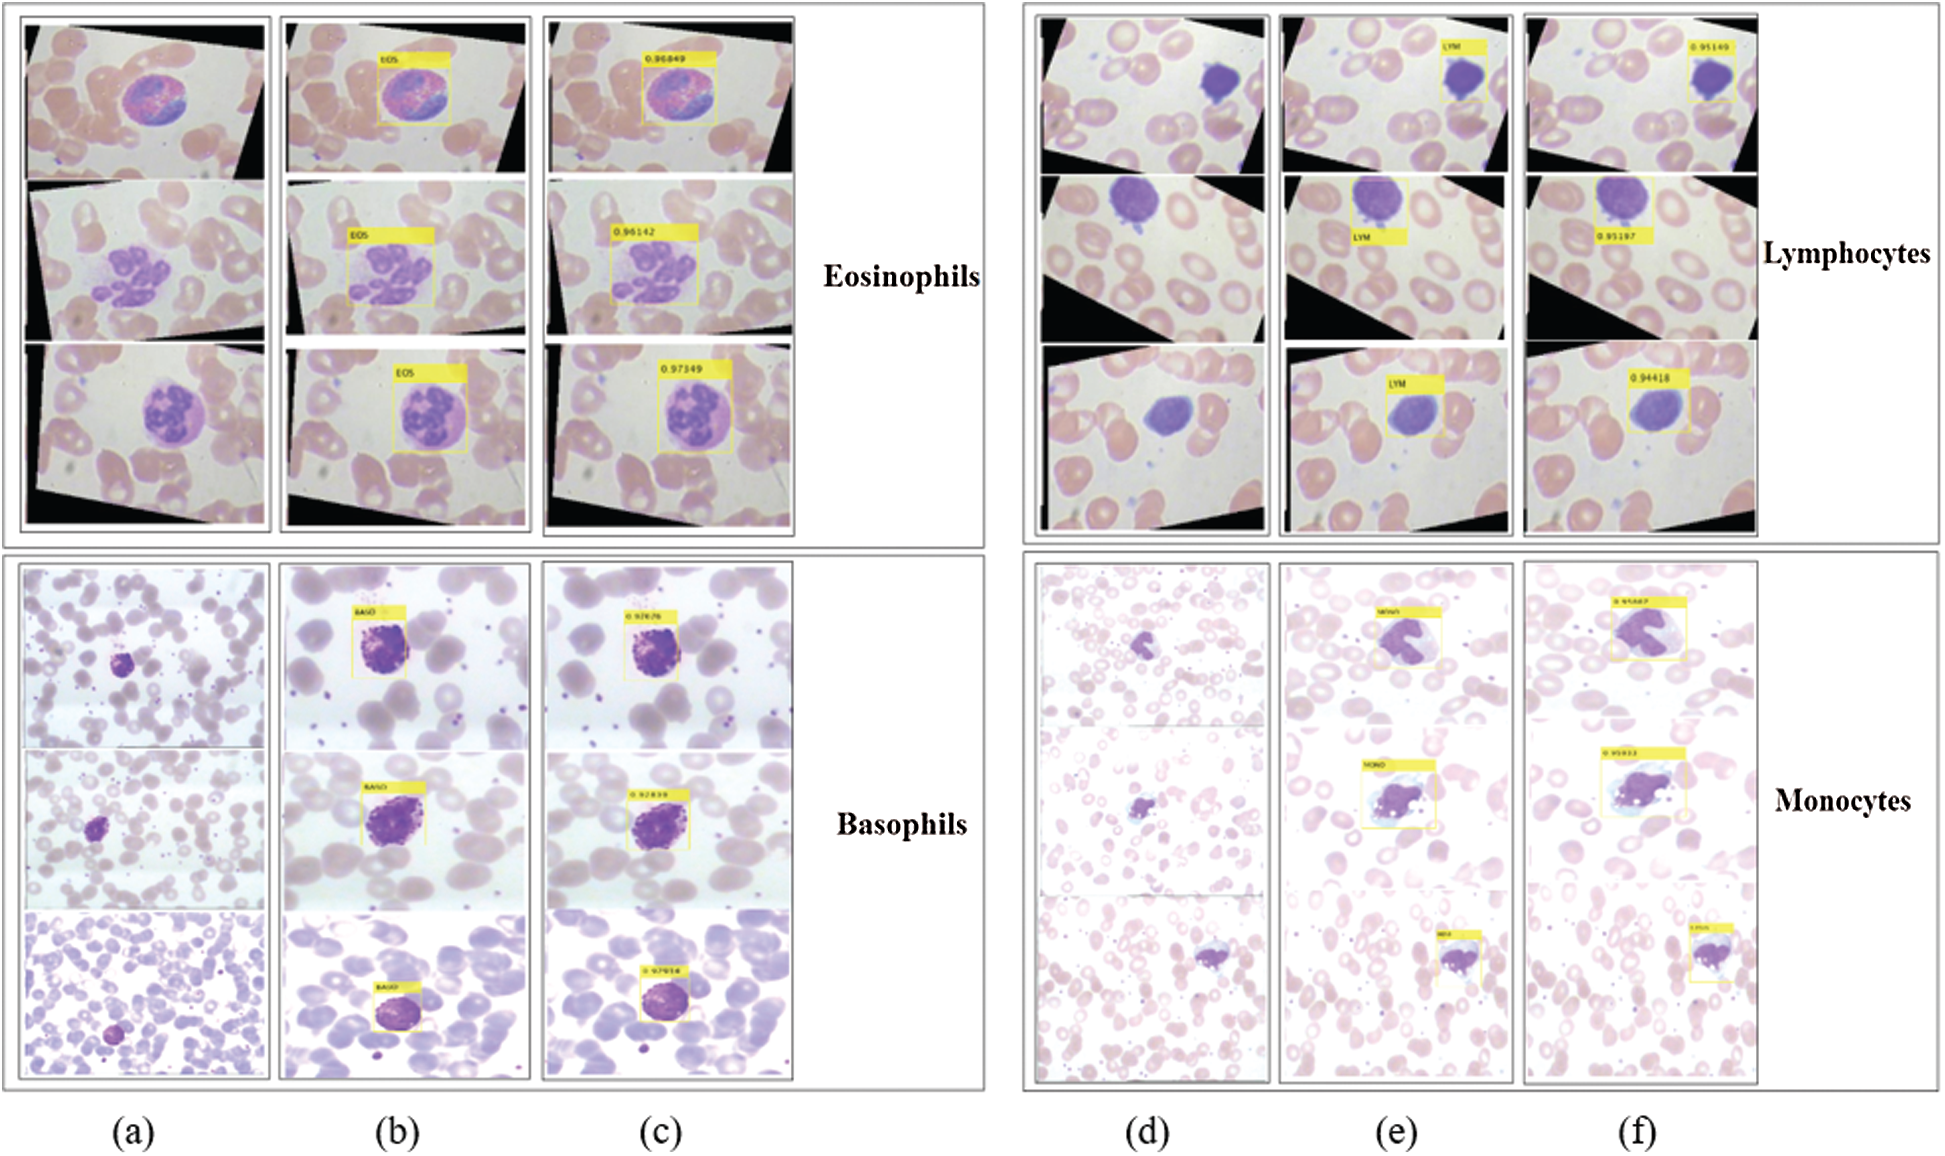
Figure 7: Localization results and corresponding confidence score of the proposed method on LISC dataset. Column (a) and (d) represent input images; (b) and (e) localization results; (c) and (f) confidence score
The localization outcomes in Tab. 5 indicate that the method achieved the highest 0.97 IoU on blast cells.
The proposed method localizes the WBCs with confidence scores, as shown in Figs. 7 and 8.
The localization results in Figs. 7 and 8 reveal that the proposed method achieved the highest confidence scores of 0.97349, 0.96849, 0.95933, 0.95867, 0.94616, and 0.89726 for eosinophils, basophils, lymphocytes, monocytes, neutrophil, and blast cells, respectively.
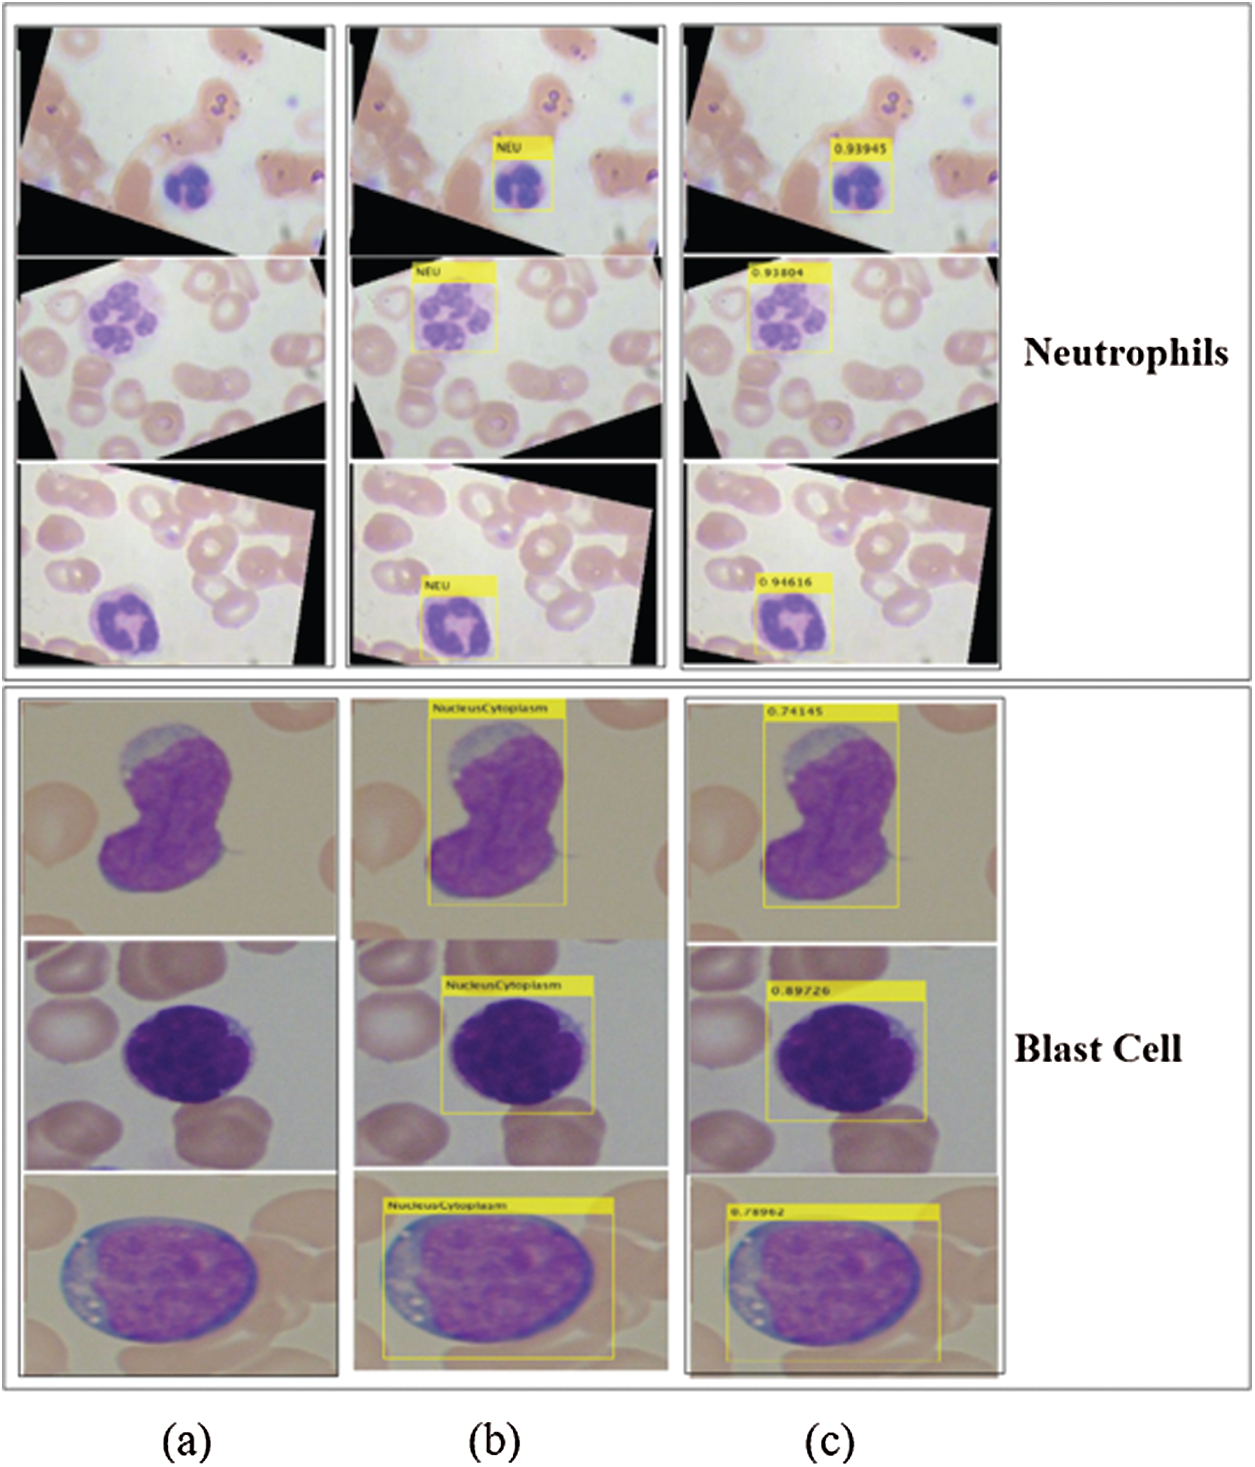
Figure 8: Localized region on LISC and ALL-IDB datasets (a) blast images (b) localization (c) confidence scores
4.3 Experiment 2: Segmentation of Leukocytes
In this experiment, the 3D segmented region is validated using different types of performance metrics, namely IoU, mean, weighted, and global accuracy, and F1-scores, as mentioned in Tab. 6. The results of the proposed segmented WBCs are mapped pixel-by-pixel with ground annotated images, as illustrated in Fig. 9.
Table 6: Segmentation results of the WBCs

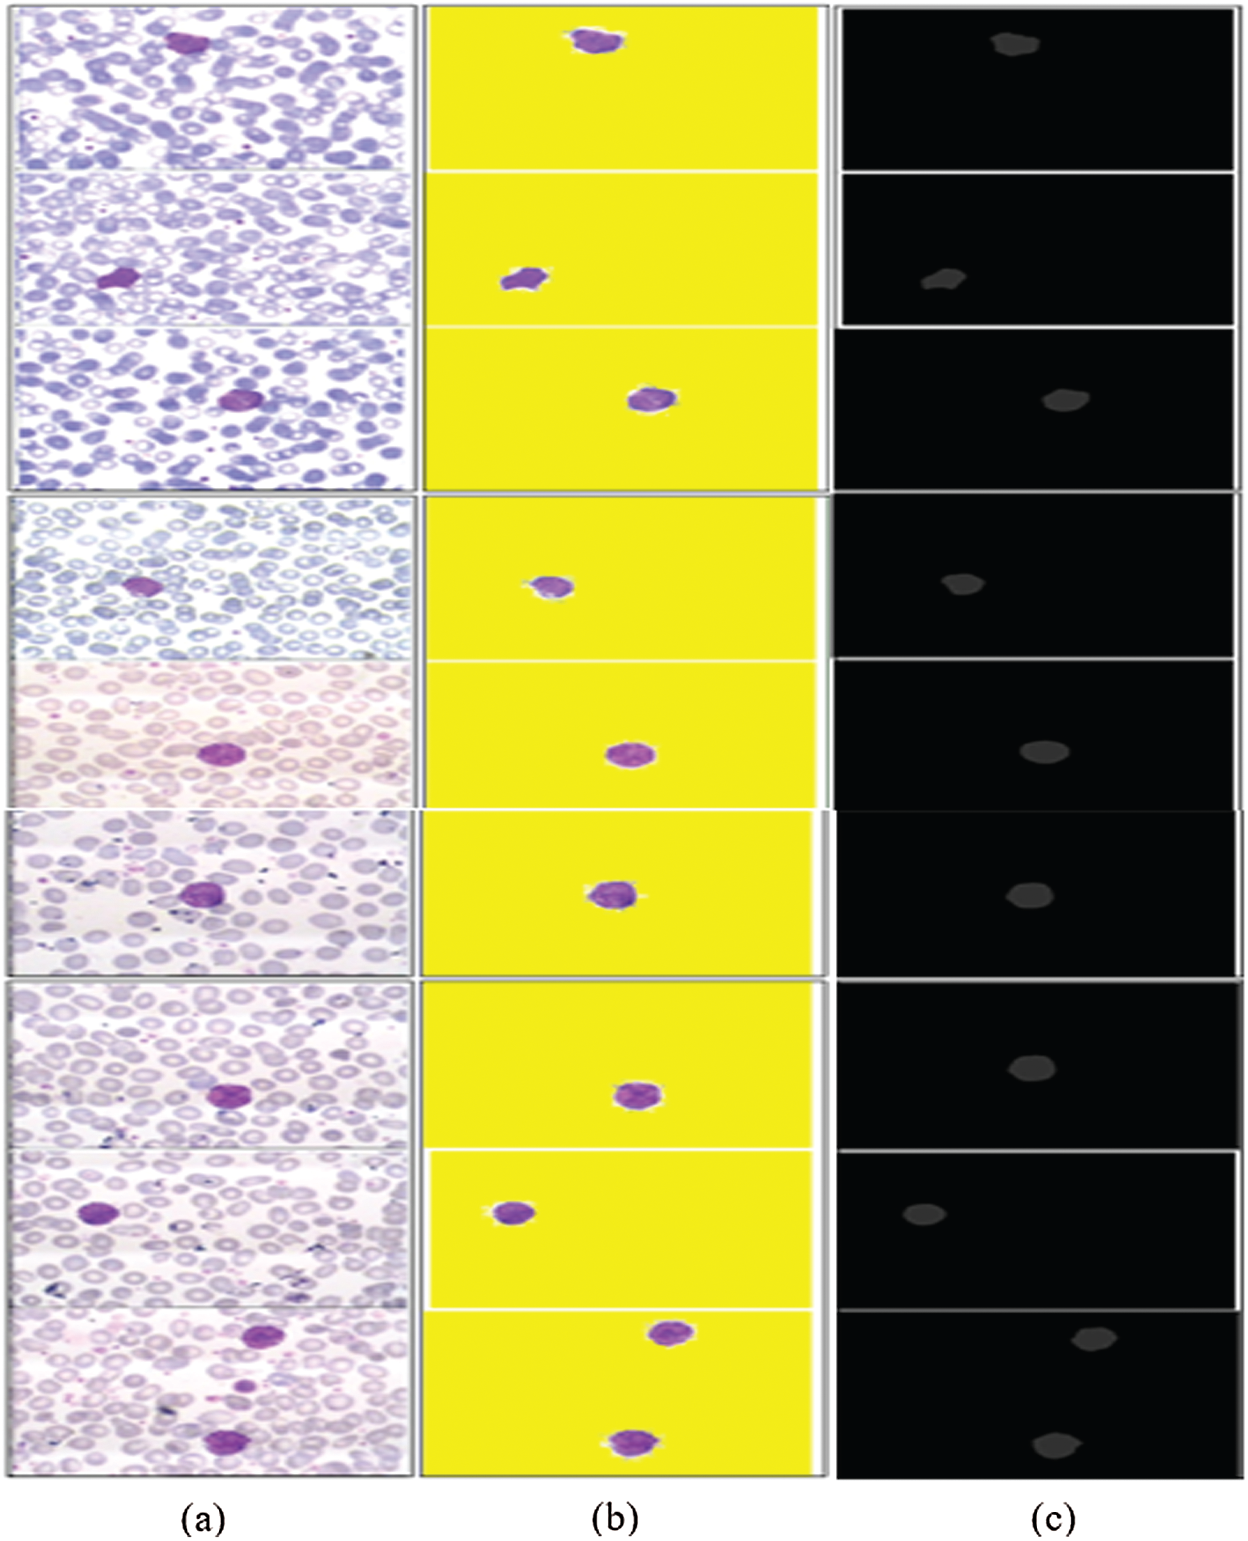
Figure 9: 3D-segmentation outcomes (a) WBCs (b) 3D segmentation (c) ground annotated masks
The segmentation results in Tab. 6 indicate that the proposed method achieved the highest segmentation accuracy, obtained by the pixel-by-pixel comparison of the segmented images with ground annotated images.
4.4 Experiment #3: Classification Based on the Extracted Feature
In this experiment, an optimized feature vector is fed to a multi-kernel SVM for WBC classification, and the outcomes are computed in terms of accuracy, precision, recall, and F1 scores from the LISC dataset, as displayed in Tabs. 7–9. The discrimination outcomes on the LISC and ALL-IDB1&2 datasets with class labels are presented in Fig. 10.
Table 7: WBCs classification results
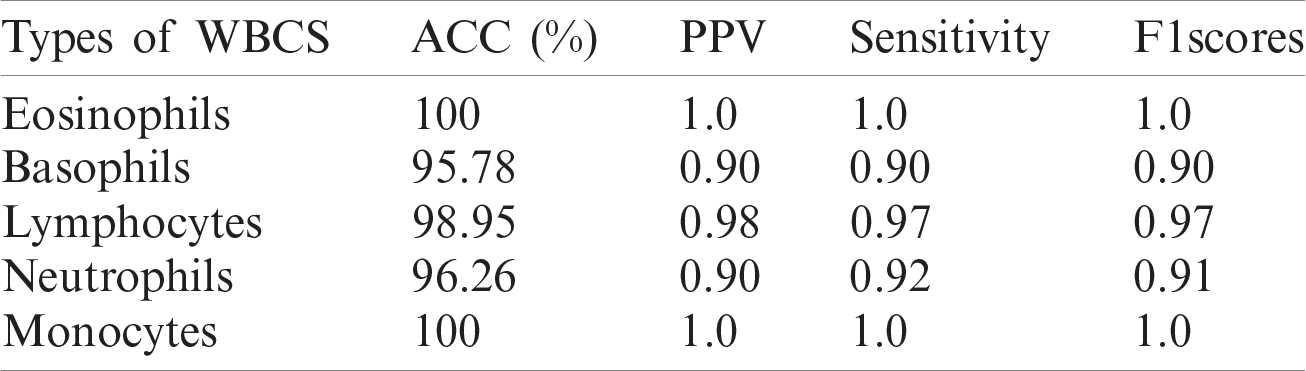
Table 8: WBCs classification results
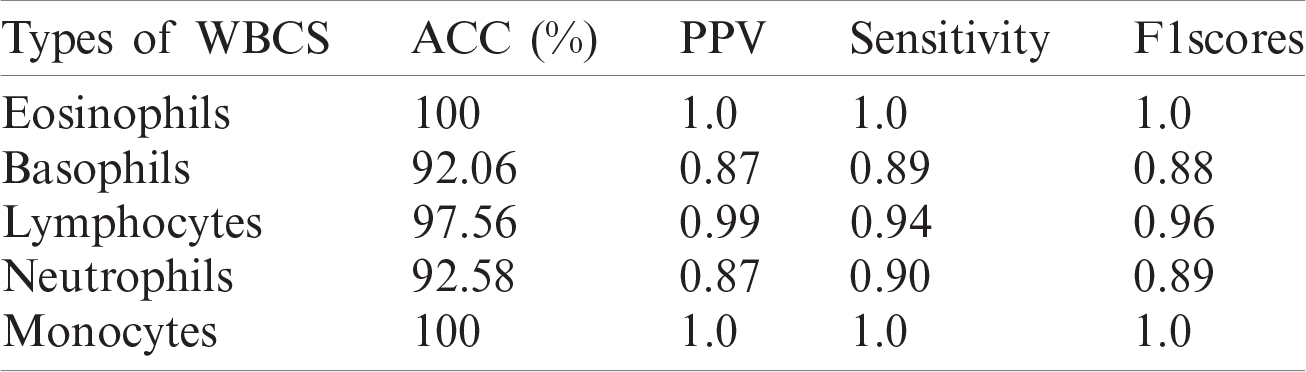
Table 9: WBCs classification results
A quantitative analysis is performed using an SVM with three different types of kernels, namely cubic, quadratic, and optimized. The SVM with the optimized kernel achieved a maximum overall accuracy of 98.4%. The classification results are also compared with the latest published work, as shown in Tab. 10.
Tab. 10 compares the classification results with the latest published existing work. The existing work achieved accuracies of 0.995, 0.984, 0.984, 0.961, and 0.950 for lymphocytes, monocytes, basophils, eosinophils, and neutrophils, respectively. In contrast, the proposed method exhibited improved classification accuracy, with 0.996, 1.00, 0.987, 1.00, and 0.988 for lymphocytes, monocytes, basophils, eosinophils, and neutrophils, respectively.
The classification results on the ALL-IDB1&2 datasets are presented in Tabs. 11 and 12.
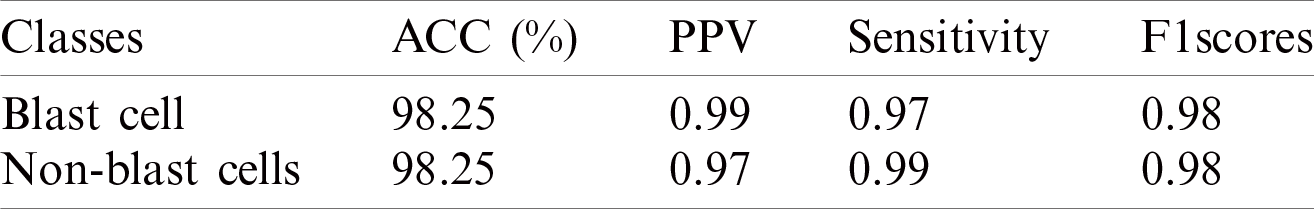
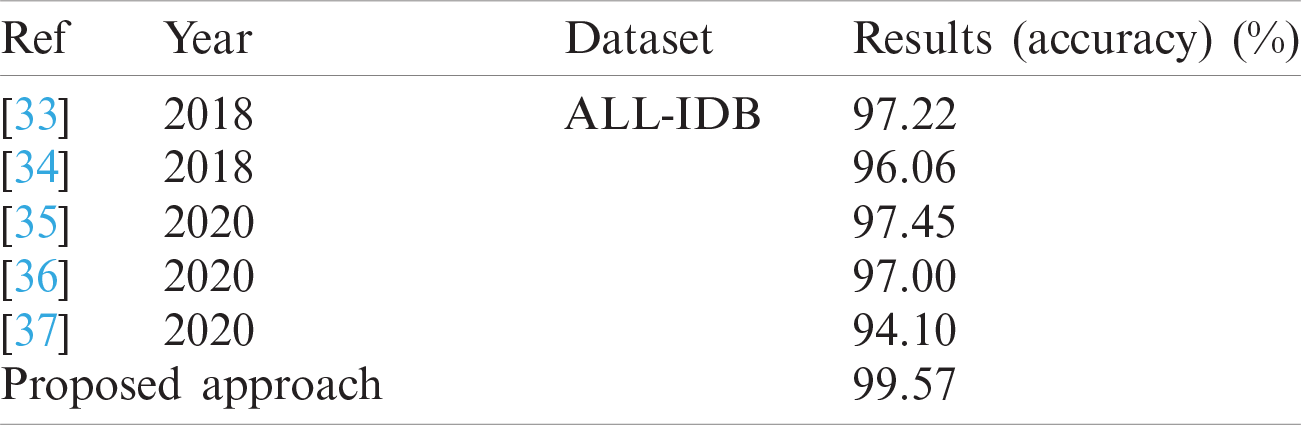
The classification results of blast/non-blast cells are presented in Tabs. 11 and 12. An accuracy of 99.57% was achieved on the ALL-IDB1 dataset and 98.25% on the ALL-IDB2 dataset, and the results are compared with a recently published work, as provided in Tab. 13.
Tab. 13 presents a comparison of the numerical results, wherein the competitive results obtained from the proposed method are compared to those of the latest published work.
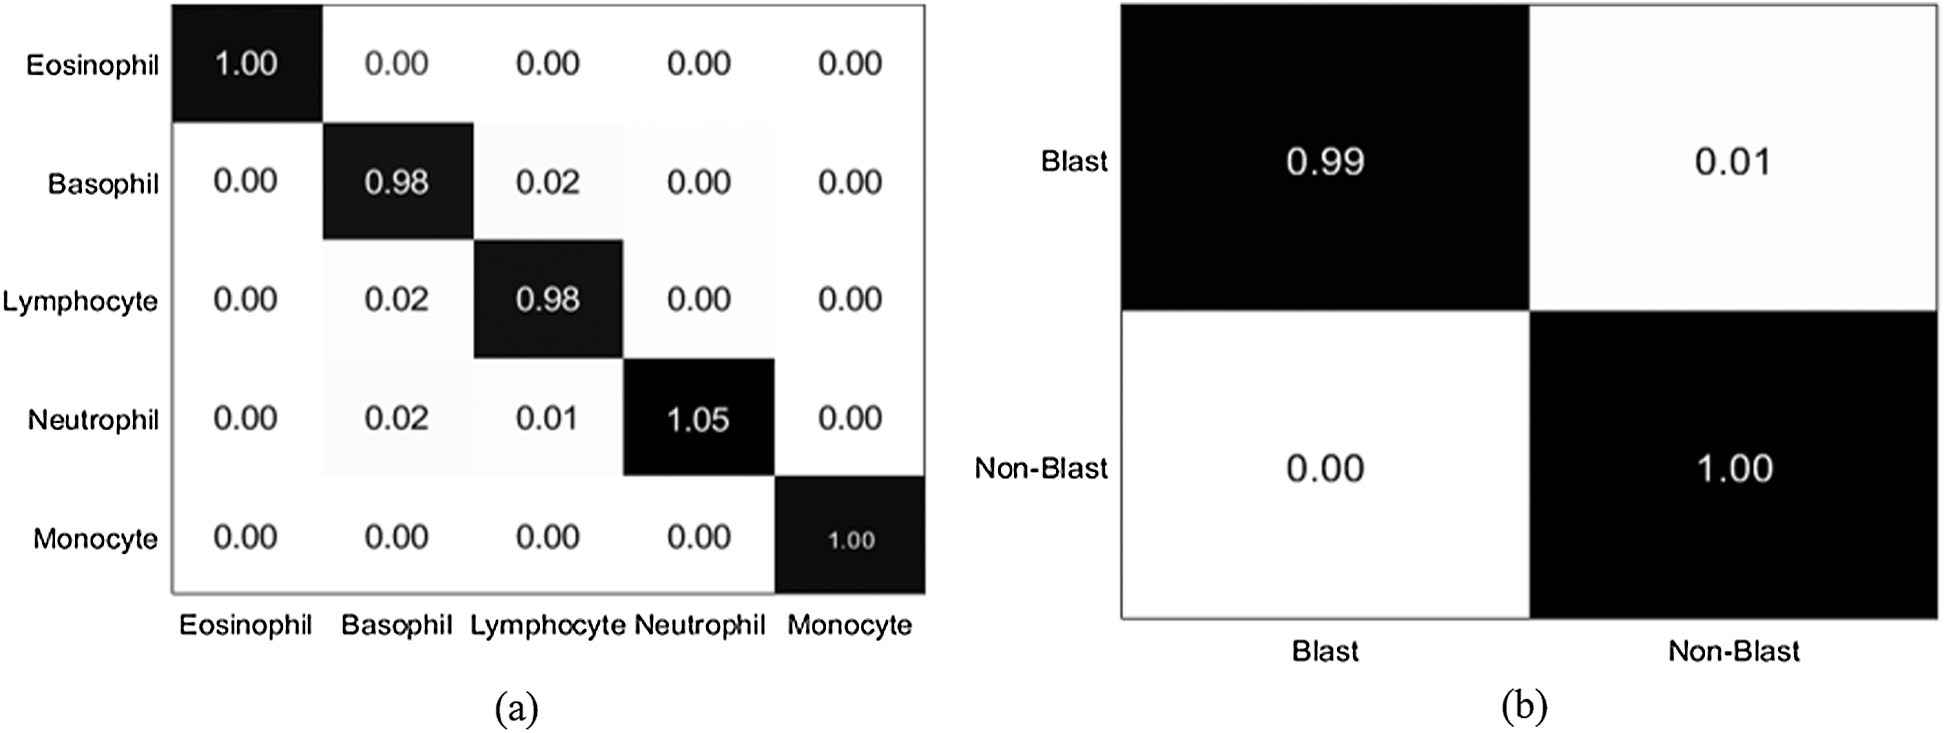
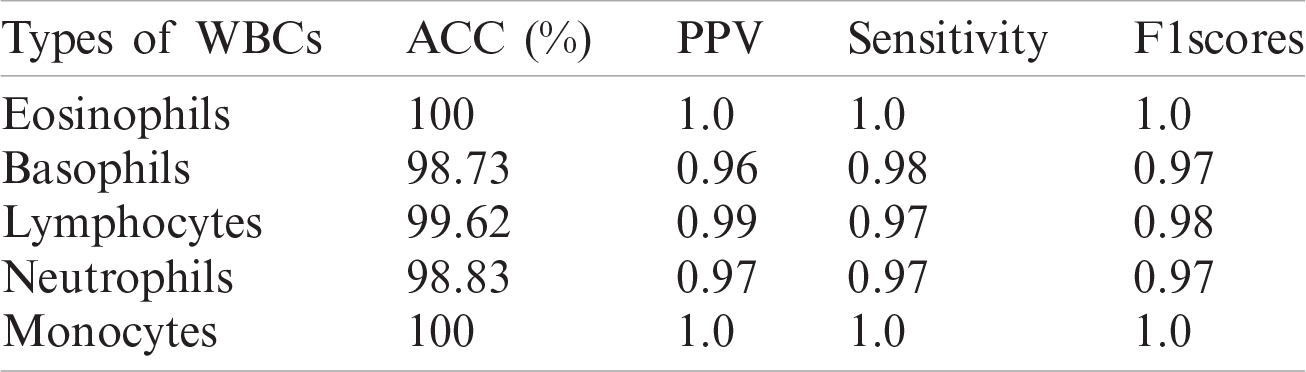
Figure 10: Confusion matrix (a) LISC dataset (b) ALL-IDB1 dataset
Table 10: Proposed work comparison with latest published work on LISC dataset
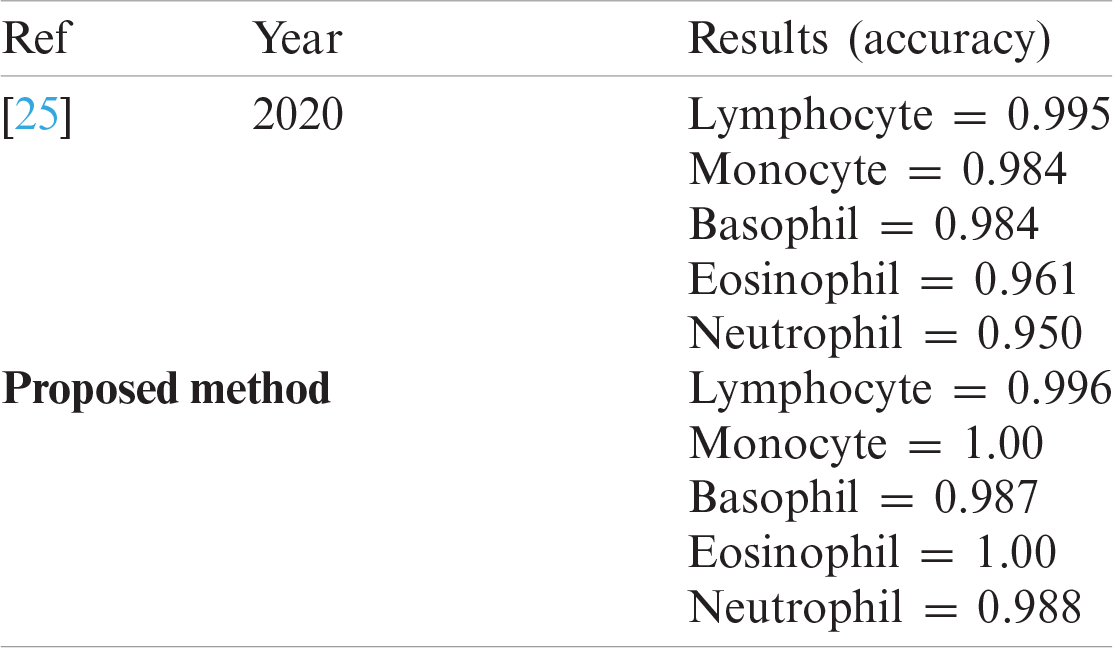
Table 11: WBCs classification results
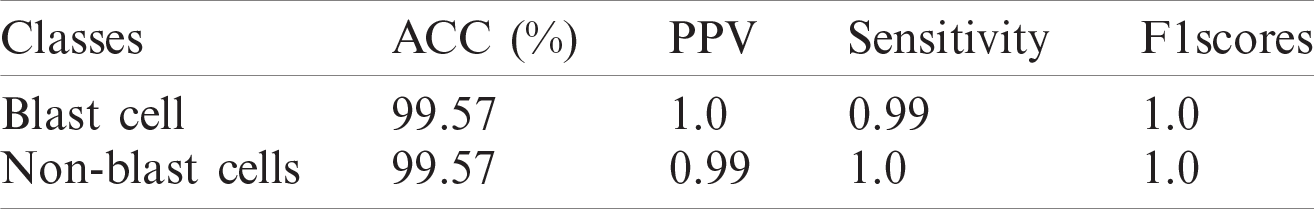
Table 12: WBCs classification results
In this study, deep learning approaches are proposed for the detection of WBCs. Detecting WBCs is challenging because blood smear images contain different color distributions in the cytoplasm and nucleus regions, making it difficult to segment these regions accurately. A 3-D semantic segmentation model is proposed, in which deeplabv3 is used as a bottleneck and the Xception model is used as a classification head to accurately segment the WBCs. Feature extraction/selection is another challenge for the classification of WBCs. The features are extracted from the pre-trained darknet-53 model, and informative features are selected using Bhattacharyya separability criteria and passed to the SVM with different types of kernels, namely cubic, quadratic, and optimized. The proposed classification method achieved an accuracy of 99.57% on the ALL-IDB1 dataset, 98.25% for the ALL-IDB2 dataset, and 98.4% for LISC datasets using the optimizable SVM kernel. The overall experimental outcomes demonstrate that the proposed technique achieved competitive outcomes by optimizing the SVM kernel. The proposed new framework based on a CNN can be used for the detection of different types of cancer, such as lung and bone cancer. It detects and classifies leukocytes at an early stage, thereby increasing the survival rate of patients.
Acknowledgement: This research was supported by Korea Institute for Advancement of Technology (KIAT).
Funding Statement: This research was supported by Korea Institute for Advancement of Technology (KIAT) grant funded by the Korea Government (MOTIE) (P0012724, The Competency Development Program for Industry Specialist) and the Soonchunhyang University Research Fund.
Conflicts of Interest: All authors declare that they have no conflicts of interest to report regarding the present study.
1. M. Srivastava, Analysis on Bio-Mathematics. Chhattisgarh, India: Shashwat Publication, 2020. [Online]. Available: https://shashwatpublication.com/books/anasysis-on-bio-mathematics. [Google Scholar]
2. S. Ali, A. Tanveer, A. Hussain and S. U. Rehman, “Identification of cancer disease using image processing approahes,” International Journal of Intelligent Information Systems, vol. 9, no. 2, pp. 1–10, 2020. [Google Scholar]
3. E. Abdulhay, M. A. Mohammed, D. A. Ibrahim, N. Arunkumar and V. Venkatraman, “Computer aided solution for automatic segmenting and measurements of blood leucocytes using static microscope images,” Journal of Medical Systems, vol. 42, no. 4, pp. 1–12, 2018. [Google Scholar]
4. M. A. Mohammed, K. H. Abdulkareem, S. A. Mostafa, M. K. A. Ghani, M. S. Maashi et al., “Voice pathology detection and classification using convolutional neural network model,” Applied Sciences, vol. 10, pp. 1–13, 2020. [Google Scholar]
5. M. Subathra, M. A. Mohammed, M. S. Maashi, B. Garcia-Zapirain, N. Sairamya et al., “Detection of focal and non-focal electroencephalogram signals using fast walsh-hadamard transform and artificial neural network,” Sensors, vol. 20, no. 17, pp. 1–20, 2020. [Google Scholar]
6. M. K. Abd Ghani, M. A. Mohammed, N. Arunkumar, S. A. Mostafa, D. A. Ibrahim et al., “Decision-level fusion scheme for nasopharyngeal carcinoma identification using machine learning techniques,” Neural Computing and Applications, vol. 32, no. 3, pp. 625–638, 2020. [Google Scholar]
7. O. I. Obaid, M. A. Mohammed, M. Ghani, A. Mostafa and F. Taha, “Evaluating the performance of machine learning techniques in the classification of wisconsin breast cancer,” International Journal of Engineering & Technology, vol. 7, pp. 160–166, 2018. [Google Scholar]
8. N. Arunkumar, M. A. Mohammed, M. K. Abd Ghani, D. A. Ibrahim, E. Abdulhay et al., “K-means clustering and neural network for object detecting and identifying abnormality of brain tumor,” Soft Computing, vol. 23, no. 19, pp. 9083–9096, 2019. [Google Scholar]
9. H. Eilertsen, P. C. Sæther, C. E. Henriksson, A. S. Petersen and T. A. Hagve, “Evaluation of the detection of blasts by sysmex hematology instruments, cellavision DM96, and manual microscopy using flow cytometry as the confirmatory method,” International Journal of Laboratory Hematology, vol. 41, no. 3, pp. 338–344, 2019. [Google Scholar]
10. H. H. Inbarani and A. T. Azar, “Leukemia image segmentation using a hybrid histogram-based soft covering rough k-means clustering algorithm,” Electronics, vol. 9, no. 1, pp. 1–22, 2020. [Google Scholar]
11. J. Bai, F. Lu and K. Zhang, “ONNX: Open neural network exchange,” GitHub Repository, 2019. [Online]. Available: https://github.com/onnx/onnx. [Google Scholar]
12. J. Redmon and A. Farhadi, “YOLO9000: Better, faster, stronger,” in Proc. of the IEEE Conf. on Computer Vision and Pattern Recognition, Honolulu, Hawaii, pp. 7263–7271, 2017. [Google Scholar]
13. L. Chen, Y. Zhu, G. Papandreou, F. Schroff and H. Adam, “Encoder-decoder with atrous separable convolution for semantic image segmentation,” in Proc. of the European Conf. on Computer Vision, Glasgow, United Kingdom, pp. 801–818, 2018. [Google Scholar]
14. F. Chollet, “Xception: Deep learning with depthwise separable convolutions,” in Proc. of the IEEE Conf. on Computer Vision and Pattern Recognition, Montreal, Canada, pp. 1251–1258, 2017. [Google Scholar]
15. J. Redmon, “Darknet: Open source neural networks in C,” 2016. [Online]. Available: https://pjreddie.com/darknet. [Google Scholar]
16. S. Theodoridis and K. Koutroumbas, “Pattern recognition,” IEEE Transactions on Neural Networks, vol. 19, no. 1, pp. 1–957, 2008. [Google Scholar]
17. S. Kollem, K. R. Reddy and D. S. Rao, “A review of image denoising and segmentation methods based on medical images,” International Journal of Machine Learning and Computing, vol. 9, no. 3, pp. 288–295, 2019. [Google Scholar]
18. K. Al-Dulaimi, J. Banks, K. Nguyen, A. Al-Sabaawi, I. Tomeo-Reyes et al., “Segmentation of white blood cell, nucleus and cytoplasm in digital haematology microscope images: A review-challenges, current and future potential techniques,” IEEE Reviews in Biomedical Engineering, vol. 14, pp. 1–16, 2020. [Google Scholar]
19. M. Dutta, S. Karmakar, P. Banerjee and R. Ghatak, “Detection of leukemia in blood samples applying image processing using a novel edge detection method,” in Proc. of the Global AI Congress, Singapore, pp. 1–16, 2019. [Google Scholar]
20. M. Nassar, M. Doan, A. Filby, O. Wolkenhauer, D. K. Fogg et al., “Label-free identification of white blood cells using machine learning,” Cytometry Part A, vol. 95, no. 8, pp. 836–842, 2019. [Google Scholar]
21. M. Khodashenas, H. Ebrahimpour-komleh and A. Nickfarjam, “White blood cell detection and counting based on genetic algorithm,” in Advances in Science and Engineering Technology International Conf., Dubai, United Arab Emirates, pp. 1–4, 2019. [Google Scholar]
22. A. Şengür, Y. Akbulut, Ü. Budak and Z. Cömert, “White blood cell classification based on shape and deep features,” in Int. Artificial Intelligence and Data Processing Symp., Malatya, Turkey, pp. 1–4, 2019. [Google Scholar]
23. J. Nalepa and M. Kawulok, “Selecting training sets for support vector machines: A review,” Artificial Intelligence Review, vol. 52, no. 2, pp. 857–900, 2019. [Google Scholar]
24. E. Hussain, L. B. Mahanta, C. R. Das, M. Choudhury and M. Chowdhury, “A shape context fully convolutional neural network for segmentation and classification of cervical nuclei in pap smear images,” Artificial Intelligence in Medicine, vol. 107, pp. 1–11, 2020. [Google Scholar]
25. H. Kutlu, E. Avci and F. Özyurt, “White blood cells detection and classification based on regional convolutional neural networks,” Medical Hypotheses, vol. 135, no. 10, pp. 1–11, 2020. [Google Scholar]
26. V. Shankar, M. M. Deshpande, N. Chaitra and S. Aditi, “Automatic detection of acute lymphoblasitc leukemia using image processing,” in IEEE Int. Conf. on Advances in Computer Applications, Coimbatore, India, pp. 186–189, 2016. [Google Scholar]
27. N. Dhieb, H. Ghazzai, H. Besbes and Y. Massoud, “An automated blood cells counting and classification framework using mask R-CNN deep learning model,” in 31st Int. Conf. on Microelectronics, Cairo, Egypt, pp. 300–303, 2019. [Google Scholar]
28. R. D. Labati, V. Piuri and F. Scotti, “All-IDB: The acute lymphoblastic leukemia image database for image processing,” in 18th IEEE Int. Conf. on Image Processing, Brussels, Belgium, pp. 2045–2048, 2011. [Google Scholar]
29. F. Scotti, “Robust segmentation and measurements techniques of white cells in blood microscope images,” in 2006 IEEE Instrumentation and Measurement Technology Conf. Proc., Sorrento, Italy, pp. 43–48, 2006. [Google Scholar]
30. F. Scotti, “Automatic morphological analysis for acute leukemia identification in peripheral blood microscope images,” in CIMSA. IEEE Int. Conf. on Computational Intelligence for Measurement Systems and Applications, Giardini Naxos, Italy, pp. 96–101, 2005. [Google Scholar]
31. V. Piuri and F. Scotti, “Morphological classification of blood leucocytes by microscope images,” in 2004 IEEE Int. Conf. on Computational Intelligence for Measurement Systems and Applications, Boston, MA, USA, pp. 103–108, 2004. [Google Scholar]
32. S. H. Rezatofighi, K. Khaksari and H. Soltanian-Zadeh, “Automatic recognition of five types of white blood cells in peripheral blood,” in Int. Conf. Image Analysis and Recognition, Berlin, Heidelberg, pp. 161–172, 2010. [Google Scholar]
33. L. C. de Faria, L. F. Rodrigues and J. F. Mari, “Cell classification using handcrafted features and bag of visual words,” in Anais do XIV Workshop de Visão Computacional, Brasil, pp. 1–6, 2018. [Google Scholar]
34. S. Shafique and S. Tehsin, “Acute lymphoblastic leukemia detection and classification of its subtypes using pretrained deep convolutional neural networks,” Technology in Cancer Research & Treatment, vol. 17, pp. 1–7, 2018. [Google Scholar]
35. Z. F. Mohammed and A. A. Abdulla, “An efficient CAD system for all cell identification from microscopic blood images,” Multimedia Tools and Applications, vol. 80, pp. 6355–6368, 2020. [Google Scholar]
36. L. H. Vogado, R. M. Veras and K. R. Aires, “LeukNet-A model of convolutional neural network for the diagnosis of leukemia,” in Anais Estendidos do XXXIII Conf. on Graphics, Patterns and Images, Bairro Agronomia, Porto Alegre, pp. 119–125, 2020. [Google Scholar]
37. C. Di Ruberto, A. Loddo and G. Puglisi, “Blob detection and deep learning for leukemic blood image analysis,” Applied Sciences, vol. 10, pp. 1–13, 2020. [Google Scholar]
 | This work is licensed under a Creative Commons Attribution 4.0 International License, which permits unrestricted use, distribution, and reproduction in any medium, provided the original work is properly cited. |