DOI:10.32604/cmc.2021.017059
| Computers, Materials & Continua DOI:10.32604/cmc.2021.017059 | |
| Article |
Powering Mobile Networks with Optimal Green Energy for Sustainable Development
1Department of Electrical Engineering, College of Electronics and Information Engineering, Sejong University, Gwangjin-gu, Seoul, 05006, Korea
2Department of Electronics and Communications Engineering, A’Sharqiyah University, Ibra, 400, Oman
3Department of Electrical and Computer Engineering, University of Ottawa, Ottawa, K1N 6N5, ON, Canada
4Department of Electrical and Electronics Engineering, Sri Venkateswara College of Engineering, Sriperumbudur, Chennai, 602117, India
5School of Telecommunication Engineering, Suranaree University of Technology, Nakhon Ratchasima, Thailand
6Prince Sattam Bin Abdulaziz University, College of Computer Engineering and Sciences, Alkharj, 11942, Saudi Arabia
7Department of Mechanical Engineering, College of Engineering, Taif University, Taif, 21944, Saudi Arabia
*Corresponding Author: Peerapong Uthansakul. Email: uthansakul@sut.ac.th
Received: 19 January 2021; Accepted: 15 March 2021
Abstract: Green wireless networking is an emerging area for many societies, especially academia and industry, in light of economic and ecological perspectives. Empowering wireless infrastructures exploiting green power sources can enhance sustainability due to the adverse effects of conventional power sources and atmospheric circumstances. Moreover, the specific power supply requirements for a base station (BS), such as cost effectiveness, efficiency, sustainability, and reliability, can be met by utilizing technological advances in renewable energy. Numerous drivers and motivators are involved in the deployment of renewable energy technologies and the transition toward green energy. Renewable energy is free, clean, and abundant in most locations throughout the year. In this work, a sustainable optimal stand-alone solar-powered model envisioning green cellular BSs for urban locations in Oman is proposed. This model can extend 24 h uninterrupted power supply support to a cellular BS that fully utilizes an integrated storage device. The system analysis is conducted using a hybrid optimization model for electric renewables (HOMER) based on actual prevailing conditions of the regions and their technical feasibility. The results showed can be achieved operational expenditure savings up to 16%. These outcomes provide a huge benefit to the cellular operators of Oman economically, technically, and ecologically.
Keywords: Wireless networks; green wireless networks; green communications; sustainability; OPEX
The energy consumption rate of information and communication technology (ICT) has increased rapidly over the last few decades owing to the excessive demand for multimedia services. Wireless networks are considered one of the main sources of energy consumption in the ICT arena [1]. Among the wireless network components, base stations (BSs) are considered a paramount source of energy consumption, which accounts for 57% of the total energy used [2]. In the last decade, wireless network operators have focused on providing a high data transfer rate with large radio coverage to satisfy the demand of subscribers. Therefore, wireless network operators have largely increased the BS numbers to deliver a high data rate to enormous wireless devices and access point nodes. Consequently, the energy consumption and operational expenditure (OPEX) have notably increased, that is, it has linearly scaled with the augmentation in intensive user requirements [3]. The massive connectivity of IoT devices incorporated with wireless access networks currently leads to tremendous energy consumption; it is expected to increase enormously in the future due to the diverse types of IoT applications [4]. Thus, the primary focus of wireless network operators is to provision a high data rate with attention to energy-efficient issues. Moreover, the increasing concern of wireless network operators on energy consumption is to increase savings in OPEX due to the growing awareness of global warming issues and ecological concerns [5]. Therefore, researchers and experts are endeavoring to apply approaches for diminishing the power consumption, notably for wireless networks while ensuring desired data services.
Researchers are focusing on numerous distinctive approaches to reduce energy consumption into wireless networks, such as energy-efficient hardware components, selective operation of components, efficient use of radio transmission processes, deployment of heterogeneous cells, and implementation of renewable energy resources (RESs) [6]. RESs are considered the most attractive practices in designing energy-efficient wireless networks over the long term in a cost-efficient way in existing infrastructures [7].
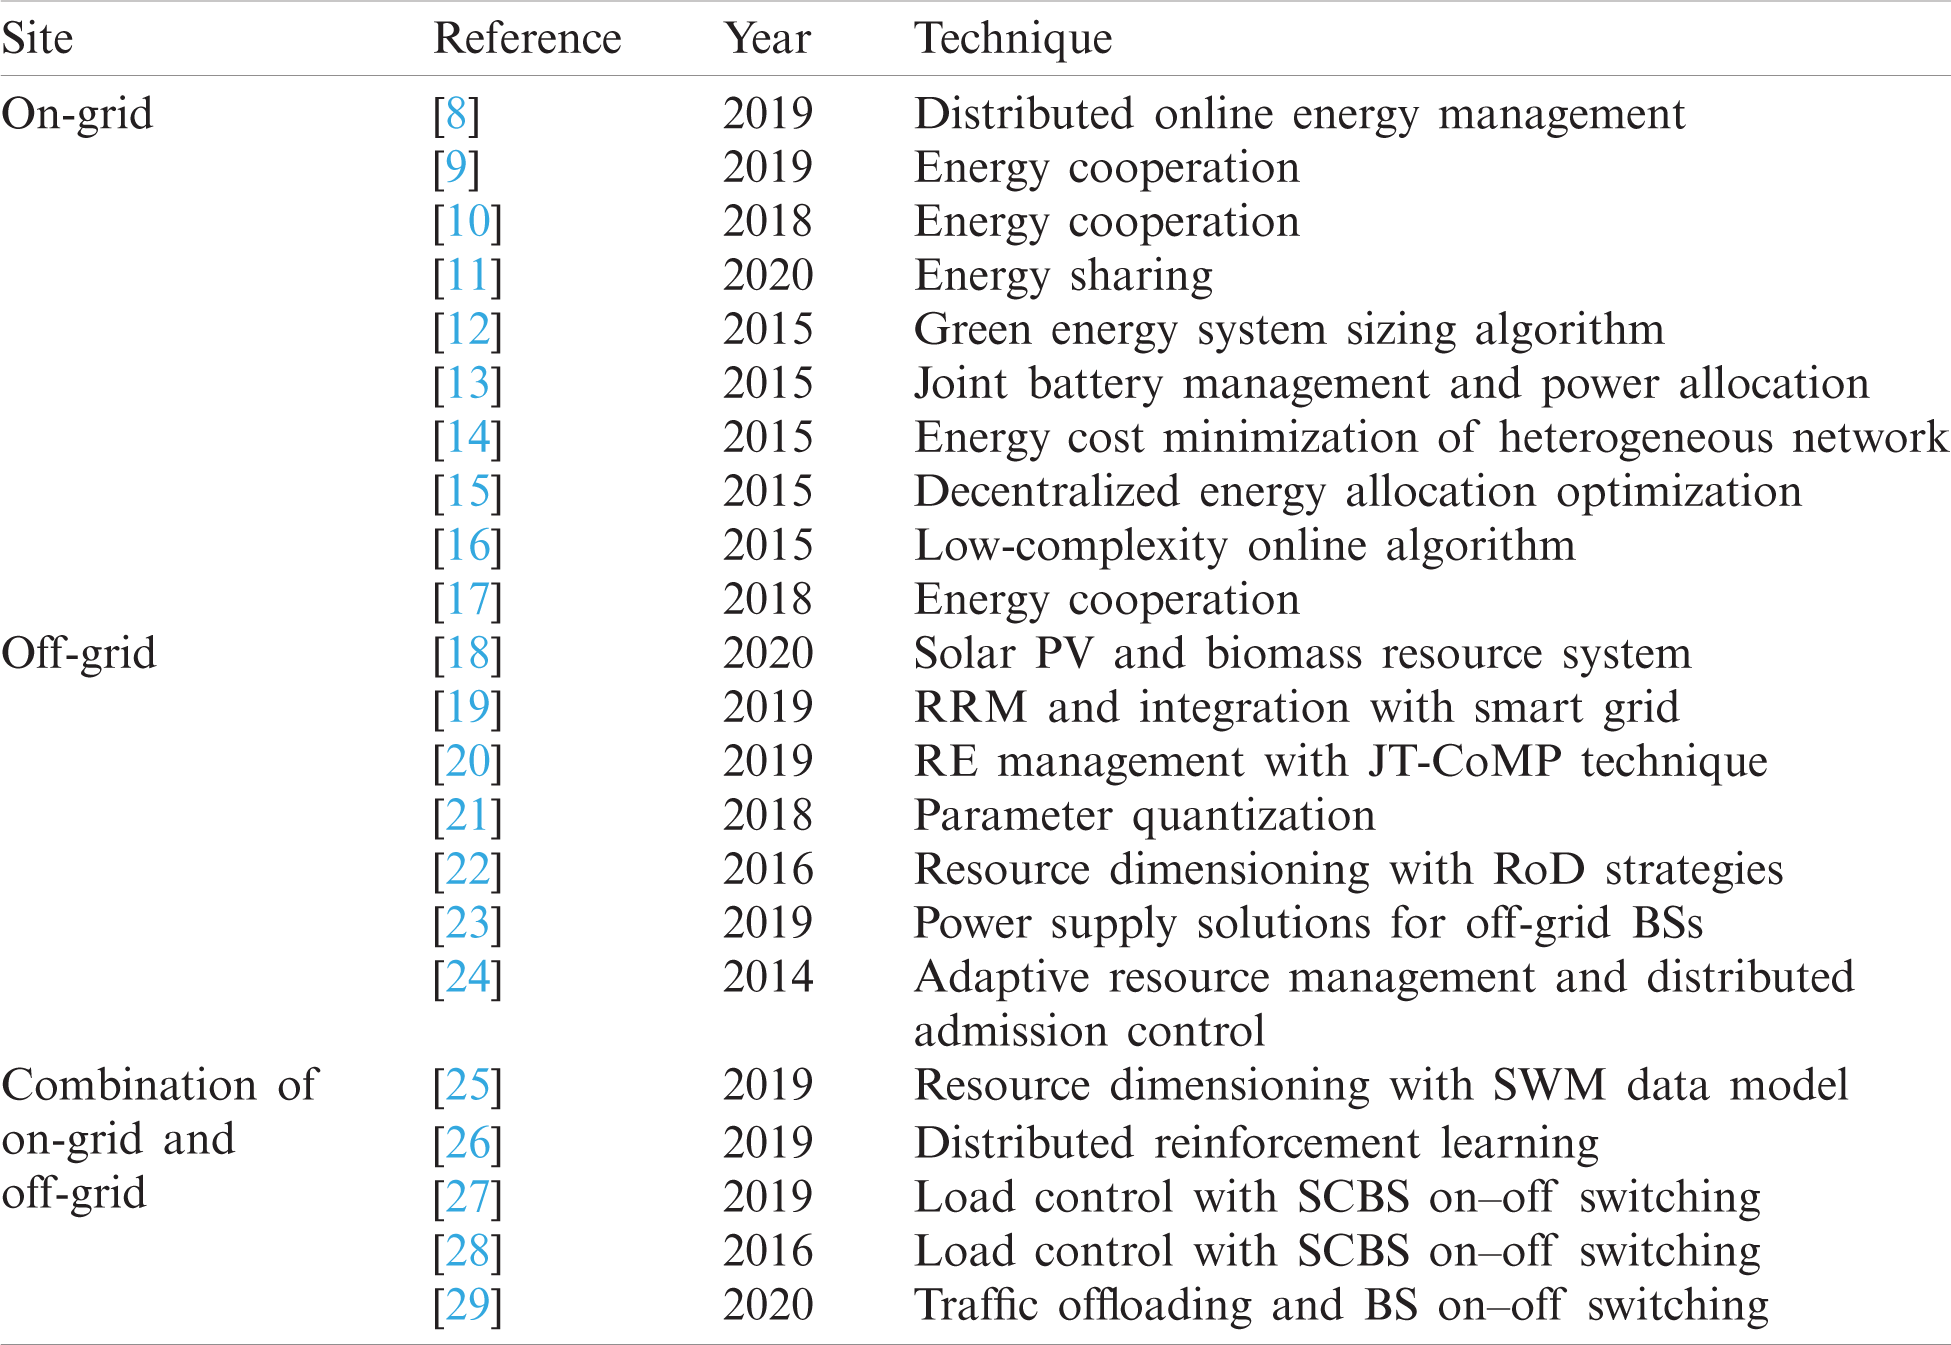
Researchers have suggested a mixture of various RESs or non-RESs with RESs to overcome the limitations of a single technology. For instance, researchers have recommended a combination of an electric grid with RESs or a single RES with adequate battery storage devices to empower access networks in wireless infrastructures. Tab. 1 summarizes the research investigations on renewable energy powered BSs.
The integration of a diesel generator (DG) with an RES can overcome single renewable energy source-related problems. However, fuel transportation is comparatively challenging at several sites that considerably increase the OPEX apart from toxic gas (CO2) emissions. Meanwhile, hybrid utilization of RES with an on-grid is presented to warrant a reliable power supply to the BSs. The optimal conditions, key challenges, and viable solutions are suggested to extract the maximum power from RES to reduce the grid pressure. However, utilization of power from the electric grid, that is, conventional power production such as burning fossil fuels, extensively generates greenhouse gases and increases global warming. Therefore, researchers have recommended the hybridization of various RESs, such as solar PV, wind turbines, and biomass generator-based energy production.
Table 1: Summary of research investigations on renewable energy powered BSs
The desired zone for PV-powered BSs is usually in the mid-latitudes between 30
The implementation of a PV system requires intensive study due to its diverse design and uncertainty of solar parameters, such as the dynamic rate of solar irradiation that extends additional complications due to its intermittent, seasonal, and uncertain nature. To overcome these issues, the HOMER model is used by creating energy balance schemes for every hour of 8,760 h per year. Moreover, it compares the actual load demand for every hour with the generated energy. It also manages the charging and discharging features of the batteries and computes the installation and operating cost for the complete lifespan of the project. Considering all these advantages, HOMER software is adapted in this work to achieve the techno-economic feasibility of solar-driven LTE-BS. The contributions of this work are summarized as follows:
i) To propose and determine the technical benchmarks for an optimal stand-alone solar system that guarantees energy autonomy for the BSs in urban areas of Oman.
ii) To obtain a long-tenure energy balance for cellular networks based on the available solar irradiation in Oman that warrants sustainable green wireless networks.
iii) To examine, analyze, and evaluate the viability of a stand-alone solar system for maximum energy yield and economic savings.
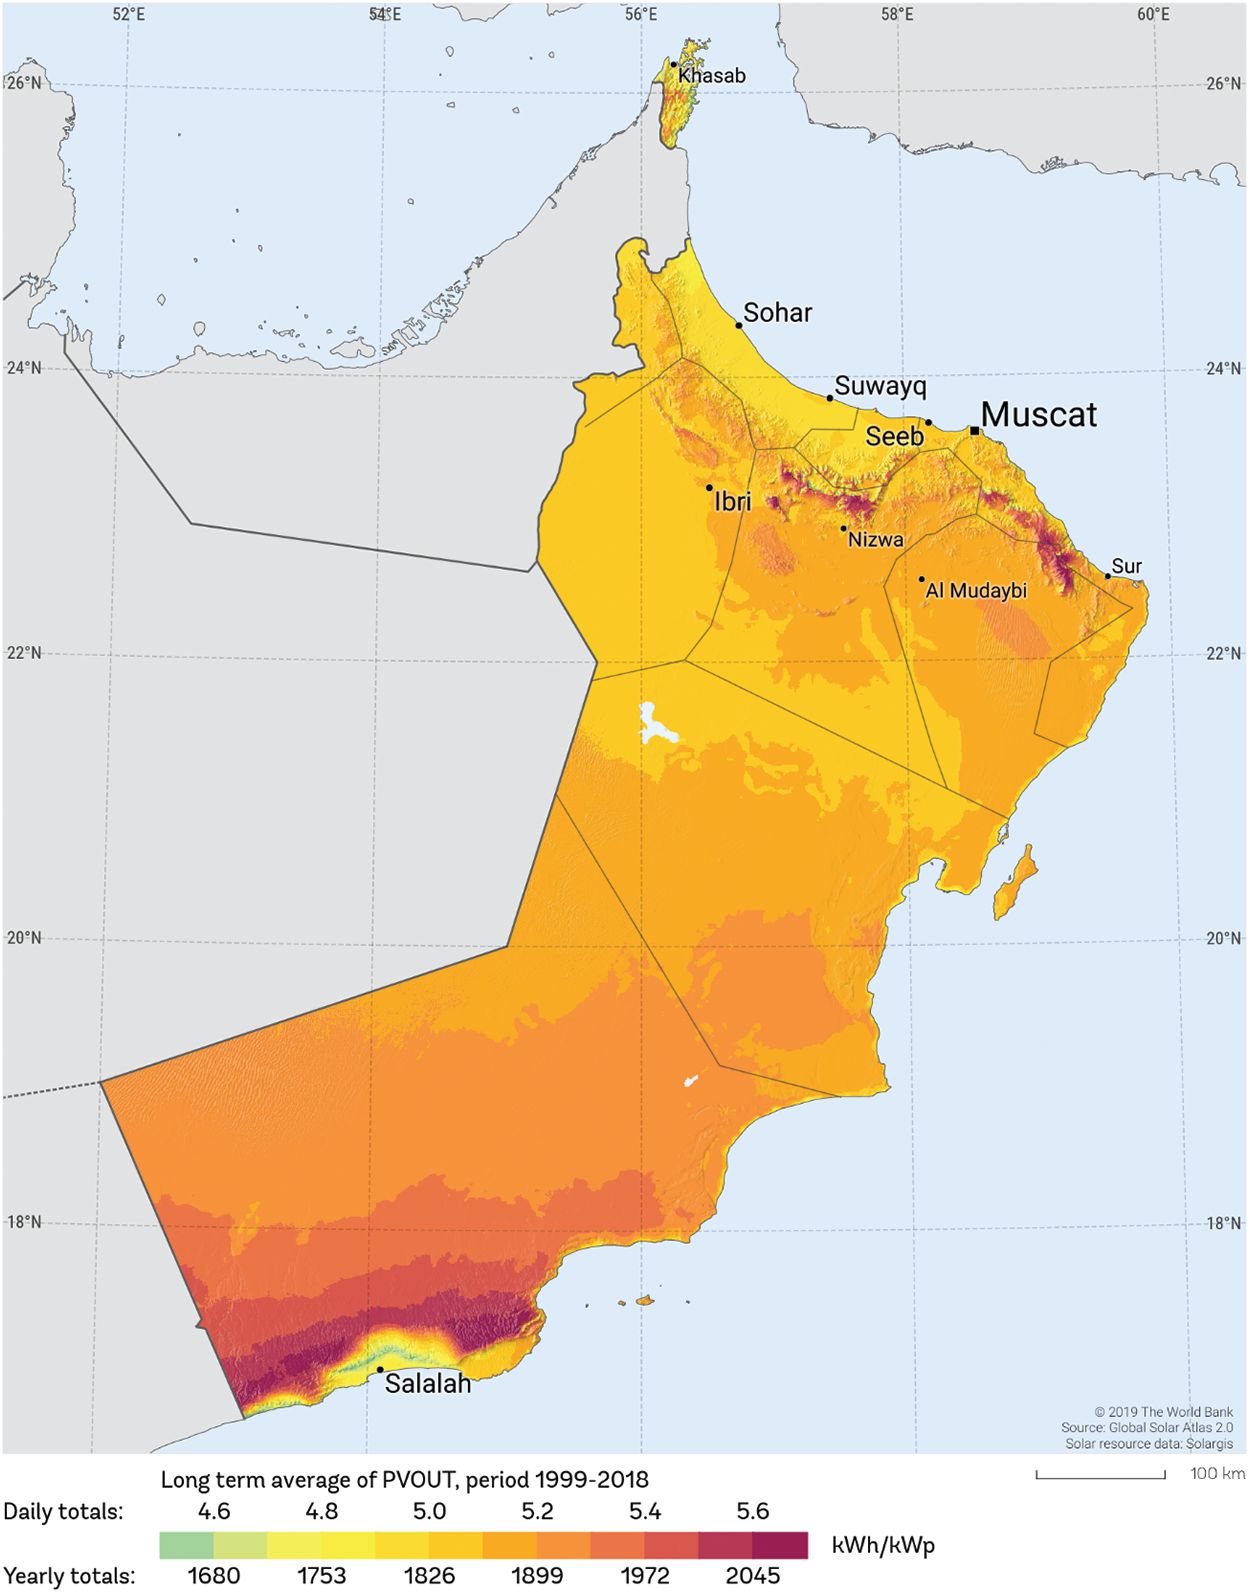
Figure 1: Solar radiation map of Oman
2 Proposed System and Mathematical Modeling
The proposed system comprises three segments, namely, sources, converters, and loads, as demonstrated in Fig. 2.
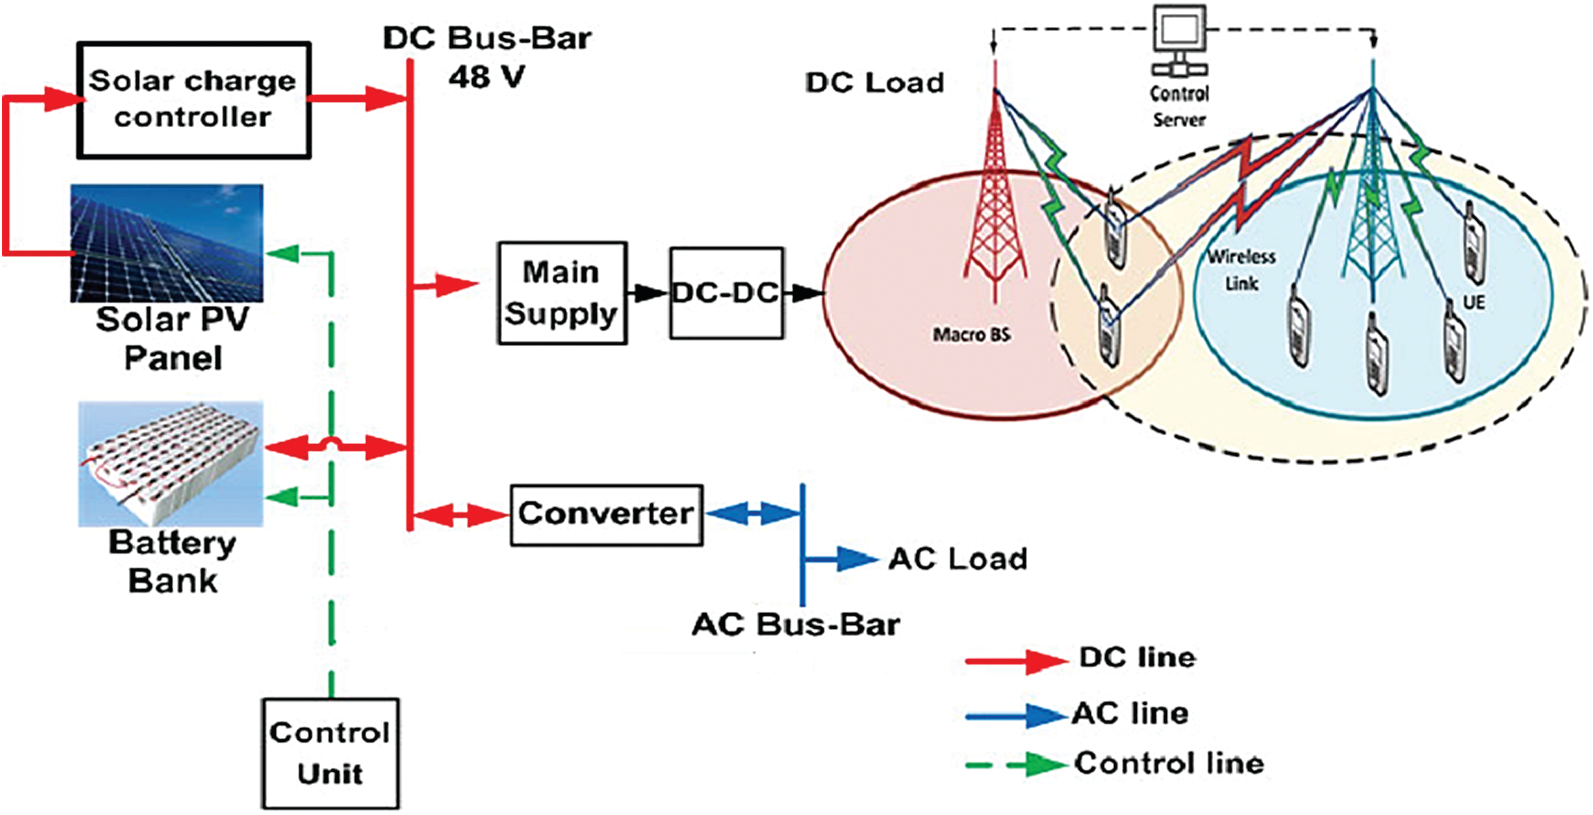
Figure 2: Schematic of the proposed system
The cellular BS consists of various types of equipment that can be used to communicate with mobile/cellular units. The backhaul network has the following subunits: (i) multiple transceivers (TRXs), (ii) power amplifier (PA), (iii) radio frequency (RF), (iv) baseband (BB), (v) DC–DC power supply, and (vi) cooling systems. The TRXs comprise PA, which amplifies the signal power coming from the BB unit. The BB is adapted for internal processing and coding. A detailed of discussion in [2].
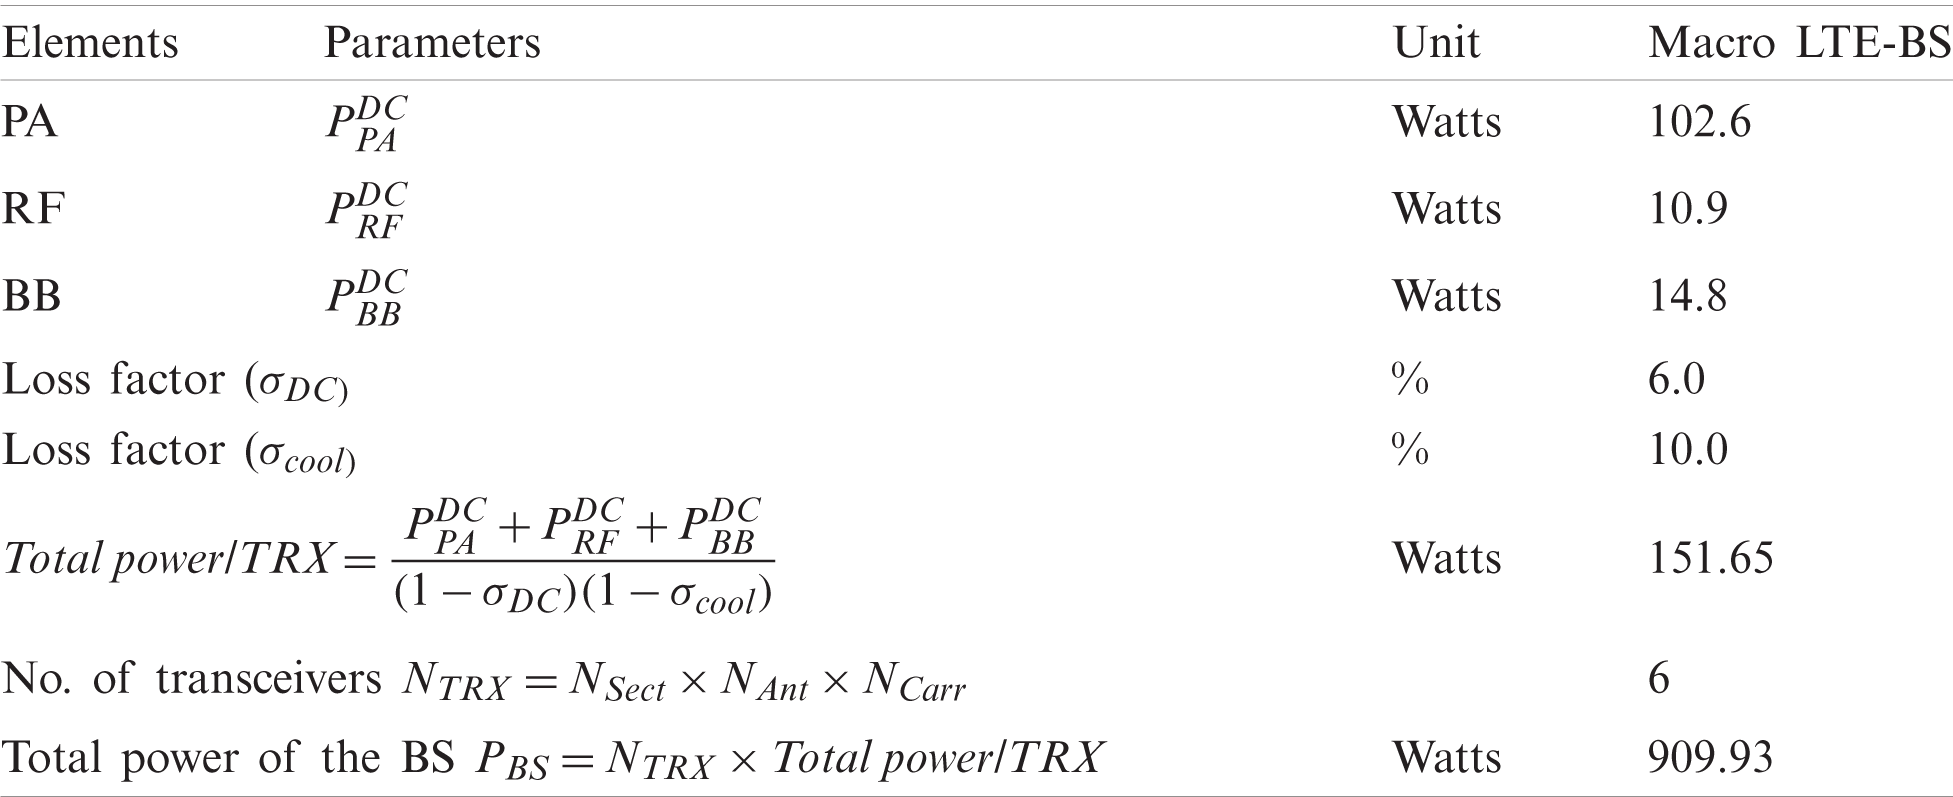
A macro BS subsystem has three sectors with two antennas based on the component level [31]. The net power consumption by the BS is derived through the following equation [31]:
where NTRX denotes the number of transmitting/receiving antennas for individual sites, that is, transceivers;
Tab. 2 presents the power consumption scale of the macro BS system with a
Table 2: Power consumption scale of different hardware elements at bandwidth equal to 10 MHz [31]
This system comprises several types of equipment that effectively generate green energy for a complete BS. It also saves energy and allows ease of dismantling for recycling.
Each panel consists of numerous solar cells that are connected in series and parallel to form a solar module or PV arrangement. The panel generates DC electric power through the absorption of shortwave irradiance. The total annual energy extraction from the PV arrangement (EPV) is derived as [32]
where PCPV is the size of the PV and PSH denotes the peak solar hour. DFPV is a derating factor of the PV array, which considers the effect of dust and other losses.
A solar power-driven macro LTE-BS consists of a battery bank that is allowed to charge during a sunny period with the excess power generated by the PV arrays. The BESS capacity of the BS merely depends on the depth of discharge (DOD) and must be evaluated before commissioning [33]
where SOCmin denotes the minimum state of charge (SOC). In this work, the Trojan L16P battery model is considered because the DOD of this battery is 70%, that is, it can effectively deliver 70% of its energy with 30% of its energy reserved. The computation of days of autonomy (Abatt) is essential to determine the performance of fully charged batteries. It is derived as [33]
where the terms Nbatt and
The lifetime of the battery plays a crucial role. The lifetime of a battery can be predicted based on the operating conditions. Specifically, the DOD during each diurnal charge–discharge cycle plays a foremost role in the battery lifetime. It can be computed as [34]
where the term Qlifetime represents the lifetime throughput of a single battery, Qthrpt denotes the annual battery throughput, and the term Rbattf is the battery float life in years.
The total capacity of the inverter (Cinv) is calculated as [35]
where the term LAC represents the available maximum AC load;
The configuration of a solar-powered BS is based on the following considerations: (i) the essential components that must be involved in the system design, (ii) the number of components that must be adopted, and (iii) the size of each element. The HOMER micropower optimization tool aids are used to obtain an optimal system with low net present cost (NPC). The term NPC contains all incurred expenses and incomes throughout the project lifetime. The total annualized cost (CTAC) exemplifies the annual price of the complete scheme in $/year that contains the initial capital (IC) costs (
The NPC (CNPC) can also be described for annualized values and can be derived as
The term CRF denotes the recovery factor, which converts a CNPC into a flow of equal annual costs over a definite period. It can be calculated based on the annual interest rate (i) and project lifespan (N), and it is computed using the following equation [34]:
The total NPC value is notably reduced due to the salvage value (S), which can be computed using the following equation:
where Rcomp defines the lifespan and Rrem denotes the remaining lifespan of the component in years; and the term Crep is the replacement rate.
This study scrutinizes to minimize the total cost of NPC based on various constraints. To attain system optimization, the objective function of the NPC can be derived using Eq. (8) and formulated as
The above-derived objective function is subjected to the following constraints:
To warrant a power balance between actual demand and energy production, the power production of the sources (EPV and EBattery) must meet the demand of the BS (EBS) plus losses (ELosses).
The simulation consists of three major parts: inputs, optimization, and outputs. The simulation configuration details are given in Tab. 3. In addition, solar irradiance for the various urban cities of Oman that are considered in this study is given in Fig. 3.
Table 3: Simulation configuration
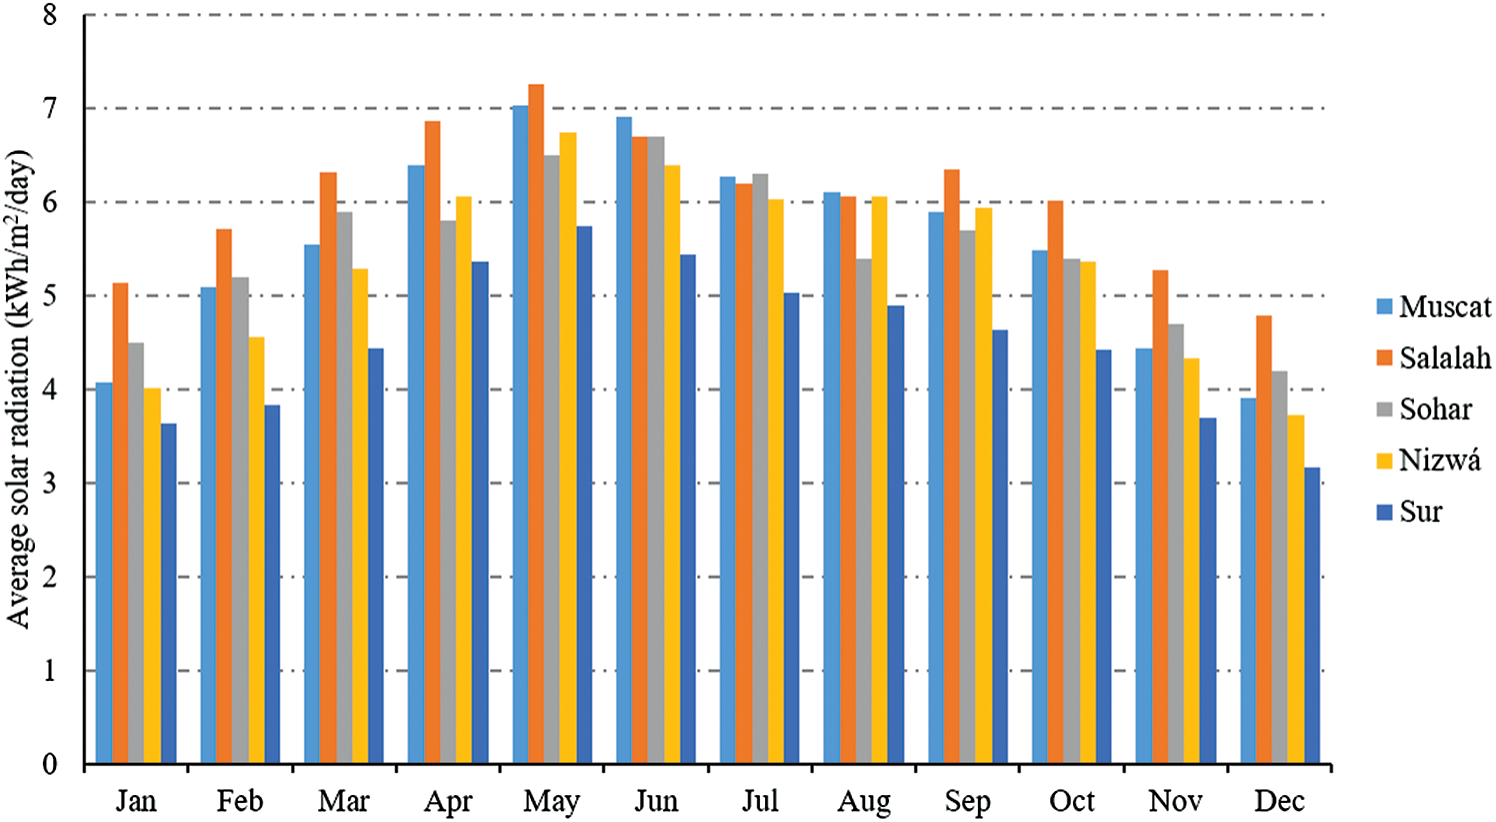
Figure 3: Solar irradiance for the various urban cities of Oman (monthly average) [30]
A sustainable optimal solar system envisioning green cellular BSs for urban cities of Oman is considered. This model can extend 24 h uninterrupted power supply support to the cellular BSs that fully utilize the integrated storage device. The details are given as follows.
Tab. 4 provides a brief comparison summary of the optimal system and NPC for green cellular BSs for urban cities of Oman.
Table 4: Optimal system and NPC of the proposed system
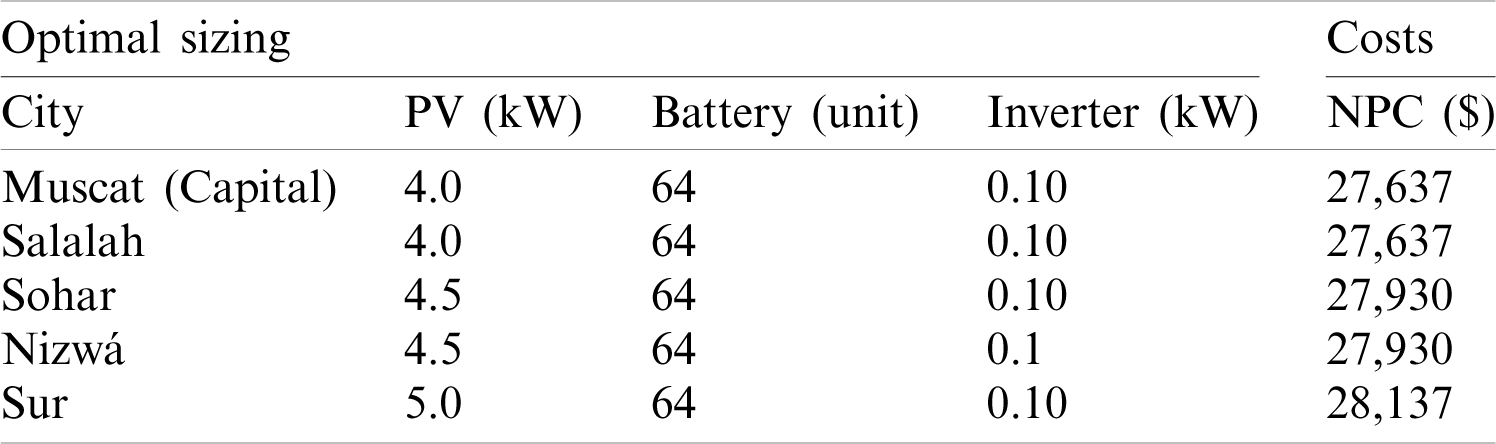
As observed, the system architecture for some cities is the same size because the solar radiation rate in these cities is nearly the same. However, the energy contribution from the PV array differs from these cities due to the difference in the slight solar radiation. The contribution of energy from the PV increases with the increase in radiation rate. Details of this trend will be given in Subsection 5.2 “Energy analysis.”
NPC is proportional to the size of the components of the solar system. Thus, a large part of the cost goes to the BESS. Meanwhile, the NPC decreases when the size of the PV array decreases, that is, when the solar radiation increases. Additional details will be provided in Subsection 5.3 “Economic analysis.”
Fig. 4 summarizes the PV array size and annual energy contribution to various cities. Higher solar radiation rates correspond to higher annual energy contributions for the same PV array size. Fig. 5 shows the annual energy input and output of the battery bank/BESS for the various cities. However, a detailed discussion and analysis of the energy yield will be given for Muscat city, which is the capital and largest city with a higher population. However, the investigation can be extended to include other metropolitan cities with small variances in solar irradiation.
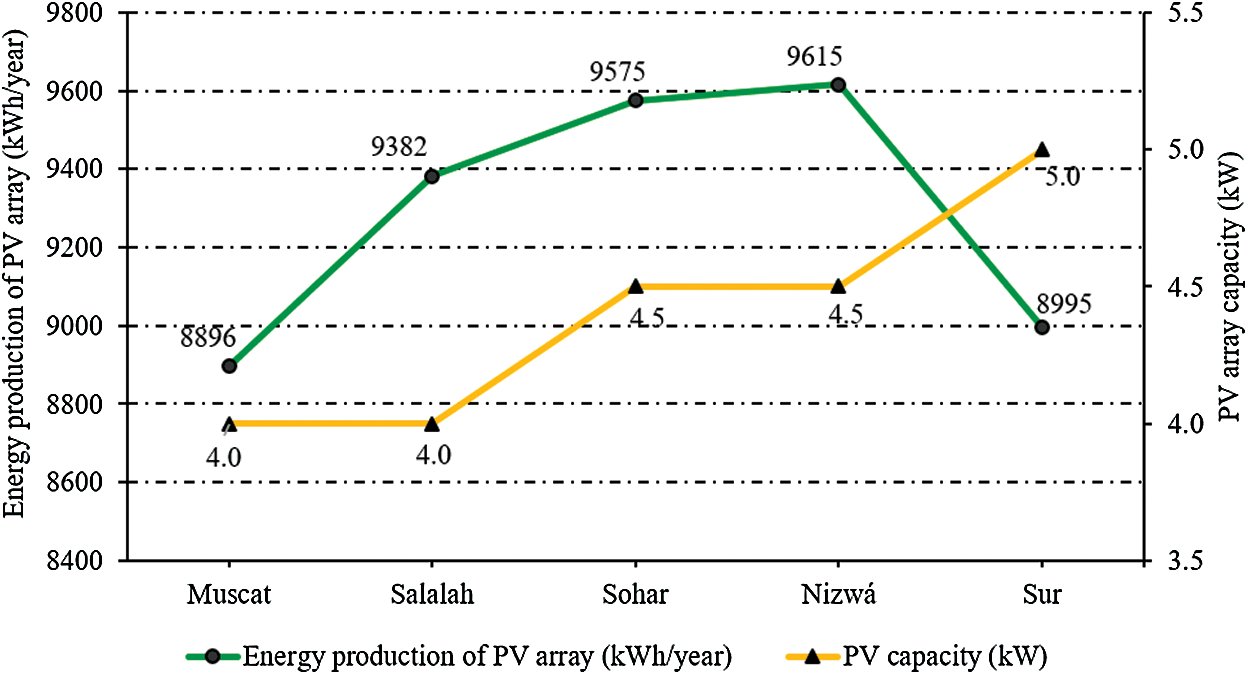
Figure 4: PV array size and annual energy contribution
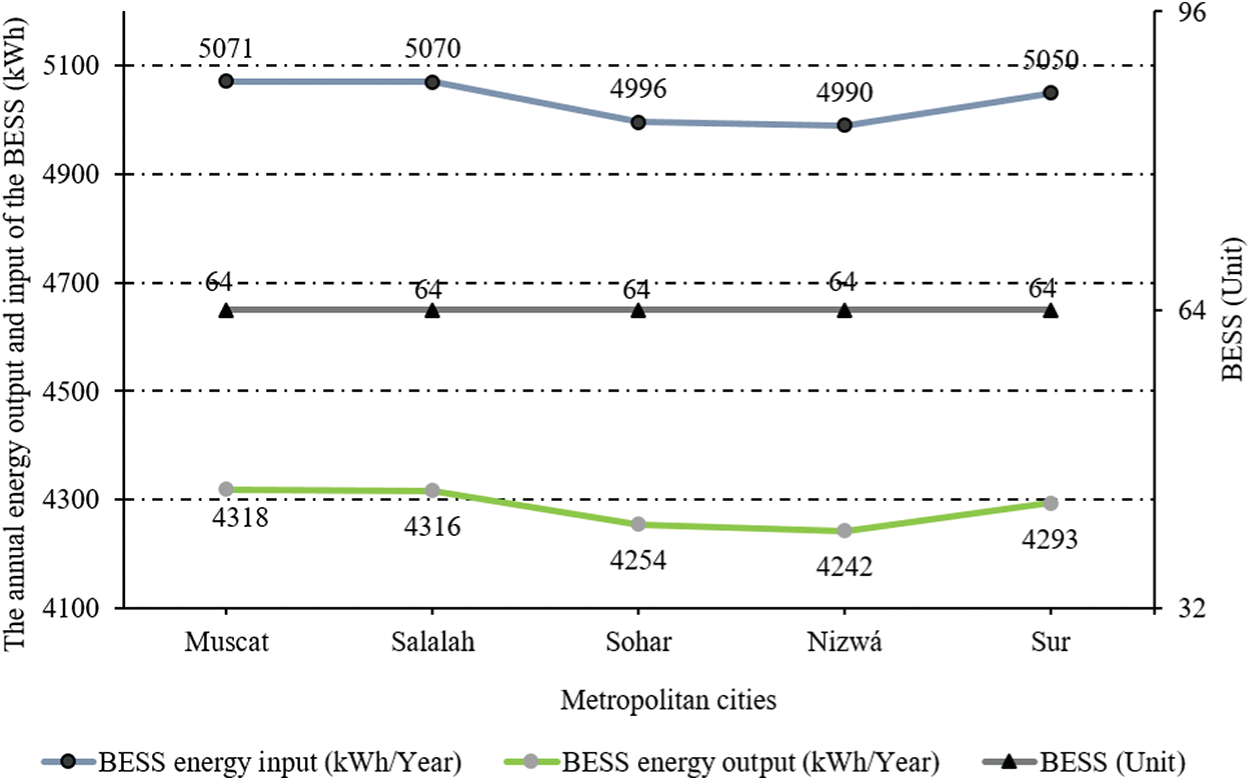
Figure 5: BESS units and annual energy input/output
The annual energy contribution of the PV array for Muscat is calculated based on Eq. (2); the PV peak capacity
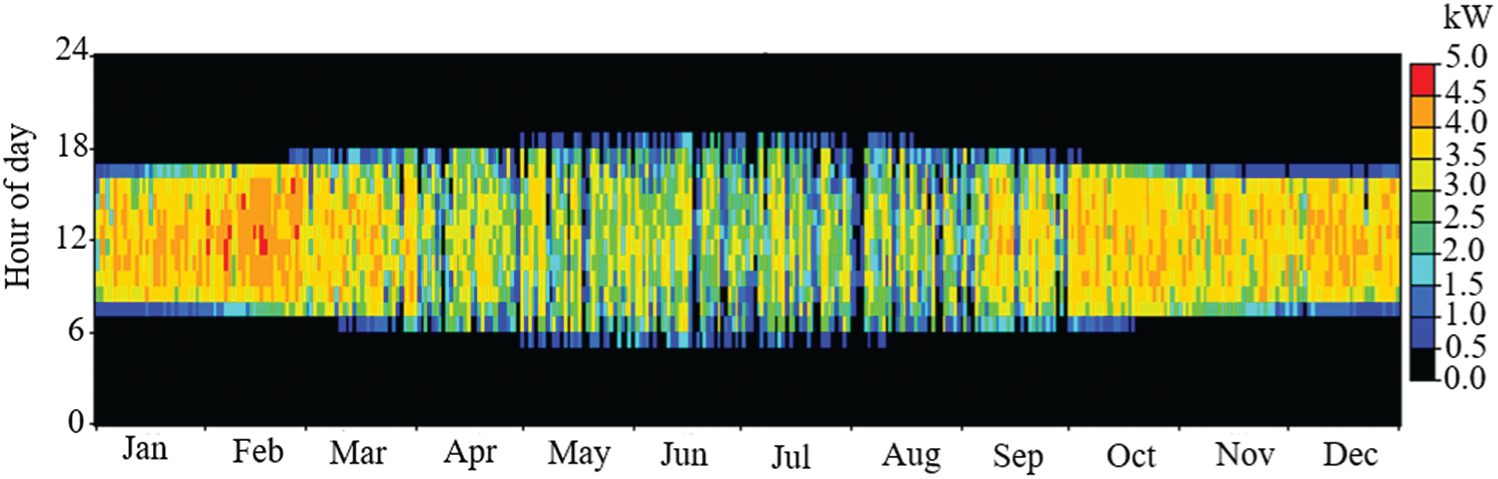
Figure 6: Average PV output power (monthly)
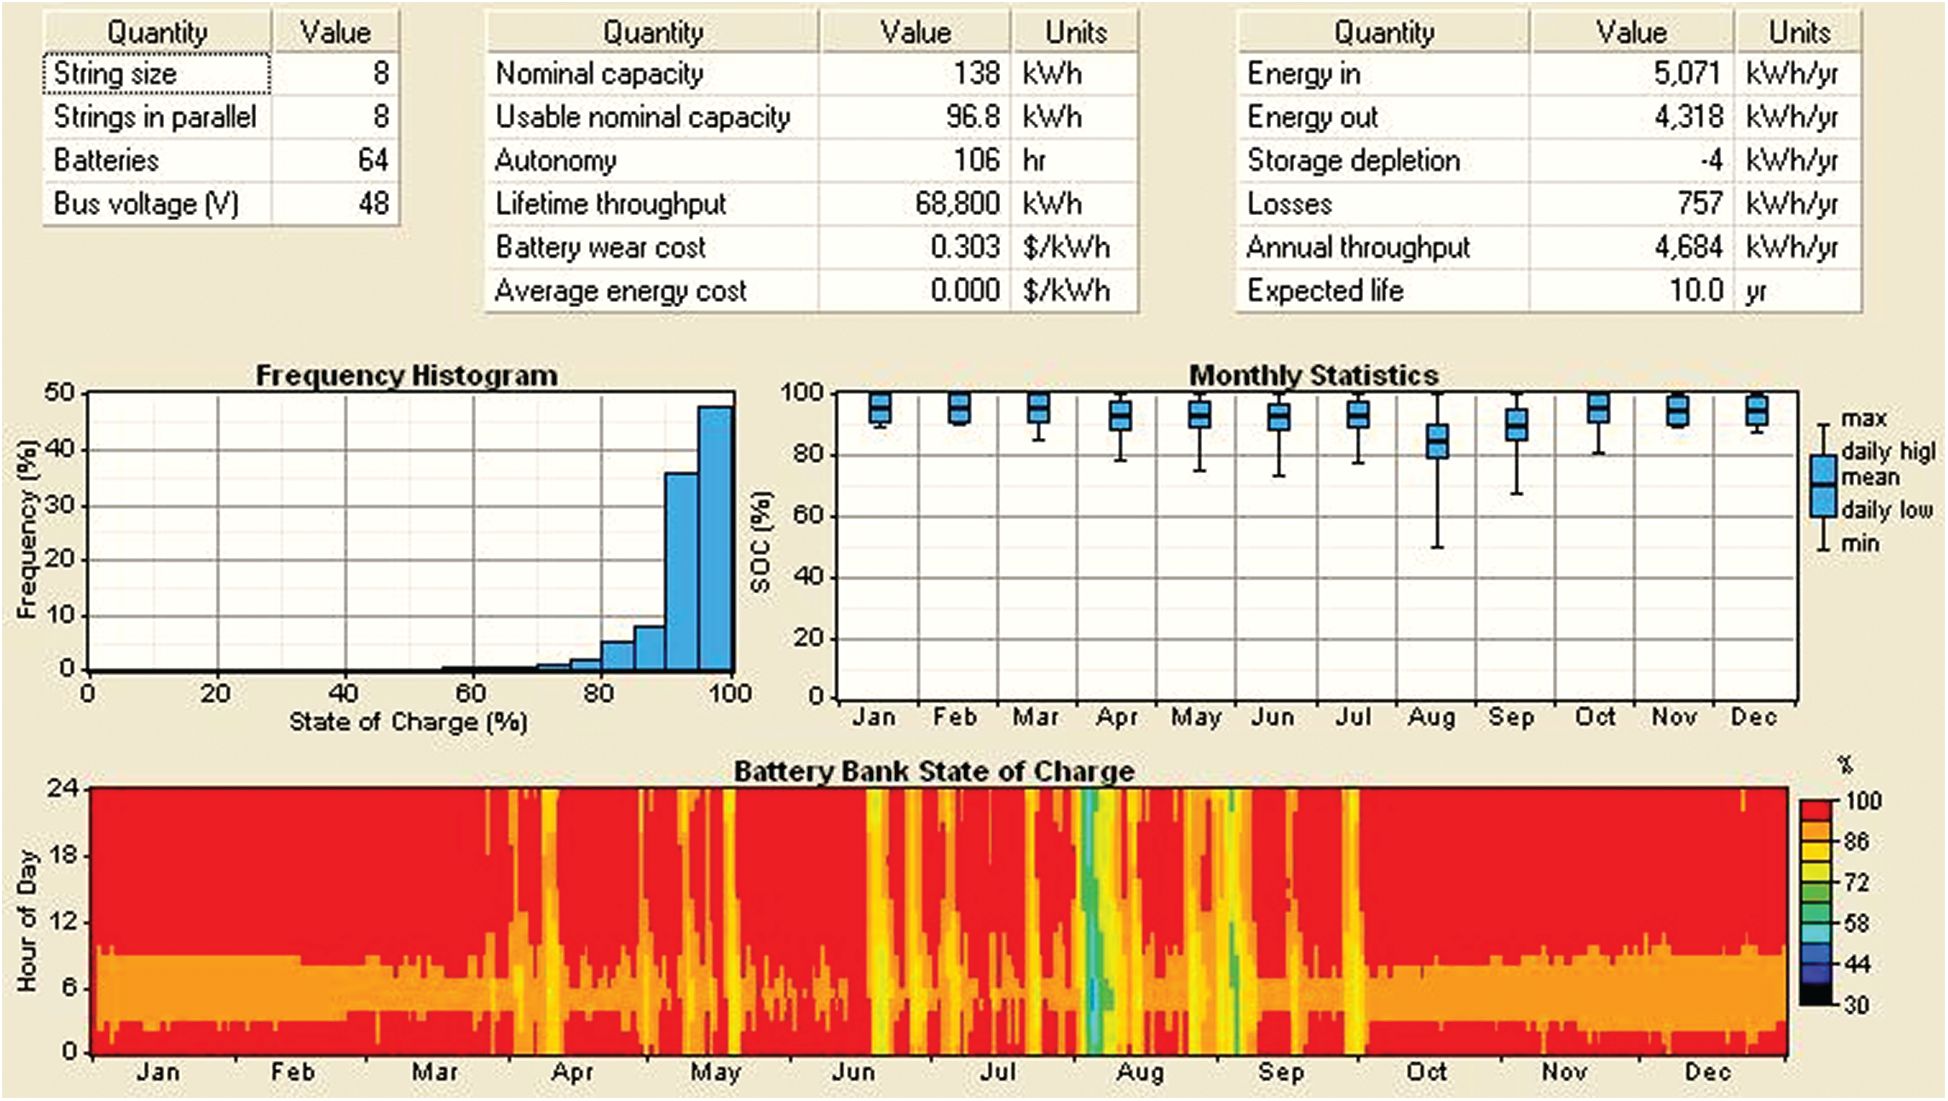
Figure 7: Summary of the BESS
The ratios of annual energy output and input of BESS are 5071 and 4318 kWh, respectively. Moreover, the BESS supplies the power to the load for nearly 106 h, specifically during the malfunction of the PV array. Fig. 7 summarizes the BESS results. The seasonal statistics show that the maximum energy contribution of the BESS is in August, while the minimum energy contribution is in February. The frequency histogram of the SOC shows that the SOC stretches to 46%.
The average hourly energy generation of the PV, BESS, and excess electricity for 12 months is presented in Fig. 8. The lowest rate of energy contribution from the PV array is observed at the end of July and the first of August; therefore, the higher rate of energy contribution from BESS is in the same period.
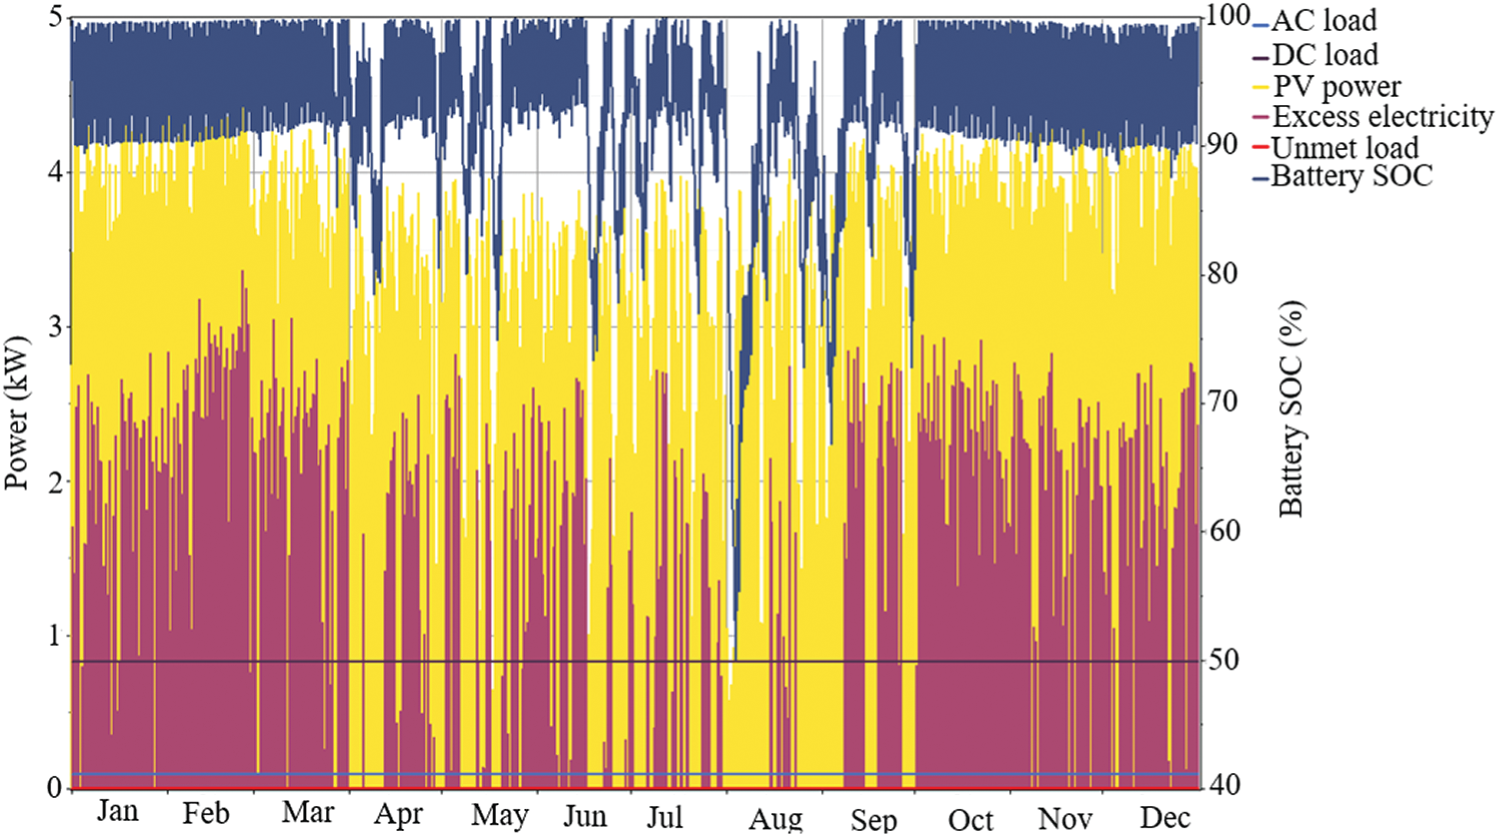
Figure 8: Average hourly energy generation of the PV, BESS, and excess electricity
The net capacity of the inverter unit is 0.1 kW. The efficiency of the inverter unit is computed between the input (837 kWh) and output energy (795 kWh) annually and observed at 95%. The total operating hours are 8,759 h/year (
Fig. 9 summarizes the total cash flow of the proposed solar system for the different urban cities. For costs, the IC cost of a solar system for some cities is fixed because the optimal system size is the same. For O&M cost, most of this cost goes toward BESS. Tab. 4 indicates that the operating cost decreases in cities that have increasing solar radiation because the PV array size decreases, which reduces the total O&M cost of the solar system. The NPC represents all costs that occur within the project lifetime. The following discussion and analysis will be given based on the capital city (Muscat). However, this investigation can also be extended to other schemes where the system cost depends on the individual component size.
The size of the system is directly proportional to the IC cost invested during the commencement of the scheme. The total IC cost of the proposed scheme is $23,240, and its breakdown is detailed as follows:
a) For solar PV arrays (i.e., 4.0 kW
b) For BESS arrangements (64
c) For inverter (0.1 kW
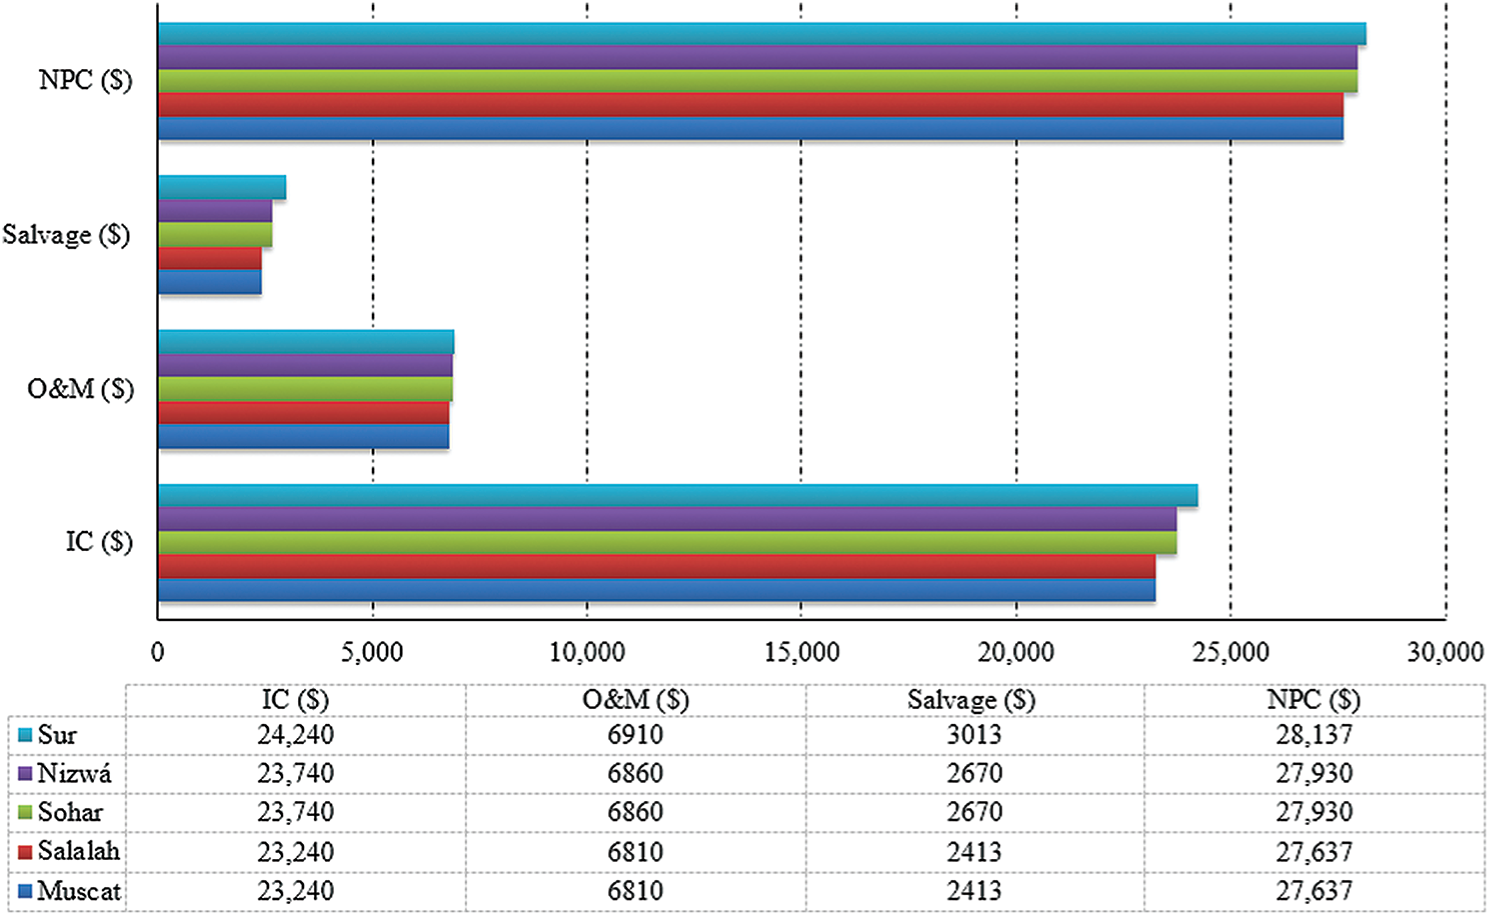
Figure 9: Summary of the total cash flow of the proposed solar system for the different urban cities
The O&M costs of the solar system are considered to be $6810, and its breakdown is detailed as follows:
a) For solar PV arrays (i.e., 4.0 kW
b) For BESS arrangements (64
c) For inverter (0.1 kW
The lifespans of the BESS, PV arrays, and inverter are 10, 25, and 15 years, respectively, due to the short operational lifespan of the project (10 years). No replacement costs are incurred.
The salvage value of each component at the end of the project lifespan has to be considered. With the help of Eq. (10), the salvage value of the PV array is computed and found to be $2400, which is the highest value among those of other components. The salvage value of the inverter is estimated at $13. Therefore, the total salvage value at the end of the venture lifespan is $2413.
The net NPC is $27,637, that is, $23,240
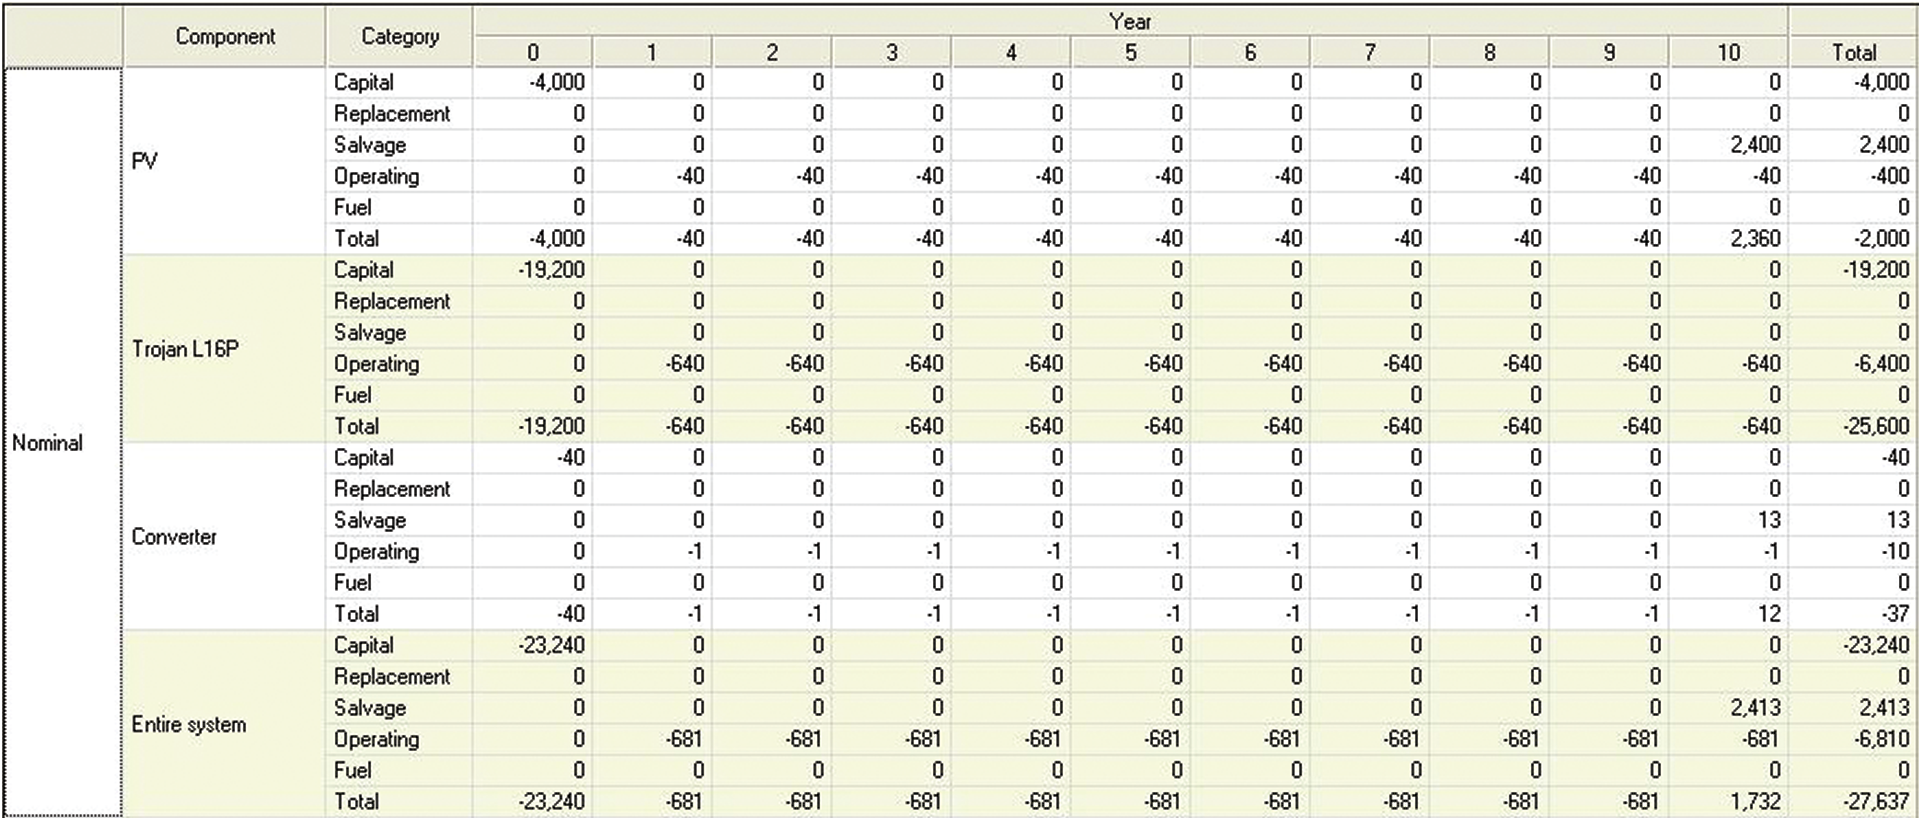
Figure 10: Average PV, battery bank, and excess electricity output (hourly)
5.4 Economic Feasibility of the Proposed Solar System
The rating of DG should be approximately 3.5 kW, which can be computed between the ratio of maximum BS and 30% DG
i) The IC is computed by multiplying the system size (3.5 kW) by its cost ($660/kW).
ii) The O&M cost (annual) of the DG is approximately $2,366 (excluding fuel transportation cost). A breakdown of this cost is described as
➢ The net maintenance cost of DG is $438/year, which is estimated using the product of a DG maintenance $0.05/h and the annual operating hours (8,760 h).
➢ The total fuel cost is computed using the product of diesel price ($0.54/L) and total diesel consumption (3,569 L/year) and found to be $1,928. It is calculated based on specific fuel consumption
Every 3 years, the DG needs to be replaced, that is, a minimum of three (3) times during the lifespan of the project. Therefore, the net DG replacement cost is equal to $6,930, that is,
When the proposed solar system is applied, OPEX savings between 14.5% and 16.0% can be achieved compared with a conventional power source (DG). Fig. 11 summarizes the OPEX savings.
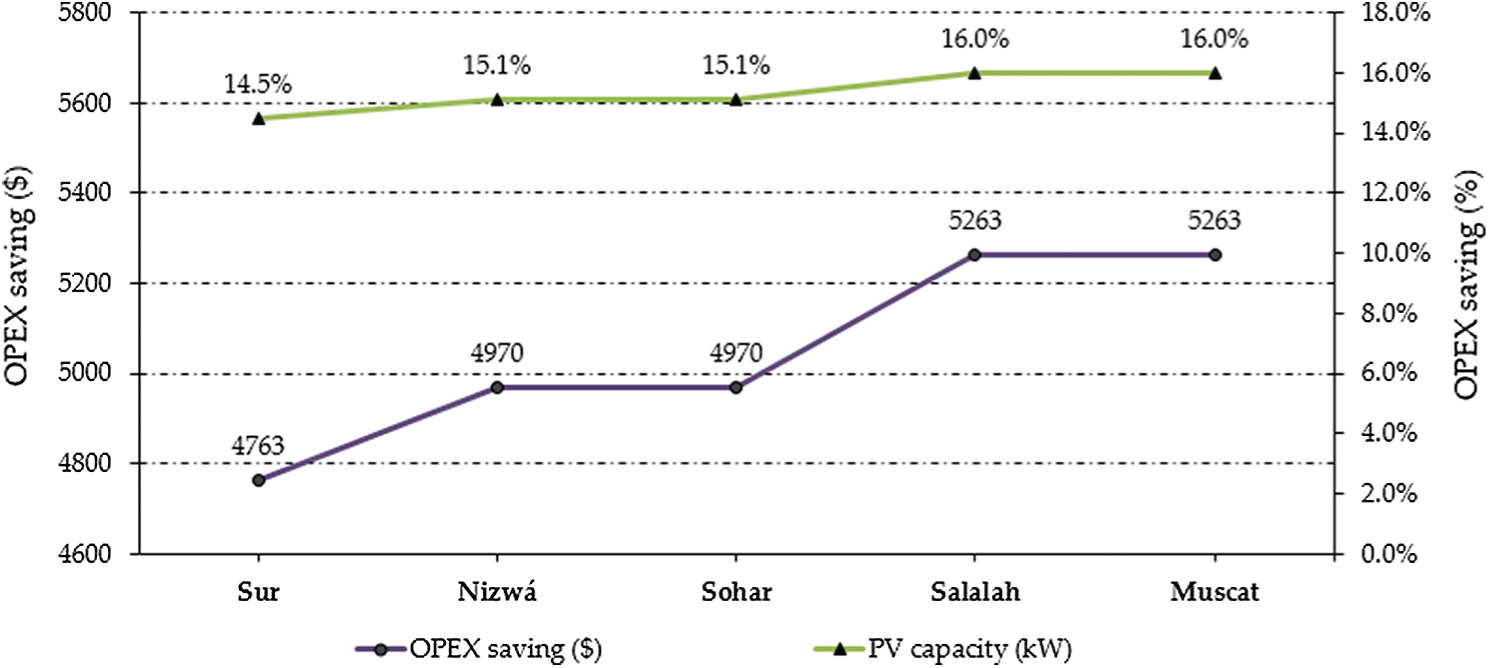
Figure 11: Summary of the total OPEX savings of the proposed solar system
This work proposed a framework for an energy-efficient RES-based cellular network for urban cities of Oman using a PV module that acts as the main and stand-alone source for the BSs to minimize the OPEX. The simulation results revealed that the proposed solar system can potentially meet the total demand of macro BS. Moreover, the BESS can supply power to the macro BS load autonomy for 106 h to fix the solar array in the case of malfunctions. Regarding the economic aspect, OPEX savings are in the range of 14.5% and 16.0%. These outcomes indicate a huge benefit to the cellular operators of Oman economically, technically, and ecologically.
Funding Statement: This research was supported by SUT Research and Development Fund. This work was also supported by the Deanship of Scientific Research at Prince Sattam bin Abdulaziz University, Saudi Arabia. In addition, support by the Taif University Researchers Supporting Project number (TURSP-2020/77), Taif University, Taif, Saudi Arabia.
Conflicts of Interest: The authors declare that they have no conflicts of interest to report regarding the present study.
1. A. Srivastava, M. Gupta and G. Kaur, “Energy efficient transmission trends towards future green cognitive radio networks (5GProgress, taxonomy and open challenges,” Journal of Network and Computer Applications, vol. 168, no. 2, pp. 102760–102775, 2020. [Google Scholar]
2. M. H. Alsharif, J. Kim and J. H. Kim, “Green and sustainable cellular base stations: An overview and future research directions,” Energies, vol. 10, no. 5, pp. 587–607, 2017. [Google Scholar]
3. M. Aloqaily, A. Boukerche, O. Bouachir, F. Khalid and S. Jangsher, “An energy trade framework using smart contracts: Overview and challenges,” IEEE Network, vol. 34, no. 4, pp. 119–125, 2020. [Google Scholar]
4. S. Nižetić, P. Šolić and L. Patrono, “Internet of things (IoTOpportunities, issues and challenges towards a smart and sustainable future,” Journal of Cleaner Production, vol. 274, no. 3, pp. 122877–122892, 2020. [Google Scholar]
5. S. Lange, J. Pohl and T. Santarius, “Digitalization and energy consumption. Does ICT reduce energy demand?,” Ecological Economics, vol. 176, no. 2, pp. 106760–106775, 2020. [Google Scholar]
6. S. Hu, X. Chen, W. Ni, X. Wang and E. Hossain, “Modeling and analysis of energy harvesting and smart grid-powered wireless communication networks: A contemporary survey,” IEEE Transactions on Green Communications and Networking, vol. 4, no. 2, pp. 461–496, 2020. [Google Scholar]
7. D. K. Sah and T. Amgoth, “Renewable energy harvesting schemes in wireless sensor networks: A survey,” Information Fusion, vol. 63, no. 3, pp. 223–247, 2020. [Google Scholar]
8. P. Du, L. Ran, D. Zhai, R. Ren and Q. Zeng, “ADMM-based distributed online algorithm for energy management in hybrid energy powered cellular networks,” IEEE Access, vol. 7, no. 3, pp. 83343–83353, 2019. [Google Scholar]
9. F. Ahmed, M. Naeem, W. Ejaz, M. Iqbal and A. Anpalagan, “Renewable energy assisted sustainable and environment friendly energy cooperation in cellular networks,” Wireless Personal Communications, vol. 108, no. 2, pp. 2585–2607, 2019. [Google Scholar]
10. D. Renga, H. A. H. Hassan, M. Meo and L. Nuaymi, “Energy management and base station on/off switching in green mobile networks for offering ancillary services,” IEEE Transactions on Green Communications and Networking, vol. 2, no. 3, pp. 868–880, 2018. [Google Scholar]
11. M. Hossain, K. Z. Islam, A. Jahid, K. M. Rahman, S. Ahmed et al., “Renewable energy-aware sustainable cellular networks with load balancing and energy-sharing technique,” Sustainability, vol. 12, no. 22, pp. 9340, 2020. [Google Scholar]
12. T. Han and N. Ansari, “Provisioning green energy for base stations in heterogeneous networks,” IEEE Transactions on Vehicular Technology, vol. 65, no. 7, pp. 5439–5448, 2015. [Google Scholar]
13. J. Peng, P. Hong and K. Xue, “Optimal power management under delay constraint in cellular networks with hybrid energy sources,” Computer Networks, vol. 78, no. 4, pp. 107–118, 2015. [Google Scholar]
14. C. Liu and B. Natarajan, “Power management in heterogeneous networks with energy harvesting base stations,” Physical Communication, vol. 16, no. 2, pp. 14–24, 2015. [Google Scholar]
15. D. Li, W. Saad, I. Guvenc and F. Adachi, “Decentralized energy allocation for wireless networks with renewable energy powered base stations,” IEEE Transactions on Communications, vol. 63, no. 6, pp. 2126–2142, 2015. [Google Scholar]
16. Y. Mao, J. Zhang and K. B. Letaief, “A Lyapunov optimization approach for green cellular networks with hybrid energy supplies,” IEEE Journal on Selected Areas in Communications, vol. 33, no. 12, pp. 2463–2477, 2015. [Google Scholar]
17. A. Jahid, M. K. H. Monju, M. E. Hossain and M. F. Hossain, “Renewable energy assisted cost aware sustainable off-grid base stations with energy cooperation,” IEEE Access, vol. 6, no. 1, pp. 60900–60920, 2018. [Google Scholar]
18. M. S. Hossain, A. Jahid, K. Z. Islam and M. F. Rahman, “Solar PV and biomass resources-based sustainable energy supply for off-grid cellular base stations,” IEEE Access, vol. 8, no. 2, pp. 53817–53840, 2020. [Google Scholar]
19. H. A. H. Hassan, D. Renga, M. Meo and L. Nuaymi, “A novel energy model for renewable energy-enabled cellular networks providing ancillary services to the smart grid,” IEEE Transactions on Green Communications and Networking, vol. 3, no. 2, pp. 381–396, 2019. [Google Scholar]
20. A. Jahid, M. S. Islam, M. S. Hossain, M. E. Hossain and M. F. Hossain, “Toward energy efficiency aware renewable energy management in green cellular networks with joint coordination,” IEEE Access, vol. 7, no. 3, pp. 75782–75797, 2019. [Google Scholar]
21. A. da Silva, D. Renga, M. Meo and M. A. Marsan, “The impact of quantization on the design of solar power systems for cellular base stations,” IEEE Transactions on Green Communications and Networking, vol. 2, no. 1, pp. 260–274, 2017. [Google Scholar]
22. M. Dalmasso, M. Meo and D. Renga, “Radio resource management for improving energy self-sufficiency of green mobile networks,” ACM SIGMETRICS Performance Evaluation Review, vol. 44, no. 2, pp. 82–87, 2016. [Google Scholar]
23. A. Jahid, K. H. Monju, S. Hossain and F. Hossain, “Hybrid power supply solutions for off-grid green wireless networks,” International Journal of Green Energy, vol. 16, no. 1, pp. 12–33, 2019. [Google Scholar]
24. L. Cai, Y. Liu, T. H. Luan, X. S. Shen, J. W. Mark et al., “Sustainability analysis and resource management for wireless mesh networks with renewable energy supplies,” IEEE Journal on Selected Areas in Communications, vol. 32, no. 2, pp. 345–355, 2014. [Google Scholar]
25. Á. F. Gambín, M. Scalabrin and M. Rossi, “Online power management strategies for energy harvesting mobile networks,” IEEE Transactions on Green Communications and Networking, vol. 3, no. 3, pp. 721–738, 2019. [Google Scholar]
26. D. Temesgene and P. Dini, “Dynamic control of functional splits for energy harvesting virtual small cells: A distributed reinforcement learning approach,” Computer Communications, vol. 148, no. 3, pp. 48–61, 2019. [Google Scholar]
27. M. Miozzo and P. Dini, “Coordinated load control of renewable powered small base stations through layered learning,” IEEE Transactions on Green Communications and Networking, vol. 4, no. 1, pp. 16–30, 2019. [Google Scholar]
28. G. Qiao, S. Leng, K. Zhang and K. Yang, “Joint deployment and mobility management of energy harvesting small cells in heterogeneous networks,” IEEE Access, vol. 5, no. 3, pp. 183–196, 2016. [Google Scholar]
29. M. S. Hossain, A. Jahid, K. Z. Islam, M. H. Alsharif, K. M. Rahman et al., “Towards energy efficient load balancing for sustainable green wireless networks under optimal power supply,” IEEE Access, vol. 8, no. 1, pp. 200635–200654, 2020. [Google Scholar]
30. A. Gastli and Y. Charabi, “Solar electricity prospects in Oman using GIS-based solar radiation maps,” Renewable and Sustainable Energy Reviews, vol. 14, no. 2, pp. 790–797, 2010. [Google Scholar]
31. M. S. Hossain, A. Jahid, K. Z. Islam, M. H. Alsharif and M. Rahman, “Multi-objective optimum design of hybrid renewable energy system for sustainable energy supply to a green cellular networks,” Sustainability, vol. 12, no. 9, pp. 3536, 2020. [Google Scholar]
32. M. H. Alsharif and J. Kim, “Optimal solar power system for remote telecommunication base stations: A case study based on the characteristics of South Korea’s solar radiation exposure,” Sustainability, vol. 8, no. 9, pp. 942–962, 2016. [Google Scholar]
33. M. H. Alsharif and J. Kim, “Hybrid off-grid SPV/WTG power system for remote cellular base stations towards green and sustainable cellular networks in South Korea,” Energies, vol. 10, no. 1, pp. 9–29, 2016. [Google Scholar]
34. M. H. Alsharif, “Optimization design and economic analysis of energy management strategy based on photovoltaic/energy storage for heterogeneous cellular networks using the HOMER model,” Solar Energy, vol. 147, no. 1, pp. 133–150, 2017. [Google Scholar]
35. M. H. Alsharif, R. Nordin and M. Ismail, “Green wireless network optimisation strategies within smart grid environments for long term evolution (LTE) cellular networks in Malaysia,” Renewable Energy, vol. 85, no. 3, pp. 157–170, 2016. [Google Scholar]
36. A. Jahid, K. Z. Islam, M. S. Hossain, M. K. H. Monju and M. F. Rahman, “Performance evaluation of cloud radio access network with hybrid power supplies,” in Int. Conf. on Sustainable Technologies for Industry 4.0, Dhaka, Bangladesh, pp. 1–5, 2019. [Google Scholar]
 | This work is licensed under a Creative Commons Attribution 4.0 International License, which permits unrestricted use, distribution, and reproduction in any medium, provided the original work is properly cited. |