DOI:10.32604/cmc.2021.017297
| Computers, Materials & Continua DOI:10.32604/cmc.2021.017297 | |
| Article |
AntiFlamPred: An Anti-Inflammatory Peptide Predictor for Drug Selection Strategies
1Department of Information System, Faculty of Computing and Information Technology, King Abdulaziz University, Jeddah, 21589, Saudi Arabia
2Department of Computer Science, University of Management and Technology, Lahore, 54000, Pakistan
3Department of Information Technology, University of Gujrat, Gujrat, 50700, Pakistan
*Corresponding Author: Yaser Daanial Khan. Email: yaser.khan@umt.edu.pk
Received: 26 January 2021; Accepted: 03 April 2021
Abstract: Several autoimmune ailments and inflammation-related diseases emphasize the need for peptide-based therapeutics for their treatment and established substantial consideration. Though, the wet-lab experiments for the investigation of anti-inflammatory proteins/peptides (“AIP”) are usually very costly and remain time-consuming. Therefore, before wet-lab investigations, it is essential to develop in-silico identification models to classify prospective anti-inflammatory candidates for the facilitation of the drug development process. Several anti-inflammatory prediction tools have been proposed in the recent past, yet, there is a space to induce enhancement in prediction performance in terms of precision and efficiency. An exceedingly accurate anti-inflammatory prediction model is proposed, named AntiFlamPred (“Anti-inflammatory Peptide Predictor”), by incorporation of encoded features and probing machine learning algorithms including deep learning. The proposed model performs best in conjunction with deep learning. Rigorous testing and validation were applied including cross-validation, self-consistency, jackknife, and independent set testing. The proposed model yielded 0.919 value for area under the curve (AUC) and revealed Mathew’s correlation coefficient (MCC) equivalent to 0.735 demonstrating its effectiveness and stability. Subsequently, the proposed model was also extensively probed in comparison with other existing models. The performance of the proposed model also out-performs other existing models. These outcomes establish that the proposed model is a robust predictor for identifying AIPs and may subsidize well in the extensive lab-based examinations. Subsequently, it has the potential to assiduously support medical and bioinformatics research.
Keywords: Prediction; feature extraction; machine learning; bootstrap aggregation; deep learning; bioinformatics; computational intelligence; anti-inflammatory peptides
Inflammation occurs as a reaction caused by several diverse reasons, one such reason is the irregular response of the body’s immune system to some kind of physical injury or damage [1–4]. Under normal conditions, it is self-controlled while in some disorders the inflammatory process becomes pathological, subsequently causing chronic autoimmune and inflammatory disorders, i.e., multiple sclerosis, rheumatoid, arthritis, cancer, psoriasis, diabetes, and neurodegenerative disease. Immune homeostatic maintenance and preventing the onset of increased inflammation and autoimmunity essentially requires the initiation of immune forbearance [5–8]. Non-specific immune-suppressants and anti-inflammatory medications are recently in practice for the treatment of autoimmunity and inflammation syndromes. Such treatments are usually ineffective against inflammatory syndromes, however, these may cause further infectious diseases [8].
Various mechanisms are employed and considered necessary to conserve the state of forbearance against inflammation [9,10]. Recurrent endogenic peptide identification as anti-inflammatory agents through inflammatory reactions can be utilized for inflammatory and autoimmune therapies [11,12]. Immunotherapeutic capability makes AIPs clinically applicable especially due to their specificity to generate regulatory T-cells and reticence against antigen explicit to Th-1 driven reactions [13].
AIPs are currently used to treat various inflammatory diseases [14,15]. Compared to protein-based conventional biopharmaceutical drugs, the complexity of production and cost is lower [16] as well as high specificity and low toxicity make them potential therapeutic agents [17,18]. Besides natural, synthetic peptides also have the potential to constrain the signal transduction-pathways (“STD”) for the manifestation of inflammatory cytokines [19]. For example, chronic nasal treatment of amyloid-beta (“A-beta”) peptide in mice, a pathological marker of Alzheimer’s disease, results in reduced A-beta plaque load besides anti-inflammatory cytokines [20–23]. Vasoactive intestinal peptide (“VIP”), a neuropeptide, is useful for decreasing inflammation components of rheumatoid arthritis by mutating the immune response experimentally [24]. In recent years, numerous active peptides have been identified by experimental methods. However, experimental analysis-based identification and empirical development of new peptide-based drugs are particularly expensive, time-taking, and laborious. Overall, the availability of experimental data makes it possible to evaluate the relationships among the amino acid sequences and their properties and computationally predict prospective candidates before synthesis. Up till now, three methods have been suggested for computational prediction of potential AIPs [25] specifically and an effort has been made to propose a generic predictor for the prediction of several therapeutic peptides including anti-angiogenic peptides (“AAP”), anti-bacterial peptides (“ABP”), anticancer peptides (“ACP”), AIP, anti-viral peptides (“AVP”), cell-penetrating peptides (“CPP”), quorum-sensing peptides (“QSP”) and surface binding peptides (“SBP”), respectively.
Gupta et al 2017 developed an anti-inflammatory predictor using a support vector machine (“SVM”) classifier and hybrid peptide features, performance analysis revealed an area under the curve (AUC) value of 78.1 and Matthews correlation coefficient (MCC) equal to 0.58 using tripeptide hybrid features. AIPpred, an AIP predictor, proposed by Manavalan et al. utilizing random forest (RF) classifier and sequence encoding features exhibited prediction performance having AUC=0.814 while MCC was 0.479. PreAIP [25] was developed by Khatun et al. through a random forest classifier incorporating manifold features like primary sequence and structural information. The performance evaluation showed an AUC value of 0.840 and MCC of 0.512 on the test dataset. Wei et al. used hybrid sequence-based features which were further optimized to select widely discriminative features and trained 8 random-forest models to predict 8 functionally different peptides yielding an AUC value of 0.75. Subsequently, the performance concerning the accuracy of the above discussed existing AIP predictors is insufficient and demands further improvements for precise AIPs prediction. In the pursuance of this purpose, an improved AIP predictor has been proposed termed as AntiFlamPred (“Anti-inflammatory Peptide Predictor”).
The next segment of this article is articulated as: Section 2 has been designated for the materials and methodology. Prediction algorithms and the proposed approach used in this study for experiments have been described in section 3. Section 4 is dedicated to details about experiments and result-acquisition methods, and section 5 represents the obtained results and provides a detailed discussion on them. Finally, section 6 narrates the conclusion.
In the proposed methodology to build a prediction model, “Chou’s 5-steps rule” [26] has been followed, and the flow process is depicted in Fig. 1, quite similar to the methodology adopted in some latest research papers [27] to predict proteomic attributes. The stepwise methodology involves (i) collection of benchmark dataset (to be used in testing and training of prediction model); (ii) formulation of sequence samples; (iii) training of prediction algorithm; (iv) Validation and Testing; and (v) easily manageable webserver. The studies involved in the development of sequence analysis or prediction method by adopting Chou’s 5-step rules have the subsequent noticeable advantages [28–32]: (1) clearer logic development, (2) fully operational transparency, (3) easy for other investigators to replicate experiments to obtained reported findings, (4) with a strong potential to stimulate other sequence analysis methods, and (5) quite convenient experimental usage by the scientists. The implementation of these steps is specified hereunder.

Figure 1: Flow process of the proposed methodology
2.1 Benchmark Dataset Collection
To construct the AntiFlamPred, the dataset has been collected from newly published research papers of Manavalan et al., Khatun et al., Wei et al., and immune epitope database and analysis resource (IEDB) [33]. A peptide is anti-inflammatory if it induces any one of the cytokines in T Cell assays of mouse and human such as interferon-alpha/beta (IFN-a/b), transforming growth factor-beta (TGFb), interleukin-4 (IL-4), interleukin-10 (IL-10), interleukin-13 (IL-13) and interleukin-22 (IL-22) were considered positive AIPs (“pAIPs”).
Similarly, peptides examined inflammatory, proinflammatory, or found adverse for antiinflammation were rated negatively (“nAIPs”). The dataset obtained from IEDB and other published papers contain 2549 positive and 4516 negative samples. To remove redundancy from a dataset, CD-HIT [34] was applied at a 0.6 sequence identity threshold. Stricter criterion at 0.3 or 0.4 thresholds could lead to more credible performance as practiced in [3,15,25], but data limitation restricts the usage of such criteria. As a preprocessing step to enhance the pAIPs and nAIPs dataset non-amino acid letters (‘B’, ‘J’, ‘O’, ‘U’, ‘X’, and ‘Z’) were cleaned. Finally, after preprocessing and applying CD-HIT we have obtained a dataset consisting of 1911 pAIPs and 4240 nAIPs. Eq. (1) represents the general formulation of an arbitrary peptide sample [35–38].
where
where
A relatively smaller or medium benchmark dataset is usually distributed into two subsets; training set and testing set in conventional prediction models [39,40]. The prediction model can be tested using validation techniques like jackknife or k-fold subsampling, where the outcome is assessed with different groupings of independent datasets. Thus, successively, the benchmark dataset division into subsets is not required [41].
Biological sequences emerged day by day and gained importance due to their therapeutic activity. The use of graphical methodologies for the study of medical and biological structures can offer instinctive insight and useful information for analyzing the complex relationships within them, as shown by the eight masterpieces of the founding article of the Chairman of the Nobel Prize Committee Sture Forsen (see, e.g., [42]) and numerous follow-up articles (see, e.g., [43] and a long list of articles cited in a full review [44]). Further, computational prediction of such biological sequences is the need of the day to support in medicine and challenging task to convert these sequences into discrete or vector models yet maintaining the sequence order information. All this is due to the requirement of all highly performed machine learning algorithms [45,46]. However, during the conversion from sequential to discrete representation of a protein, there is a chance to lose the necessary information a pattern of sequence might have while using a discrete model. To retain this important information, PseAAC or “pseudo amino acid composition”, a fixed-size transformation was proposed by Chou [47] and is widely in practice in Bioinformatics nowadays [48–51]. As it became more and more widely used, four powerful open source software called “PseAAC”, “PseAAC-Builder” [52], “propy” [53] and “PseAAC-General” [54] were established: The first three are supposed to generate different modes of Chou's special PseAAC; while the fourth for the general Chou PseAAC, which not only contains all distinct types of proteins encodings but also superordinate feature encodings, like the “functional domains” mode (see Eqs. (9)–(10) of [26]), the mode “Genetic Ontology” (see Eqs. (11)–(12) of [26]) and the mode “PSSM” or “Sequential Evolution” (see Eqs. (13)–(14) of [26]). Stimulated by the successful PseAAC usage, PseKNC (pseudo-K-tuple nucleotide composition) was established to encode several features for the sequences of DNA/RNA and proved very successful. Specifically, a powerful and generic webserver was developed in 2015, capable to generate several types of feature encodings for the sequences of protein/peptide as well as for DNA/RNA, names as “Pse-in-One” and one of its modernized version “Pse-in-One2.0”. The discrete fixed-size representation of an arbitrary length protein/peptide sequence based on the composition of amino acids can be expressed as:
where
where each component
2.3 Determination of PRIM and RPRIM
The principal sequence is the key to assessing unknown peptide properties. The model's key mathematical criterion is based on position relative information of residues in a peptide of the benchmark dataset. A matrix of 20 × 20, in size, was formed to quantify the corresponding location of residues for innate sequences, called position relative incidence matrix (“PRIM”). The reverse position relative incidence matrix (“RPRIM”) has the same specification as PRIM, just calculated on a reversed variant of a sequence, called here as RPRIM. The PRIM metric determination was done as:
where every component of the matrix describes the sum of the corresponding location of the jth residue relative to the ith. Likewise, reversed sequences were used to determine RPRIM as:
The size of both matrices represented by Eqs. (5) and (6) is 20 × 20, resulting in 400 elements each.
2.4 Frequency Vector (FV) Encoding
The frequency vector depicts the frequency distribution; how many times an amino acid occurs in a peptide sequence, and can be expressed as:
where
2.5 Determination of AAPIV and RAAPIV
Compositional information can be assessed using frequency vector, but it is unable to provide position relative information of a residue. To extract position relative information, an accumulative absolute position incidence matrix (“AAPIV”) of 20 components in length is determined. AAPIV contains information regarding the sum of all ordered values of each amino acid in a sequence corresponding to their location. In the same way as of the PRIM and RPRIM, the computational mechanism of AAPIV is based on an originally ordered sequence, but a reversed version of sequence is used to compute reverse accumulative absolute position incidence matrix (“RAAPIV”). AAPIV is computed as:
where
RAAPIV is also assessed similarly as AAPIV but just reversed sequences are used. Both the AAPIV and RAAPIV are feature vectors of 20 dimensions in length.
3 Prediction Algorithm (Proposed Approach)
The next phase in the development of a prediction model is to incorporate a prediction algorithm. Numerous investigations in the field of bioinformatics and pattern recognition have employed ensemble approaches like bootstrap aggregation (bagging) and boosting [55] for the solution of classification or regression problems. Amongst these approaches tree-based ensemble methods like, decision tree, extra-trees classifier, and random forest have shown excellent performance [56,57]. Random forests (“RF”) utilized a mechanism of randomization for the creation of a group of separate trees being used as individual classifiers. Bagging is another approach utilized in the random forest to train each tree with a different copy of the training samples (subsampling) also knows as bootstrap. The bootstrap is a randomization approach for subsampling of training data with replacement policy and random feature selection approach to train each tree node with different subspace [58] and outperforms comparatively to several other competitive classifiers, like SVM, linear discriminant analysis (“LDA”), logistic regression (“LR”), etc.
In this study, a deep neural network (“DNN”) has been utilized for the development of a prediction model. Amongst several deep learning algorithms, we consider the convolutional neural network (“CNN”) for its capability to further recognize numerous obscure patterns that may remain hidden otherwise [59]. In the proposed model, DNN uses a convolutional layer to generate and batch-normalization layer to normalize the output feature map respectively, to generalize the patterns, and finally uses fully connected (Dense) layers to characterize a potentially very complex order in which these patterns may appear [60]. Fig. 2 represents the complete workflow of the proposed model and an outline of the DNN architecture is shown in Fig. 3.
As described in the “Materials and Methods” section, AAPIV, RAAPIV, FV, P’, PRIM, and RPRIM feature vectors were created using the benchmark dataset. The benchmark dataset is used in this study contains both positive and negative peptide sequences. Finalized Feature Input Vector (“FIV”) was formed using these assessed feature vectors which were 880 in total. The FIV represents all the features, and each row of the FIV corresponds to each sample of the dataset. Similarly, the Expected Output Vector (“EOV”) was formed by each example resource according to their class. This FIV is further divided into training and independent test set and used to train, evaluate, and test the several machine learning algorithms and obtained significant with DNN. According to Fig. 3, these encoded features are fed to the convolutional layer followed by batch-normalization to normalize the output feature map of the convolutional layer batch-wise and a flatten layer to convert these outputs in-accordance with the compatibility of the fully connected layer for final recognition.

Figure 2: Block diagram of the proposed prediction model

Figure 3: Architectural framework of the proposed model
The assessment of algorithms was carried out using 10-fold cross-validation. The area under the receiver operating characteristic curve (AUC) and accuracies for each model was calculated on each fold and combined to evaluate the models. The most prospective algorithm was selected that performs best for AUC and accuracy, i.e., DNN, and chooses to develop the finalized model due to its excellent performance on the given feature set.
One of the most important processes in the development of a new classification model is to empirically assess its expected success rate [55]. To address this, we need to consider two matters. (1) What performance metrics should be utilized to quantitatively represents the quality of the predictor? (2) What type of test approaches should be applied to obtain scoring metrics?
The following metrics are generally used to measure the prediction quality from four different angles: (1) Measure of predictor’s overall accuracy (ACC), (2) the capacity of correctly predict a positive class (true positive rate) is known as Specificity (SPEC), (3) the capacity of correctly predict a negative class (true negative rate) is known as Sensitivity (SENS), (4) stability and quality of classification (MCC) [45,60]. These metrics were generally used to measure the quality of a classification model and can be expressed as:
Three cross-validation tests are usually used for the performance evaluation of the classification model. The main three techniques are the “leave-one-out” / “jackknife” test, “k-fold test” also known as sub-sampling, and independent test [45]. In this study, we used all these three tests for the performance evaluation of the proposed classifier.
To build, train and evaluate the classification model, we use python language and experiments were carried out using the Tensorflow python package based on Keras framework for DNN and PyCaret package for other machine learning models used for comparison purpose in this study. PyCaret is a python package that wrapped up several frameworks, such as scikit-learn, and machine learning models like XGBoost (“XGB”), Gradient Boosting Machine (“GBM”), LightGBM (“LGBM”), AdaBoost (“ADA”), Decision Tree (“DT”), RF, etc. It is a low-code and easy-to-use library that provides the simplest way to compare several models with k-fold cross-validation. For experimentation, to train and test the model, out of the total dataset, 4305 (1329 pAIPs and 2976 nAIPs) samples were selected for the training and validation of the model and the rest 1846 (582 pAIPs and 1264 nAIPs) samples were selected as independent test-set.
The performance of any machine learning algorithm significantly depends on the parameters used while developing a model. For this purpose, we have utilized a grid-search module of Scikit-learn by providing the range of several parameters to obtain the parameters that may best fit in DNN to get significant results [45]. The parameters that were acquired and being used in this study are described as follows: the convolutional layer was being utilized with three main influential parameters (filters:32, kernel size (convolutional window): 3, and activation function: relu). The batch-normalization and flatten layers were used with default parameters. In the proposed model, next to the convolutional process, we have utilized two fully connected/dense layers (hidden and output) to achieve the expected outputs. In the hidden layer, 256 neurons were used with ‘relu’ activation function and in the final output layer, only one neuron was used with a sigmoid activation function to acquire the output within the range of 0’s and 1’s only. For model generalization and overfitting prevention, a dropout layer was being adopted with a 0.2 neuron dropout rate in between the hidden and output layer.
Fairly, as compared to existing AIP prediction models, our proposed classification model outperforms and has achieved 0.919 AUC and 0.735 MCC using FIV and DNN based classifiers. Initially, the results of the self-consistency test are represented in Fig. 4 in the form of a confusion matrix and performance metrics in Tab. 1. In the self-consistency test, the model is trained and tested on the same benchmark dataset [35].

Figure 4: Self-consistency testing results of the proposed model
Table 1: Performance metric of Self-consistency test

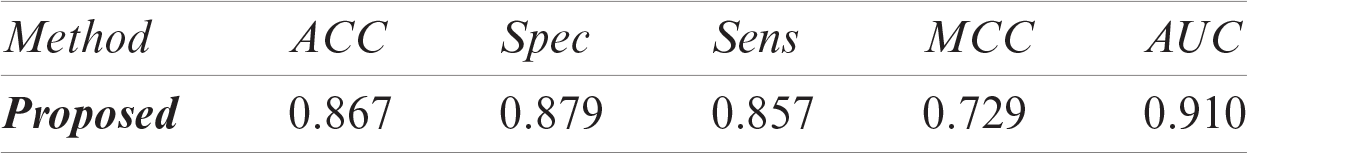
The performance of the current prediction model using a 10-fold cross-validation test on the benchmark dataset is depicted in Fig. 5 and the performance metric is listed in Tab. 2. Additionally, the jackknife test was also conducted using the DNN classifier to evaluate model performance. Jackknife is an extensive test generally used to test the accuracy and stability of the classification model where the acquisition of a new experimentally validated dataset might not be possible or dataset is accessible however inadequate to conceive results. The jackknife testing is also known as “leave-one-out” cross-validation testing, in which one protein/peptide sequence is kept out for a test and the model is trained on the rest whole dataset, in this way each sequence is being tested. The jackknife test results are shown in Tab. 3.

Figure 5: ROC-Curve of 10-Fold CV using DNN Classifier
Table 2: Performance metric of 10_Fold CV using DNN Classifier

Table 3: Results of Jackknife testing
In this study, we have compared the classification performance of seven well-known classifiers, i.e., ADA, DT, XGB, GB, RF, bagging (BAG), and DNN from deep learning algorithms. Where DNN performed quite the best among the rest. The performance metric of these classifiers is listed in Tab. 4 as well as the roc-curve for each classifier is shown in Fig. 6 as a comparison. These results demonstrate that the proposed DNN algorithm performs best among the other tried machine learning models with a 0.914 AUC and 0.706 MCC.
The performance comparison with the existing prediction models for anti-inflammatory peptides has been carried out using the available web-servers of three state-of-the-art computational models to obtain and compare the results with the proposed model. This comparison was carried out using an independent test-set to compare the performance of the proposed model with existing state-of-the are models; AIPpred [3], PEPred-suite [10], and PreAIP [25].
Table 4: Performance comparison of DNN with other ML models
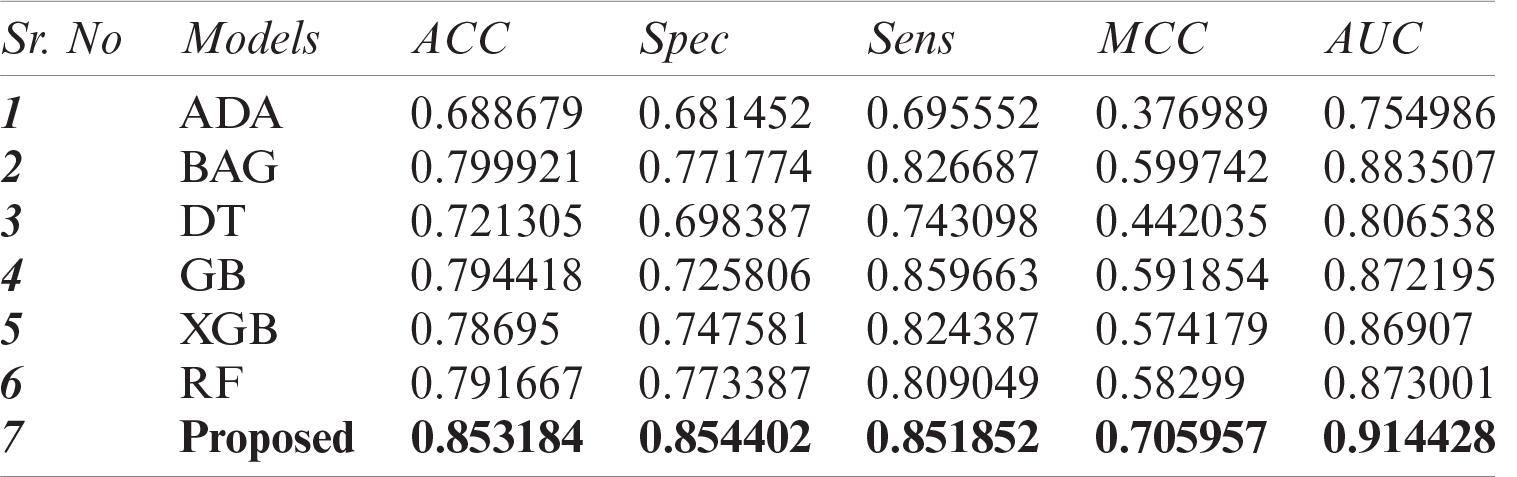
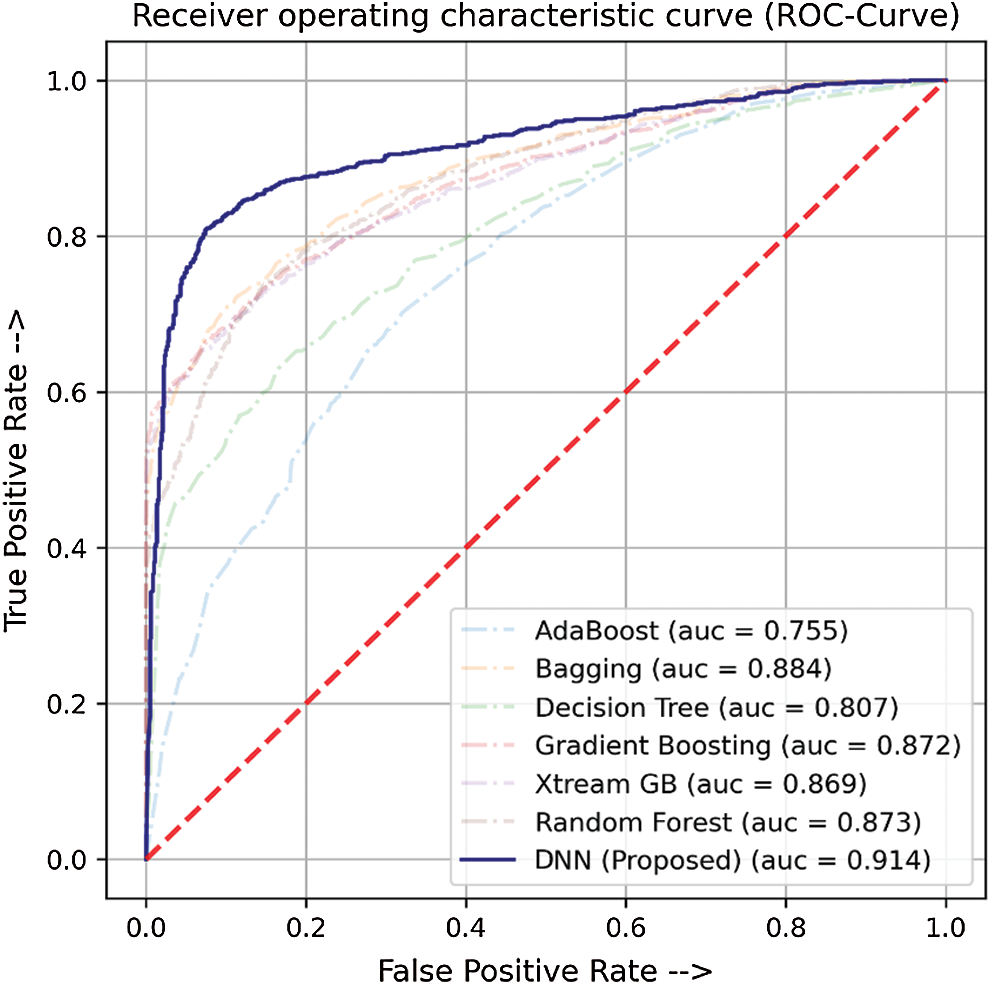
Figure 6: ROC-Curve for comparison of DNN with other ML Models
The AIPpred was developed with RF classifier by exploring protein/peptide sequence-based features, such as amino acid composition (AAC), dipeptide composition (DC), composition transition and distribution (CTD), amino acid index (AAI), and physiochemical properties (PCP), but finally built with DC. The PreAIP model was built by combining k-spaced amino acid pairs (KSAAP), AAI, and (KSAAP) acquired from (position-specific-scoring-matrix) pKSAAP using a random forest (RF) classifier. In the PEPred-suite, several physio-chemical and compositions-based discrete representations of peptide sequences were used along with RF to develop their prediction model. Zhang et al. [10] developed this model to predict a total of eight types of different peptide sequences including the AIP.
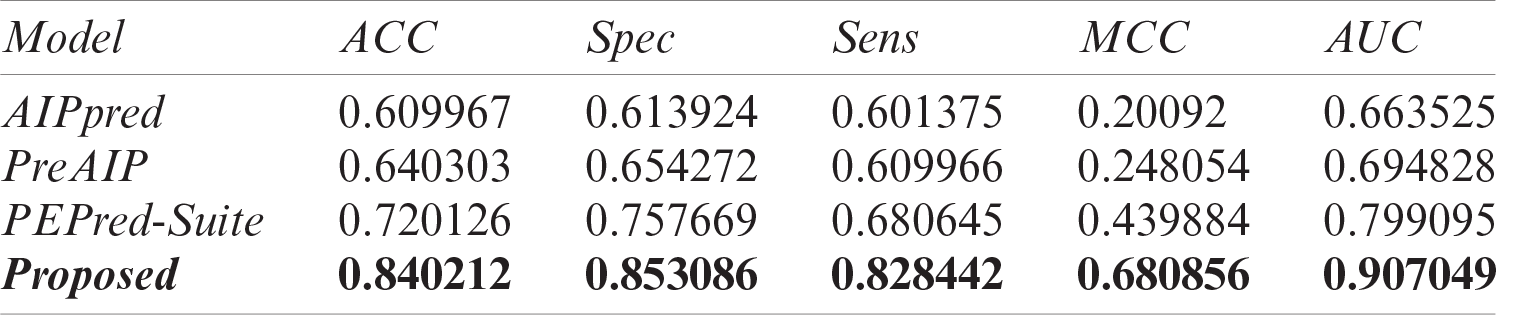
The results of an independent test of our proposed model and existing state-of-the-art predictors are listed in Tab. 5 and their AUCs are represented in Fig. 7 as a comparison. Results demonstrated that our proposed model outperforms the existing classifier with an extensive difference. Openly accessible webservers of existing predictors were used to acquire the results with the same independent test set as discussed earlier. On the independent test set, AIPpred predictor achieved 0.664 value of AUC, PEPred-Suite achieved 0.799 AUC, and the value of AUC of PreAIP was 0.695, while a much higher area under the curve has been achieved with 0.907 AUC value and 0.681 MCC showing the outstanding performance and stability of the proposed model.
Table 5: Performance comparison of the proposed model with existing AIP prediction models
There are few more things for further comparison among proposed and existing models with-respect to approach and methodology: AIPpred uses simple composition features such as AAC and DC, while such type of composition based features may lose the information obscured in the ordered sequence, while the moment based features used in the proposed model are capable to extract out such type of recurrent patterns. While PreAIP also has some limitations, like they only utilize the sequence of max length 25, even adjust a sequence with “-” if the length of the sequence is less than 25 to adjust its length equal to 25 residues [25], which may also cause the ordered information loss, secondly, PreAIP is also time extensive as it takes approximately up to 3 min for the prediction of a single peptide/protein.
Furthermore, the existing predictors were only cross-validated with 5-fold or 10-fold cross-validation techniques. Among them, no one uses the jackknife test, while we perform both the 10-fold cross-validation test as well as the extensive jackknife test to precisely estimate the performance of the model. Moreover, the proposed model using DNN classifier with the encoded features fairly outperforms comparative to the existing proposed model and demonstrating that the employed feature encoding technique is fairly capable to extract out the necessary and obscure information from the given anti-inflammatory peptide sequences which was otherwise not possible. Likewise, as shown in a series of profound publications in demonstrating new findings or approaches, user-friendly and publicly accessible web-servers will significantly enhance their impacts, driving medicinal chemistry into an unprecedented revolution, we shall make efforts in our future work to provide a web-server to display the findings that can be manipulated by users according to their need.

Figure 7: ROC-Curve for the independent test to compare proposed and existing AIP prediction models
Conjointly utilizing the FIV and deep learning, a reliable, effective, and efficient classification model has been designed to predict the AIPs. The proposed classification model outperforms the present AIP prediction models. Comparative to these models, the proposed classification model has attained the largest AUC of 0.919 and MCC of 0.735 using 10-Fold cross-validation test on the benchmark dataset and achieve 0.907 AUC and 0.681 MCC on the independent test set, which proved it as a cost-effective and powerful classification model. Therefore, it may provide comprehensive support for AIPs classification at a large-scale, facilitate and assist in designing extensive hypothesis-based examinations or experiments.
Acknowledgement: This project was funded by the Deanship of Scientific Research (DSR), King Abdulaziz University (https://www.kau.edu.sa/), Jeddah, under Grant No. (D-49-611-1441). The authors, therefore, gratefully acknowledge DSR technical and financial support.
Funding Statement: The authors received no specific funding for this study.
Conflicts of Interest: The authors declare that they have no conflicts of interest to report regarding the present study.
1. L. Ferrero-Miliani, O. H. Nielsen, P. S. Andersen and S. E. Girardin, “Chronic inflammation: Importance of NOD2 and NALP3 in interleukin-1β generation,” Clinical and Experimental Immunology, vol. 147, no. 2, pp. 227–235, 2007. [Google Scholar]
2. R. Medzhitov, “Origin and physiological roles of inflammation,” Nature, vol. 454, no. 7203, pp. 428–435, 2008. [Google Scholar]
3. B. Manavalan, T. H. Shin, M. O. Kim and G. Lee, “AIPpred: Sequence-based prediction of anti-inflammatory peptides using random forest,” Frontiers in Pharmacology, vol. 9, pp. 276, 2018. [Google Scholar]
4. S. Basith, B. Manavalan, G. Lee, S. G. Kim and S. Choi, “Toll-like receptor modulators: A patent review (2006–2010),” Expert Opinion on Therapeutic Patents, vol. 21, no. 6, pp. 927–944, 2011. [Google Scholar]
5. S. Basith, B. Manavalan, T. H. Yoo, S. G. Kim and S. Choi, “Roles of toll-like receptors in cancer: A double-edged sword for defense and offense,” Archives of Pharmacal Research, vol. 35, no. 8, pp. 1297–1316, 2012. [Google Scholar]
6. C. Zouki, S. Ouellet and J. G. Filep, “The anti‐inflammatory peptides, antiflammins, regulate the expression of adhesion molecules on human leukocytes and prevent neutrophil adhesion to endothelial cells,” The FASEB Journal, vol. 14, no. 3, pp. 572–580, 2000. [Google Scholar]
7. L. Steinman, J. T. Merrill, I. B. McInnes and M. Peakman, “Optimization of current and future therapy for autoimmune diseases,” Nature Medicine, vol. 18, no. 1, pp. 59–65, 2012. [Google Scholar]
8. I. Tabas and C. K. Glass, “Anti-inflammatory therapy in chronic disease: Challenges and opportunities,” Science, vol. 339, no. 6116, pp. 166–172, 2013. [Google Scholar]
9. D. Hernández-Flórez and L. Valor, “Protein-kinase inhibitors: A new treatment pathway for autoimmune and inflammatory diseases,” Reumatologia Clinica, vol. 12, no. 2, pp. 91–99, 2016. [Google Scholar]
10. L. Zhang, J. Zhang, J. Yang, D. Ying, Y. L. Lau et al., “PriVar: A toolkit for prioritizing SNVs and indels from next-generation sequencing data,” Bioinformatics, vol. 29, no. 1, pp. 124–125, 2013. [Google Scholar]
11. H. Patterson, R. Nibbs, I. McInnes and S. Siebert, “Protein kinase inhibitors in the treatment of inflammatory and autoimmune diseases,” Clinical and Experimental Immunology, vol. 176, no. 1, pp. 1–10, 2014. [Google Scholar]
12. M. Corrigan, G. M. Hirschfield, Y. H. Oo and D. H. Adams, “Autoimmune hepatitis: an approach to disease understanding and management,” British Medical Bulletin, vol. 114, no. 1, pp. 181–191, 2015. [Google Scholar]
13. L. Miele, E. Cordella-Miele, A. Facchiano and A. B. Mukherjee, “Novel anti-inflammatory peptides from the region of highest similarity between uteroglobin and lipocortin I,” Nature, vol. 335, no. 6192, pp. 726–730, 1988. [Google Scholar]
14. E. Gonzalez-Rey, P. Anderson and M. Delgado, “Emerging roles of vasoactive intestinal peptide: A new approach for autoimmune therapy,” Annals of the Rheumatic Diseases, vol. 66, no. suppl 3, pp. iii70–iii76, 2007. [Google Scholar]
15. S. Gupta, A. K. Sharma, V. Shastri, M. K. Madhu and V. K. Sharma, “Prediction of anti-inflammatory proteins/peptides: An insilico approach,” Journal of Translational Medicine, vol. 15, no. 1, pp. 1–11, 2017. [Google Scholar]
16. K. Fosgerau and T. Hoffmann, “Peptide therapeutics: Current status and future directions,” Drug Discovery Today, vol. 20, pp. 122–128, 2015. [Google Scholar]
17. M. Delgado and D. Ganea, “Anti-inflammatory neuropeptides: A new class of endogenous immunoregulatory agents,” Brain, Behaviour and Immunity, vol. 22, no. 8, pp. 1146–1151, 2008. [Google Scholar]
18. B. C. Wu, A. H. Lee and R. E. W. Hancock, “Mechanisms of the innate defense regulator peptide-1002 anti-inflammatory activity in a sterile inflammation mouse model,” The Journal of Immunology, vol. 199, no. 10, pp. 3592–3603, 2017. [Google Scholar]
19. C. De la Fuente-Núñez, O. N. Silva, T. K. Lu and O. L. Franco, “Antimicrobial peptides: Role in human disease and potential as immunotherapies,” Pharmacology and Therapeutics, vol. 178, pp. 132–140, 2017. [Google Scholar]
20. H. L. Weiner, C. A. Lemere, R. Maron, E. T. Spooner, T. J. Grenfell et al., “Nasal administration of amyloid-beta peptide decreases cerebral amyloid burden in a mouse model of Alzheimer's disease,” Annals of Neurology, vol. 48, no. 4, pp. 567–579, 2000. [Google Scholar]
21. L. Zhao, X. Wang, X. L. Zhang and Q. F. Xie, “Purification and identification of anti-inflammatory peptides derived from simulated gastrointestinal digests of velvet antler protein (Cervus elaphus Linnaeus),” Journal of Food and Drug Analysis, vol. 24, no. 2, pp. 376–384, 2016. [Google Scholar]
22. D. Kempuraj, G. P. Selvakumar, R. Thangavel, M. E. Ahmed, S. Zaheer et al., “Mast cell activation in brain injury, stress, and post-traumatic stress disorder and Alzheimer's disease pathogenesis,” Frontiers in Neuroscience, vol. 11, pp. 703, 2017. [Google Scholar]
23. R. R. Gonzalez, T. Fong, N. Belmar, M. Saban, D. Felsen et al., “Modulating bladder neuro-inflammation: RDP58, a novel anti-inflammatory peptide, decreases inflammation and nerve growth factor production in experimental cystitis,” The Journal of Urology, vol. 173, no. 2, pp. 630–634, 2005. [Google Scholar]
24. M. Delgado, C. Abad, C. Martinez, J. Leceta and R. P. Gomariz, “Vasoactive intestinal 24 peptide prevents experimental arthritis by downregulating both autoimmune and inflammatory components of the disease,” Nature Medicine, vol. 7, no. 5, pp. 563–568, 2001. [Google Scholar]
25. M. S. Khatun, M. M. Hasan and H. Kurata, “PreAIP: Computational prediction of anti-inflammatory peptides by integrating multiple complementary,” Frontiers in Genetics, vol. 10, pp. 129, 2020. [Google Scholar]
26. K. C. Chou, “Some remarks on protein attribute prediction and pseudo amino acid composition,” Journal of Theoretical Biology, vol. 273, no. 1, pp. 236–247, 2011. [Google Scholar]
27. W. Lin, X. Xiao, W. Qiu and K. C. Chou, “Use Chou’s 5-steps rule to predict remote homology proteins by merging grey incidence analysis and domain similarity analysis,” Natural Science, vol. 12, pp. 181–198, 2020. [Google Scholar]
28. D. Zhang, L. Fang, L. Wang, Z. Pan, Z. Lai et al., “The chemical mechanism of pestilences or coronavirus disease 2019 (COVID-19),” Natural Science, vol. 12, pp. 717–725, 2020. [Google Scholar]
29. D. Zhang, L. Fang, L. Wang, Z. Pan, Z. Lai et al., “The physical principle of coronavirus disease 2019 (COVID-19),” Index of Sciences, vol. 12, pp. 1–13, 2020. [Google Scholar]
30. D. Zhang, L. Fang, L. Wang, Z. Pan, Z. Lai et al., “The physicochemical mechanism of pestilences or coronavirus disease 2019 (COVID-19),” Academic Journal of Microbiology Research, vol. 8, pp. 49–55, 2020. [Google Scholar]
31. L. Fang, X. Wang, Z. Lai, D. Zhang, M. Wu et al., “Reveal the molecular principle of coronavirus disease 2019 (COVID-19),” Index of Sciences, vol. 12, pp. 1–13, 2020. [Google Scholar]
32. X. Zhai, M. Chen and W. Lu, “Accelerated search for perovskite materials with higher Curie temperature based on the machine learning methods,” Computational Materials Science, vol. 151, pp. 41–48, 2018. [Google Scholar]
33. R. Vita, J. A. Overton, J. A. Greenbaum, J. Ponomarenko, J. D. Clark et al., “The immune epitope database (IEDB) 3.0,” Nucleic Acids Research, vol. 43, no. D1, pp. D405–D412, 2015. [Google Scholar]
34. Y. Huang, B. Niu, Y. Gao, L. Fu and W. Li, “CD-HIT suite: A web server for clustering and comparing biological sequences,” Bioinformatics, vol. 26, no. 5, pp. 680–682, 2010. [Google Scholar]
35. Y. D. Khan, N. Amin, W. Hussain, N. Rasool, S. A. Khan et al., “iProtease-PseAAC (2LA two-layer predictor for identifying proteases and their types using Chou’s 5-step-rule and general PseAAC,” Analytical Biochemistry, vol. 588, pp. 113477, 2020. [Google Scholar]
36. Y. D. Khan, M. Jamil, W. Hussain, N. Rasool, S. A. Khan et al., “pSSbond-PseAAC: Prediction of disulfide bonding sites by integration of PseAAC and statistical moments,” Journal of Theoretical Biology, vol. 463, pp. 47–55, 2019. [Google Scholar]
37. S. A. Khan, Y. D. Khan, S. Ahmad and K. H. Allehaibi, “N-MyristoylG-PseAAC: Sequence-based prediction of N-myristoyl glycine sites in proteins by integration of PseAAC and statistical moments,” Letters in Organic Chemistry, vol. 16, no. 3, pp. 226–234, 2019. [Google Scholar]
38. Z. He and W. J. Yu, “Stable feature selection for biomarker discovery,” Computers, Materials & Continua, vol. 34, no. 4, pp. 215–225, 2010. [Google Scholar]
39. A. H. Butt and Y. D. Khan, “Prediction of S-Sulfenylation sites using statistical moments based features via Chou’S 5-Step rule,” International Journal of Peptide Research and Therapeutics, vol. 26, no. 3, pp. 1–11, 2019. [Google Scholar]
40. S. Ilyas, W. Hussain, A. Ashraf, Y. D. Khan and S. A. Khan, “iMethylK-PseAAC: Improving accuracy of lysine methylation sites identification by incorporating statistical moments and position relative features into general PseAAC via Chou’s 5-steps rule,” Genomics, vol. 20, no. 4, pp. 275–292, 2019. [Google Scholar]
41. Y. D. Khan, N. Rasool, W. Hussain, S. A. Khan and K. C. Chou, “iPhosT-PseAAC: Identify phosphothreonine sites by incorporating sequence statistical moments into PseAAC,” Analytical Biochemistry, vol. 550, pp. 109–116, 2018. [Google Scholar]
42. K. C. Chou and S. Forsen, “Diffusion-controlled effects in reversible enzymatic fast reaction system: Critical spherical shell and proximity rate constants,” Biophysical Chemistry, vol. 12, pp. 255–263, 1980. [Google Scholar]
43. G. P. Zhou and M. H. Deng, “An extension of Chou’s graphic rules for deriving enzyme kinetic equations to systems involving parallel reaction pathways,” Biochemical Journal, vol. 222, pp. 169–176, 1984. [Google Scholar]
44. K. C. Chou, “Review: Low-frequency collective motion in biomacromolecules and its biological functions,” Biophysical Chemistry, vol. 30, pp. 3–48, 1988. [Google Scholar]
45. M. Attique, M. S. Farooq, A. Khelifi and A. Abid, “Prediction of therapeutic peptides using machine learning: Computational models, datasets, and feature encodings,” IEEE Access, vol. 8, pp. 148570–148594, 2020. [Google Scholar]
46. S. J. Malebary, M. S. U. Rehman and Y. D. Khan, “iCrotoK-PseAAC: Identify lysine crotonylation sites by blending position relative statistical features according to the Chou’s 5-step rule,” PLos One, vol. 14, no. 11, pp. e0223993, 2019. [Google Scholar]
47. K. C. Chou, “Prediction of protein cellular attributes using pseudo amino acid composition,” Proteins: Structure Function and Bioinformatics, vol. 44, no. 3, pp. 246–255, 2001. [Google Scholar]
48. M. A. Akmal, W. Hussain, N. Rasool, Y. D. Khan, S. A. Khan et al., “Using Chou’s 5-steps rule to predict O-linked serine glycosylation sites by blending position relative features and statistical moment,” IEEE/ACM Transactions on Computational Biology and Bioinformatics, 2020. https://doi.org/10.1109/TCBB.2020.2968441. [Google Scholar]
49. S. Amanat, A. Ashraf, W. Hussain, N. Rasool and Y. D. Khan, “Identification of lysine carboxylation sites in proteins by integrating statistical moments and position relative features via general PseAAC,” Current Bioinformatics, vol. 15, no. 5, pp. 396–407, 2020. [Google Scholar]
50. J. L. Esquinas-Requena, S. Lozoya-Moreno, I. García-Nogueras, P. Atienzar-Núñez and P. M. Sánchez-Jurado, “La anemia aumenta el riesgo de mortalidad debido a fragilidad y discapacidad en mayores: Estudio FRADEA,” Primary Care, vol. 52, no. 7, pp. 452–461, 2020. [Google Scholar]
51. A. H. Butt and Y. D. Khan, “CanLect-Pred: A cancer therapeutics tool for prediction of target cancerlectins using experiential annotated proteomic sequences,” IEEE Access, vol. 8, pp. 9520–9531, 2019. [Google Scholar]
52. P. Du, X. Wang, C. Xu and Y. Gao, “PseAAC-builder: A cross-platform stand-alone program for generating various special Chou’s pseudo amino acid compositions,” Analytical Biochemistry, vol. 425, pp. 117–119, 2012. [Google Scholar]
53. D. S. Cao, Q. S. Xu and Y. Z. Liang, “propy: A tool to generate various modes of Chou’s PseAAC,” Bioinformatics, vol. 29, pp. 960–962, 2013. [Google Scholar]
54. P. Du, S. Gu and Y. Jiao, “PseAAC-general: Fast building various modes of general form of Chou’s pseudo amino acid composition for large-scale protein datasets,” International Journal of Molecular Sciences, vol. 15, pp. 3495–3506, 2014. [Google Scholar]
55. L. Breiman, “Bagging predictors,” Machine Learning, vol. 24, no. 2, pp. 123–140, 1996. [Google Scholar]
56. A. M. Patel and A. Suthar, “AdaBoosted extra trees classifier for object-based multispectral image classification of Urban Fringe area,” International Journal of Image and Graphics, pp. 2140006, 2020. https://doi.org/10.1142/S0219467821400064. [Google Scholar]
57. D. Veltri, U. Kamath and A. Shehu, “Deep learning improves antimicrobial peptide recognition,” Bioinformatics, vol. 34, no. 16, pp. 2740–2747, 2018. [Google Scholar]
58. Y. D. Khan, N. S. Khan, S. Farooq, A. Abid, S. A. Khan et al., “An efficient algorithm for recognition of human actions,” The Scientific World Journal, vol. 2014, pp. 1–11, 2014. [Google Scholar]
59. Y. D. Khan, F. Ahmed and S. A. Khan, “Situation recognition using image moments and recurrent neural networks,” Neural Computing and Applications, vol. 24, no. 7–8, pp. 1519–1529, 2014. [Google Scholar]
60. S. Naseer, W. Hussain, Y. D. Khan and N. J. Rasool, “iPhosS (Deep)-PseAAC: Identify phosphoserine sites in proteins using deep learning on general pseudo amino acid compositions via modified 5-steps rule,” IEEE/ACM Transactions on Computational Biology and Bioinformatics, 2020. https://doi.org/10.1109/TCBB.2020.3040747. [Google Scholar]
 | This work is licensed under a Creative Commons Attribution 4.0 International License, which permits unrestricted use, distribution, and reproduction in any medium, provided the original work is properly cited. |