DOI:10.32604/cmc.2021.017357
| Computers, Materials & Continua DOI:10.32604/cmc.2021.017357 | |
| Article |
Ecological Security Evaluation Algorithm for Resource-Exhausted Cities Based on the PSR Model
1Key Laboratory of Forestry Remote Sensing Based Big Data & Ecological Security for Hunan Province, Central South University of Forestry and Technology, Changsha, 410004, China
2Hunan Urban and Rural Ecological Planning and Restoration Engineering Research Center, Hunan City University, Yiyang, 413000, China
3College of Information and Electronic Engineering, Hunan City University, Yiyang, 413000, China
4Department of Mathematics and Computer Science, Northeastern State University, Tahlequah, 74464, USA
*Corresponding Author: Yunlin Zhao. Email: t20192481@csuft.edu.cn
Received: 28 January 2021; Accepted: 04 April 2021
Abstract: Today, resource depletion threatens a number of resource-based cities in China. The ecological security problem caused by the long-term exploitation of natural resources is a key issue to be solved in the development of resource-exhausted cities. Using 23 indicators, this study evaluated the ecological security status and development trends of 21 resource-exhausted cities in China from 2011 to 2017. The results showed that from 2011 to 2015, the overall ecological security of this type of city was low, with over 60% of the cities at an unsafe level. However, ecological security improved rapidly after 2016, and by 2017, all of the cities had reached the critical safety level. The top 10 indicators of ecological security included industrial sulfur dioxide emissions, water supply, agricultural fertilizer application, and forest coverage. These 10 indicators’ cumulative contribution to ecological security was 48.3%; among them, reducing industrial sulfur dioxide emissions contributed the most at 5.7%. These findings can help governments better understand the ecological security status of resource-exhausted cities, and it can provide a reference for the allocation of funds and other resources to improve the ecological safety of these cities.
Keywords: Ecological security; PSR model; evaluation; resource-exhausted cities
This study investigated the assessment of ecological security in China’s resource-exhausted cities. In recent years, resource-based cities in China have been threatened by resource depletion, and the output of nonrenewable natural resources has steadily declined. Sustainability has been neglected in the development of resource-based cities, giving rise to complex dilemmas and an urgent need for transformation. Ecological security issues caused by the long-term exploitation of natural resources is a key problem to be solved for these cities.
China defines a resource-exhausted city as one whose cumulative recoverable reserves have reached more than 70% of the originally measured reserves. A resource-exhausted city is also defined as one that can only undertake mining for five additional years based on current technologies and mining capacity. The “Opinions of the State Council on Promoting the Sustainable Development of Resource-Based Cities” specifies that the central government will provide some financial support for these cities. However, the overall responsibility for the sustainable development of resource-based cities lies with provincial governments, which need to strengthen support for these cities. In this regard, it is important to evaluate the ecological security status of resource-exhausted cities to optimize the allocation of funds and other resources.
The pressure–state–response (PSR) model has been widely used to evaluate the ecological safety of cities. Studies in this area have introduced the concept of ecological security [1,2], as well as the construction and evaluation methods of the PSR model [3–6]. Many studies have evaluated the ecological security of specific cities or regions [7–11], contributing to the development of relevant theories and methods. In ecological security evaluation studies, the research objects have primarily been cities, provinces, regions, or city clusters. However, starting from the national level, there has been limited research on the ecological safety assessment for specific types of cities within a country. Moreover, studies have tended to neglect the in-depth analysis of the contribution of evaluation indicators, which can assist governments in identifying methods for improving ecological security.
This study used PSR to construct an evaluation model based on the characteristics of ecological security in China. In this way, we evaluated the ecological security of 21 resource-exhausted prefecture-level cities from 2011 to 2017. We also examined the evaluation indicators’ contribution to ecological security in those cities. This approach can help governments better understand ecological security and improve the efficiency of capital allocation to advance the transformation of resource-exhausted cities.
2 Ecological Security Evaluation Algorithm
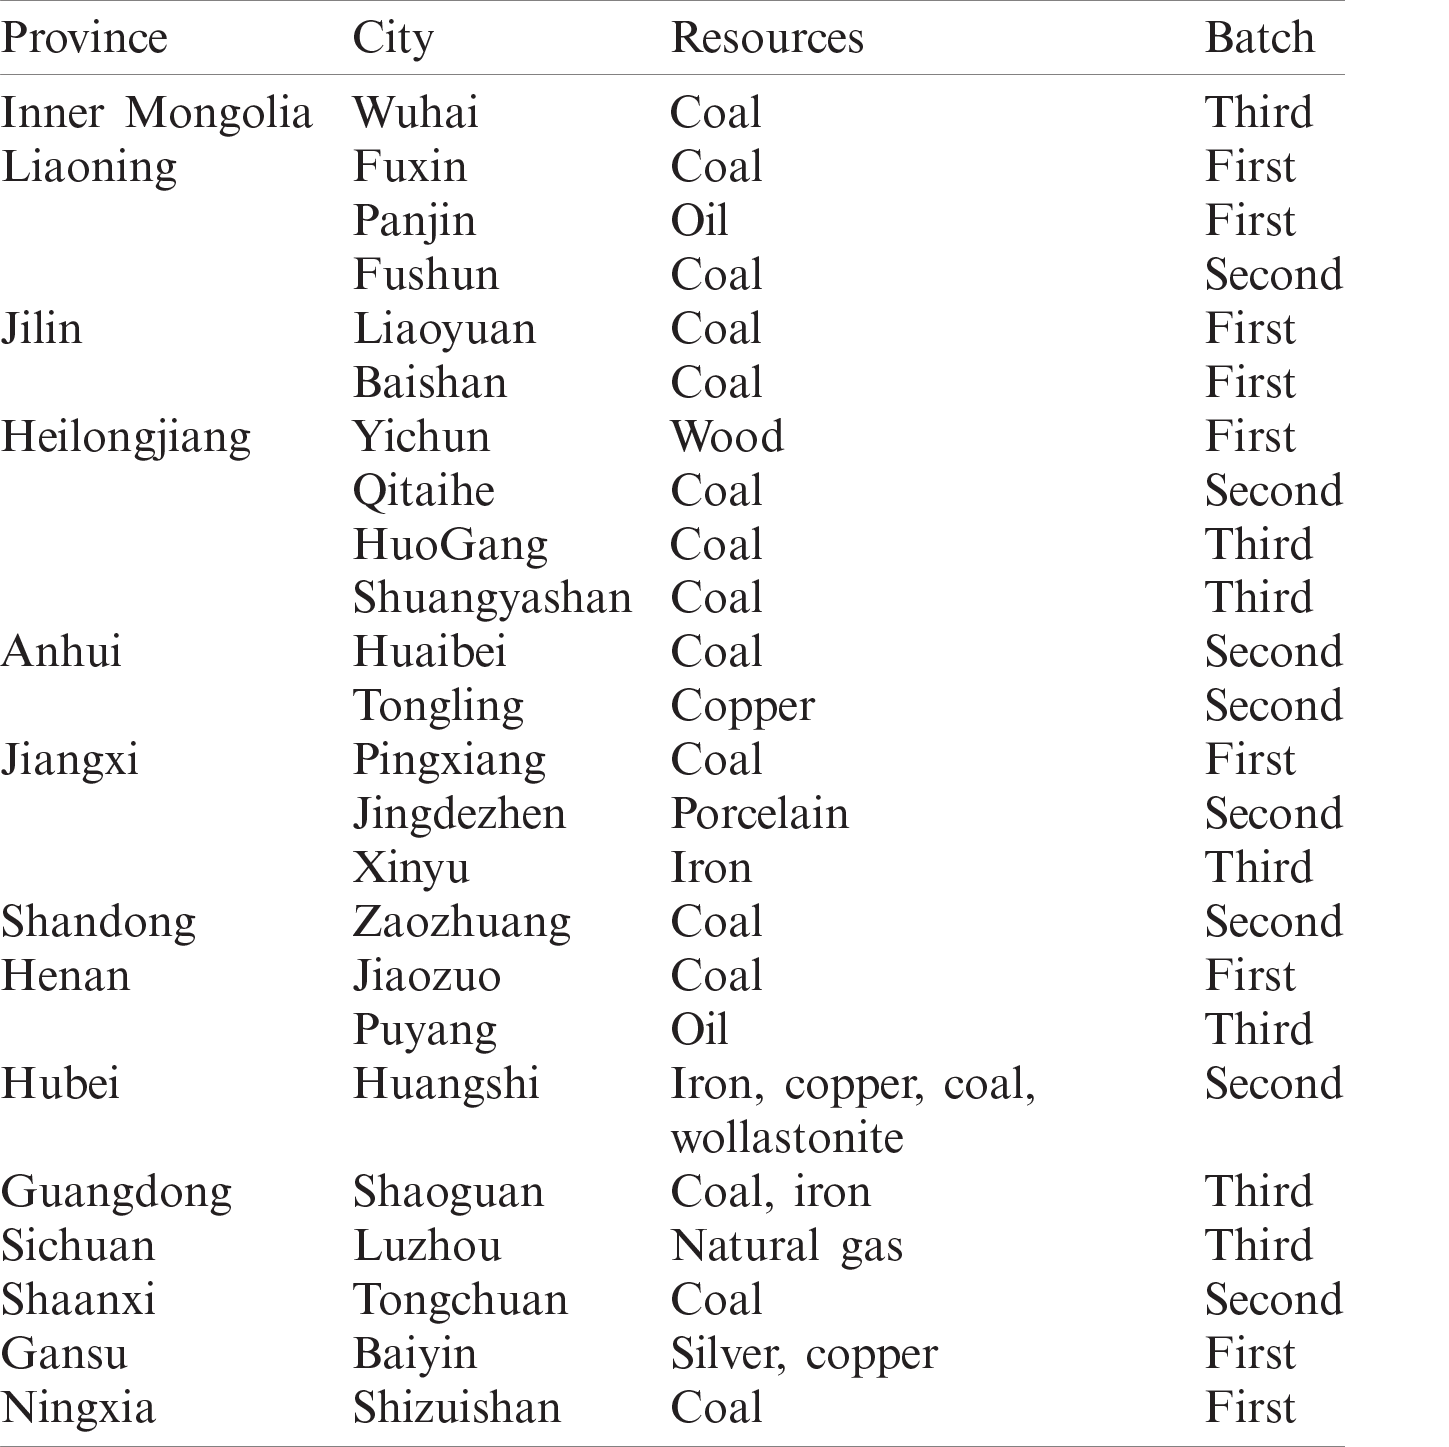
The State Council of China publishes a list of resource-exhausted cities, which are assessed by the National Development and Reform Commission, the Ministry of Land and Resources, and the Ministry of Finance. China identified 69 resource-exhausted cities (counties and districts) in 2008, 2009, and 2012, of which 24 were prefecture-level cities. Given their broader geographical spaces and more complete ecosystems, prefecture-level cities were taken as this study’s research object. Fuxin, Panjin, and Fushun were excluded due to a lack of data. In all, 21 resource-exhausted prefecture-level cities in China were selected for investigation (Tab. 1).
Table 1: List of resource-exhausted prefecture-level cities in China
2.2 Evaluation System Construction
2.2.1 Evaluation Model Selection
This research adopted the PSR model, which was jointly proposed by the OECD (Organization for Economic Cooperation and Development) and UNEP (United Nations Environment Program) based on research performed in Canada in the 1980s. In PSR, a certain type of environmental problem can be expressed by three different but interrelated types of indicators: the pressure indicator (P) reflects the load on the environment caused by human activity; the state indicator (S) reflects the status of environmental quality, natural resources, and ecosystems; and the response indicator (R) characterizes measures taken in the face of environmental problems [12].
2.2.2 Evaluation Indicator Selection
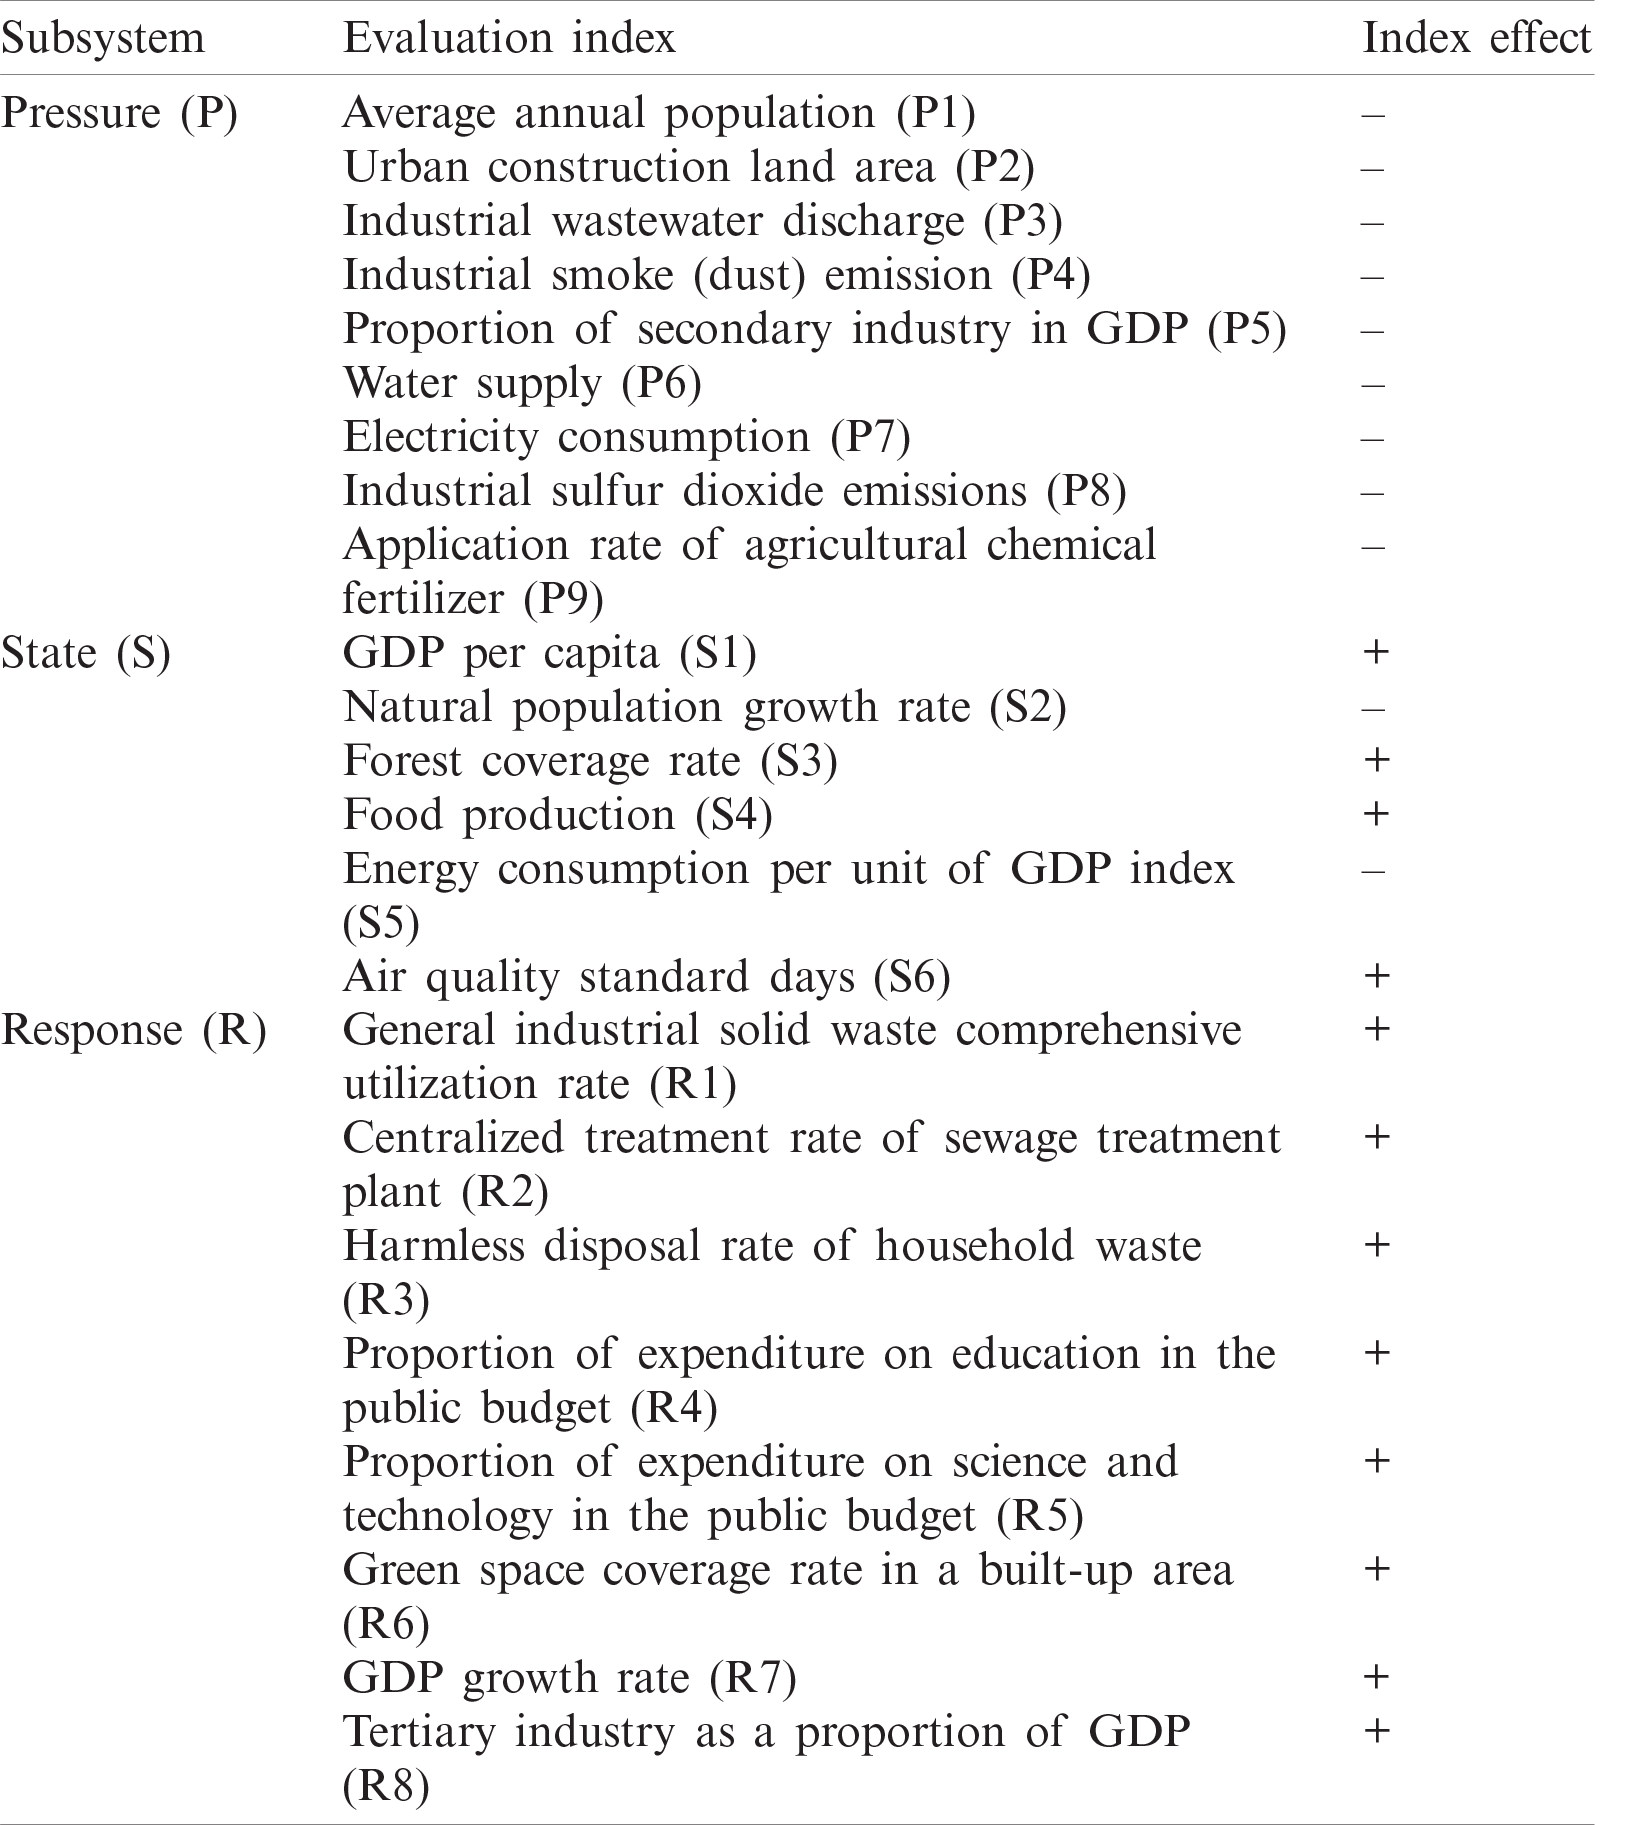
The following were considered in the selection of evaluation indicators: the characteristics of ecological security of China [13–15], commonly used indicators for ecological security evaluation, and data availability. China’s ecological security crisis is currently focused on four main issues: land resources, water resources, atmospheric resources, and biological species [16]. We also added economic, population, and social development indicators. We chose 9 pressure (P) indicators, 6 state (S) indicators, and 8 response (R) indicators, for a total of 23 indicators in all (Tab. 2).
Table 2: Ecological security evaluation model framework for resource-exhausted cities in China
2.3 Data Sources and Processing
The data came from the China City Statistical Yearbook, provincial economic yearbooks, municipal statistical yearbooks, and municipal statistical bulletins for 2011–2017.
(1) Data standardization
Indicator weighting is an important part of ecological security evaluation, and data standardization is the precondition for weight determination. Since the effects and magnitudes of the indicators in the evaluation system are different, the raw data for each indicator must be standardized for comparison. Data can be efficiently processed using a combination of certain identification [17], calculation [18], optimization [19,20], and evaluation [21] methods. Here, we selected the min-max standardization method to standardize the raw data and eliminate dimensionality.
The effects of indicators were divided into positive and negative. The higher the positive value effect, the safer the city. The standardized indicator calculation formula is as follows:
The smaller the negative effect, the safer the city. The standardized calculation formula is as follows:
where
(2) Indicator empowerment
To obtain more accurate evaluation results, we used a more objective coefficient of variation method for weighting. The coefficient of variation of each indicator was calculated as follows:
where
The weight of each subsystem is:
where
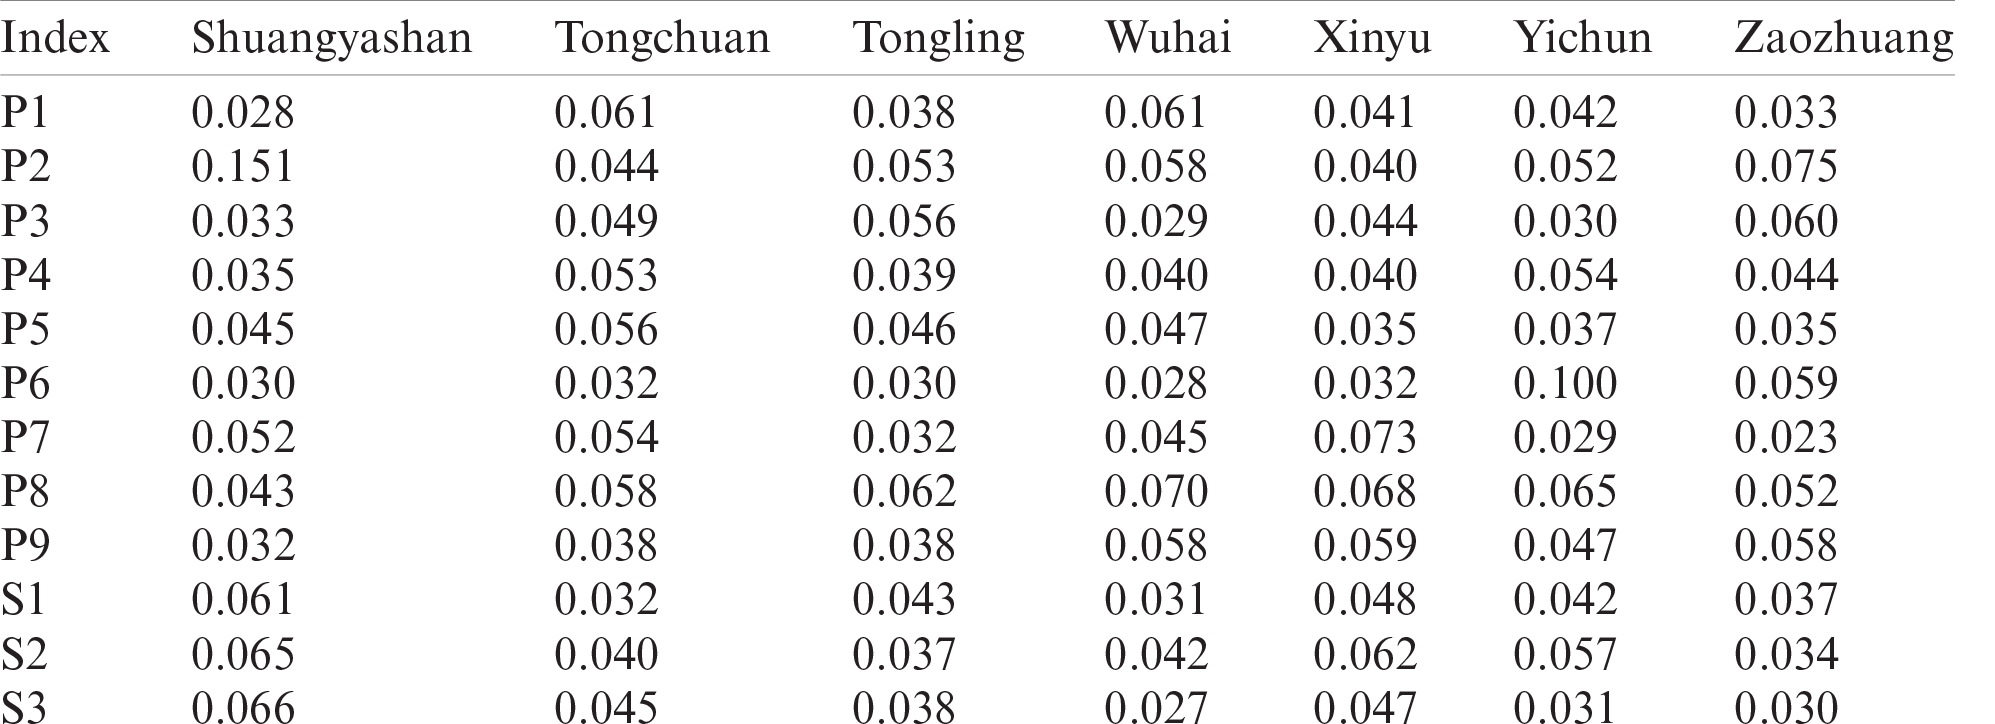
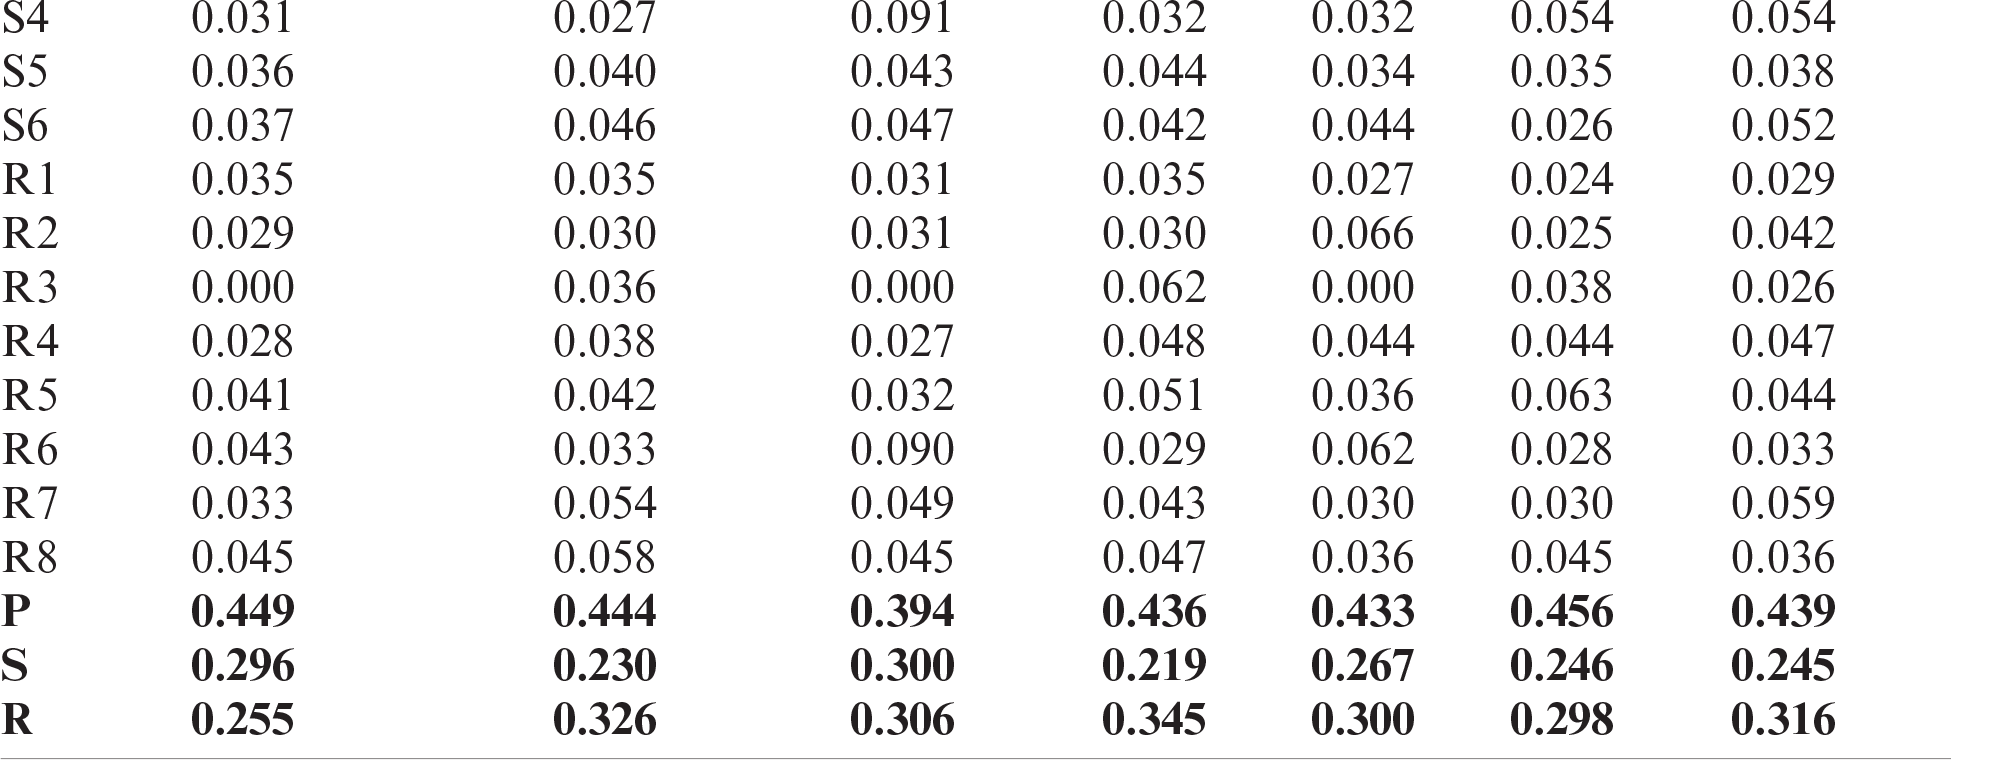
Using the method detailed above, we calculated the weights of the 23 indicators for the 21 resource-exhausted cities and the weights of the 3 subsystems of pressure (P), state (S), and response (R) (Tabs. 3–5).
2.4 Calculation of Ecological Security Index
The ecological security index reflects the state of ecological security, which is the sum of the product of the standardized value of each index and its weight. The calculation formula is as follows:
Table 3: Ecological security evaluation index weights for 21 resource-exhausted prefecture-level Chinese cities, 2011–2017
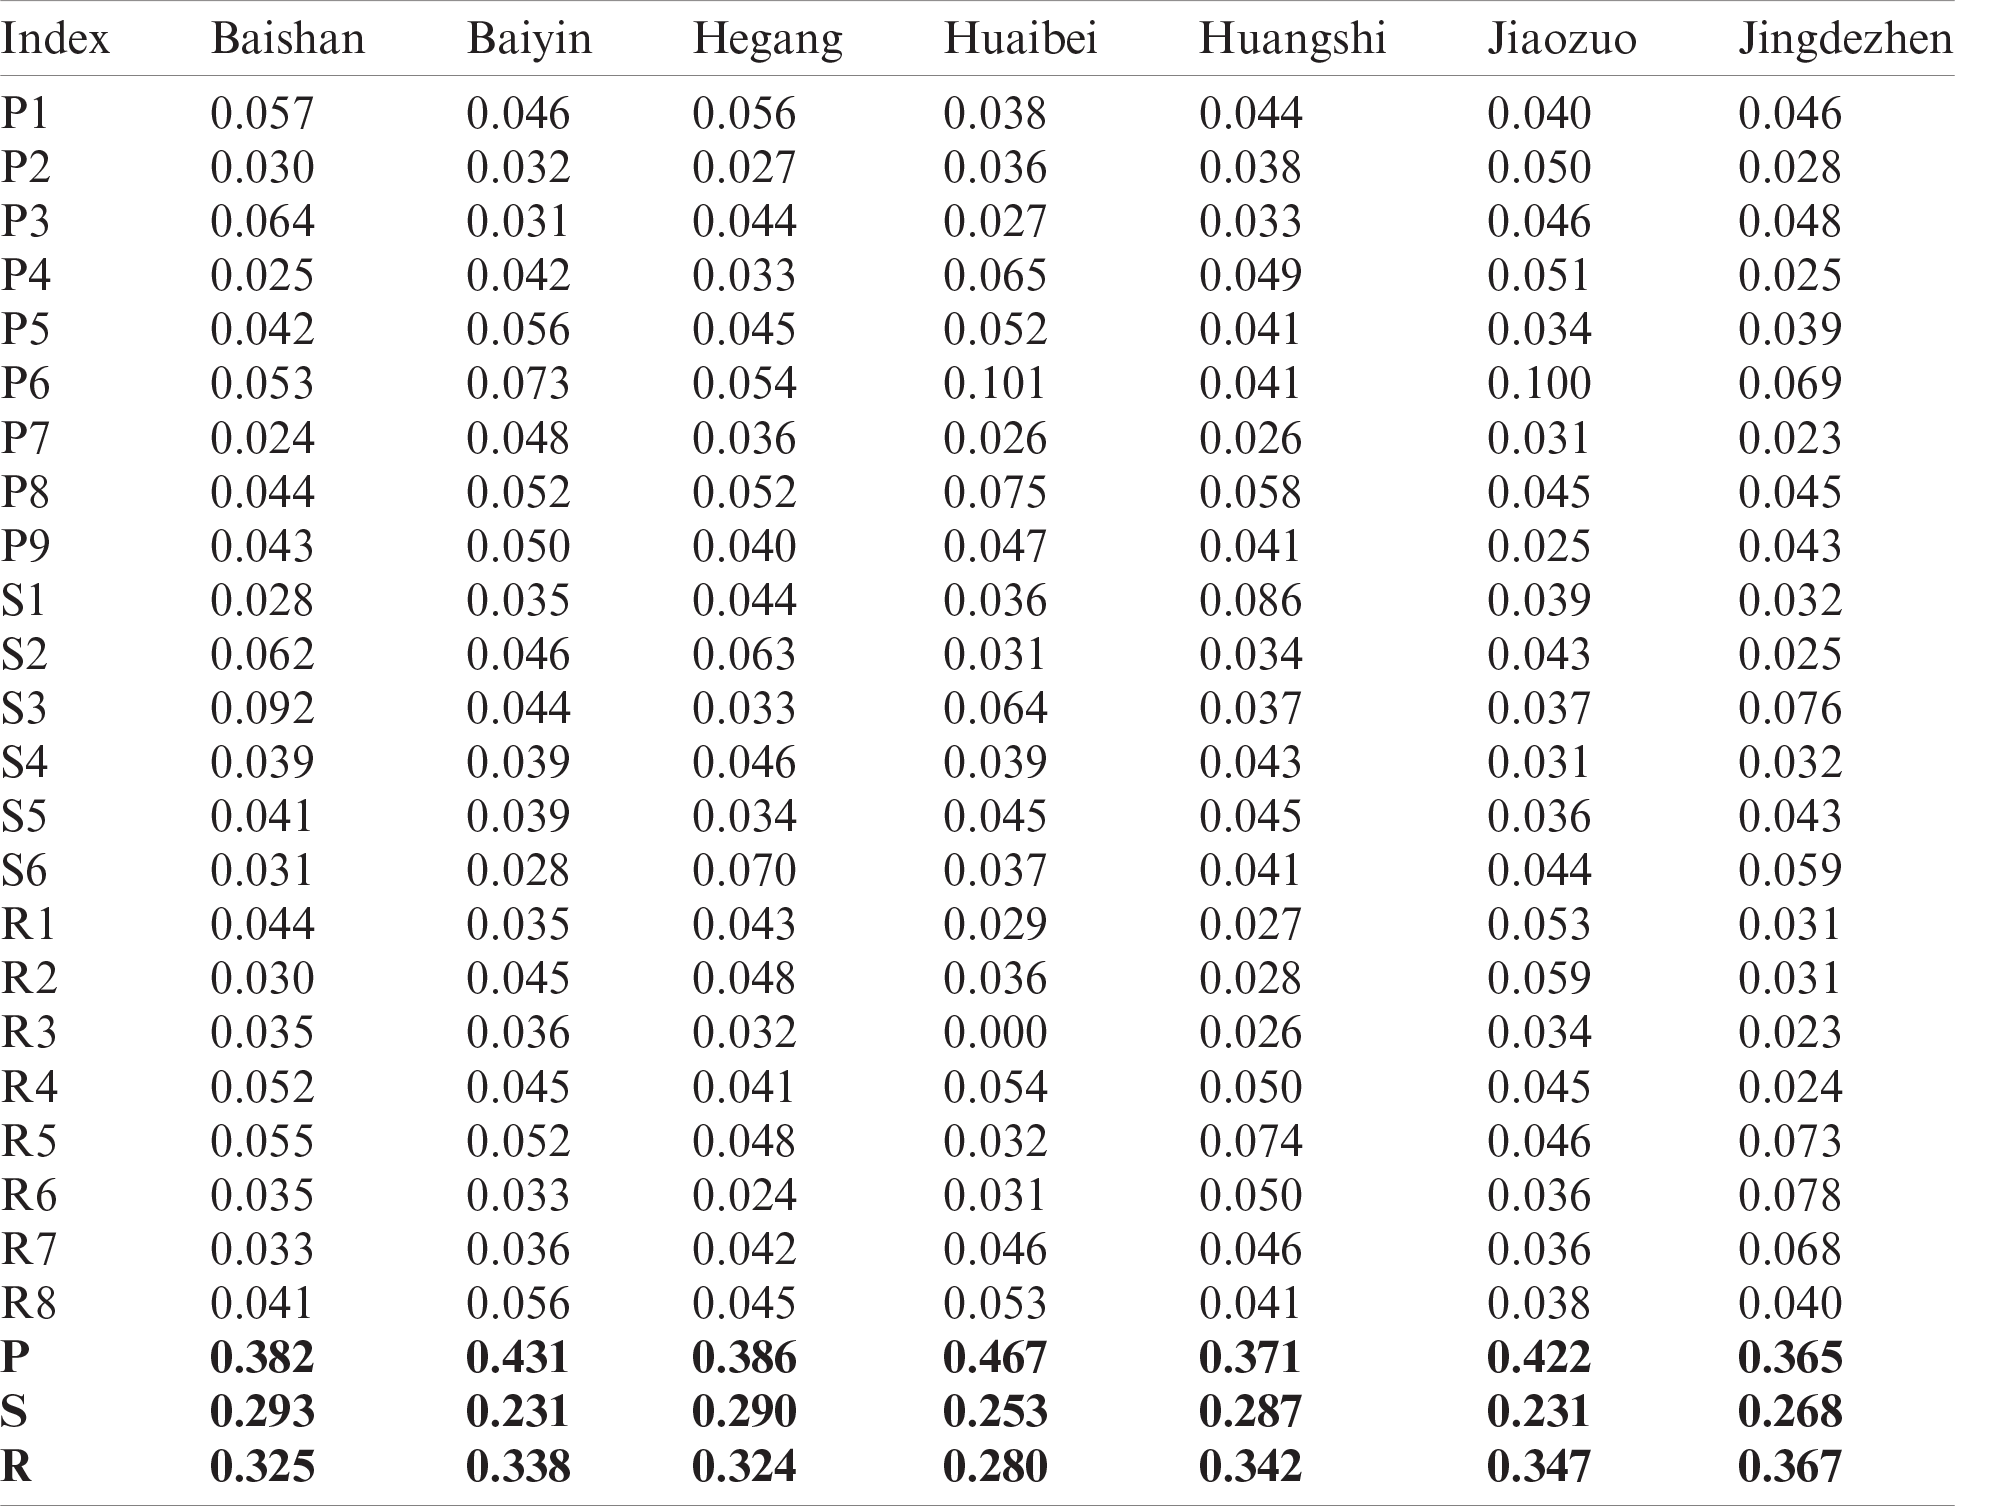
Table 4: Ecological security evaluation index weights for 21 resource-exhausted prefecture-level Chinese cities, 2011–2017
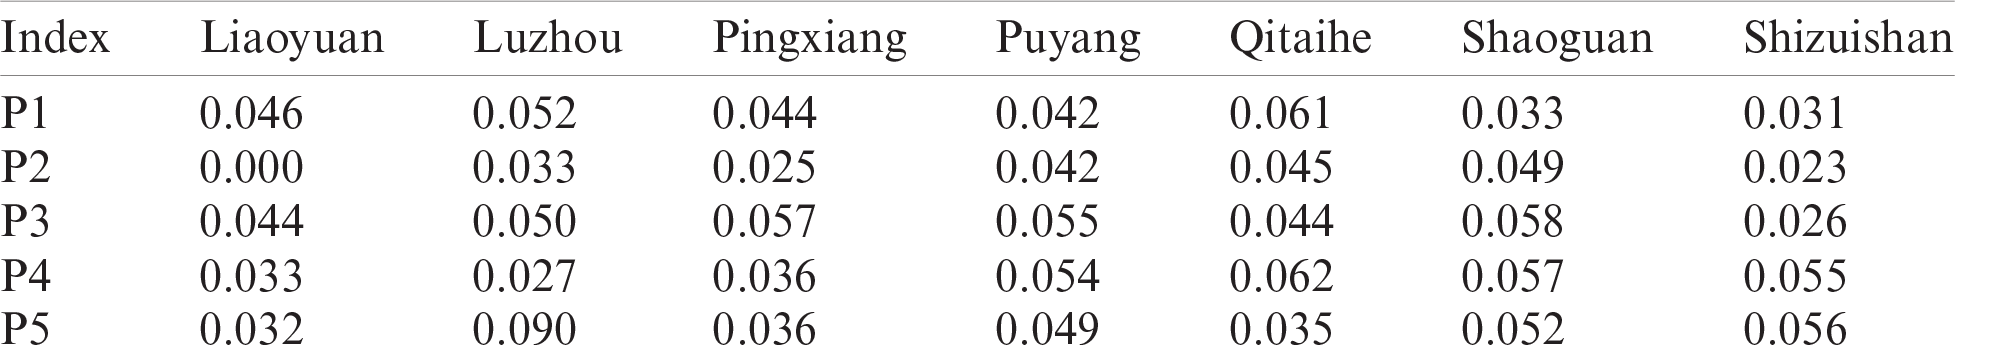
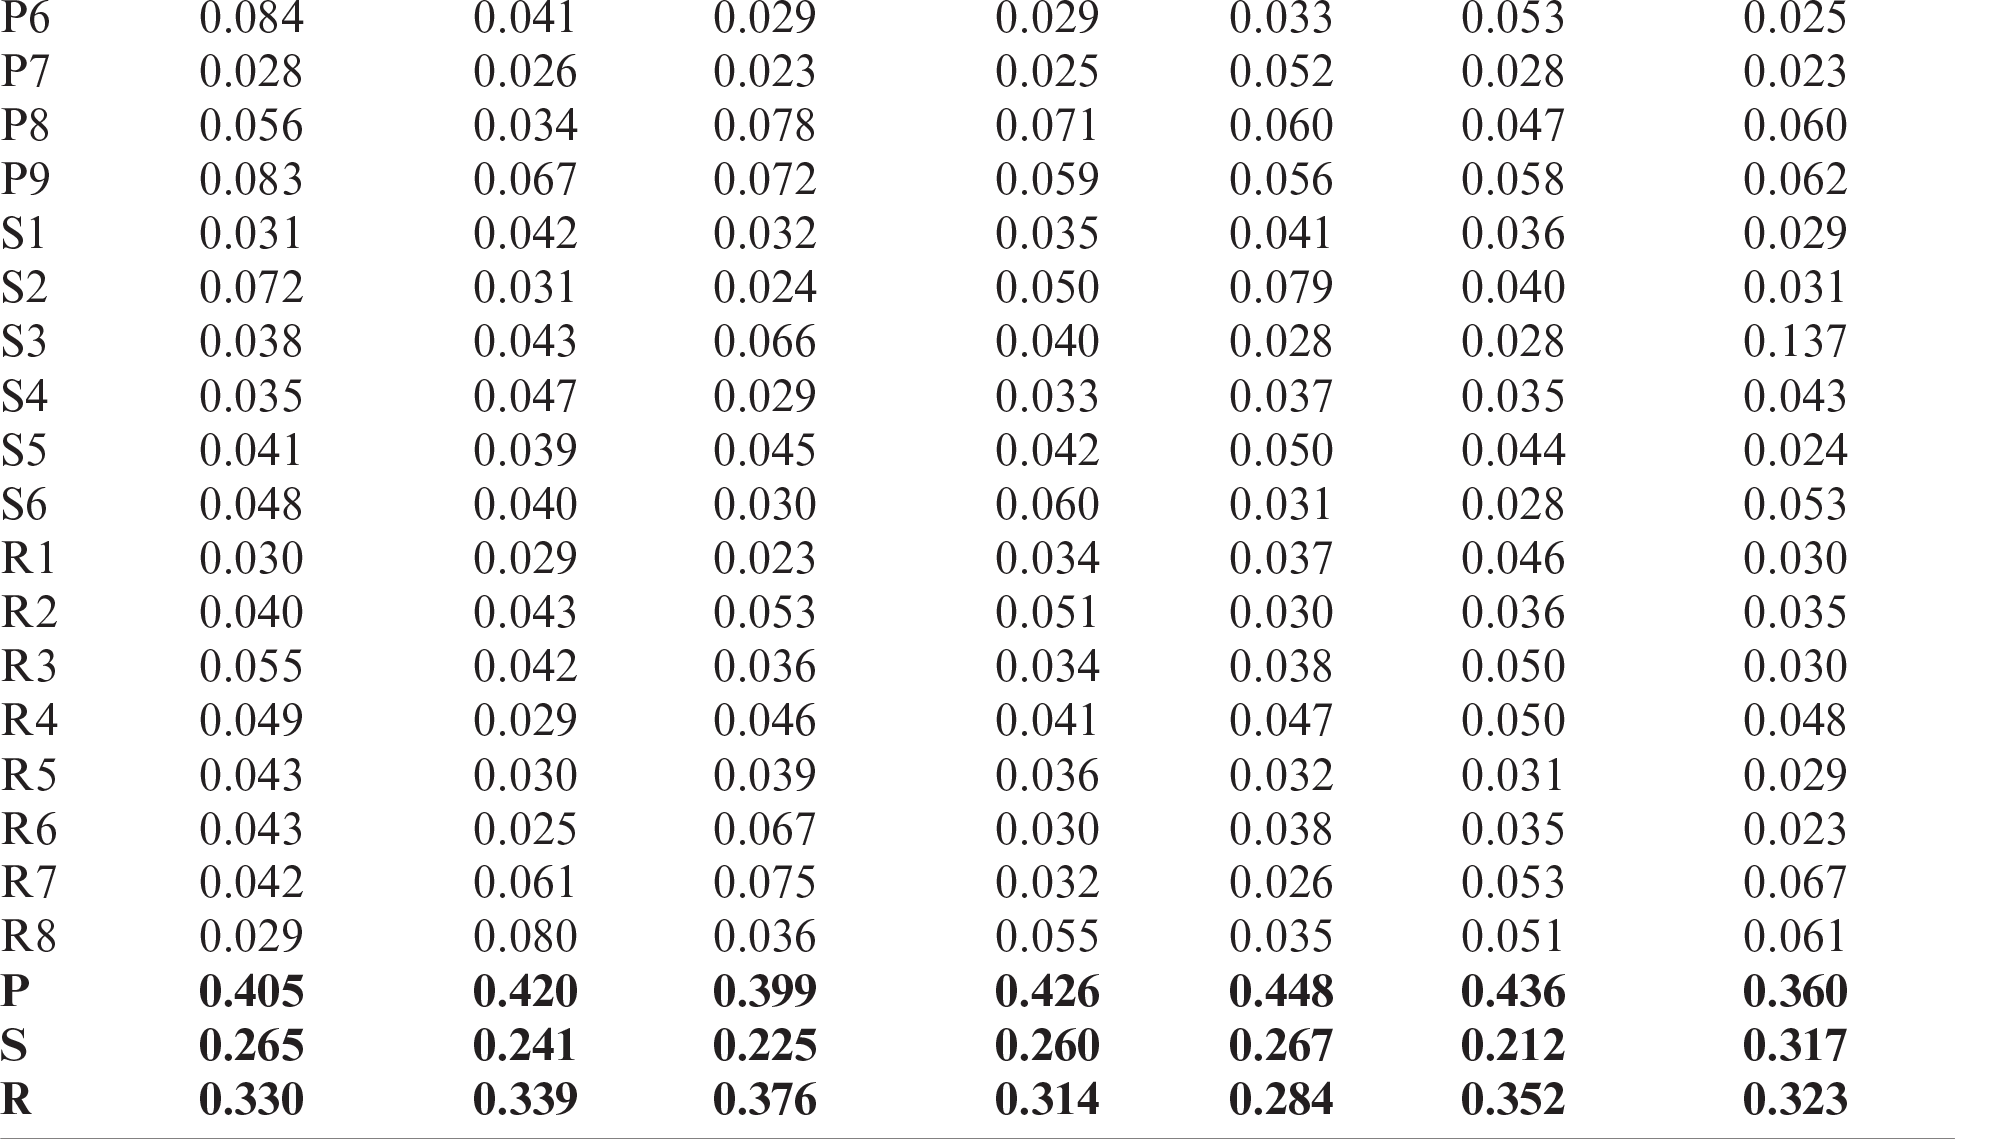
Table 5: Ecological security evaluation index weights for 21 resource-exhausted prefecture-level Chinese cities, 2011–2017
where
The ecological security index of the 21 cities was obtained based on the above formula, which can be seen in Algorithm 1. An index closer to 1 means safer while closer to 0 means less safe. To distinguish the degree of ecological safety, the index needs to be graded. Based on related studies [5,9,10,22], we divided the 21 cities’ ecological safety indexes into five levels: serious danger (0.0–0.3), danger (0.3–0.45), early warning (0.45–0.55), relative safety (0.55–0.7), and safety (0.7–1.0).
Using Algorithm 1, the ecological safety index and ranking status of each resource-exhausted city from 2011 to 2017 could be obtained, along with its ecological safety level.
2.5 Evaluation Index Calculation of Ecological Security Evolution Trend
This study’s ecological security evaluation index reflects the evolution trend of ecological security. It is the sum of the products of the corresponding indicators of the P, S, and R subsystems and the weight of each subsystem. The calculation formula is as follows:
where
2.6 Calculation of Ecological Security Evaluation Index Contribution
In the prior section, the coefficient of variation method was implemented to calculate the weight of every indicator, reflecting the contribution of each indicator to ecological security. This can provide an important basis for governments to diagnose ecological security issues. We sorted the index weights in each city’s ecological security evaluation system in order of numerical value and calculated the cumulative weights to draw a Pareto chart [25], which demonstrates the key indicators of ecological security. Sorting the average value of the indicator weights of the 21 cities and calculating the cumulative weights reflects the importance and cumulative contribution of every indicator.
The changes in the ecological security indexes of the 21 resource-exhausted Chinese cities from 2011 to 2017 were acquired using the above-mentioned methods. Then, the security levels were classified, as shown in Figs. 1–7.
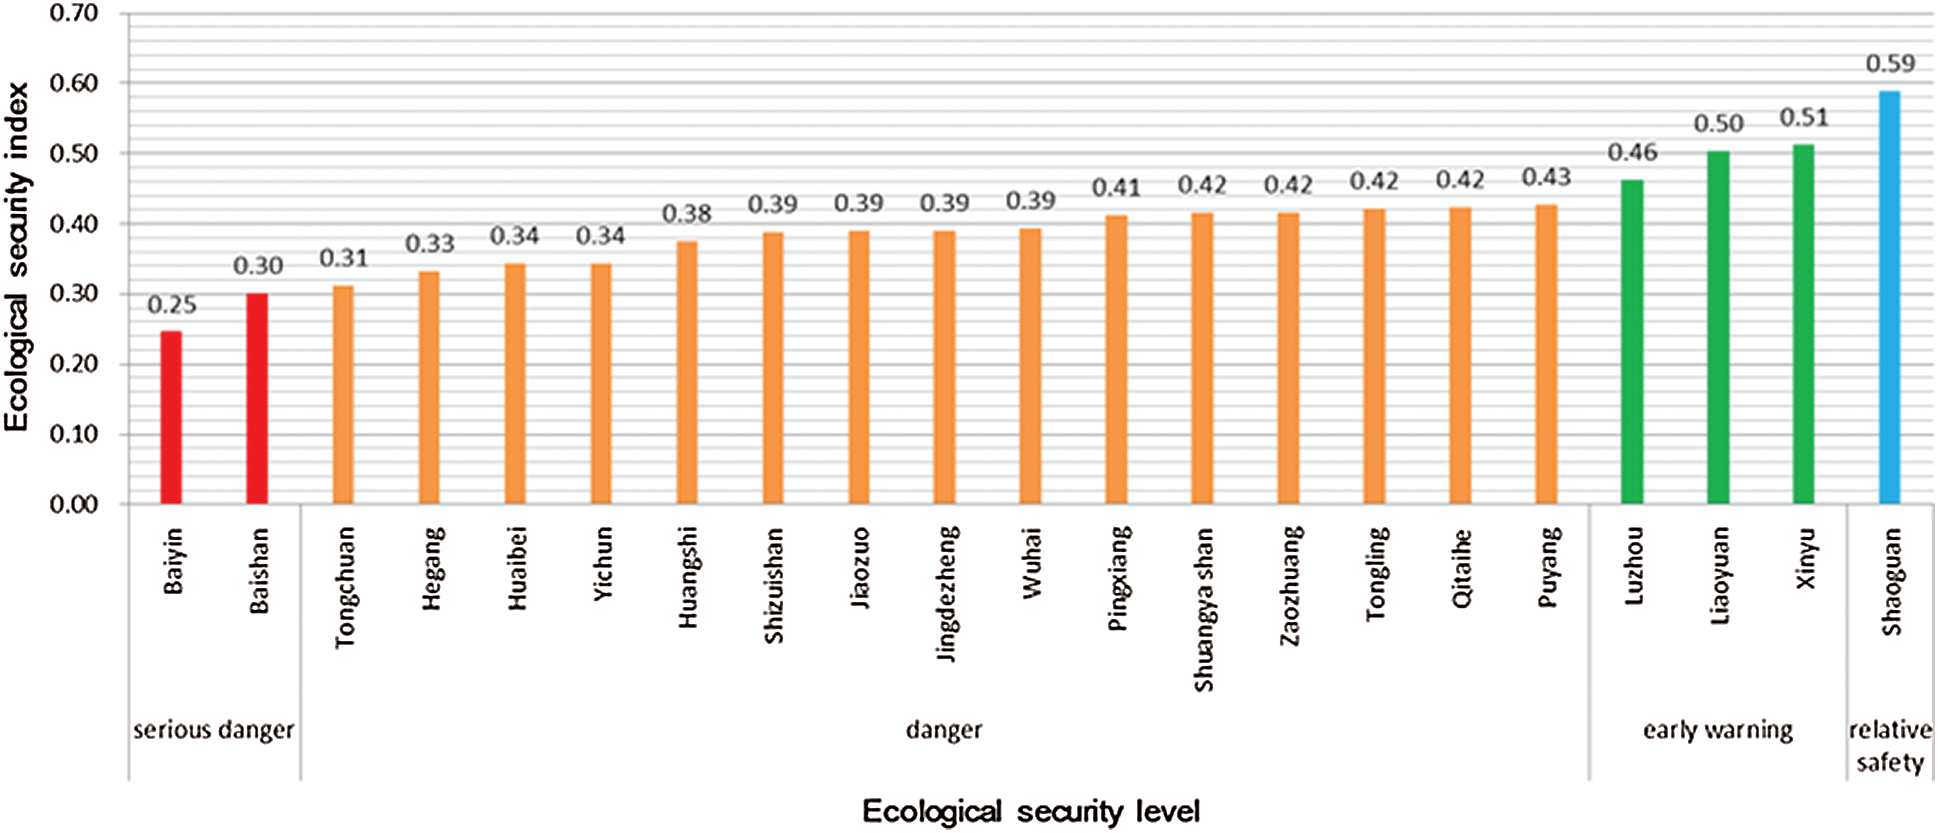
Figure 1: Classification of the ecological safety index of 21 resource-exhausted prefecture-level cities in China in 2011
In general, ecological safety indexes were low before 2015, with more than 60% of the cities at unsafe levels. However, the proportion of unsafe cities was substantially reduced in 2016, and the proportion of safe cities increased significantly. In 2017, the proportion of cities at or above the critical safety level reached 100%. In terms of changes in the ecological safety index level, cities at safe levels first appeared in 2017, accounting for 14.3%. For cities with a higher security level, this proportion increased between 2011 and 2012, but there were no cities at this level in 2013 and 2014. The proportion rose sharply after 2015. For cities at critical safety levels, the proportion was 14.3% in 2011 and 2017, and it reached a peak of 47.6% in 2016. For cities at insecure levels—which was the normal state of resource-exhausted cities in China from 2011 to 2015, accounting for about 60%—the proportion decreased significantly after 2016. The proportion of unsafe cities only accounted for 19%, and the proportion was zero in 2017. Regarding extremely unsafe cities, the proportion was at zero for 4 years and then peaked at 9.5% in 2011.
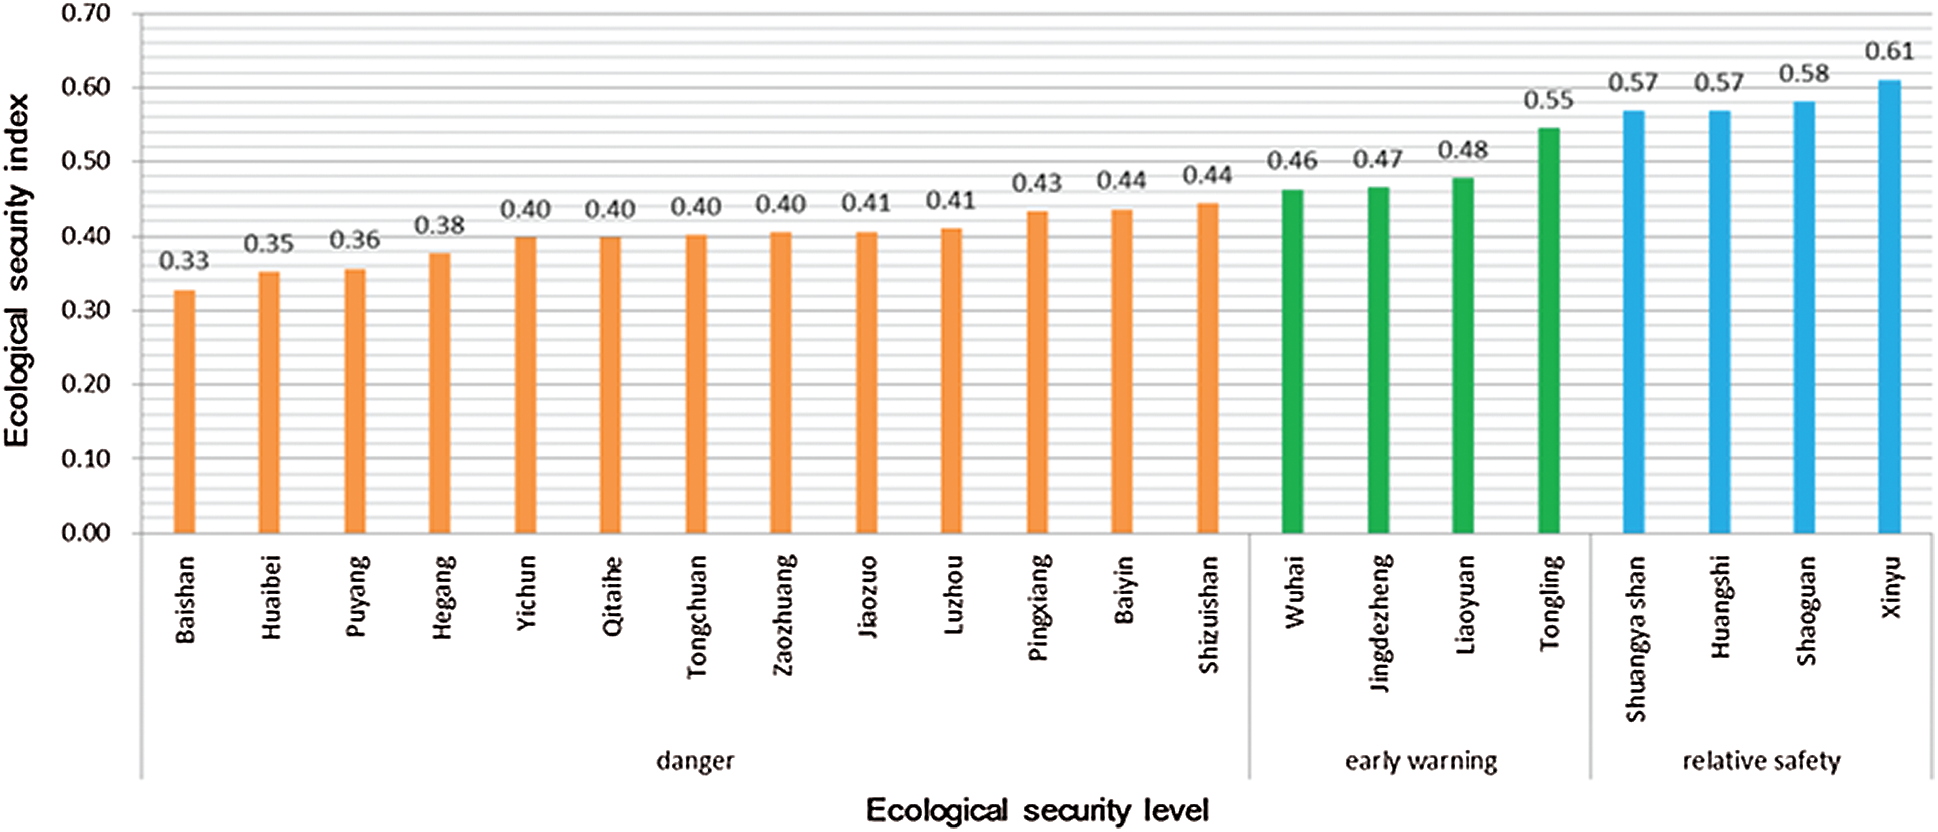
Figure 2: Classification of the ecological safety index of 21 resource-exhausted prefecture-level cities in China in 2012
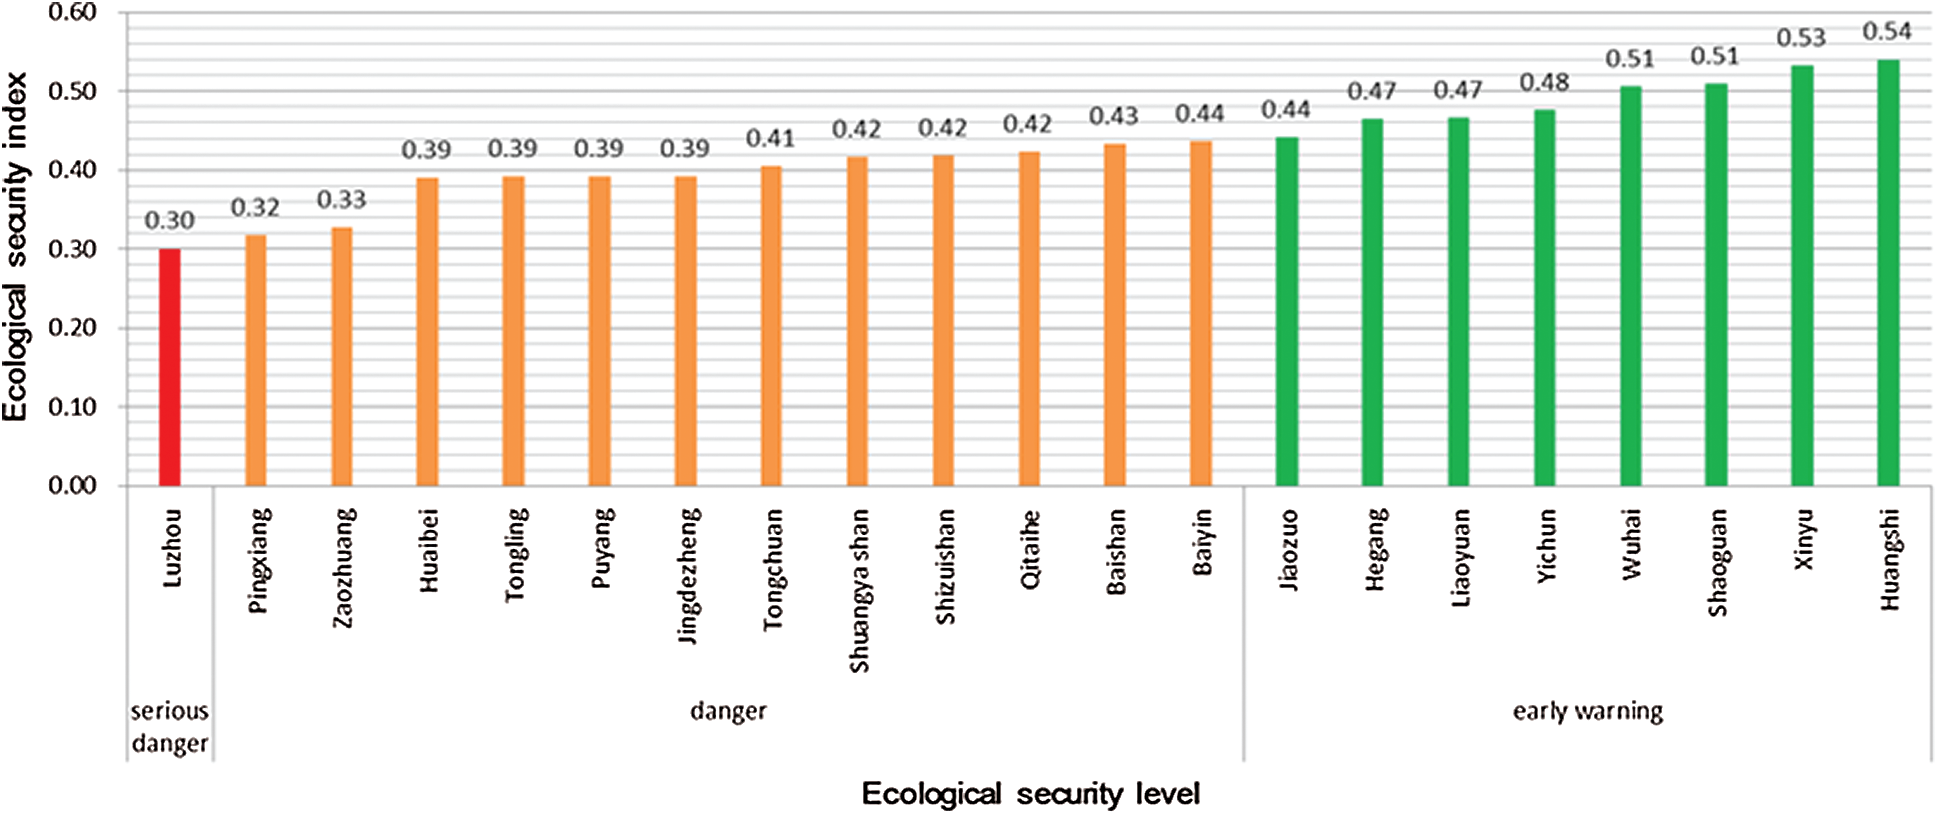
Figure 3: Classification of the ecological safety index of 21 resource-exhausted prefecture-level cities in China in 2013
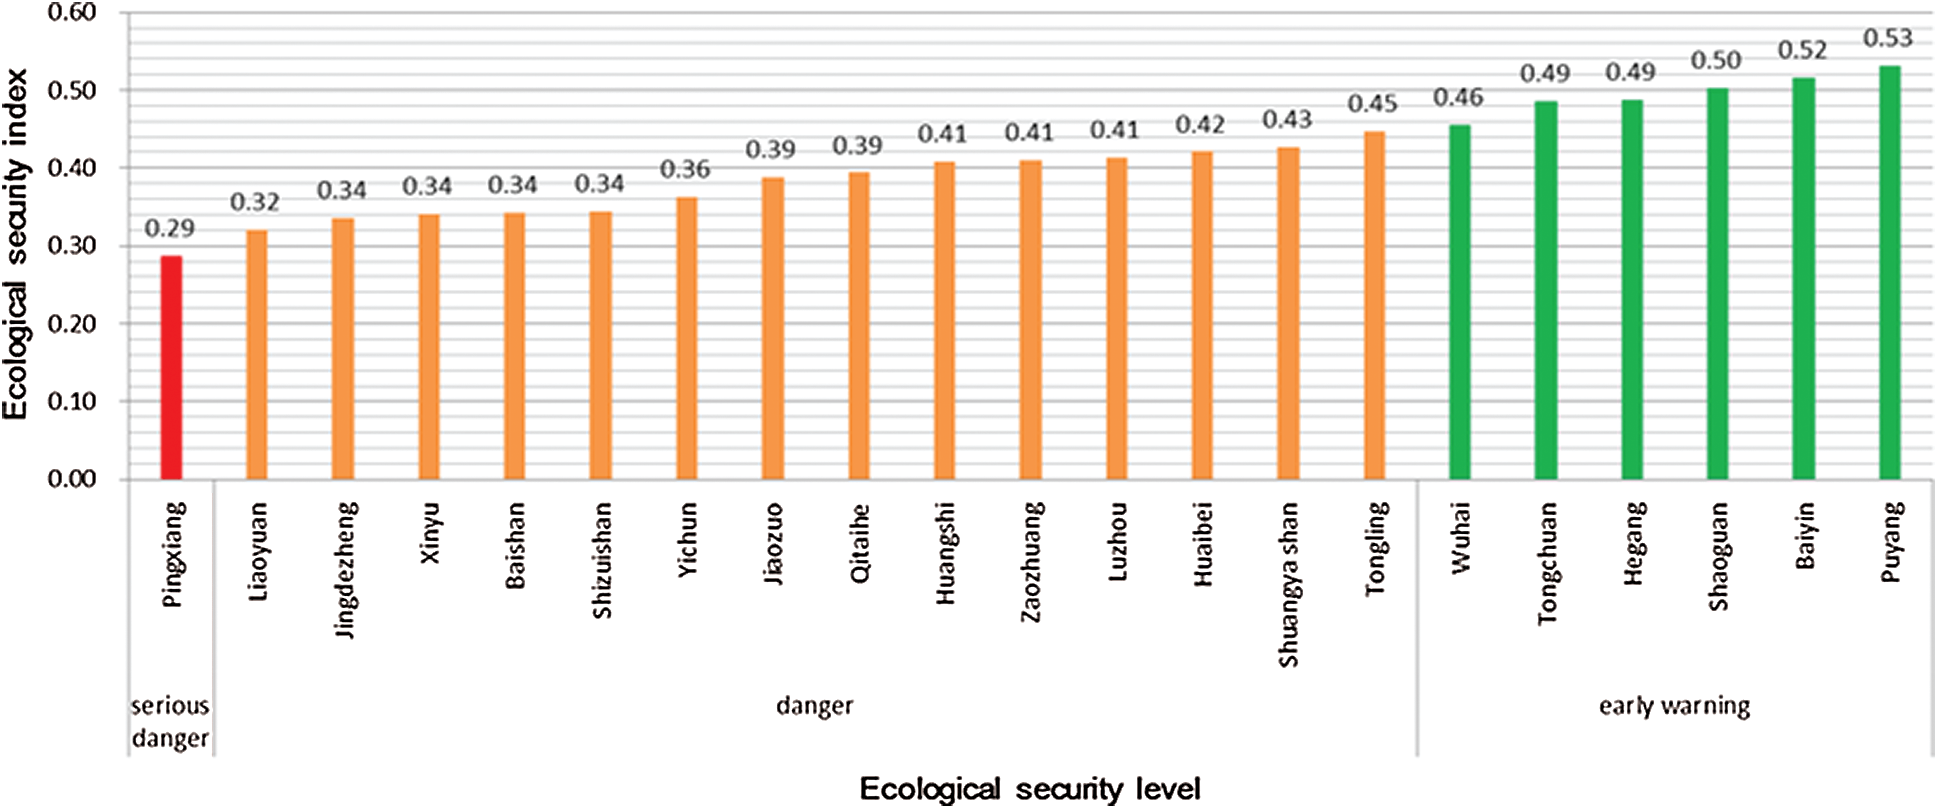
Figure 4: Classification of the ecological safety index of 21 resource-exhausted prefecture-level cities in China in 2014
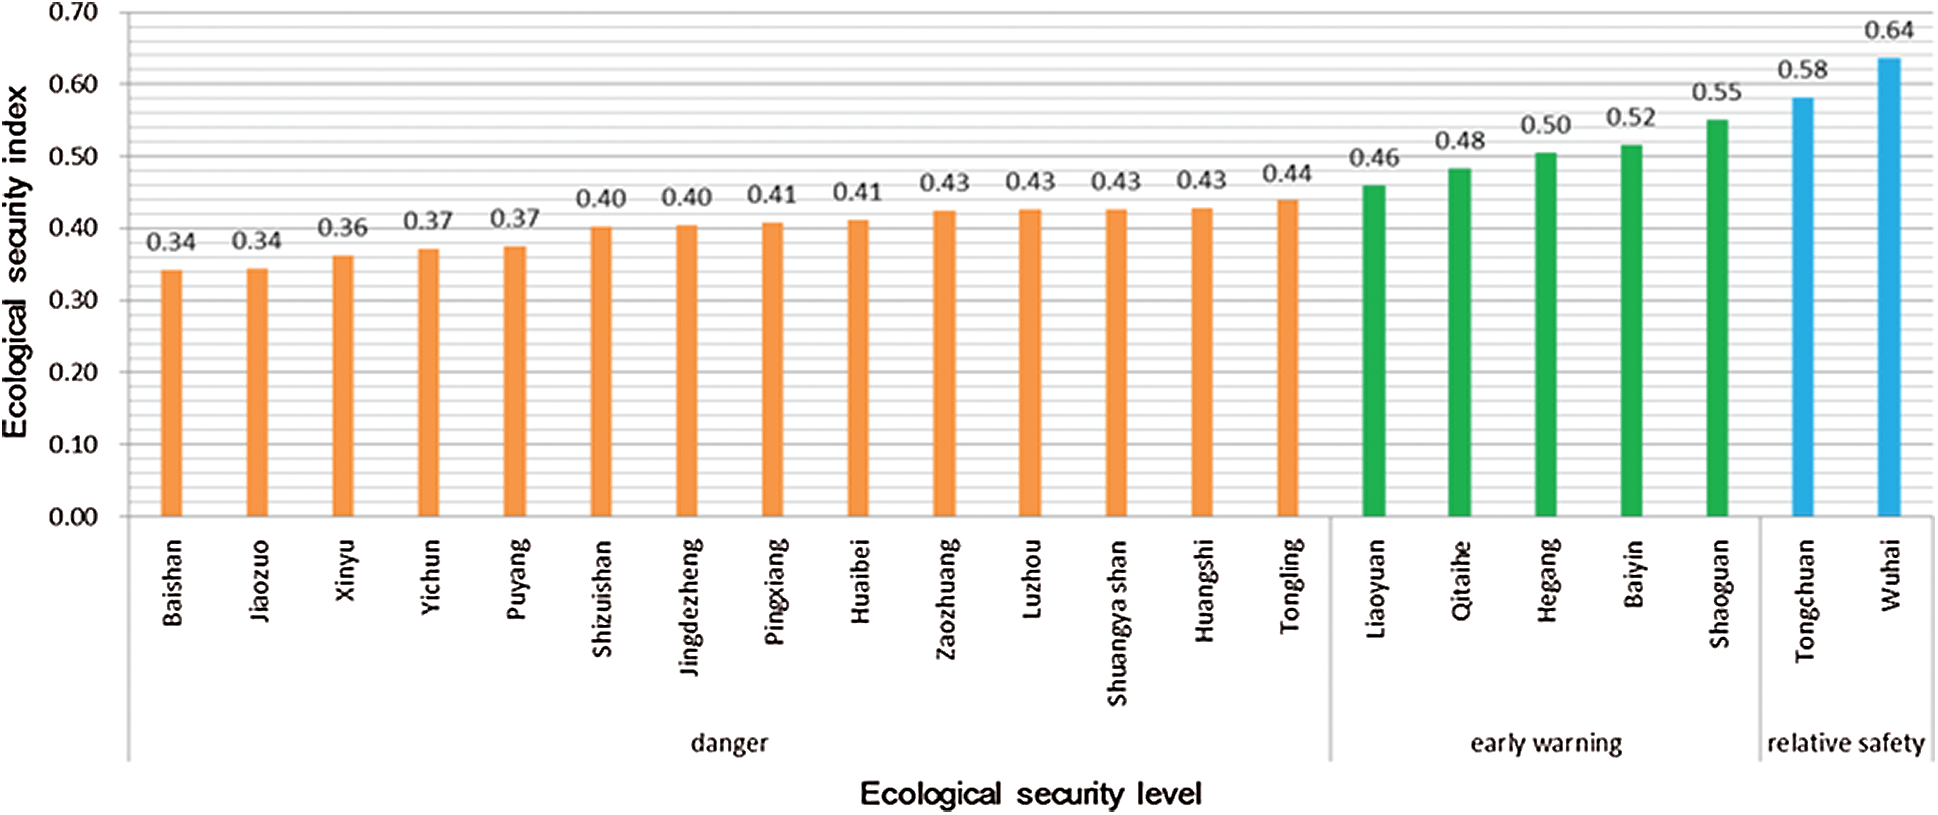
Figure 5: Classification of the ecological safety index of 21 resource-exhausted prefecture-level cities in China in 2015
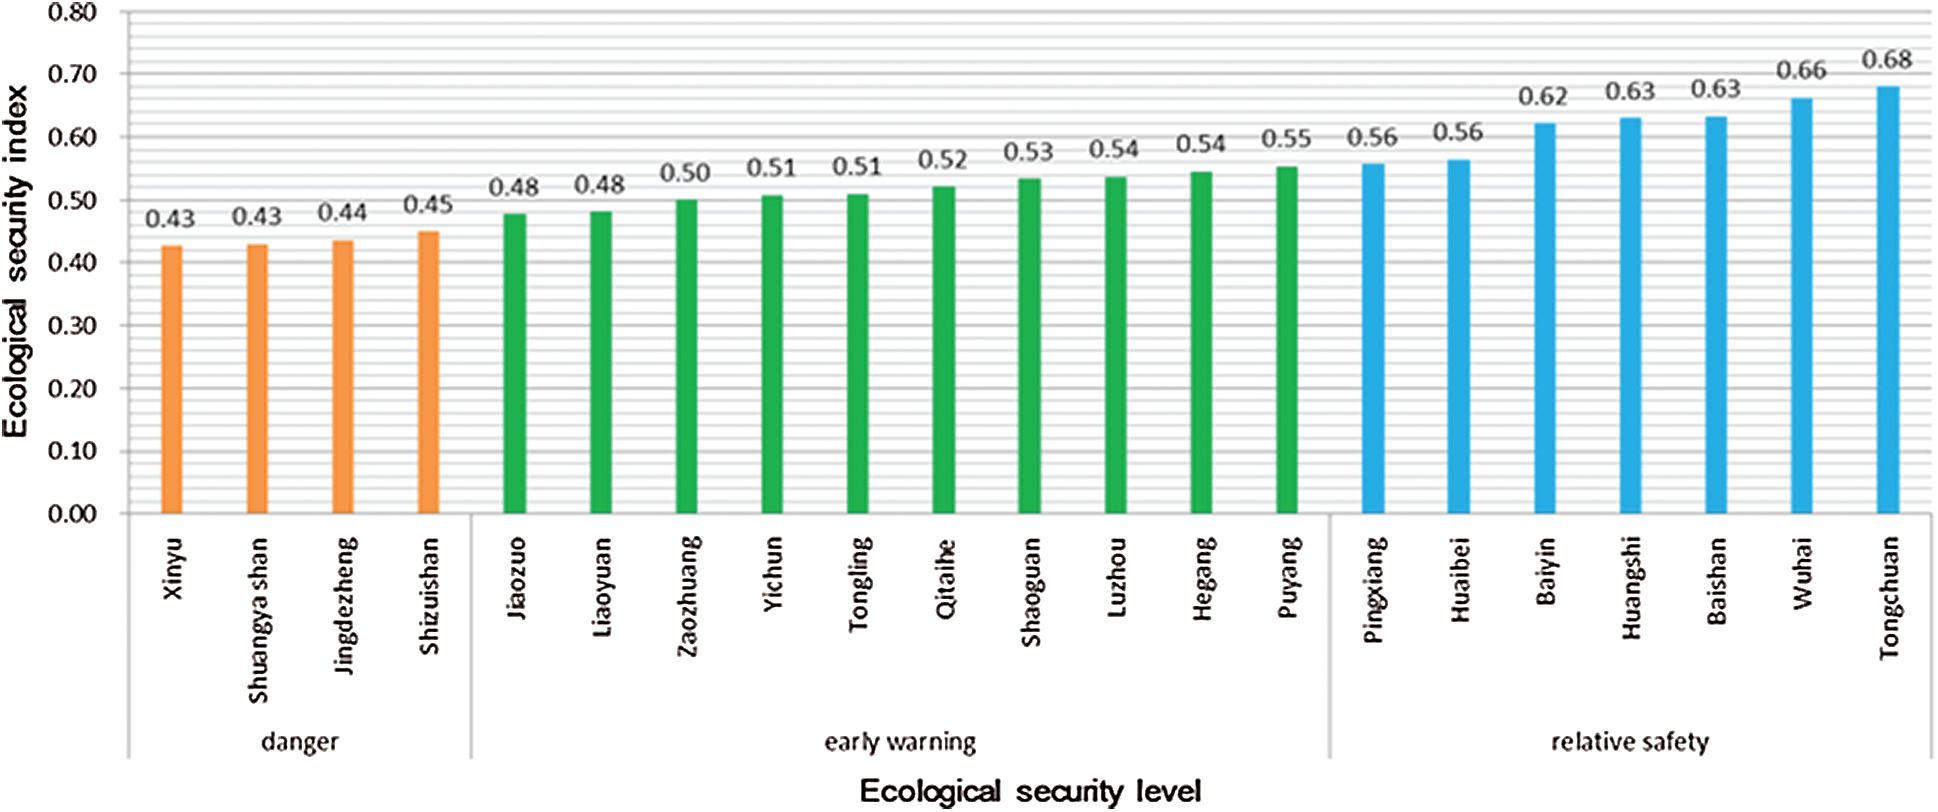
Figure 6: Classification of the ecological safety index of 21 resource-exhausted prefecture-level cities in China in 2016
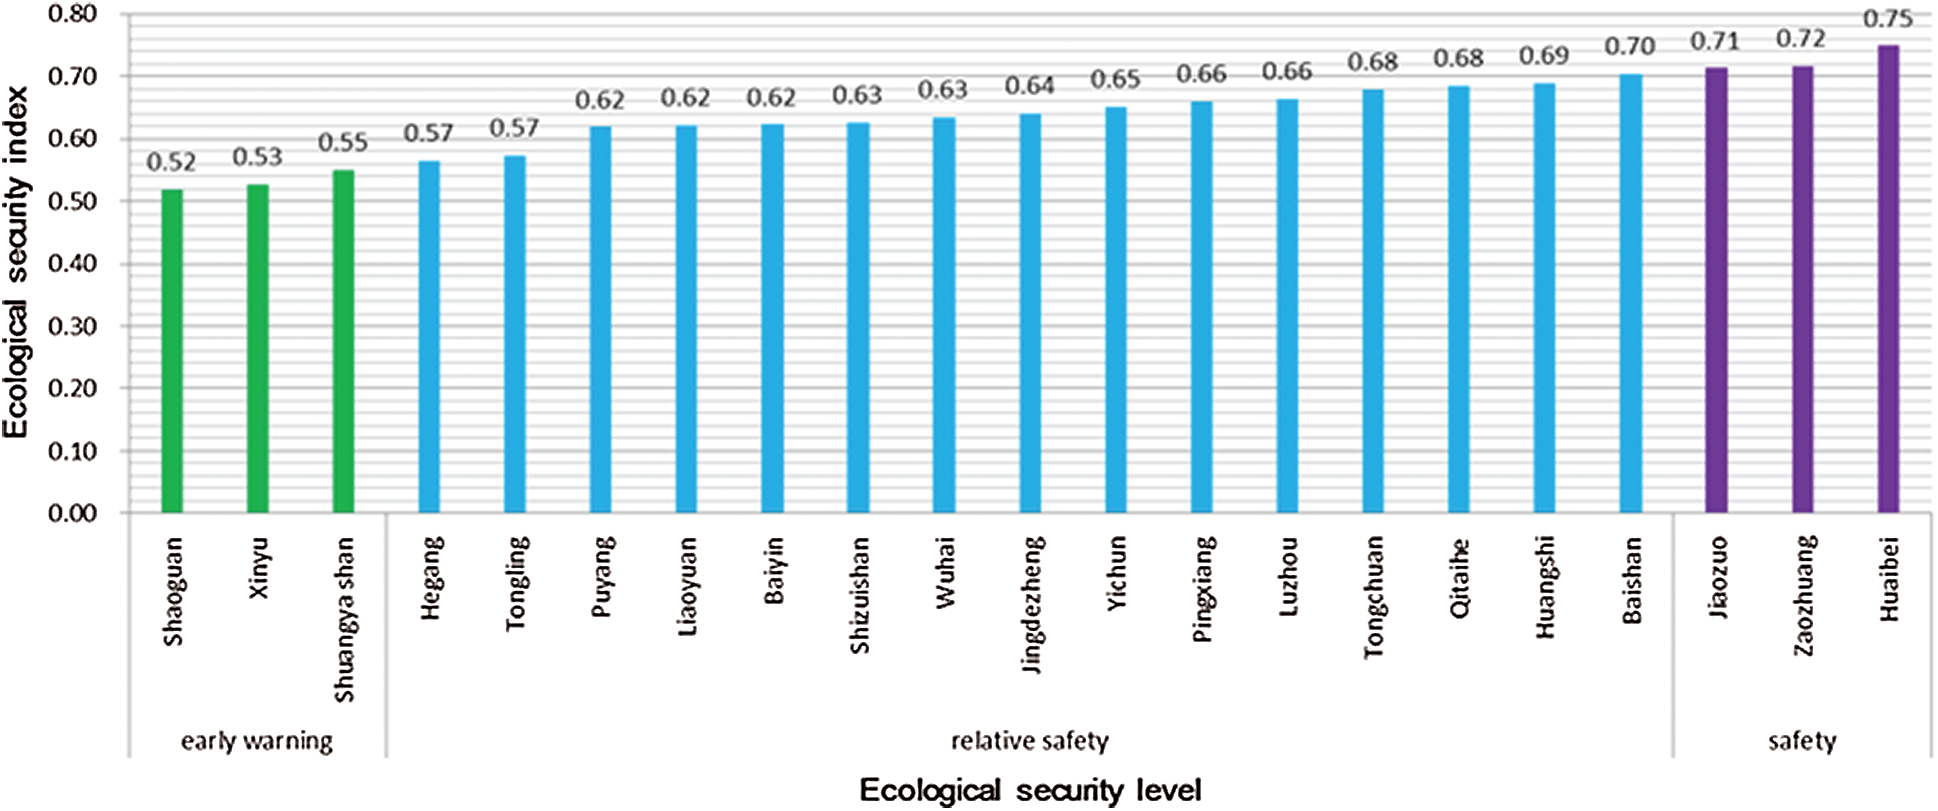
Figure 7: Classification of the ecological safety index of 21 resource-exhausted prefecture-level cities in China in 2017
3.2 Comprehensive Evaluation Index of Ecological Security
The comprehensive ecological safety evaluation indexes of the 21 cities were obtained for each year with the index calculation method. On that basis, we created line graphs and analyzed the trend characteristics of each graph. The graphs can be divided into four types. The first type includes cities with a ladder-shaped upward trend, including Baiyin, Hegang, Huaibei, and Tongchuan (Fig. 8). The ecological security of those four cities shows an obvious and stable upward trend.
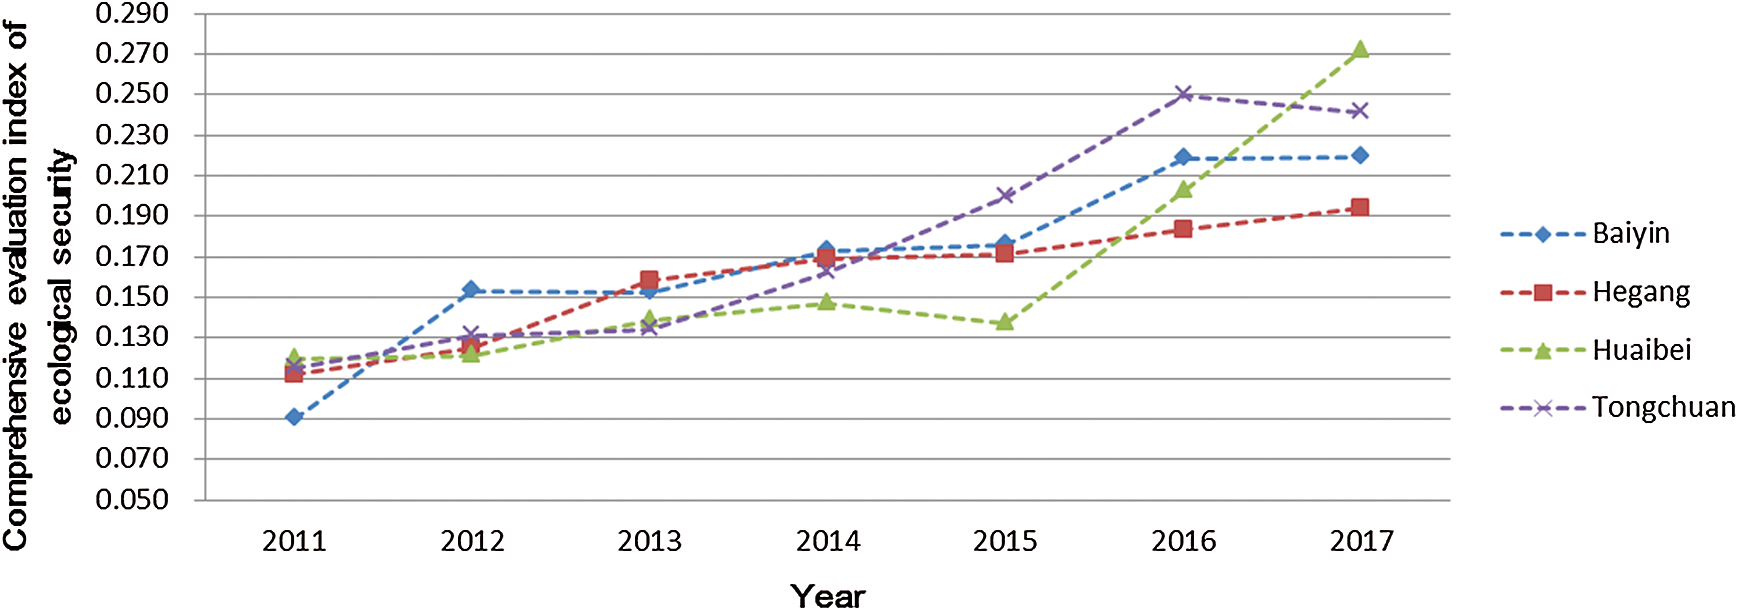
Figure 8: Ecological security trends of Baishan, Hegang, Huaibei, and Tongchuan
The second type shows a wave-shaped upward trend; it includes Baishan, Puyang, Jiaozuo, Qitaihe, Shizuishan, Wuhai, Yichun, Huangshi, and Jingdezhen (Fig. 9). The ecological security of these cities shows an obvious but unstable upward trend.
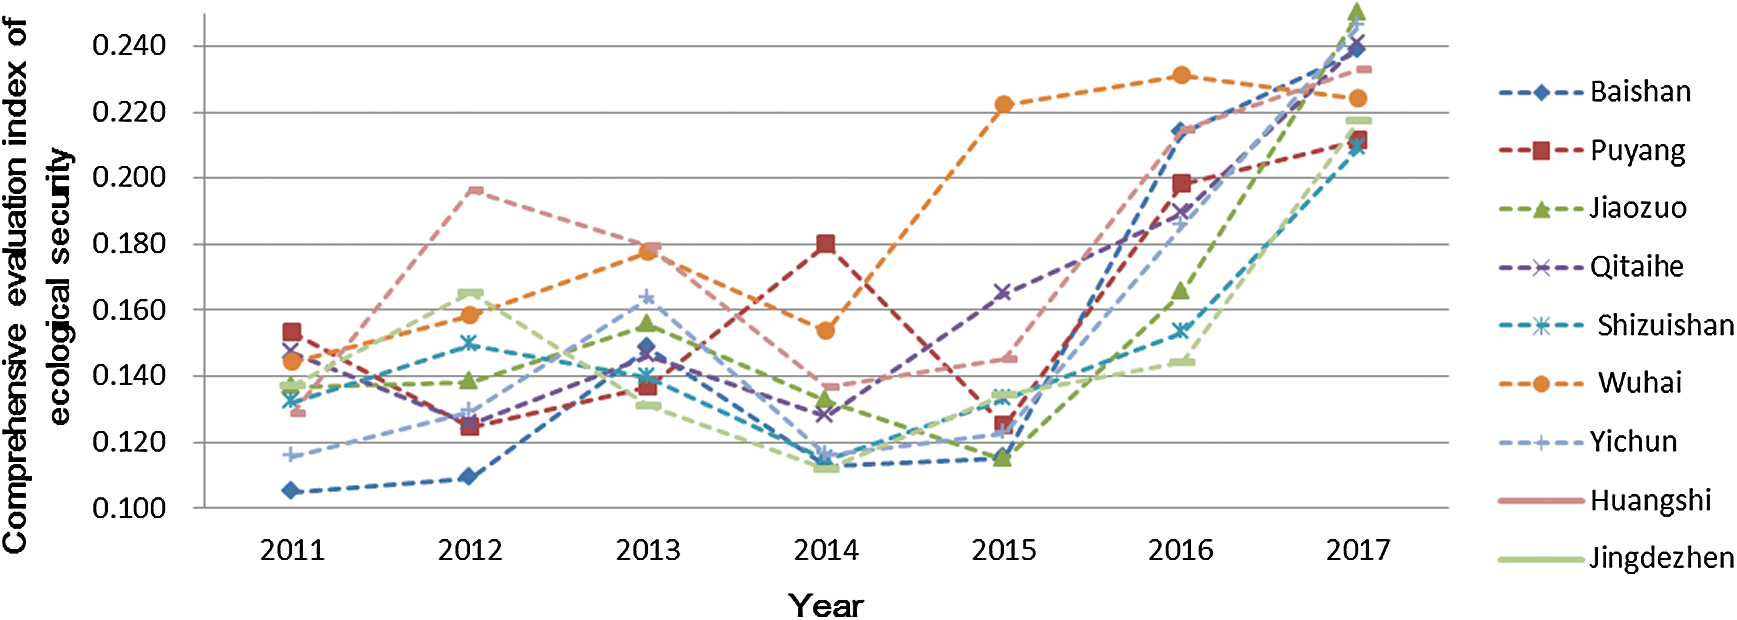
Figure 9: Ecological security trends of Baishan, Puyang, Jiaozuo, Qitaihe, Shizuishan, Wuhai, Yichun, Huangshi, and Jingdezhen
The third type reflects a V-shaped upward trend and includes Liaoyuan, Luzhou, Pingxiang, and Zaozhuang (Fig. 10). Taking 2013 or 2014 as the dividing line, the downward trend is obvious before the line while the upward trend is obvious after it.
The fourth type shows a gentle development trend; this includes Shuangyashan, Tongling, Xinyu, and Shaoguan (Fig. 11). Changes in these cities are relatively flat, and the development trend is not obvious.
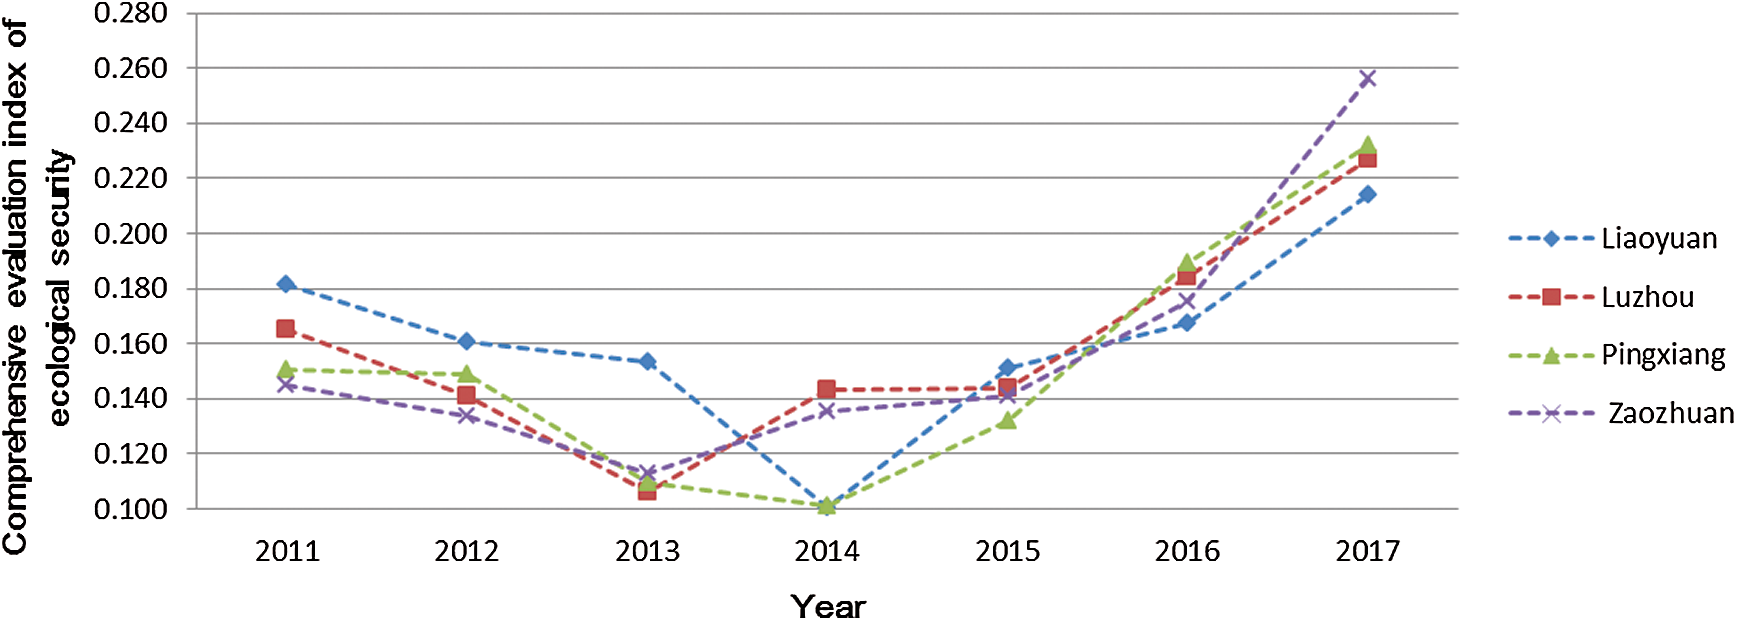
Figure 10: Ecological security trends of Liaoyuan, Luzhou, Pingxiang, and Zaozhuang
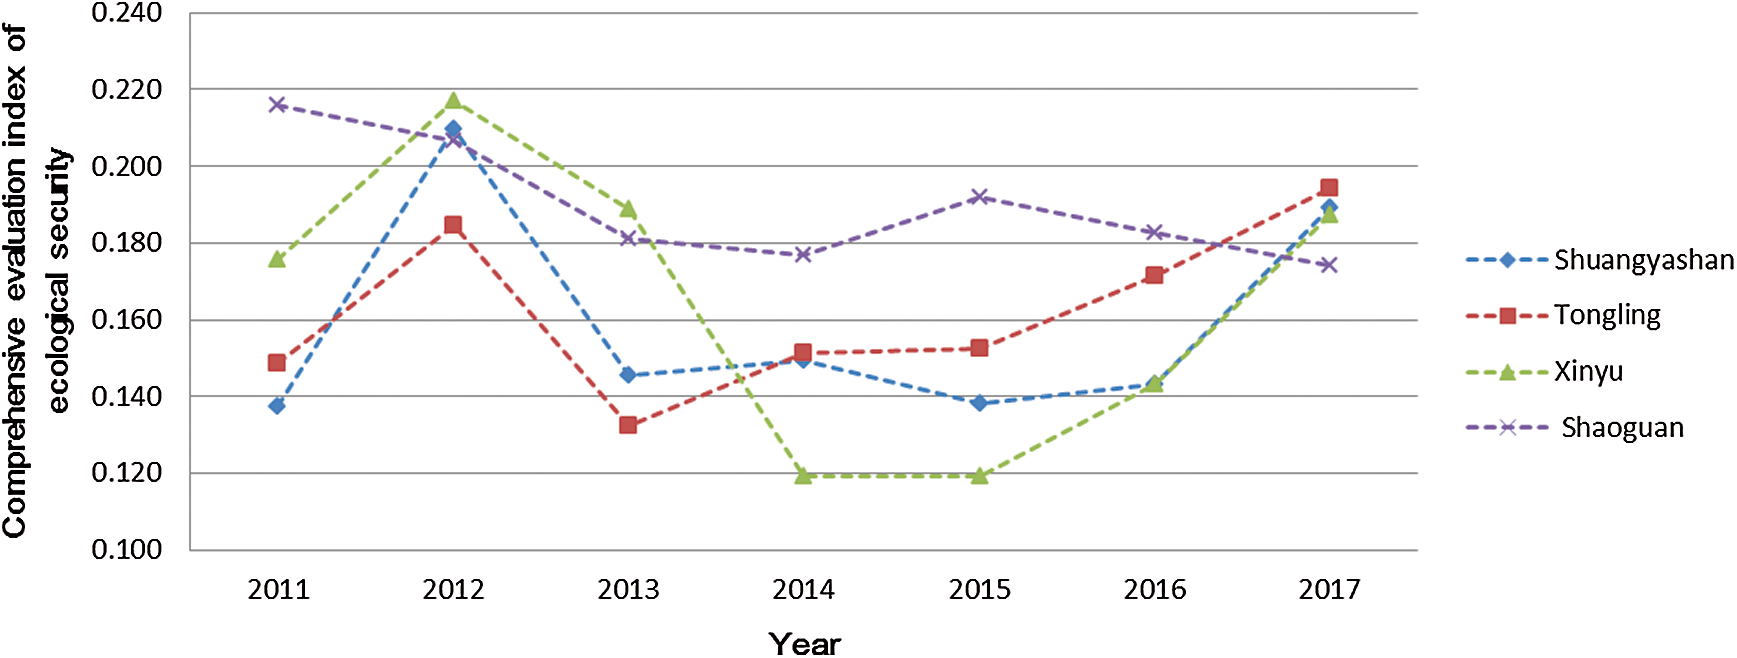
Figure 11: Ecological security trends of Shuangyashan, Tongling, Xinyu, and Shaoguan
3.3 Contribution of Indicators
We ranked the importance of the indicators and the cumulative weights of the indicators that affected the development trends of the 21 cities. Fig. 12 shows a Pareto chart created on that basis.
Among the 23 indicators, improving the industrial sulfur dioxide emissions had the most important role in the ecological security trends of the 21 cities, accounting for 5.7%. The other 9 indicators ranked in the top 10 were as follows: water supply (5.2%), agricultural fertilizer application (5.1%), forest coverage (5.0%), proportion of secondary industry (4.6%), natural population growth rate (4.6%), regional GDP growth rate (4.6%), proportion of tertiary industry (4.6%), annual average population (4.5%), and urban construction land area (4.4%). The cumulative contribution of the top 10 indicators was 48.3%.
The ecological security of the 21 investigated cities showed a fluctuating trend from 2011 to 2017. The observed trend was closely related to policy measures in China, suggesting that the policies have effectively improved the ecological security of resource-exhausted cities. We also found that in 2013 and 2014, the ecological security index of the 21 cities was in a low period, but started to improve rapidly after 2015.
We did not specifically compare the target cities with other cities in China. However, the ecological security of the 21 cities before 2014 was significantly lower than that of other Chinese cities during the same period. Investigating the ecological security of 14 cities in Liaoning Province in 2011 and 2012, Wang et al. [26] found that the indexes were all above 0.5. In our study, however, 86% and 76% of the ecological security indexes were below 0.5 in 2011 and 2012, respectively. In terms of indicator contribution, the highest was 5.7% (sulfur dioxide emissions), and the lowest was 3.0% (harmless disposal rate of household waste). Thus, the 23 indicators revealed relatively small differences in their contribution to ecological security. Nevertheless, more government funds should be allocated to the highest-ranked indicators.
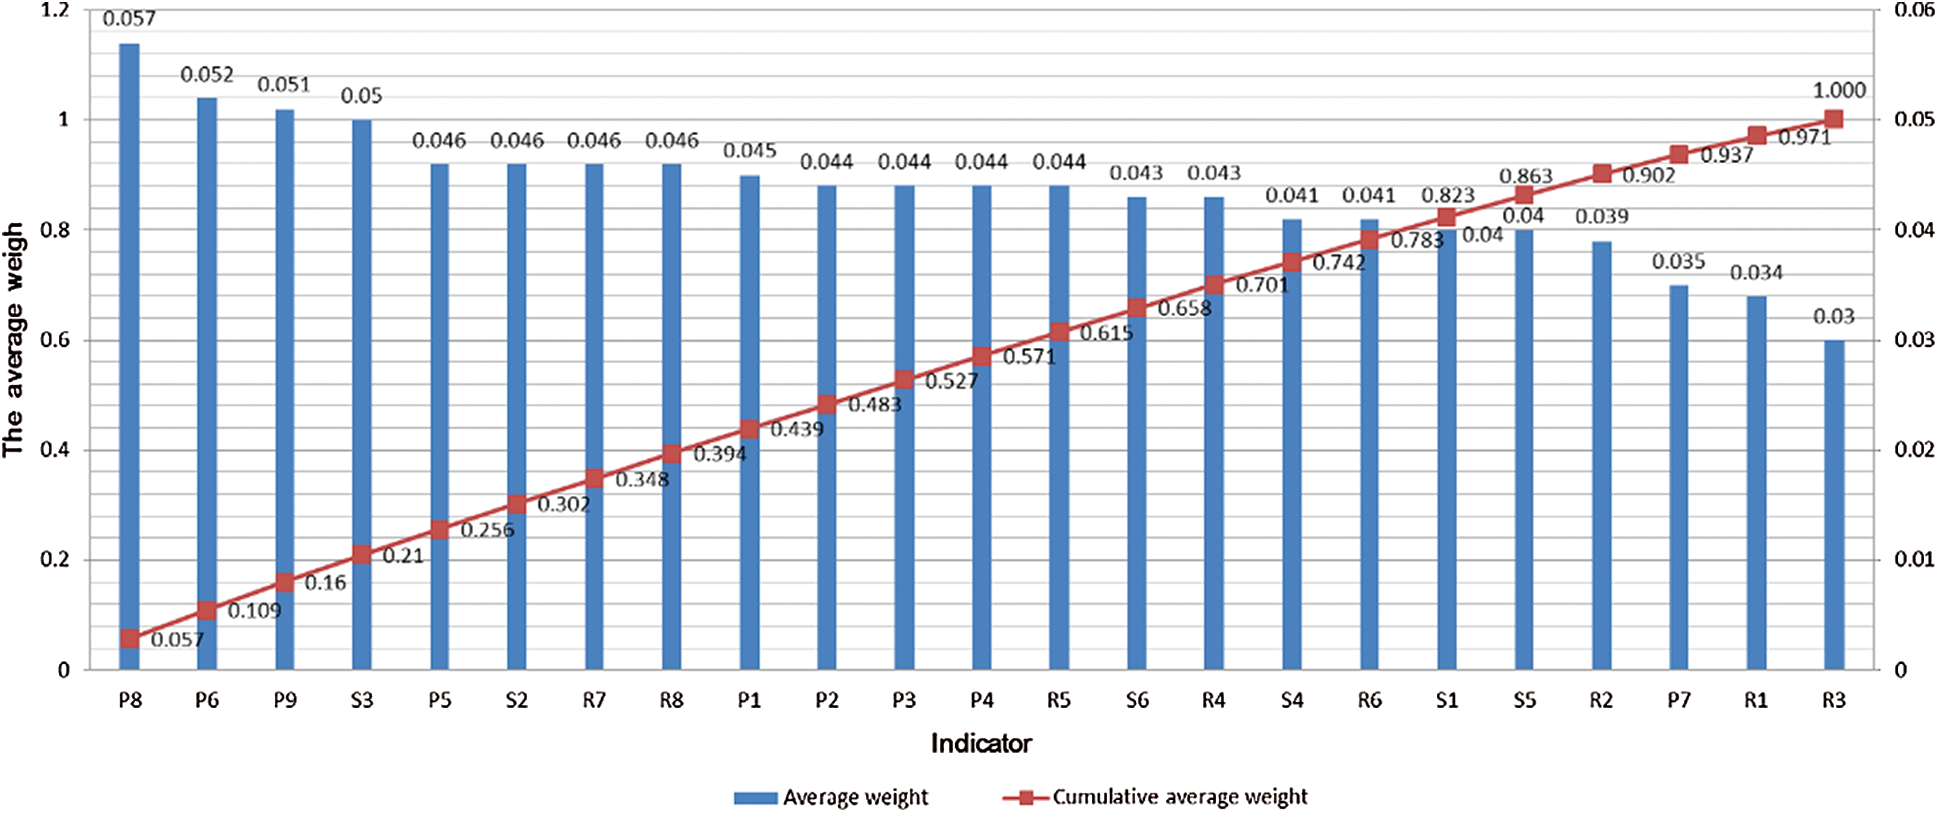
Figure 12: Average indicator weights for the ecological security of 21 resource-exhausted Chinese cities, 2011–2017
Based on this study’s findings, to improve the ecological security of China’s resource-exhausted cities, governments should allocate more resources to areas that include water supply, agricultural fertilizer application, forest coverage, the proportion of secondary industry, natural population growth rate, regional GDP growth rate, and the proportion of tertiary industry.
This study focused on the overall analysis of the same type of city, but it did not consider the differences and changes among individual cities. In addition, the results of other studies were used to make comparisons with other cities, ignoring the differences in the evaluation systems. Future studies can address these two points to further contribute to the development and improvement of ecological security.
Funding Statement: This work was supported by the Technology R&D Program of Changsha City (nos. kc1702045 and kq1901145) and the Key Technology R&D Program of Hunan Province (nos. 2016TP2007, 2017TP2006, and 2016TP1014).
Conflicts of Interest: The authors declare that they have no conflicts of interest to report regarding the present study.
1. S. H. Cui, “Progress of the ecological security research,” Acta EcologicaSinica, vol. 25, no. 4, pp. 861–868, 2005. [Google Scholar]
2. X. Chen and C. H. Zhou, “Review of the studies on ecological security,” Progress in Geography, vol. 24, no. 6, pp. 8–20, 2005. [Google Scholar]
3. H. Liu, H. Wangand and K. Liu, “A review of ecological security assessment and relevant methods in China,” Nature Ecological Conservation, vol. 8, pp. 34–37, 2005. [Google Scholar]
4. C. H. Wang, D. X. Tianand and Y. H. Liu, “The contrary researches on the Chinese and foreign ecological security assessment,” Ecological Economy, vol. 7, pp. 44–49, 2008. [Google Scholar]
5. Z. Wang, X. Zhu, S. Lei, Y. Liand and L. Jia, “Ecological security assessment model and corresponding indicator system of the regions along Huaiheriver in Anhui province,” Chinese Journal of Applied Ecology, vol. 17, no. 12, pp. 2431–2435, 2006. [Google Scholar]
6. P. W. Li, G. C. Li, J. H. Zhang, X. U. Fengand and L. Chen, “Several assessment models and application analysis of urban ecological security,” Geographical Research, vol. 28, no. 2, pp. 293–302, 2009. [Google Scholar]
7. D. Liu and Q. Chang, “Ecological security research progress in China,” Computers, Acta EcologicaSinica, vol. 35, no. 5, pp. 111–121, 2015. [Google Scholar]
8. J. Y. Tian and G. Gang, “Research on regional ecological security assessment,” Energy Procedia, vol. 16, no. PartB, pp. 1180–1186, 2012. [Google Scholar]
9. X. R. Bai and J. Tang, “Ecological security assessment of Tianjin by PSR model,” Procedia Environmental Sciences, vol. 2, no. 6, pp. 881–887, 2010. [Google Scholar]
10. P. Liang, L. M. Du and G. J. Yue, “Ecological security assessment of Beijing based on PSR model,” Procedia Environmental Sciences, vol. 2, no. 1, pp. 832–841, 2010. [Google Scholar]
11. C. H. Chen and X. M. Qi, “Study on the ecological security evaluation of Changsha city based on PSR model,” Journal of Central South University of Forestry & Technology, vol. 30, no. 1, pp. 105–109, 2010. [Google Scholar]
12. H. L. Xie and B. Li, “A study on indices system and assessment criterion of ecological security for city,” Journal of Beijing Normal University(Natural Science), vol. 40, no. 5, pp. 705–710, 2004. [Google Scholar]
13. Z. Yang, S. Zhang, Y. Hu, Z. Hu and Y. Huang, “VAE-Stega: Linguistic steganography based on variational auto-encoder,” IEEE Transactions on Information Forensics and Security, vol. 16, pp. 880–895, 2021. [Google Scholar]
14. Y. T. Chen, L. W. Liu, V. Phonevilay, K. Gu, R. L. Xia et al., “Image super-resolution reconstruction based on feature map attention mechanism,” Applied Intelligence, 2021. http://dx.doi.org/10.1007/s10489-020-02116-1. [Google Scholar]
15. Y. T. Chen, L. W. Liu, J. J. Tao, X. Chen, R. L. Xia et al., “The image annotation algorithm using convolutional features from intermediate layer of deep learning,” Multimedia Tools and Applications, vol. 80, no. 3, pp. 4237–4261, 2020. [Google Scholar]
16. D. C. Luo and J. F. Liu, “Analysis on present situation of ecological safety in China and its protection countermeasures,” China Safety Science Journal, vol. 17, no. 3, pp. 10–14+177, 2007. [Google Scholar]
17. Y. Luo, J. Qin, X. Xiang and Y. Tan, “Coverless image steganography based on multi-object recognition,” IEEE Transactions on Circuits and Systems for Video Technology, vol. 14, no. 8, pp. 1–13, 2021. [Google Scholar]
18. Z. Wang, J. Qin, X. Xiang and Y. Tan, “A privacy-preserving and traitor tracking content-based image retrieval scheme in cloud computing,” Multimedia Systems, 2021. http://dx.doi.org/10.1007/s00530-020-00734-w. [Google Scholar]
19. T. Xu, M. Zhao, X. Yao and K. He, “An adjust duty cycle method for optimized congestion avoidance and reducing delay for wsns,” Computers, Materials & Continua, vol. 65, no. 2, pp. 1605–1624, 2020. [Google Scholar]
20. Z. Zhou, J. Qin, X. Xiang, Y. Tan, Q. Liu et al., “News text topic clustering optimized method based on TF-IDF algorithm on spark,” Computers, Materials & Continua, vol. 62, no. 1, pp. 217–231, 2020. [Google Scholar]
21. L. Y. Xiang, S. H. Yang, Y. H. Liu, Q. Li and C. Z. Zhu, “Novel linguistic steganography based on character-level text generation,” Mathematics, vol. 8, pp. 1558, 2020. [Google Scholar]
22. P. W. Li, G. C. Li, J. H. Zhang, Z. H. Li and F. Xu, “Ecological security assessment and prediction for Shenzhen,” Progress in Geography, vol. 28, no. 2, pp. 245–252, 2009. [Google Scholar]
23. Q. Liu, X. Xiang, J. Qin, Y. Tan and J. Tan, “Coverless steganography based on image retrieval of DenseNet features and DWT sequence mapping,” Knowledge-Based Systems, vol. 53, pp. 105375–105389, 2020. [Google Scholar]
24. J. Qin, W. Pan, X. Xiang, Y. Tan and G. Hou, “A biological image classification method based on improved CNN,” Ecological Informatics, vol. 58, pp. 101093, 2020. [Google Scholar]
25. T. Zhou, B. Xiao, Z. Cai and M. Xu, “A utility model for photo selection in mobile crowdsensing,” IEEE Transactions on Mobile Computing, vol. 20, no. 1, pp. 48–62, 2021. [Google Scholar]
26. G. Wang and C. L. Zhong, “Evolution tendency of urban ecological security 2003 to 2012 for Liaoning province based on P-S-R model,” Environmental Science and Management, vol. 41, no. 2, pp. 121–127, 2016. [Google Scholar]
 | This work is licensed under a Creative Commons Attribution 4.0 International License, which permits unrestricted use, distribution, and reproduction in any medium, provided the original work is properly cited. |