DOI:10.32604/cmc.2021.017385
| Computers, Materials & Continua DOI:10.32604/cmc.2021.017385 | |
| Article |
An Efficient CNN-Based Automated Diagnosis Framework from COVID-19 CT Images
1Department Electronics and Electrical Communications, Faculty of Electronic Engineering, Menoufia University, Menouf, 32952, Egypt
2Department of Electronics and Electrical Communications, Faculty of Engineering, Minia University, Egypt
3Department of Industrial Electronics and Control Engineering, Faculty of Electronic Engineering, Menoufia University, Menouf, 32952, Egypt
4Department of Information Technology, College of Computer and Information Sciences, Princess Nourah Bint Abdulrahman University, Riyadh, 84428, Saudi Arabia
*Corresponding Author: Naglaa F. Soliman. Email: nfsoliman@pnu.edu.sa
Received: 29 January 2021; Accepted: 12 April 2021
Abstract: Corona Virus Disease-2019 (COVID-19) continues to spread rapidly in the world. It has dramatically affected daily lives, public health, and the world economy. This paper presents a segmentation and classification framework of COVID-19 images based on deep learning. Firstly, the classification process is employed to discriminate between COVID-19, non-COVID, and pneumonia by Convolutional Neural Network (CNN). Then, the segmentation process is applied for COVID-19 and pneumonia CT images. Finally, the resulting segmented images are used to identify the infected region, whether COVID-19 or pneumonia. The proposed CNN consists of four Convolutional (Conv) layers, four batch normalization layers, and four Rectified Linear Units (ReLUs). The sizes of Conv layer used filters are 8, 16, 32, and 64. Four max-pooling layers are employed with a stride of 2 and a 2 × 2 window. The classification layer comprises a Fully-Connected (FC) layer and a soft-max activation function used to take the classification decision. A novel saliency-based region detection algorithm and an active contour segmentation strategy are applied to segment COVID-19 and pneumonia CT images. The acquired findings substantiate the efficacy of the proposed framework for helping the specialists in automated diagnosis applications.
Keywords: Classification; segmentation; COVID-19; CNN; deep learning; diagnosis applications
Medical imaging includes various imaging modalities to clarify the parts of the human body for diagnostic and therapeutic objectives, and thus it plays a significant role in initiatives to enhance public health for all population groups. Moreover, imaging is often warranted in the follow-up of a disease that has already been diagnosed and treated. Medical images can be acquired with several techniques such as MRI (Magnetic Resonance Imaging), CT (Computed Tomography), X-ray imaging, and PET (Positron Emission Tomography) [1,2].
The CT is a diagnostic imaging technique performed to build cross-sectional images of the human body by the X-ray. The cross-sections are reconstructed from the attenuation factors evaluation of the X-ray beams into the studied object size. It depends on the basic principle that the tissue density that a beam of the X-ray moves can be evaluated by computing the attenuation factor. Using this principle, CT allows reconstructing the body density through a two-dimensional section perpendicular to the acquisition system axis [3].
At the end of 2019, COVID-19 began to spread. The classification and the segmentation of COVID-19 images is now a critical task for the researchers. The coronavirus spreads so quickly between people. With increasing infection rates of this virus, researchers directed their work to find effective solutions in detecting and diagnosing COVID-19. The early detection of the virus aids in selecting the proper treatment [4,5].
COVID-19 is an irresistible disease initiated by a new virus that has not been discovered in humans before. The virus causes a respiratory disease with symptoms like fever and coughing, causing pneumonia in more serious cases. The new coronavirus is spread by contact with an infected person. The rapid and correct diagnosis of this disease plays a significant role in effective treatment planning and patient care. Several imaging techniques have been applied for the diagnosis of coronavirus images. Imaging tests can aid the specialists to discover the disease. The CT scan works as a practical approach to the early screening of COVID-19 [6].
Deep learning networks are the best choice for image classification. They are used to extract the image features automatically. Besides, a CNN is a type of deep learning network that can efficiently work on medical images. It helps to extract and learn valuable features found in images. A CNN is composed of input and output layers and many hidden layers. The hidden layers comprise pooling layers, convolutional layers, and fully-connected layers [7–12].
Our paper contribution is to present a framework for the classification and segmentation of COVID-19 CT images. The suggested framework succeeds in dealing with the non-homogeneity and high CT image variations in the segmentation process. A novel saliency-based region detection algorithm and an active contour segmentation strategy are applied to segment the COVID-19 and pneumonia CT images. The used segmentation algorithm clarifies the affected region, accurately. The proposed framework achieves high performance in the classification and segmentation processes. The implemented CNN from scratch on CT images classifies normal, pneumonia, and COVID-19 cases. The proposed framework achieves an accuracy of 99.59% in the classification process.
The remainder of this study is summarized as follows. The related works are discussed in Section 2. The proposed hybrid classification-segmentation framework is presented in Section 3. The utilized dataset description is introduced in Section 4. Extensive experimental analyses to validate the proposed framework are offered in Section 5. Lastly, the concluding remarks are summarized in Section 6.
Sethy et al. [13] introduced a technique of COVID-19 detection depending on deep features. The image features are extracted from a pre-trained CNN such as AlexNet, VGG16, and VGG19. The resulting features are classified by an SVM (Support Vector Machine). This technique is utilized to classify X-ray chest pneumonia. Turkoglu et al. [14] presented a technique for the classification and detection of COVID-19 based on CNN. The effective features are chosen using the relief feature selection algorithm from all layers of the architecture of the AlexNet. Then, the classification process is applied with the SVM. This technique classifies COVID-19, normal, and pneumonia chest X-ray images.
Ouchicha et al. [15] proposed a model for detecting COVID-19 from chest X-ray images based on deep learning. This model depends on the residual neural network, and it is built with multi-levels with various kernel dimensions to determine the local and global features. Residuals are connected to other levels to participate with information. This model achieved an accuracy of 96.69%. Jain et al. [16] introduced a system for pneumonia detection from chest X-ray images using CNNs and transfer learning. This system depends on six different networks for pneumonia detection. The first and the second networks are composed of two and three convolutional layers, correspondingly. The other four networks are pre-trained models such as ResNet50, Inception-v3, VGG16, and VGG19.
Oulefki et al. [17] presented a technique for the segmentation of COVID-19 chest CT images. The local mean filter is used to improve the image quality. Multi-level thresholding segmentation is applied to segment the images into pneumonia and non-pneumonia regions. This technique achieved a segmentation accuracy of 98%. Amyar et al. [18] presented a technique for segmentation and classification of COVID-19 based on deep learning. This technique depends on a multi-task algorithm to identify COVID-19 patients and segment COVID-19 lesions from chest CT images. A single encoder is used for feature extraction. Two decoders and a multi-layer perceptron are applied for reconstruction, segmentation, and classification, respectively.
Mahmud et al. [19] presented an attempt for detection of COVID-19 and pneumonia from X-ray images. Different forms of CNN are designed and trained on X-ray images of several resolutions for performance optimization. Gradient-based differential localization was incorporated to distinguish abnormal areas from X-ray images indicating different types of pneumonia. Wang et al. [20] introduced a technique for classification of COVID-19 CT images. This technique is composed of three steps. Firstly, the Region of Interest (RoI) is randomly chosen. Then, the pre-trained CNN model is trained to extract features of the images. Finally, a classification network is used to discriminate the COVID-19 cases.
3 The Proposed Hybrid Classification-Segmentation Framework
The proposed framework is applied for the classification and segmentation of COVID-19 images. Firstly, the classification process is employed to discriminate between COVID-19, non-COVID, and pneumonia. Then, the segmentation process is applied for COVID-19 and pneumonia CT images. Finally, the resulting segmented images are used to identify the infected region, whether it is COVID-19 or pneumonia. The CNN is used for the classification process. The CNN is composed of an input layer, convolutional layers, pooling layers, and a classification layer. The input layer takes CT images with size 512 × 512. The convolutional layers comprise convolution operation, batch normalization layer, and ReLU function. The classification layer consists of a fully-connected layer and a soft-max activation function to take the classification decision. The proposed CNN consists of four Conv layers, four batch normalization layers, and four ReLU functions. The sizes of the used filters of Conv layers are 8, 16, 32, and 64. Four max-pooling layers are implemented with stride two and window size 2 × 2. Fig. 1 shows the flow diagram of the suggested classification and segmentation framework of COVID-19 CT images.
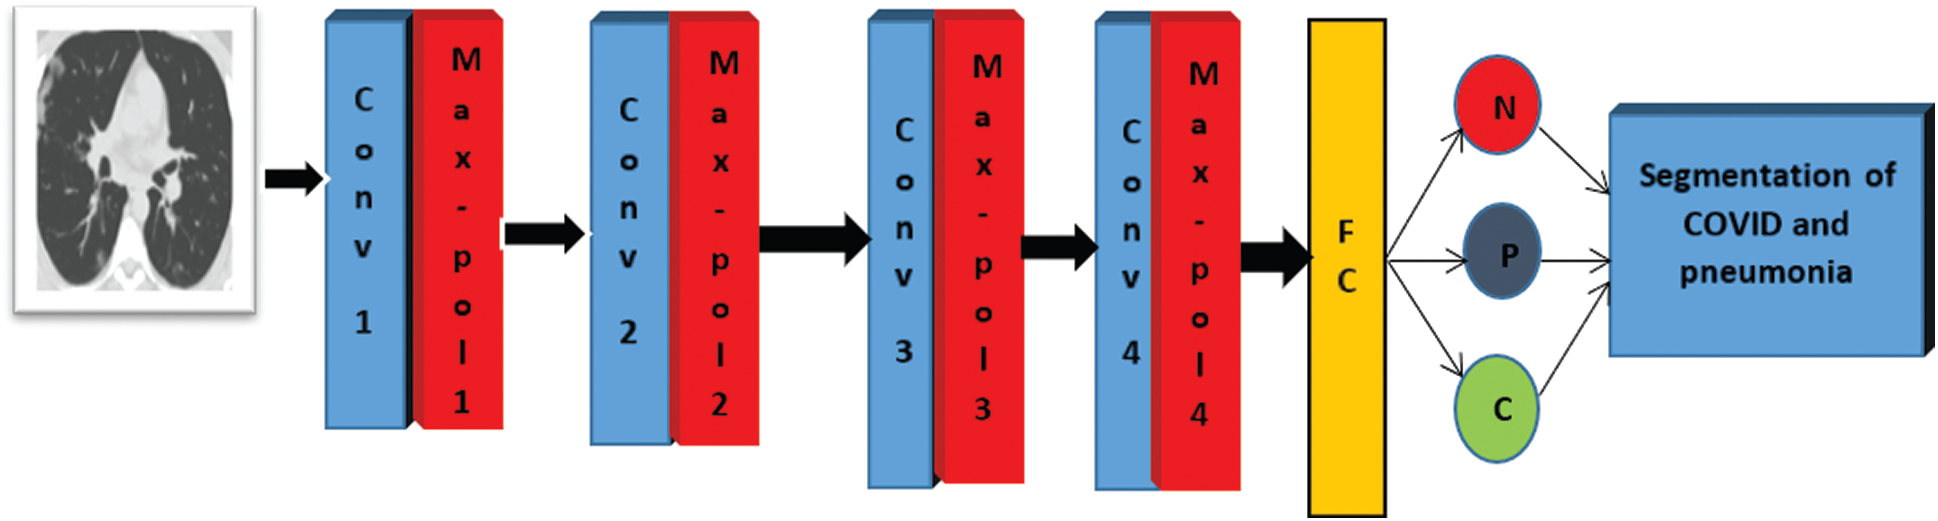
Figure 1: Flow diagram of the suggested classification and segmentation framework
The convolution is the essential operation of the CNN that is performed to extract specific characteristics from the input images. A mathematical process is performed by moving a window over the whole image to generate the feature map as the output [21,22]. This process decreases the image size, which makes it simpler to manipulate the image. Each point in the generated feature map can be evaluated as:
where
Two types of activation functions are employed in the proposed framework: ReLU and soft-max. The ReLU is a widely used activation function because it presents a good performance in learning, and it is less expensive. It is applied in the Conv layer to generate the feature maps. On the other hand, soft-max is applied in the classification layer of the CNN. The soft-max function normalizes the inputs into a probability distribution [15,16].
3.1.2 Batch Normalization Layer
It is a layer that is used to enhance the convergence during the training process. It is implemented for performance optimization to decrease over-fitting and achieve better test accuracy [15].
It is used to decrease the image size. The number of parameters is decreased, and also the computational complexity is reduced to govern the over-fitting. The pooling operations are characterized by a specific window size and a specific size of stride. Polling is classified into average pooling and max pooling [23,24].
This is the last layer of the CNN that transforms the fully-connected layer output to several classes. It consists of a fully-connected layer and a soft-max activation function. Adam optimizer is implemented to update the weights of the network depending on the training data. The soft-max activation function is used to provide the classification output [25–28].
3.4 Segmentation of COVID-19 CT Images
Due to intensity inhomogeneity and pixel variations of CT images, the segmentation of COVID-19 images is still challenging. A novel saliency-based region detection algorithm and an active contour segmentation strategy are applied to segment COVID-19 and pneumonia CT images. In image segmentation, saliency refers to a pixel or object appearance in an obvious way among its neighbors and illustrates the unique characteristics of an image [28]. The saliency information can be used to segment the image. In this paper, we develop active contour segmentation for the segmentation of COVID-19 and pneumonia CT images. This algorithm successfully deals with the significant variations in size, texture, and position of infection in COVID-19 CT images.
The saliency-based region detection and image segmentation algorithm is applied to overcome intensity inhomogeneities and significant variations of images. A new level-set evolution protocol of active contour is designed depending on internal and external energy functions. A new energy function is derived to extract the objects obviously [28–33]. We have I:
The external function Eex is defined by region, gradient, and saliency. On the other hand, the internal energy function Ein is used as a restriction for level set evolution. For non-homogeneous images, the pixels are gathered and pixels with the same intensity and saliency values are grouped together in
Let S be the saliency information used to determine the most distinct objects or areas such as edges, colors, and texture in an image. C1 and C2 are the scalar approximation of the mean intensities for
where
Also, the area of the contour to evaluate the RoI is defined as:
where
To minimize (11) with respect to, φ the derivative can be defined as:
where div(.) and
The proposed level-set function is started as:
Since p
The used dataset contains CT images for normal, pneumonia, and COVID-19 cases. This dataset has been acquired by China national center of bio-information. The size of the input images is 512 × 512. The images were downloaded from Kaggle repository. Fig. 2 shows sample images of normal, pneumonia, and COVID-19 cases.
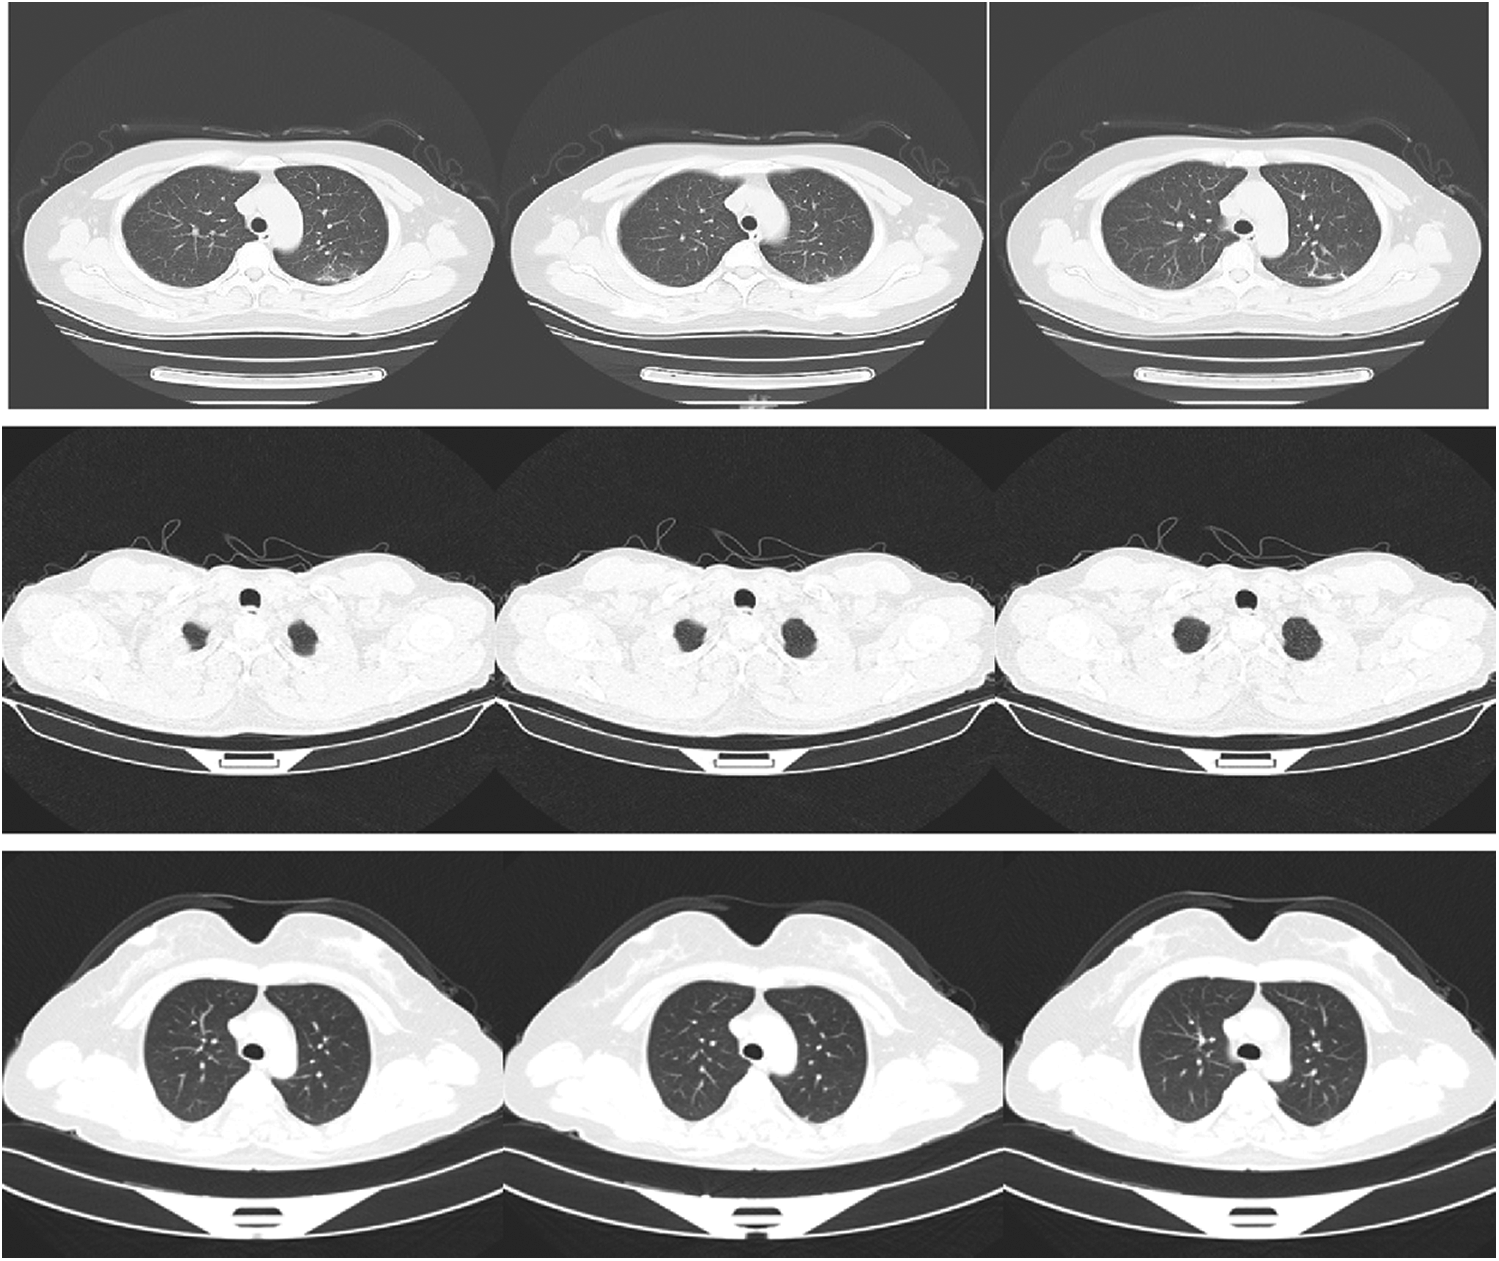
Figure 2: Samples of images of COVID-19, pneumonia, and normal cases
5 Simulation Results and Discussions
The CNN is trained from scratch on CT images to classify normal, pneumonia, and COVID-19 cases. The proposed framework achieves an accuracy of 99.59%, with 80% of the data for training and 20% for testing. It achieves 99.17% with 70% of the data for training and 30% for testing, and 98.34% with 60% of the data for training and 40% for testing. Training accuracy illustrates the percentage of correct images being classified under the correct label. The computed loss function is a cross-entropy loss function that is plotted versus iterations. After applying the classification process, the COVID-19 and pneumonia images are segmented by saliency-based region detection and image segmentation to detect the infected region, accurately. The resulting segmented images help specialists to diagnose the disease and detect the appropriate treatment.
Metrics are used to assess the suggested framework performance in terms of accuracy, loss, sensitivity, specificity, F1 score, precision, MCC (Matthews Correlation Coefficient), and NPV (Negative Predictive Value). Accuracy defines the efficiency of the proposed framework. Accuracy and loss are the most important metrics that are used to define performance. The loss and accuracy curves clarify the validation and training data. TP (True Positive), TN (True Negative), FP (False Positive), and TN (False Negative) are used to determine the used metrics [37,38]. Prediction ratio per class is illustrated in the confusion matrix of pneumonia, normal, and COVID-19 cases. Prediction ratios for all classes are very encouraging. An important consideration is the balanced distribution of images in the dataset. The balanced distribution enhances prediction results.
Fig. 3 shows training and validation accuracy of the proposed framework for classification with 80% for training and 20% for testing. Fig. 4 shows cross-entropy loss of the proposed framework for classification with 80% for training and 20% for testing. Fig. 5 shows training and validation accuracy of the proposed framework for classification with 70% for training and 30% for testing. Fig. 6 shows cross-entropy loss of the proposed framework for classification with 70% for training and 30% for testing. Fig. 7 shows training and validation accuracy of the proposed framework for classification with 60% for training and 40% for testing. Fig. 8 shows cross-entropy loss of the proposed framework for classification with 60% for training and 40% for testing. Fig. 9 illustrates definitions of TP, FP, TN, and FN for infected persons with COVID-19. Fig. 10 shows confusion matrix of the proposed framework with a classification CNN. Fig. 11 shows evaluation results of the CNN model. Tab. 1 demonstrates evaluation metric values of the proposed framework with 80% for training and 20% for testing. Tab. 2 illustrates evaluation metric values of the proposed framework 70% for training and 30% for testing. Tab. 3 shows the evaluation metric values of the proposed framework with 60% for training and 40% for testing.
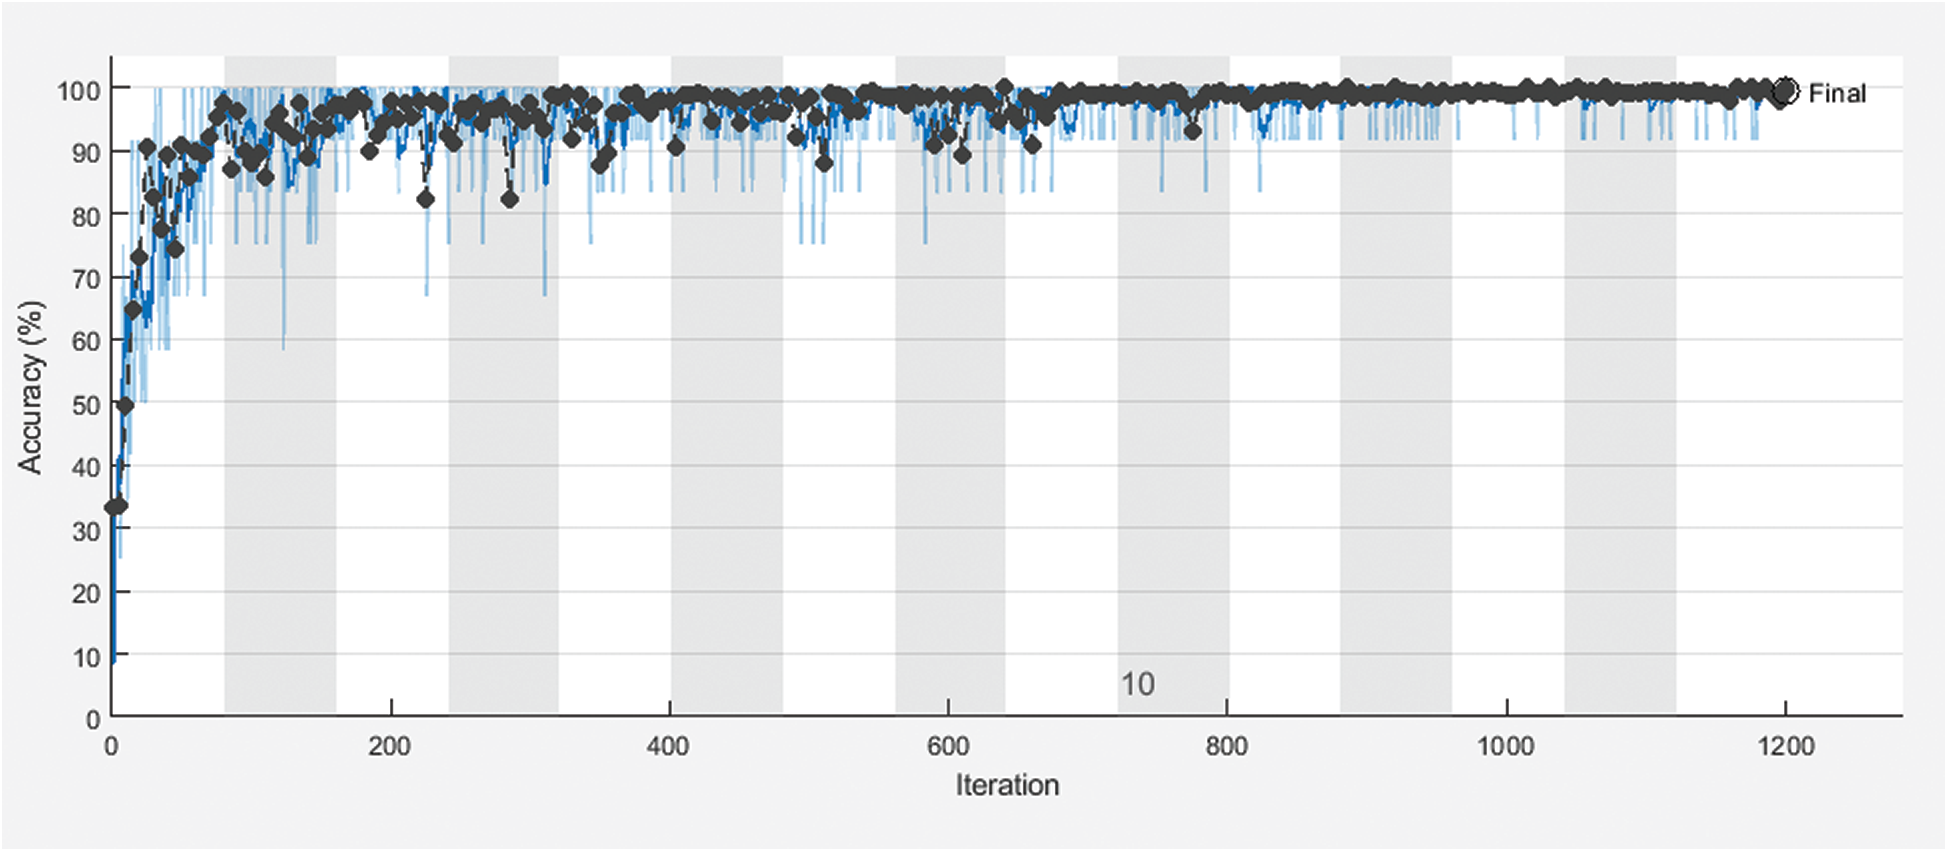
Figure 3: Training and the validation accuracy of the proposed framework with 80% for training and 20% for testing
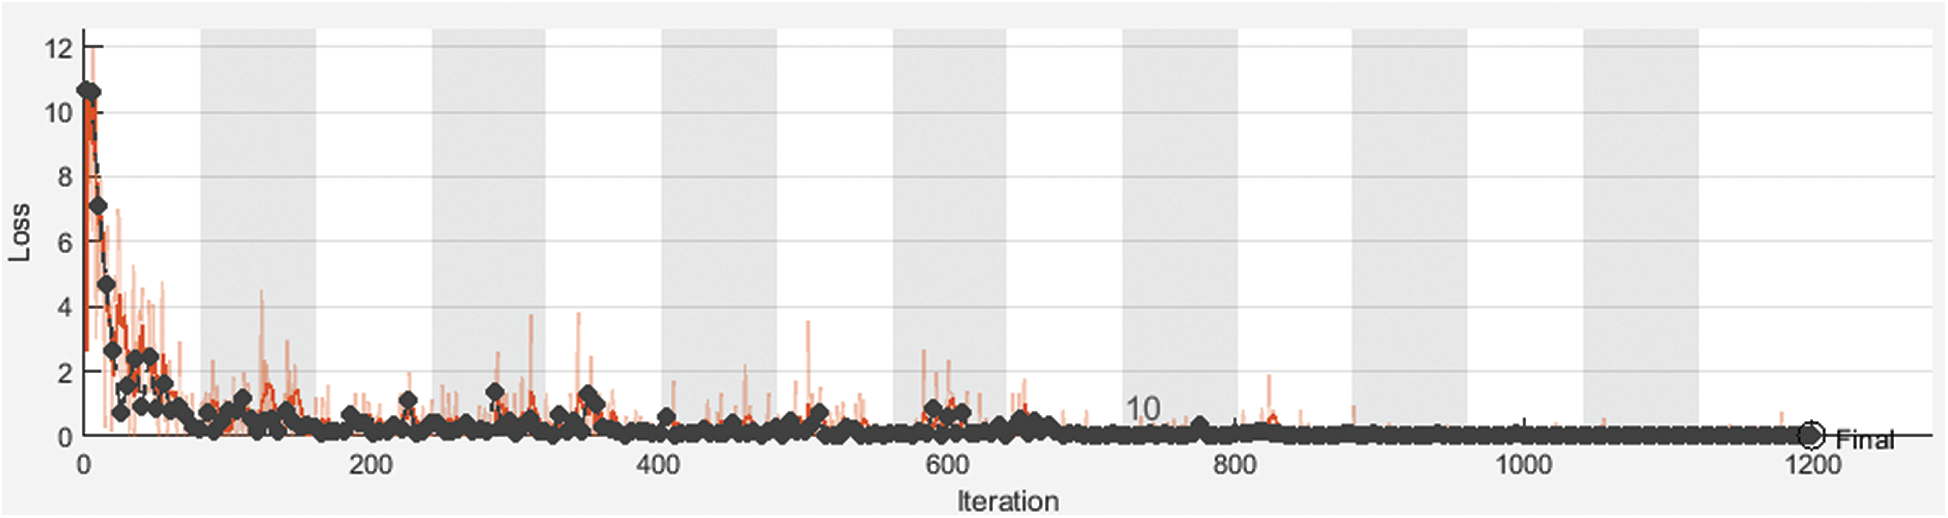
Figure 4: Cross-entropy loss of the proposed framework for with 80% for training and 20% for testing
The proposed CNN model was implemented for different training and testing sets. The proposed framework achieves high accuracy for all sets. Different evaluation metrics are used to assess its performance. It achieves good performance based on these metrics.
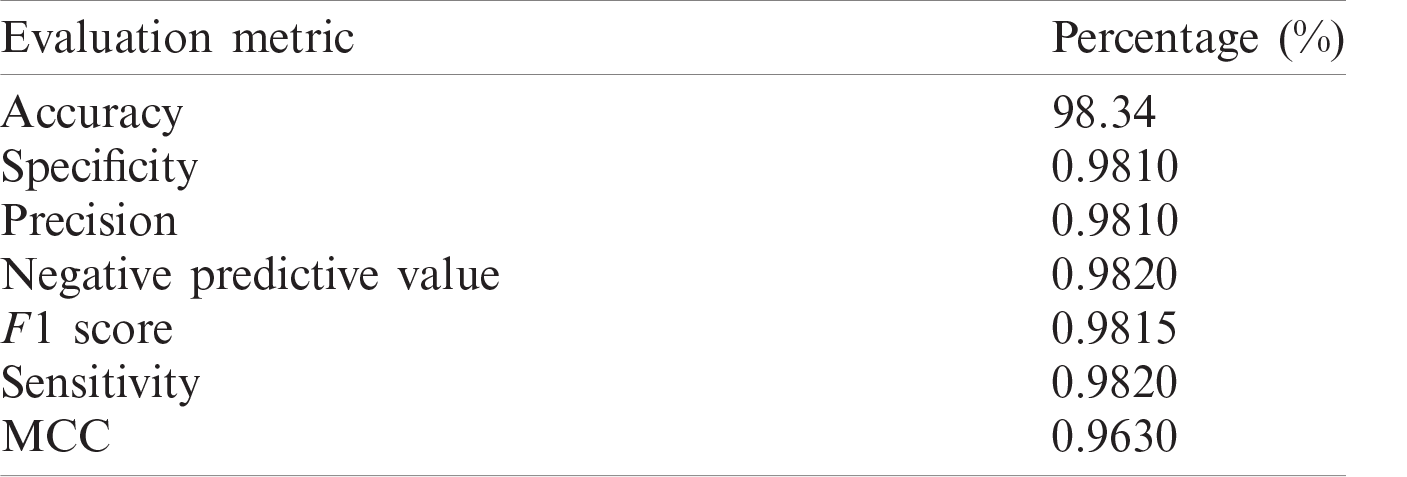
Tab. 1 illustrates the classification metrics with 80% for training and 20% for testing. Tab. 2 illustrates the classification metrics with 70% for training and 30% for testing. Tab. 3 illustrates the classification metrics with 60% for training and 40% for testing. The results in Fig. 10 illustrates the confusion matrices of the proposed framework for different sets of training and testing. The confusion matrix depends on false positive rate and true negative rate for evaluating the performance. The results in Fig. 11 illustrate different CNN evaluation metrics for all training and testing sets. The proposed framework achieves good results for various training and testing sets.
Fig. 12 shows samples of the resulting segmented COVID-19 CT images. Fig. 13 shows samples of the resulting segmented pneumonia CT images. Tab. 4 shows evaluation metric values for samples of the resulting segmented COVID-19 CT images. Tab. 5 gives evaluation metric values for samples of the resulting segmented pneumonia CT images. Tab. 6 shows a comparison of the suggested framework for segmentation with other models. Tab. 7 shows a comparison of the suggested framework for classification with other models.
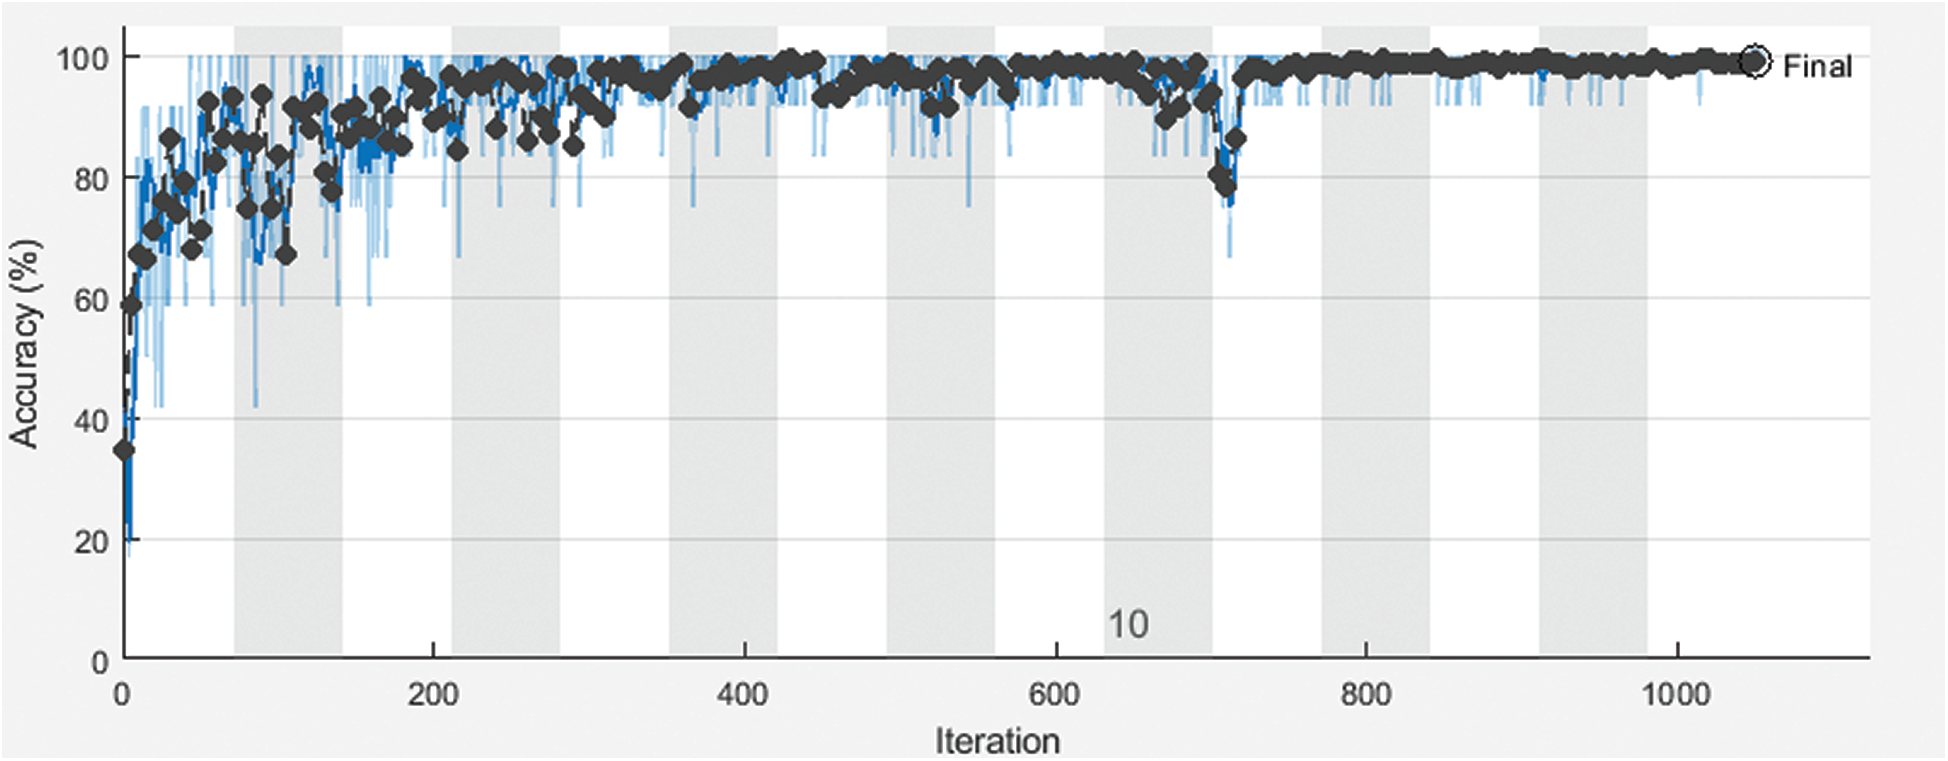
Figure 5: Training and the validation accuracy of the proposed framework with 70% for training and 30% for testing
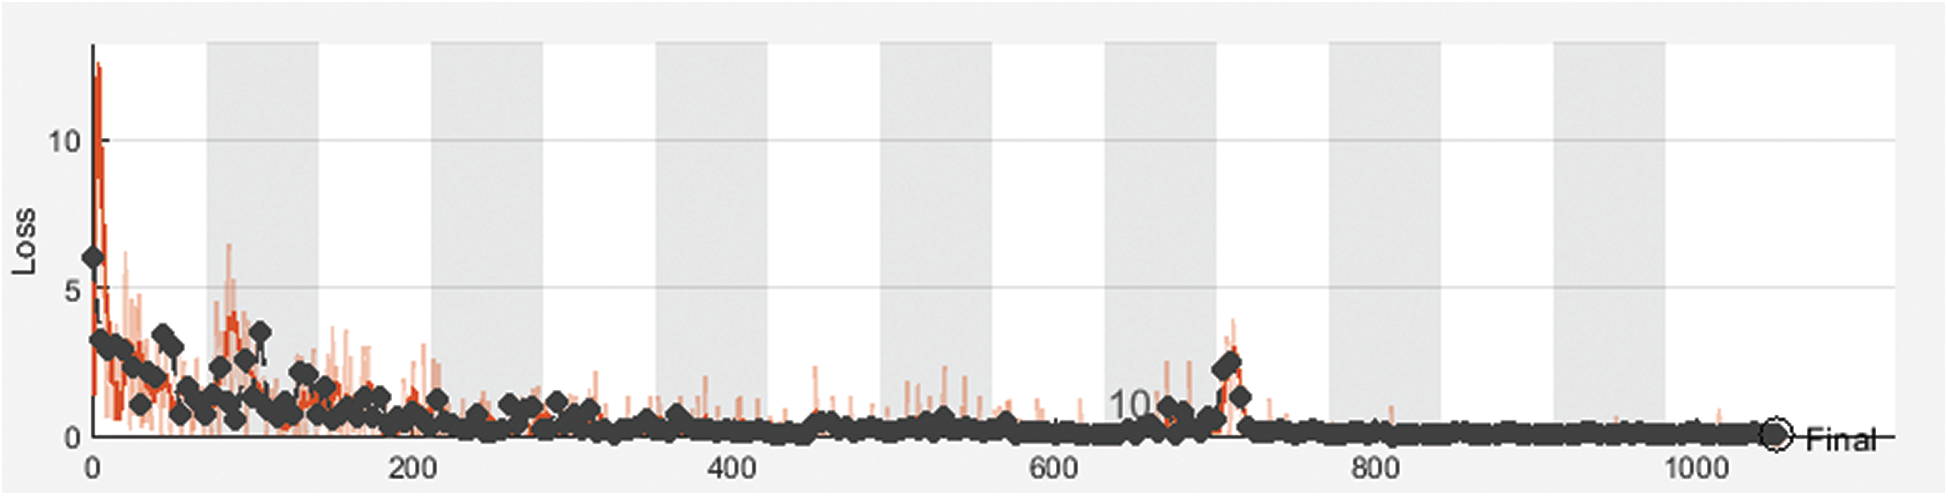
Figure 6: Cross-entropy loss of the proposed framework with 70% for training and 30% for testing
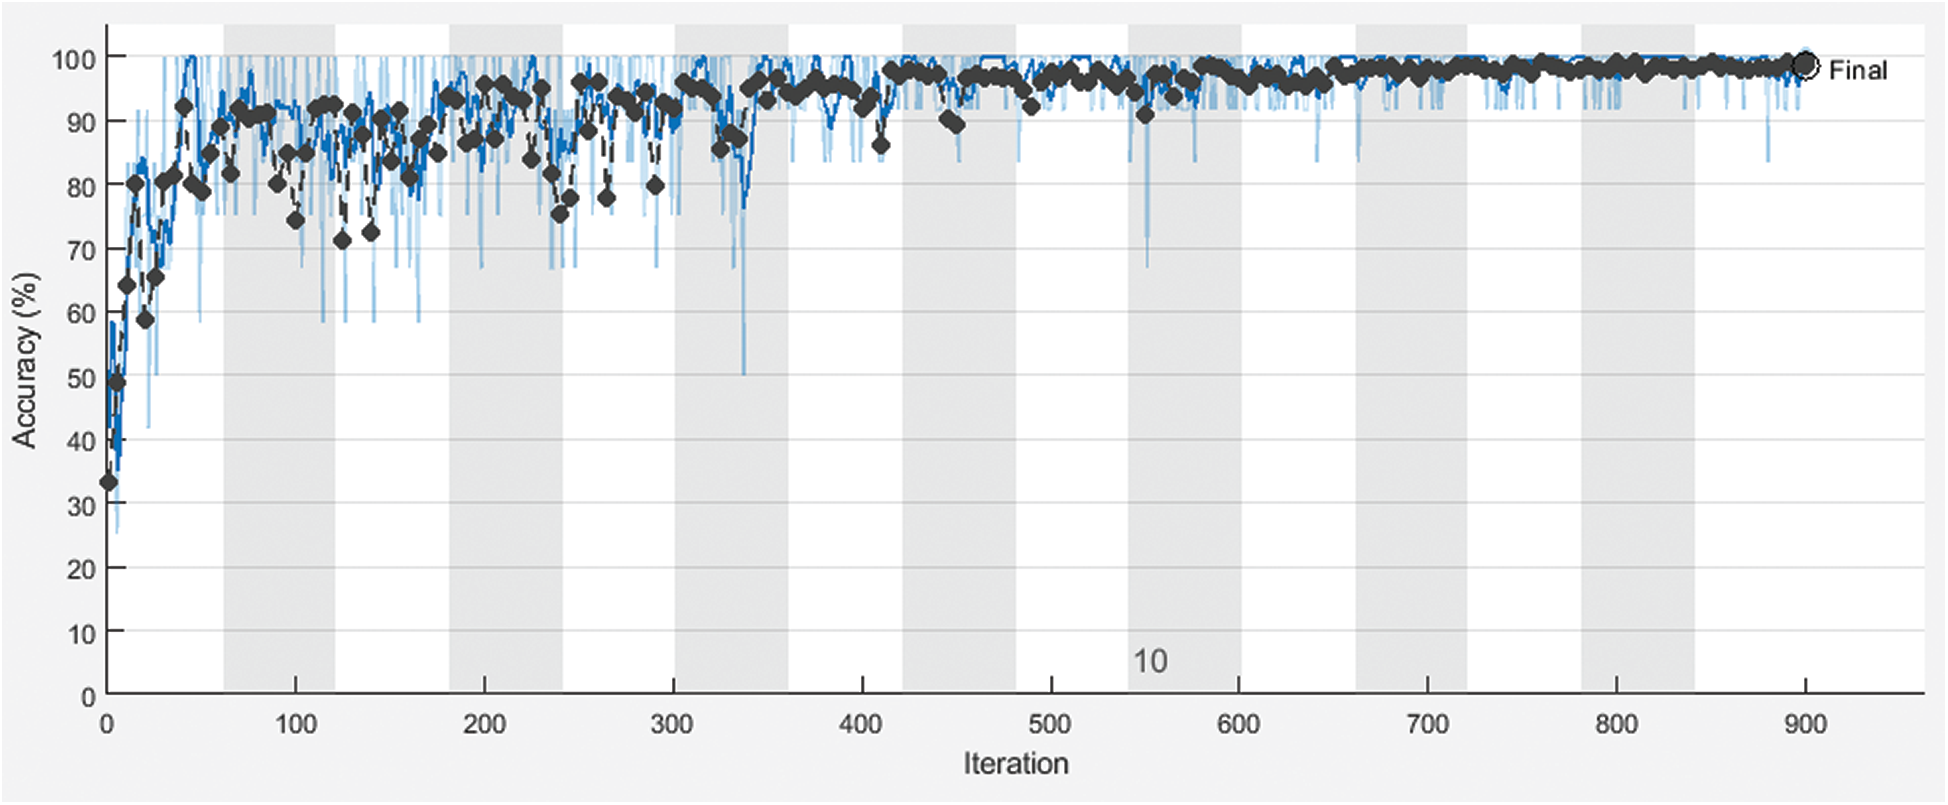
Figure 7: Training and the validation accuracy of the proposed framework with 60% for training and 40% for testing

Figure 8: Cross-entropy loss of the proposed framework with 60% for training and 40% for testing
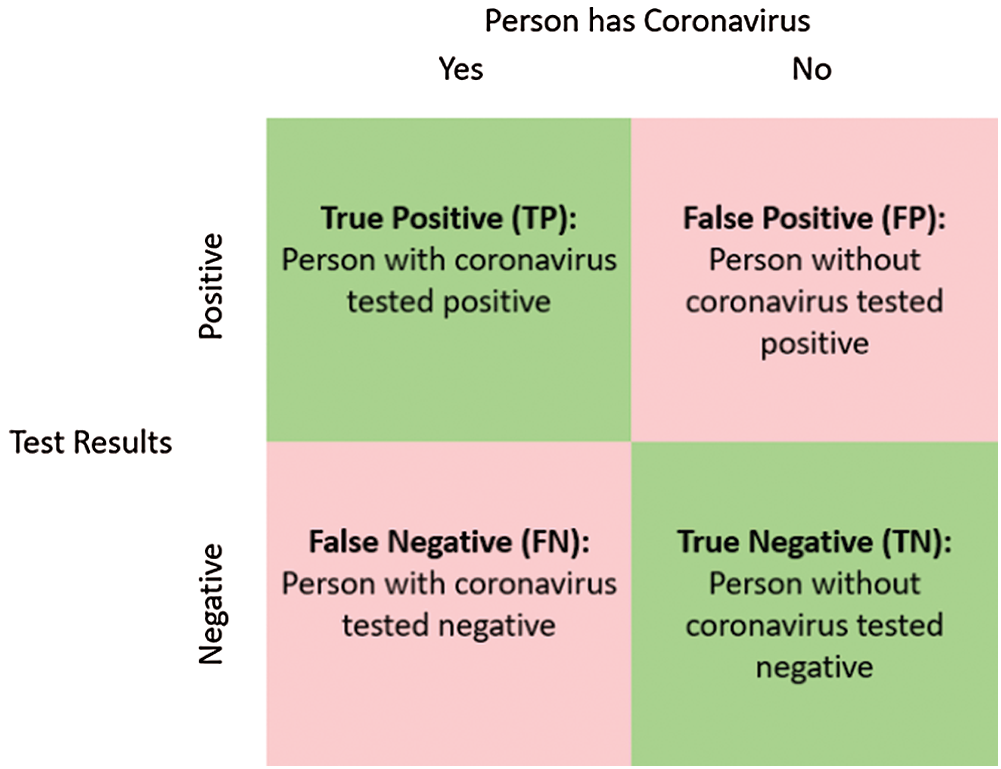
Figure 9: Definition of TP, FP, TN, and FN for COVID-19 infected persons
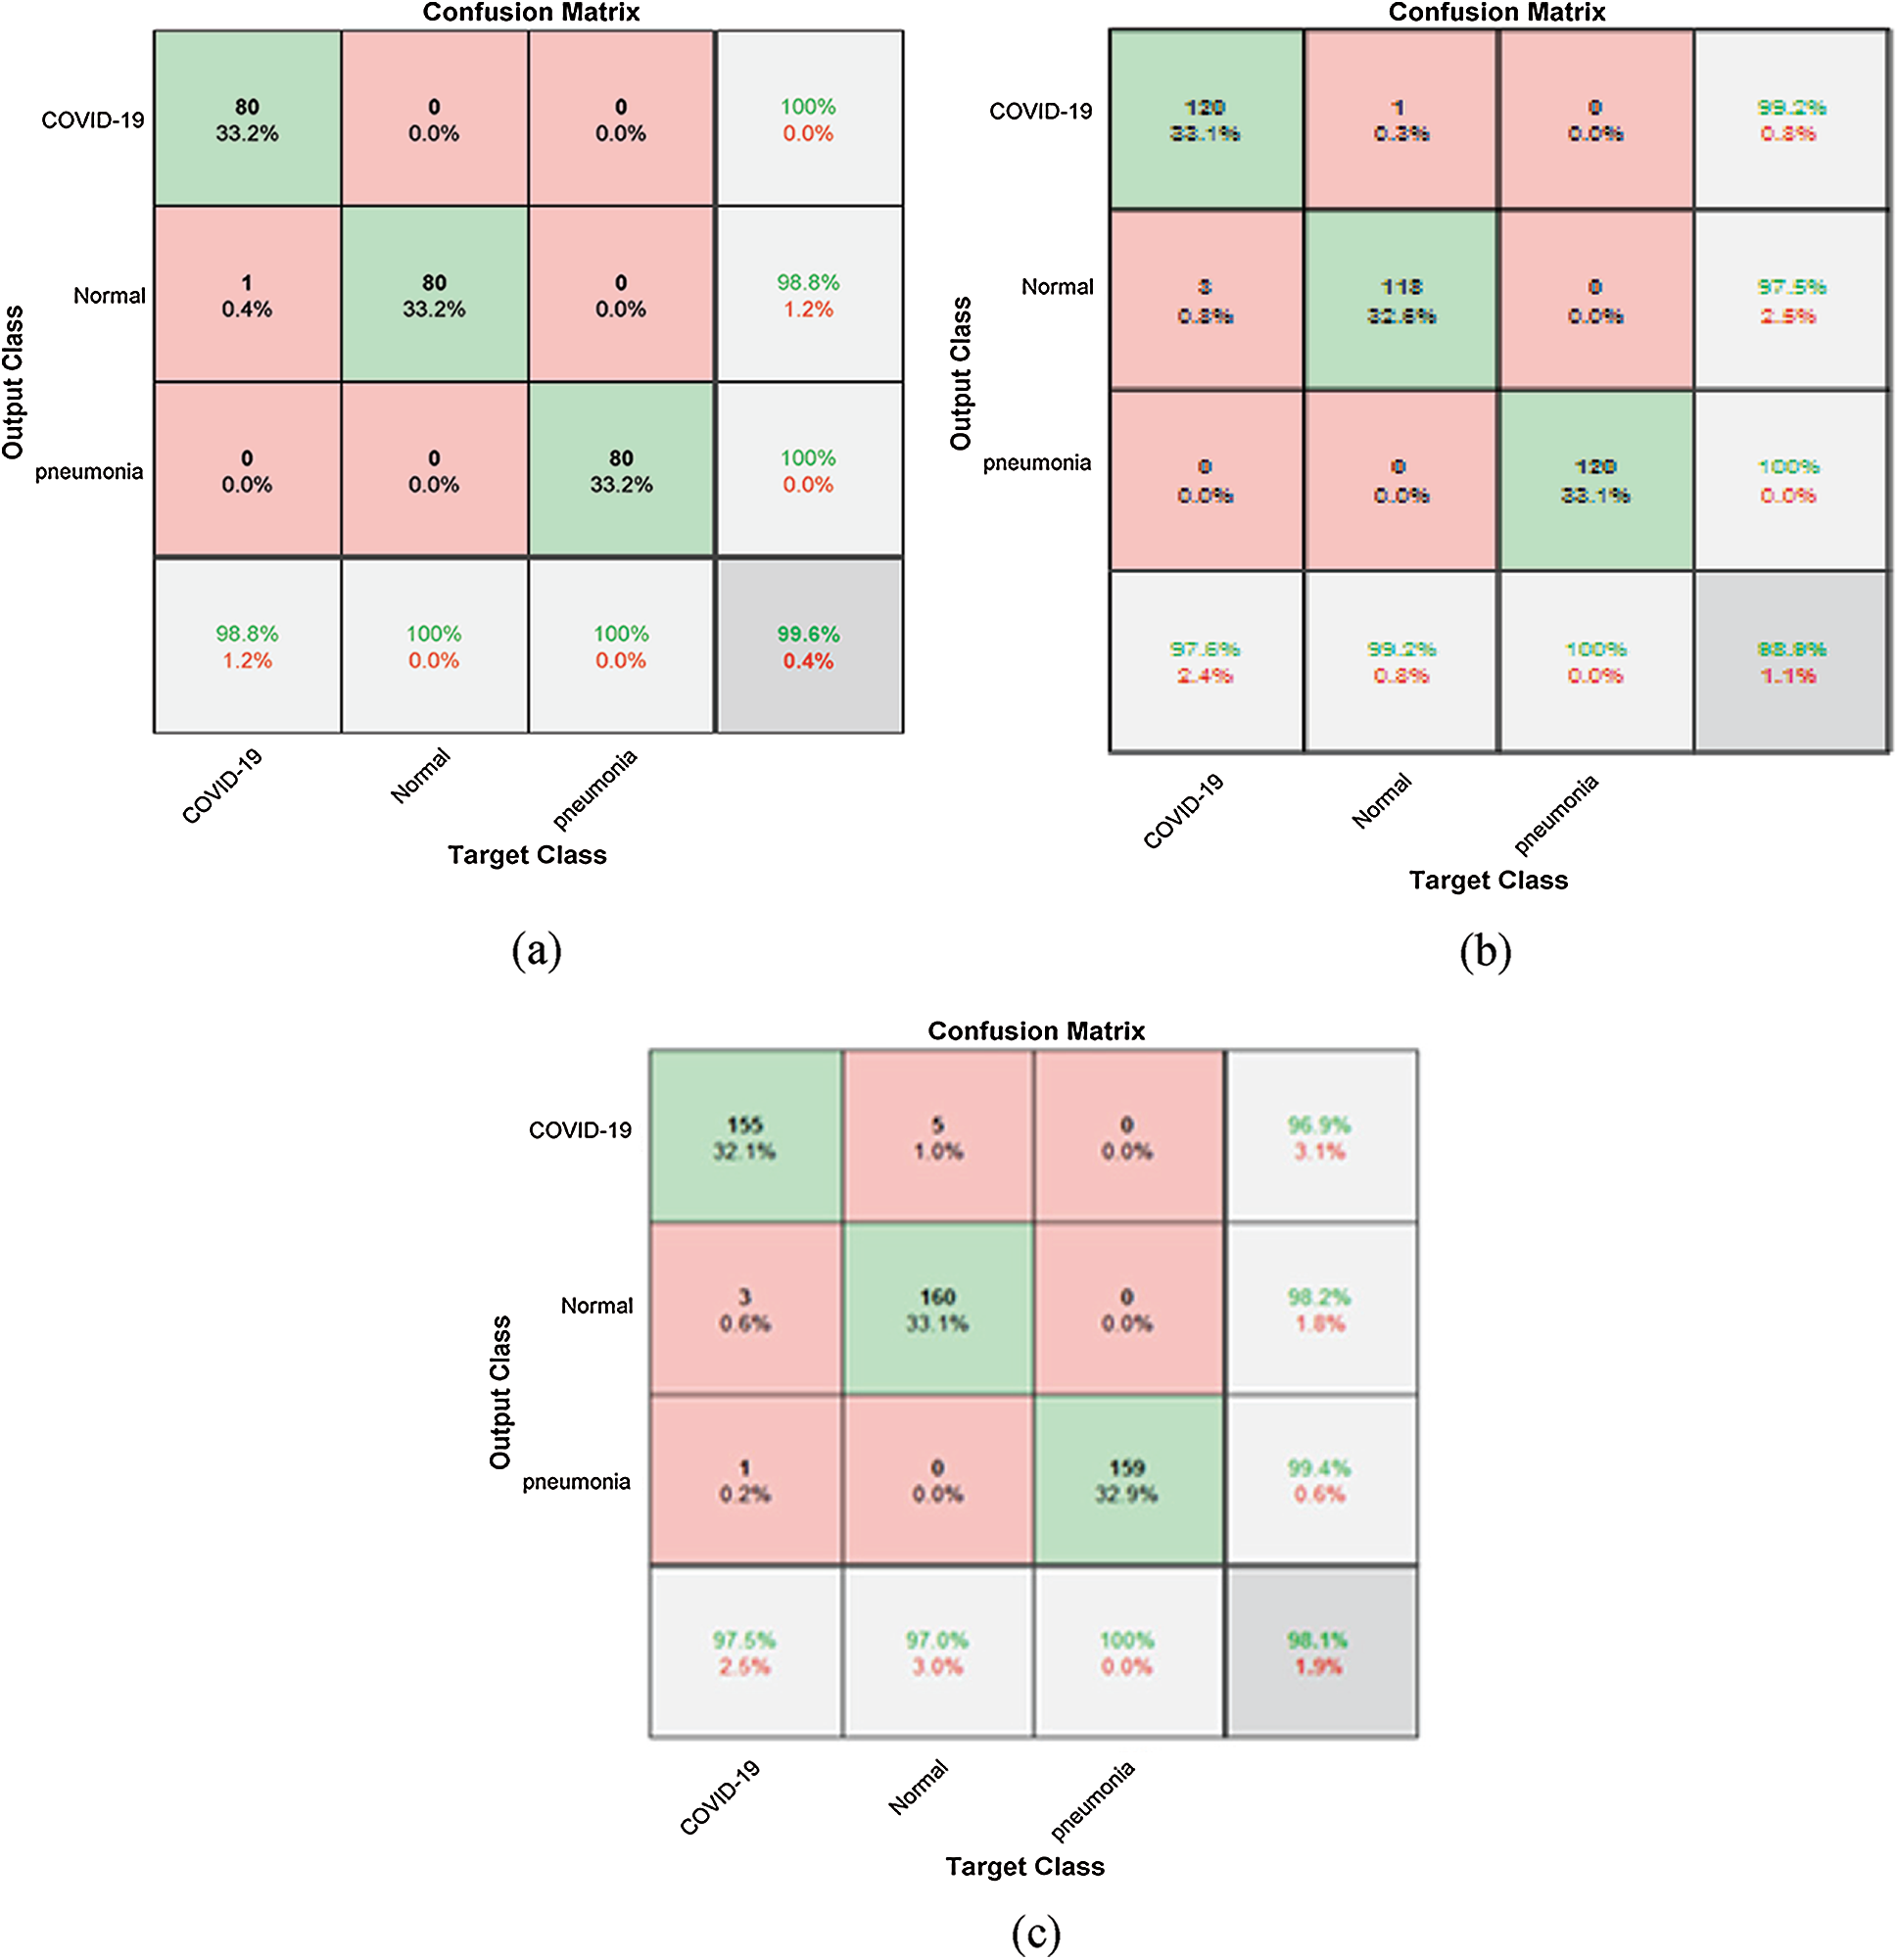
Figure 10: Confusion matrix (a) 80% for training and 20% for testing, (b) 70% for training and 30% for testing, (c) 60% for training 40% for testing
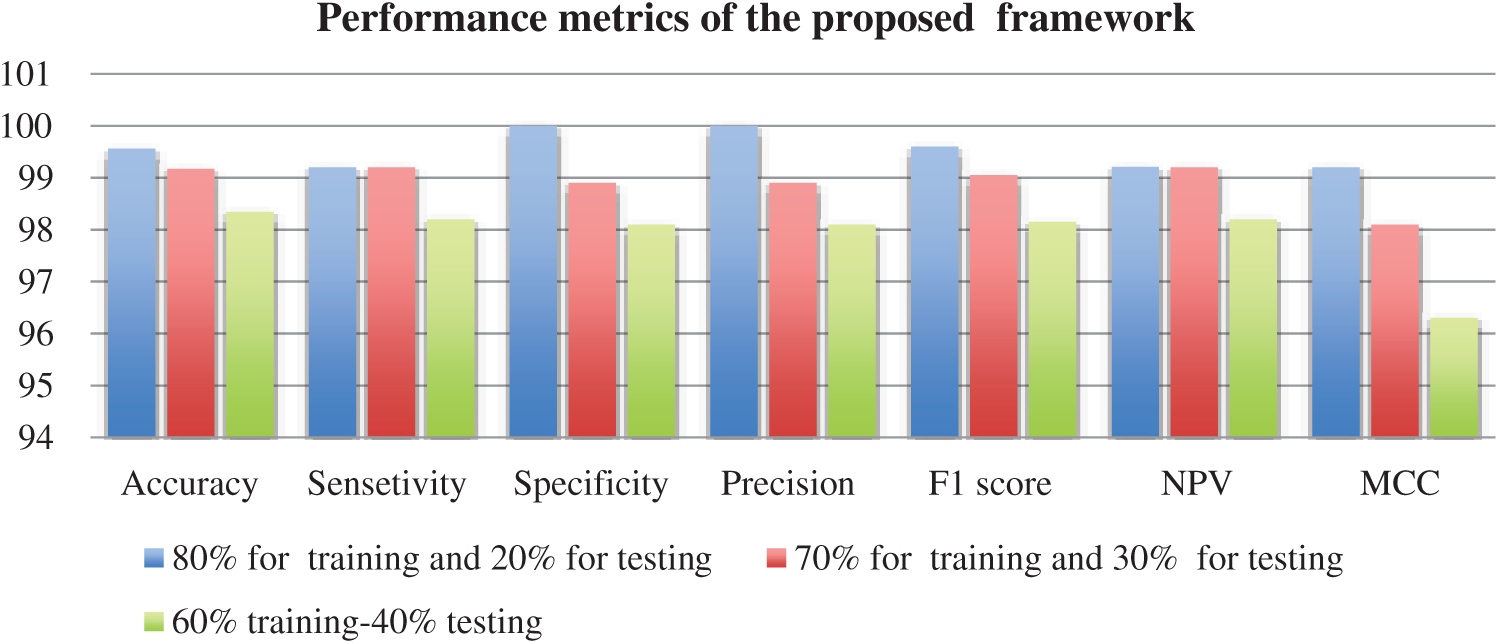
Figure 11: Performance evaluation of the proposed framework
Table 1: Evaluation metric values of the proposed framework for classification with 80% for training and 20% for testing
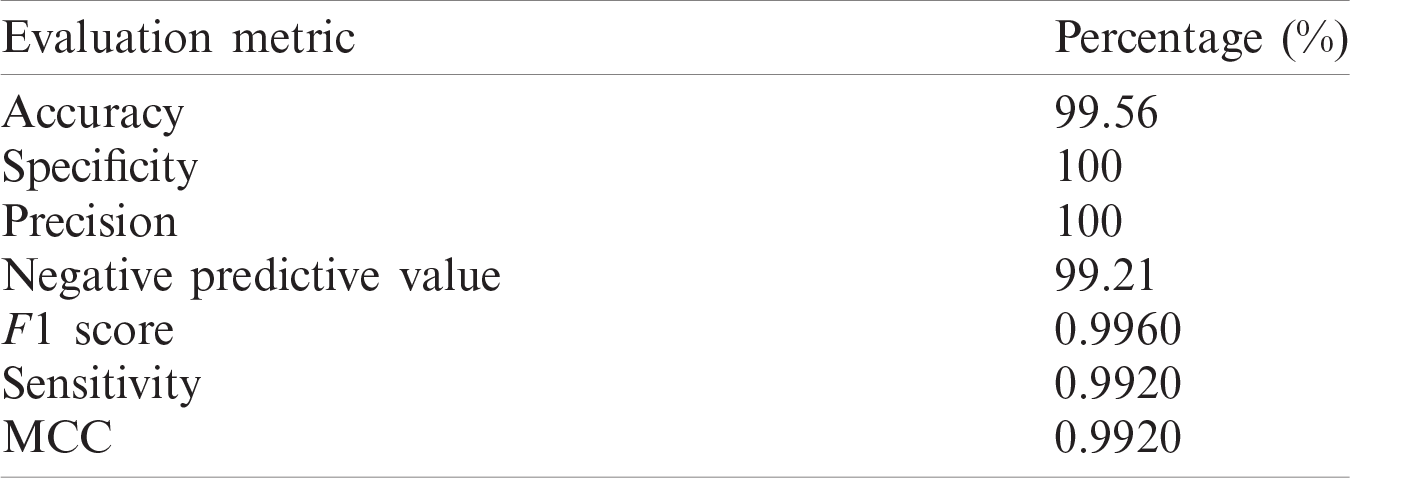
Table 2: Evaluation metric values of the proposed framework with 70% for training and 30% for testing

Table 3: Evaluation metric values of the proposed framework with 60% for training and 40% for testing
Figs. 12 and 13 illustrate the resulting segmented COVID-19 and pneumonia CT images. The visual images reveal the difference between COVID-19 and pneumonia cases in segmented images. In addition, the evaluation metrics of the resulting segmented images ensure high accuracy and efficiency of segmentation.
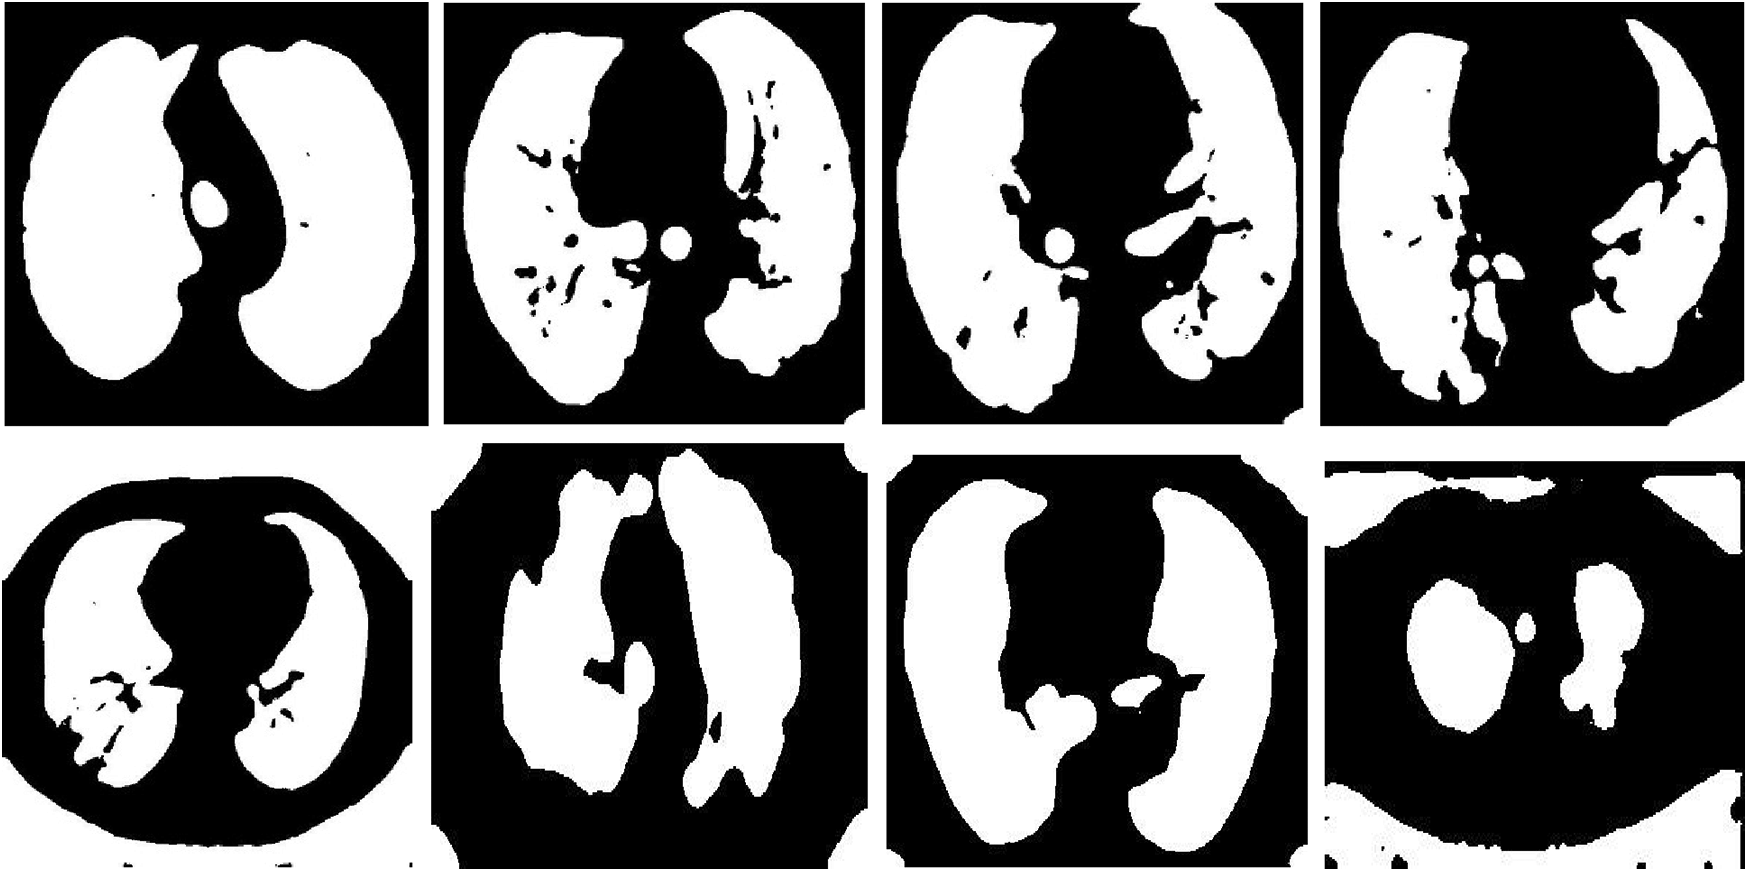
Figure 12: Samples of resulting segmented COVID-19 images
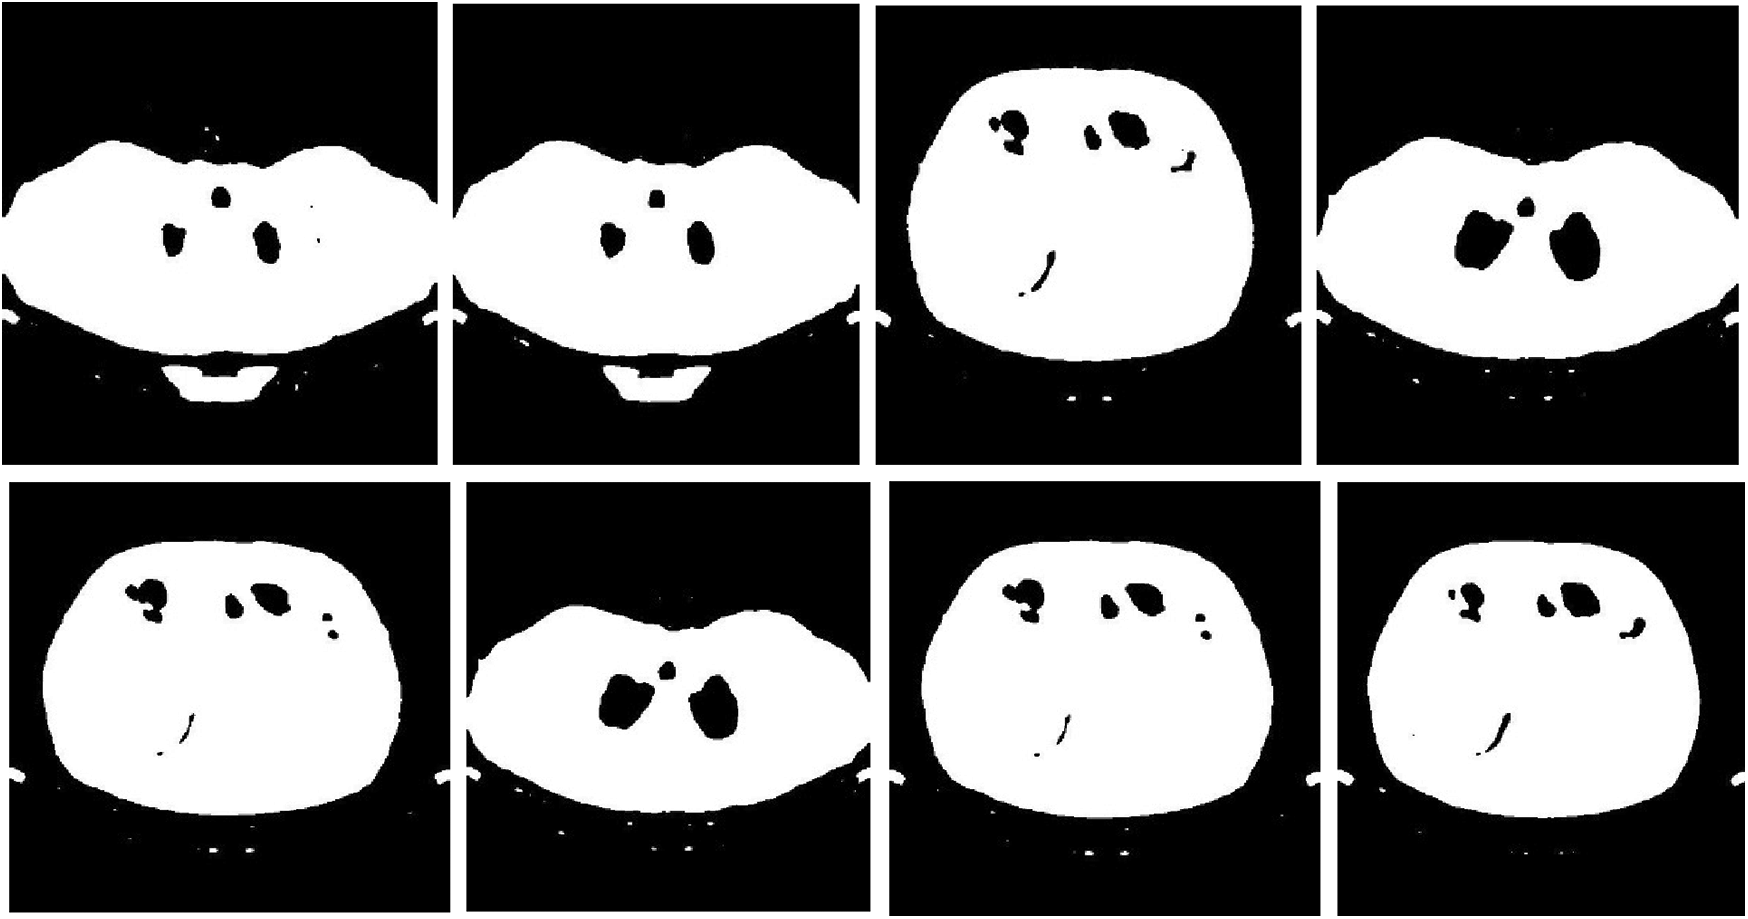
Figure 13: Samples of resulting segmented pneumonia images
The proposed framework is applied to segment and classify COVID-19, normal, and pneumonia CT images. The classification process is performed with a CNN, and it achieves accuracies of 99.59%, 99.17%, and 98.34% for the 80% for training and 20% for testing, 70% for training and 20% for testing, and 60% for training and 40% for testing, respectively. The proposed framework for classification and segmentation achieves high performance. Also, visual results reveal a difference between COVID-19 and pneumonia CT images.
Table 4: Evaluation metric values of samples of segmented COVID-19 CT images

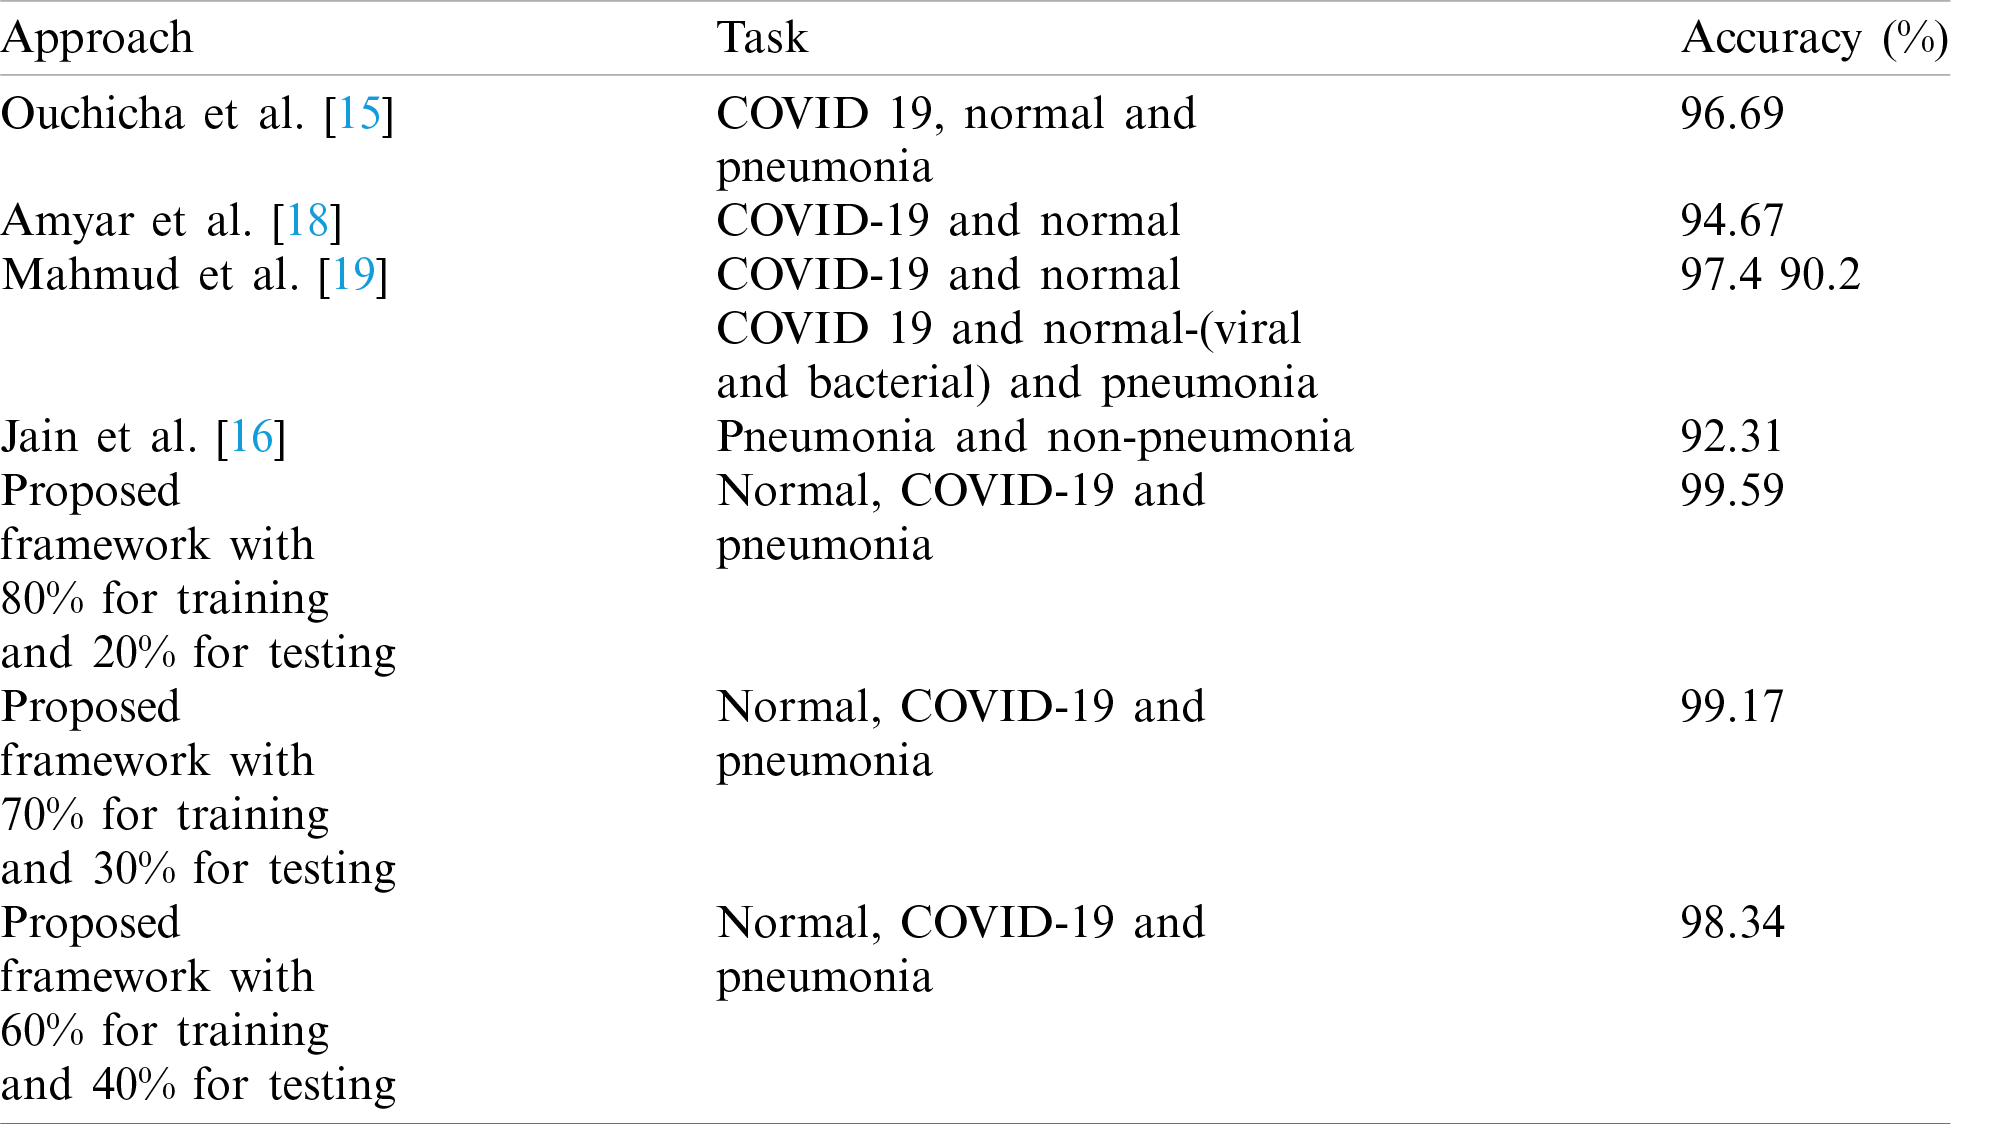
Tab. 4 illustrates segmentation metrics of segmented COVID-19 CT images. Tab. 5 illustrates segmentation metrics of segmented pneumonia CT images. Tab. 6 gives a comparison between the proposed framework for COVID-19 and pneumonia image segmentation and other models. The proposed framework is more accurate than other models. Tab. 7 illustrates a performance comparison between the proposed framework for classification and other models. The proposed framework is more accurate than the other models.
Table 5: Evaluation metric values of samples of the resulting segmented pneumonia CT images
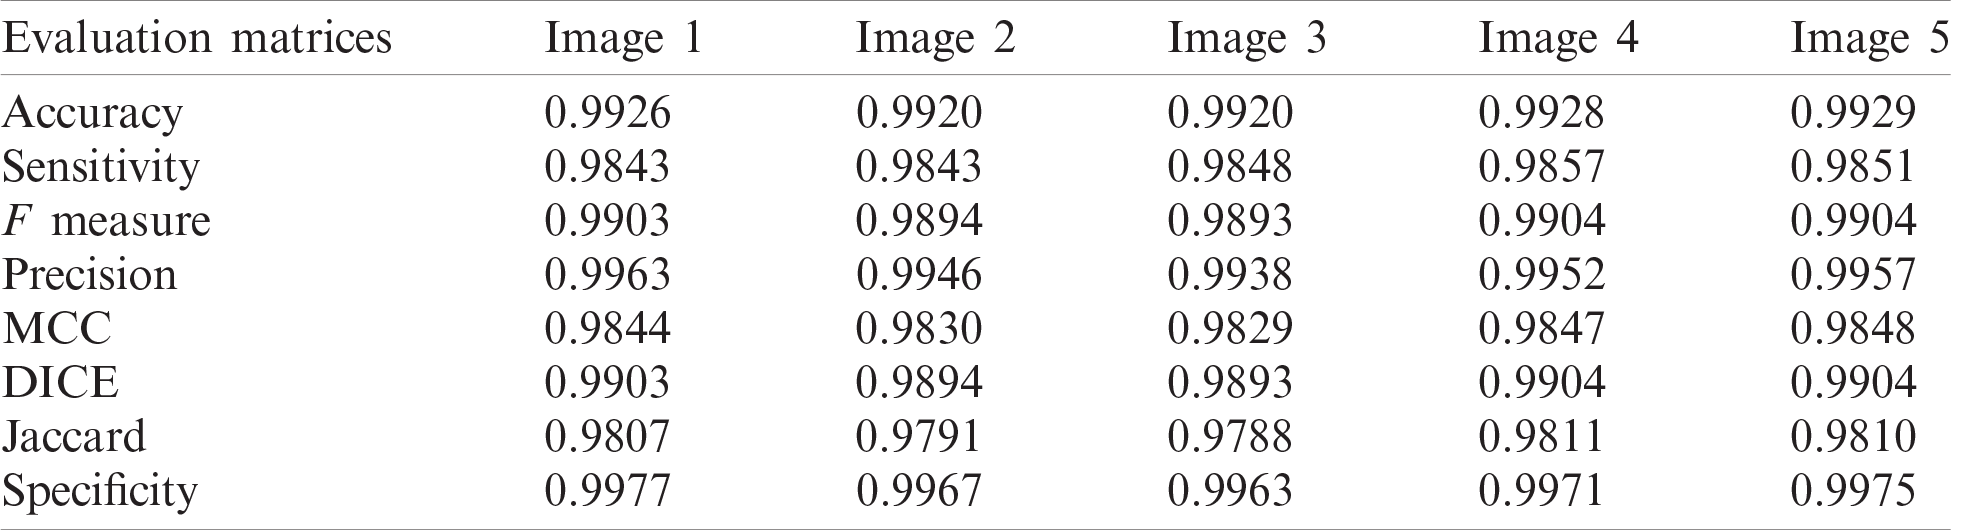
Table 6: Comparison between the proposed framework for segmentation and other models
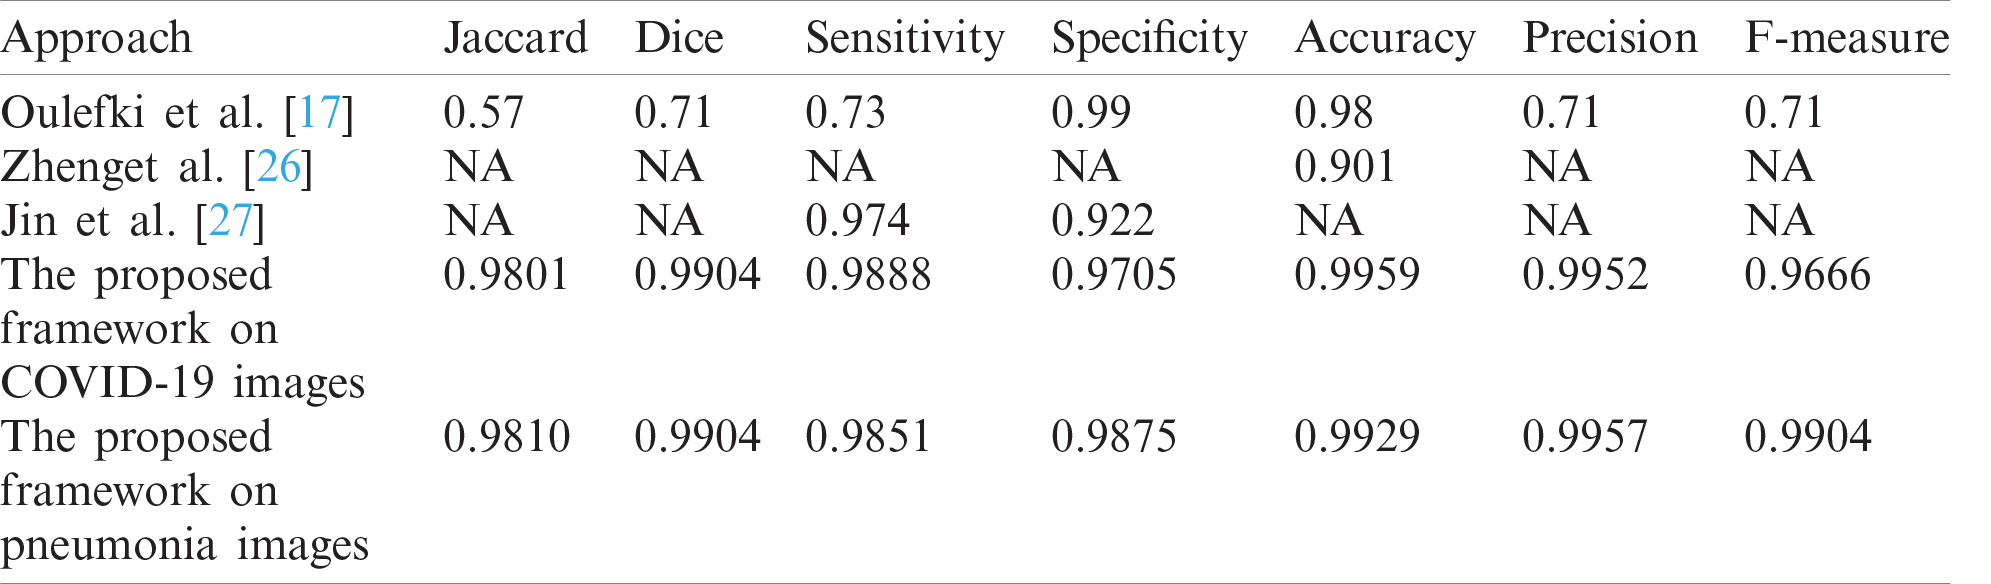
Table 7: Comparison between the proposed framework for classification and other models
This paper presented an efficient framework for the classification and segmentation of COVID-19, normal, and pneumonia CT images. The classification process is based on a CNN composed of four Conv layers, four max-pooling layers, and a classification layer. A novel saliency-based region detection algorithm and an active contour segmentation strategy are applied for the segmentation of COVID-19 and pneumonia CT images. Simulation results proved that the accuracy level achieved on CT images with the CNN reaches 99.59%. The outcomes of the suggested framework are better compared to those of the other conventional models. In the future, we can incorporate advanced deep learning and transfer learning algorithms for the classification and segmentation processes on large datasets of COVID-19, X-ray and CT images for achieving a more efficient automated diagnosis process.
Acknowledgement: The authors would like to thank the support of the Deanship of Scientific Research at Princess Nourah bint Abdulrahman University.
Funding Statement: This research was funded by the Deanship of Scientific Research at Princess Nourah Bint Abdulrahman University through the Fast-track Research Funding Program.
Conflicts of Interest: The authors declare that they have no conflicts of interest to report regarding the present study.
1. Medical imaging, 2020. https://innovatemedtec.com/digital-health/medical-imaging (Accessed on 1 December 2020). [Google Scholar]
2. Medical imaging techniques, 2020. https://www.physiopedia.com/Medical_Imaging (Accessed on 5 December 2020). [Google Scholar]
3. Computed tomography images, 2020. https://www.nibib.nih.gov/science-education/science-topics/computed-to-mography-ct (Accessed on 7 December 2020). [Google Scholar]
4. COVID-19 dataset, 2020. https://www.who.int/emergencies/diseases/novel-coronavirus-2019 (Accessed on 7 December 2020). [Google Scholar]
5. E. El-Kenawy, A. Ibrahim, S. Mirjalili, M. Eid and S. E. Hussein, “Novel feature selection and voting classifier algorithms for COVID-19 classification in CT images,” IEEE Access, vol. 8, pp. 179317–179335, 2020. [Google Scholar]
6. COVID-19 images, 2020. http://www.fao.org/policy-support/tools-and-publications/resources-details/ar/c/1307-988/ (Accessed on 3 January 2021). [Google Scholar]
7. N. El-Hag, A. Sedik, W. El-Shafai, H. El-Hoseny, A. Khalaf et al., “Classification of retinal images based on convolutional neural network,” Microscopy Research and Technique, vol. 84, no. 3, pp. 394–414, 2021. [Google Scholar]
8. S. Dutta, B. Manideep, S. Basha, R. Caytiles and N. Iyengar, “Classification of diabetic retinopathy images by using deep learning models,” International Journal of Grid and Distributed Computing, vol. 11, no. 1, pp. 89–106, 2018. [Google Scholar]
9. F. Altaf, S. Islam, N. Akhtar and N. Janjua, “Going deep in medical image analysis: Concepts, methods, challenges, and future directions,” IEEE Access, vol. 7, pp. 99540–99572, 2019. [Google Scholar]
10. T. Shanthi and R. Sabeenian, “Modified alexnet architecture for classification of diabetic retinopathy images,” Computers & Electrical Engineering, vol. 76, no. May (6), pp. 56–64, 2019. [Google Scholar]
11. T. Rahman, M. Chowdhury, A. Khandakar, K. Islam, K. Islam et al., “Transfer learning with deep convolutional neural network (CNN) for pneumonia detection using chest x-ray,” Applied Sciences, vol. 10, no. 9, pp. 3233, 2020. [Google Scholar]
12. J. Ferreira, D. Cardenas, R. Moreno, M. Rebelo, J. Krieger et al., “Multi-view ensemble convolutional neural network to improve classification of pneumonia in low contrast chest x-ray images,” in Proc. 42nd Annual Int. Conf. of the IEEE Engineering in Medicine & Biology Society, Montreal, QC, Canada, pp. 1238–1241, 2020. [Google Scholar]
13. A. Sahlol, D. Yousri, A. Ewees, M. Al-Qaness, R. Damasevicius et al., “COVID-19 image classification using deep features and fractional-order marine predators algorithm,” Scientific Reports, vol. 10, no. 1, pp. 1–15, 2020. [Google Scholar]
14. M. Turkoglu, “COVIDetectioNet: COVID-19 diagnosis system based on X-ray images using features selected from pre-learned deep features ensemble,” Applied Intelligence, vol. 51, no. 3, pp. 1213–1226, 2021. [Google Scholar]
15. C. Ouchicha, O. Ammor and M. Meknassi, “CVDNet: A novel deep learning architecture for detection of coronavirus (Covid-19) from chest x-ray images,” Chaos, Solitons & Fractals, vol. 140, no. 110245, pp. 1–12, 2020. [Google Scholar]
16. R. Jain, P. Nagrath, G. Kataria, V. Kaushik and D. Hemanth, “Pneumonia detection in chest x-ray images using convolutional neural networks and transfer learning,” Measurement, vol. 165, no. 108046, pp. 1–10, 2020. [Google Scholar]
17. A. Oulefki, S. Agaian, T. Trongtirakul and A. Laouar, “Automatic COVID-19 lung infected region segmentation and measurement using CT-scans images,” Pattern Recognition, vol. 114, no. 107747, pp. 1–14, 2020. [Google Scholar]
18. A. Amyar, R. Modzelewski, H. Li and S. Ruan, “Multi-task deep learning based CT imaging analysis for COVID-19 pneumonia: Classification and segmentation,” Computers in Biology and Medicine, vol. 126, no. 104037, pp. 1–10, 2020. [Google Scholar]
19. T. Mahmud, M. Rahman and S. Fattah, “CovXNet: A multi-dilation convolutional neural network for automatic COVID-19 and other pneumonia detection from chest x-ray images with transferable multi-receptive feature optimization,” Computers in Biology and Medicine, vol. 122, no. 103869, pp. 1–11, 2020. [Google Scholar]
20. S. Wang, B. Kang, J. Ma, X. Zeng, M. Xiao et al., “A deep learning algorithm using CT images to screen for corona virus disease (COVID-19),” European Radiology, vol. 20, pp. 1–9, 2021. [Google Scholar]
21. C. Huang, S. Ni and G. Chen, “A layer-based structured design of CNN on FPGA,” in Proc. IEEE 12th Int. Conf. on ASIC, Guiyang, China, pp. 1037–1040, 2017. [Google Scholar]
22. S. Albawi, T. Abed Mohammed and S. Al-Zawi, “Understanding of a convolutional neural network,” in Proc. IEEE Int. Conf. on Engineering and Technology, Antalya, Turkey, pp. 1–6, 2017. [Google Scholar]
23. H. Khalil, N. El-Hag, A. Sedik, W. El-Shafai, A. Mohamed et al., “Classification of diabetic retinopathy types based on convolution neural network (CNN),” Menoufia Journal of Electronic Engineering Research, vol. 20, no. ICEEM2019-Special Issue, pp. 126–153, 2019. [Google Scholar]
24. E. El-Kenawy, A. Ibrahim, S. Mirjalili, M. Eid and S. Hussein, “Novel feature selection and voting classifier algorithms for COVID-19 classification in CT images,” IEEE Access, vol. 8, pp. 179317–179335, 2020. [Google Scholar]
25. A. Sedik, A. Iliyasu, A. El-Rahiem, M. Abdel Samea, A. Abdel-Raheem et al., “Deploying machine and deep learning models for efficient data-augmented detection of COVID-19 infections,” Viruses, vol. 12, no. 7, pp. 1–29, 2020. [Google Scholar]
26. C. Zheng, X. Deng, Q. Fu, Q. Zhou, J. Feng et al., “Deep learning-based detection for COVID-19 from chest CT using weak label,” medRxiv, pp. 1–13, 2020. https://doi.org/10.1101/2020.03.12.20027185. [Google Scholar]
27. S. Jin, B. Wang, H. Xu, C. Luo, L. Wei et al., “Wei etal, AI-assisted CT imaging analysis for COVID-19 screening: Building and deploying a medical AI system in four weeks,” Applied Soft Computing, vol. 98, no. 106, pp. 1–11, 2021. [Google Scholar]
28. A. Joshi, M. Khan, S. Soomro, A. Niaz, B. Han et al., “SRIS: Saliency-based region detection and image segmentation of COVID-19 infected cases,” IEEE Access, vol. 8, pp. 190487–190503, 2020. [Google Scholar]
29. H. Li and K. Ngan, “Saliency model-based face segmentation and tracking in head-and-shoulder video sequences,” Journal of Visual Communication and Image Representation, vol. 19, no. 5, pp. 320–333, 2008. [Google Scholar]
30. C. Lee, J. Leou and H. Hsiao, “Saliency-directed color image segmentation using modified particle swarm optimization,” Signal Processing, vol. 92, no. 1, pp. 1–18, 2012. [Google Scholar]
31. X. Bai and W. Wang, “Saliency-SVM: An automatic approach for image segmentation,” Neuro-computing, vol. 136, pp. 243–255, 2014. [Google Scholar]
32. C. Qin, G. Zhang, Y. Zhou, W. Tao and Z. Cao, “Integration of the saliency-based seed extraction and random walks for image segmentation,” Neuro-Computing, vol. 129, pp. 378–339, 2014. [Google Scholar]
33. N. Anh, V. Nhat, K. Elyor, S. Kim and G. Lee, “Fast automatic saliency map driven geometric active contour model for color object segmentation,” in Proc. of the 21st IEEE Int. Conf. on Pattern Recognition, Tsukuba, Japan, pp. 2557–2560, 2012. [Google Scholar]
34. L. Yang, D. Xin, L. Zhai, F. Yuan and X. Li, “Active contours driven by visual saliency fitting energy for image segmentation in SAR images,” in Proc. IEEE 4th Int. Conf. on Cloud Computing and Big Data Analysis, Chengdu, China, pp. 393–397, 2019. [Google Scholar]
35. R. Achanta, S. Hemami, F. Estrada and S. Susstrunk, “Frequency-tuned salient region detection,” in Proc. IEEE Conf. on Computer Vision and Pattern Recognition, Miami, FL, USA, pp. 1597–1604, 2009. [Google Scholar]
36. G. Aubert and P. Kornprobst, Mathematical Problems in Image Processing: Partial Differential Equations and the Calculus of Variations. vol. 147. Berlin, Germany: Springer Science & Business Media, 2006. [Google Scholar]
37. A. Taha and A. Hanbury, “Metrics for evaluating 3D medical image segmentation: Analysis, selection, and tool,” BMC Medical Imaging, vol. 15, no. 1, pp. 1–28, 2015. [Google Scholar]
38. M. Mielle, M. Magnusson and A. J. Lilienthal, “A method to segment maps from different modalities using free space layout maoris: Map of ripples segmentation,” in Proc. IEEE Int. Conf. on Robotics and Automation, Brisbane, QLD, Australia, pp. 4993–4999, 2018. [Google Scholar]
 | This work is licensed under a Creative Commons Attribution 4.0 International License, which permits unrestricted use, distribution, and reproduction in any medium, provided the original work is properly cited. |