DOI:10.32604/cmc.2021.017892
| Computers, Materials & Continua DOI:10.32604/cmc.2021.017892 | |
| Article |
Hybrid Segmentation Scheme for Skin Features Extraction Using Dermoscopy Images
School of Electrical Engineering, Korea University, 145, Anam-ro, Seongbuk-gu, Seoul, Korea
*Corresponding Author: Eenjun Hwang. Email: ehwang04@korea.ac.kr
Received: 16 February 2021; Accepted: 03 April 2021
Abstract: Objective and quantitative assessment of skin conditions is essential for cosmeceutical studies and research on skin aging and skin regeneration. Various handcraft-based image processing methods have been proposed to evaluate skin conditions objectively, but they have unavoidable disadvantages when used to analyze skin features accurately. This study proposes a hybrid segmentation scheme consisting of Deeplab v3+ with an Inception-ResNet-v2 backbone, LightGBM, and morphological processing (MP) to overcome the shortcomings of handcraft-based approaches. First, we apply Deeplab v3+ with an Inception-ResNet-v2 backbone for pixel segmentation of skin wrinkles and cells. Then, LightGBM and MP are used to enhance the pixel segmentation quality. Finally, we determine several skin features based on the results of wrinkle and cell segmentation. Our proposed segmentation scheme achieved a mean accuracy of 0.854, mean of intersection over union of 0.749, and mean boundary F1 score of 0.852, which achieved 1.1%, 6.7%, and 14.8% improvement over the panoptic-based semantic segmentation method, respectively.
Keywords: Image segmentation; skin texture; feature extraction; dermoscopy image
Skin texture is the outermost indicator of the skin condition or the progression level of skin aging. Skin texture depends on various intrinsic and extrinsic factors that affect the health of the skin layers [1–5]. For instance, prolonged exposure to sunlight and excessive smoking can adversely affect skin layers, as the skin loses moisture and becomes dry, which is then reflected in the skin texture. Therefore, tracking and observing changes in skin texture can help intuitively understand changes in skin health.
However, objective assessment of skin condition has been regarded as challenging because dermatologists have traditionally diagnosed the skin condition by examining the skin texture with the naked eye, making the diagnostic results subjective. To diagnose the skin condition objectively, two-general approaches have been proposed: three-dimensional topography analysis (3DTA) and two-dimensional image analysis (2DIA).
3DTA mainly analyzes depth-related skin features such as maximal, mean, minimum depth of roughness, and smoothness [6–9]. This usually requires silicon replicas of the skin surface and optical equipment. Therefore, 3DTA suffers from significant problems such as long processing time, complexity of analysis, and high cost. In contrast, most 2DIA methods focus on analyzing the structural shapes of skin texture using dermoscopy devices [10–17]. The 2DIA methods aim to extract diverse representative visual features from dermoscopy images, such as irregular polygons and borderlines that are regarded as cells and wrinkles, respectively. Skin features include wrinkle width, wrinkle length, and the density of cells that can be used as essential criteria to evaluate skin conditions or estimate the degree of skin aging [12–14]. For decades, 2DIA methods have generally been used for skin condition diagnosis in terms of time and cost efficiency, but 2DIA methods, too, suffer from various limitations:
• The image preprocessing steps of 2DIA methods, such as contrast enhancement, noise removal, and color histogram equalization, have been designed differently for different datasets.
• Most 2DIA methods have opted for a handcrafted feature-based method, but handcrafted features are generally not robust and are computationally intensive due to their high dimensionality.
• Traditional 2DIA methods must choose which features are important in a given dataset. Therefore, substantial engineering experience and dermatology knowledge are required to obtain successful results.
Deep learning is one alternative technique to handcrafted feature-based approaches because it can learn visual features automatically to solve a specific task, such as object classification and target segmentation. In many research fields, a convolutional neural network (CNN)-based model, which is a deep learning technique, has been reported to be extremely effective compared with handcraft-based approaches. We believe that applying a deep learning model overcomes the disadvantage of the 2DIA methods in accurate skin feature extraction. In this study, we address three major issues, with the following main contributions:
• We performed wrinkle and cell segmentation using Deeplab v3+ [18] with an Inception-ResNet-v2 backbone [19], which is a popular CNN model. By using this approach, we overcome the serious limitations of traditional handcrafted feature-based methods.
• We improved the quality of wrinkle and cell segmentation by using LightGBM [20] and morphological processing (MP), which can accurately extract skin features.
• We demonstrated the effectiveness of our proposed scheme by extracting various skin features from the segmentation results and comparing them with other existing methods in terms of accuracy.
The remainder of this paper is organized as follows. Related works of skin image analysis are introduced in Section 2. The major differences between previous works and our proposed scheme are described in Section 3. Finally, the experimental results and conclusions are presented in Sections 4 and 5, respectively.
This section presents several studies that have been conducted to assess skin conditions. Since the 2000s, most skin image analyses have been performed through molding replica analysis based on the 3DTA method [21–23]. Masuda et al. [21] proposed a 3D morphological characterization method for molding replica analysis. Using 3D measurement equipment and a surface analysis method, they extracted and analyzed several skin texture features such as depth, width, and length of skin furrows. Friedman et al. [22] conducted a 3D skin topology analysis, a non-invasive approach for identifying facial rhytides and acne scars. They utilized a micro-topology imaging system and a charge-coupled device (CCD) camera to record the skin surface topology. They concluded that 3D skin topology analysis could allow fast and quantitative assessment of skin conditions. Molding replica and 3D topology analysis methods have been regarded as useful approaches, but their requirements for expensive equipment and substantial analytic experience make their widespread application difficult.
Recently, 2DIA-based approaches have attracted much attention [15–17,24–28]. Zou et al. [17] suggested an objective modeling approach for skin surface characterization. They developed new measurement parameters, including polygons on the skin texture and the average area of the polygons detected. They argued that skin surface analysis using image processing techniques is useful for quantitatively expressing the skin condition. Cula et al. [24] proposed an automatic wrinkle detection algorithm to extract the orientation of polygon borders and bidirectional histogram features of illumination. Facial wrinkle features were extracted using contrast stretching and Gabor filtering, and the wrinkle types were classified to identify the subjects. Tanaka et al. [25] applied the cross-binarization method to detect skin wrinkles. Image binarization was first conducted for accurate wrinkle detection, and subsequently, the straight-line matching algorithm was applied to measure the length of skin wrinkles. Razalli et al. [26] proposed a wrinkle detection method to determine the relationship between aging and changes in wrinkle shape. The Hessian-based filter (HBF) was applied to extract the facial features, and then, the method was evaluated using the FG-NET database. Choi et al. [27] proposed a framework for skin texture extraction and skin aging trend estimation. The depth of wrinkles, wrinkle length and width, and the number of closed polygons were calculated as a feature set. Then, a support vector machine model was utilized to estimate the trend of skin aging. A skin aging estimation accuracy of more than 90% was achieved in a dermatologist’s blind test.
More recently, using the versatility of machine learning techniques, breakthrough attempts have been made to detect or diagnose critical diseases such as melanoma, lesions, and COVID-19 [29–33]. Afza et al. [29] proposed an optimal color feature selection scheme for skin lesion classification. They used contrast stretching, color feature extraction, and entropy-controlled feature optimization. To improve the performance of skin lesion classification, they proposed a hierarchical 3-step super-pixels with deep learning–based framework that includes a pre-trained deep learning model (ResNet-50) and a new optimization technique called Grasshopper [30]. Khan et al. [31] proposed an intelligent framework that includes Mask R-CNN, ResNet with feature pyramid network (FPN), and 24-layered CNN for localizing and classifying multi-class skin lesions. They used pre-trained DenseNet, entropy-controlled least square support vector machine and extreme learning machine (ELM) techniques to improve the accuracy of skin lesion classification [32].
To summarize, 3DTA, 2DIA, and machine learning methods have been used to objectively assess skin conditions and diagnose critical diseases such as melanoma and skin lesions. 3DTA is an excellent approach to accurately analyze skin conditions, but it requires expensive equipment and dermatological knowledge and experience. Although 2DIA is a cost-effective alternative to 3DTA, it is difficult to guarantee its applicability as most 2DIA methods follow a handcrafted feature-based method that makes it difficult to obtain robust features and rely heavily on an engineer’s experience and knowledge [34]. To overcome the shortcomings of the 3DTA and 2DIA methods, we propose a scheme that performs image segmentation based on a deep learning model and extracts accurate skin features from the segmentation result.
3.1 Comparison with Previous 2DIA Methods
In this section, we show the difference between the traditional 2DIA approaches and the proposed scheme. Traditional 2DIA methods for skin feature extraction first perform some preprocessing steps to eliminate light interference, noise, and distortion to obtain skin features of reasonable quality [10–17].
The skin image is then converted into a binary image, which is regarded as the groundwork for identifying wrinkle and cell areas. Fig. 1 presents the typical structure of traditional 2DIA methods with the preprocessing steps in the yellow box. Image cropping eliminates the harmful effects of vignetting because a luminous source of the skin image from a dermoscopy device is typically concentrated around its center [10–13]. Contrast stretching and histogram equalization can minimize light interference. Generally, noise filtering and morphological transformation improve the effectiveness of preprocessing. The watershed transform method [35] performs wrinkle and cell segmentation by calculating the intensity difference in a grayscale image and draws borderlines based on the intensity difference. Finally, wrinkles and cells are obtained using the watershed transform.
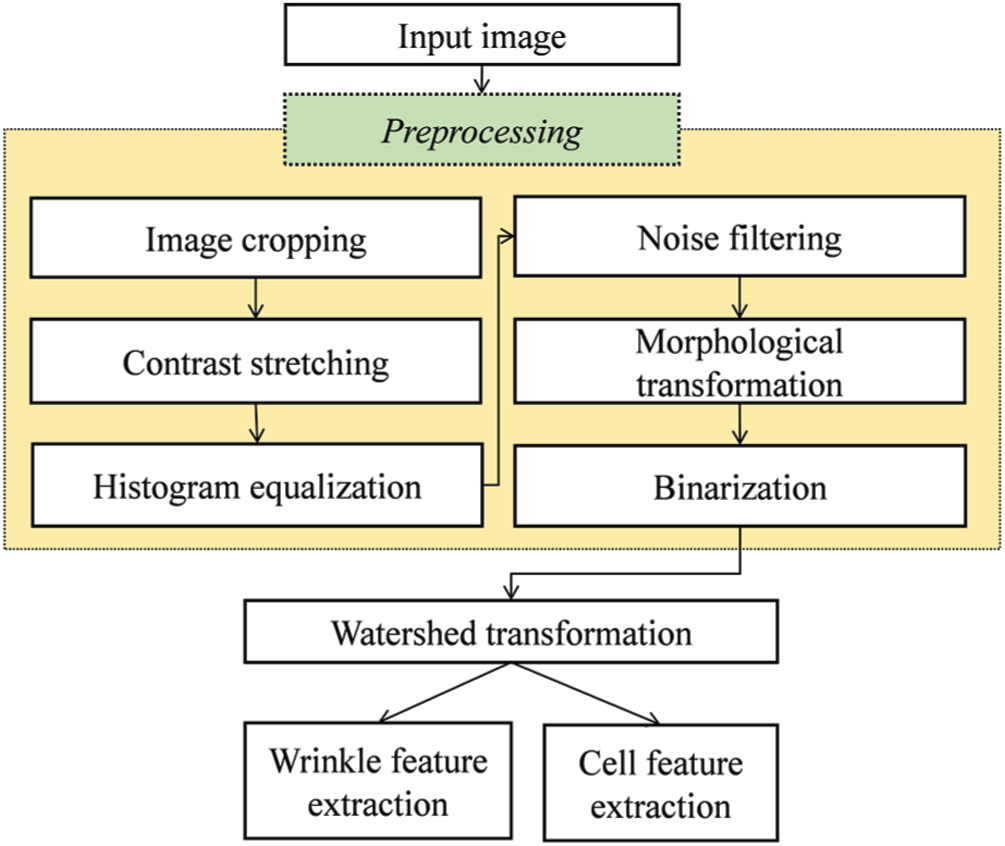
Figure 1: Typical structure of traditional 2DIA methods for skin feature extraction
Fig. 2 presents an illustration of our scheme. Unlike traditional approaches, our scheme adopts a CNN, LightGBM, and MP as preprocessing units. The CNN is organized by multiple convolutional layers that perform image classification and segmentation tasks. Convolutional layers reduce the images into a form that is easier to process without losing features. This is critical for achieving good predictions. Each convolutional layer extracts valuable visual features, considering image distortion, noise, and brightness. Therefore, well-designed convolutional layers can extract reasonable visual features that represent the semantic information of the image. For this, the Deeplab v3+ with Inception-ResNet-V2 backbone model, a popular CNN model, was used to replace several preprocessing steps in the traditional approach. In addition, to enhance the quality of binarization, LightGBM and MP were used together. Manually, the ground truth was made based on the annotated wrinkle and cell class for every pixel in the dermoscopy image, and these features were utilized to train the Inception-ResNet-V2 model [19]. Subsequently, we applied watershed transformation and performed wrinkle and cell feature extraction.
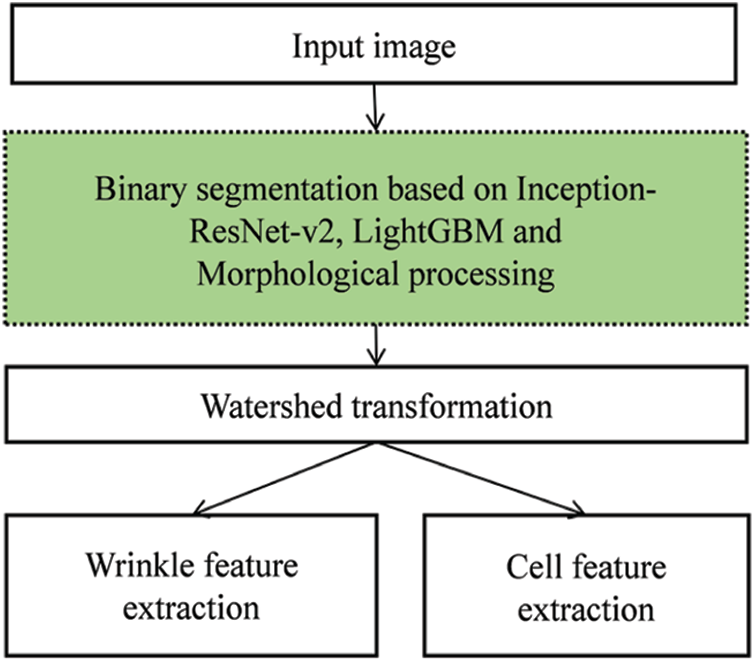
Figure 2: Overall structure of the proposed scheme for skin feature extraction
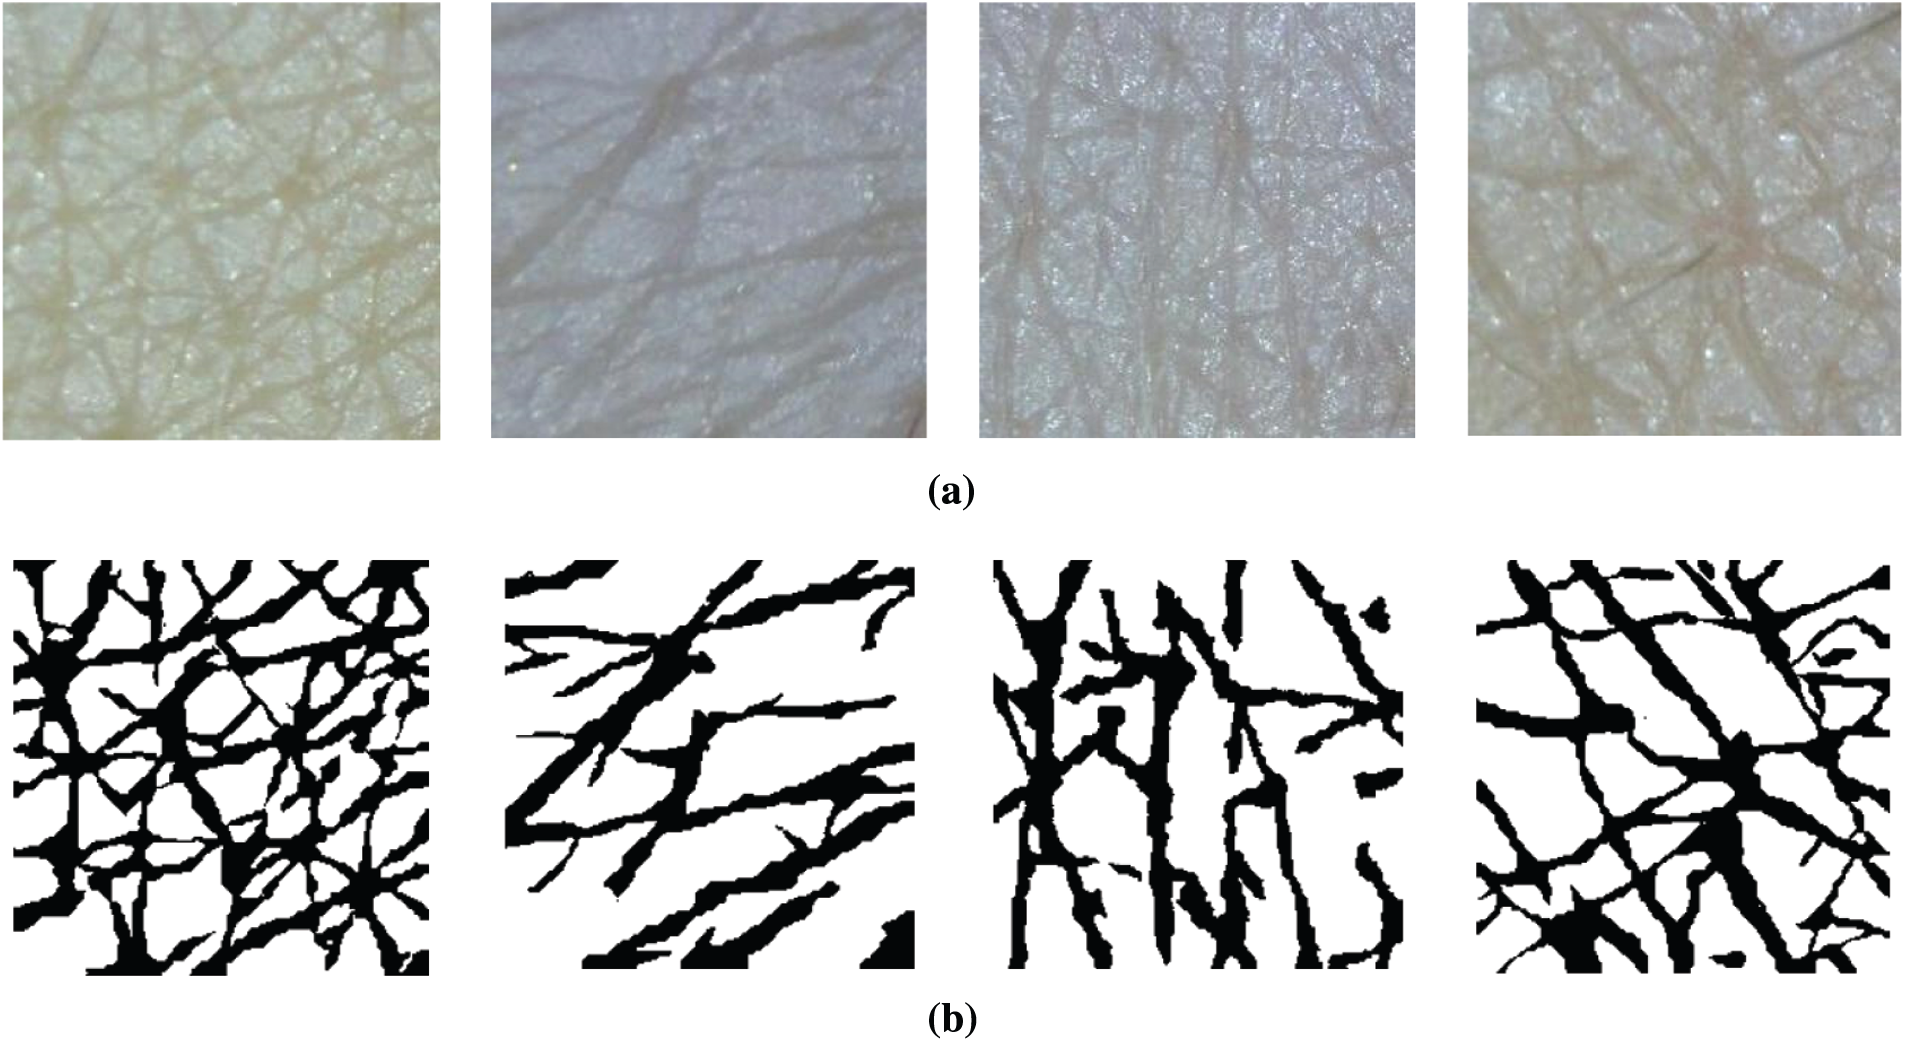
Figure 3: Segmentation examples (a) Input images (b) Ground truth
3.2 Wrinkle and Cell Segmentation
In this section, we present details of the wrinkle and cell segmentation process with the organized CNN architecture and LightGBM. Figs. 3a and 3b present the input skin images captured by a commercial dermoscopy device and their ground truth, respectively. We defined that the black pixels represent the wrinkle class and the white pixels indicate the cell class.
Fig. 4 presents the overall flow of our proposed scheme. In this study, a pre-trained Inception-ResNet-v2 model obtained from the MathWorks repository was used. Inception-ResNet-v2 showed the best performance in the ImageNet Large Scale Visual Recognition Challenge (ILSVRC) 2015, and its performance in object recognition and segmentation is better than other inception models, such as Inception-ResNet-v1, Inception-v3, and Inception-v4.
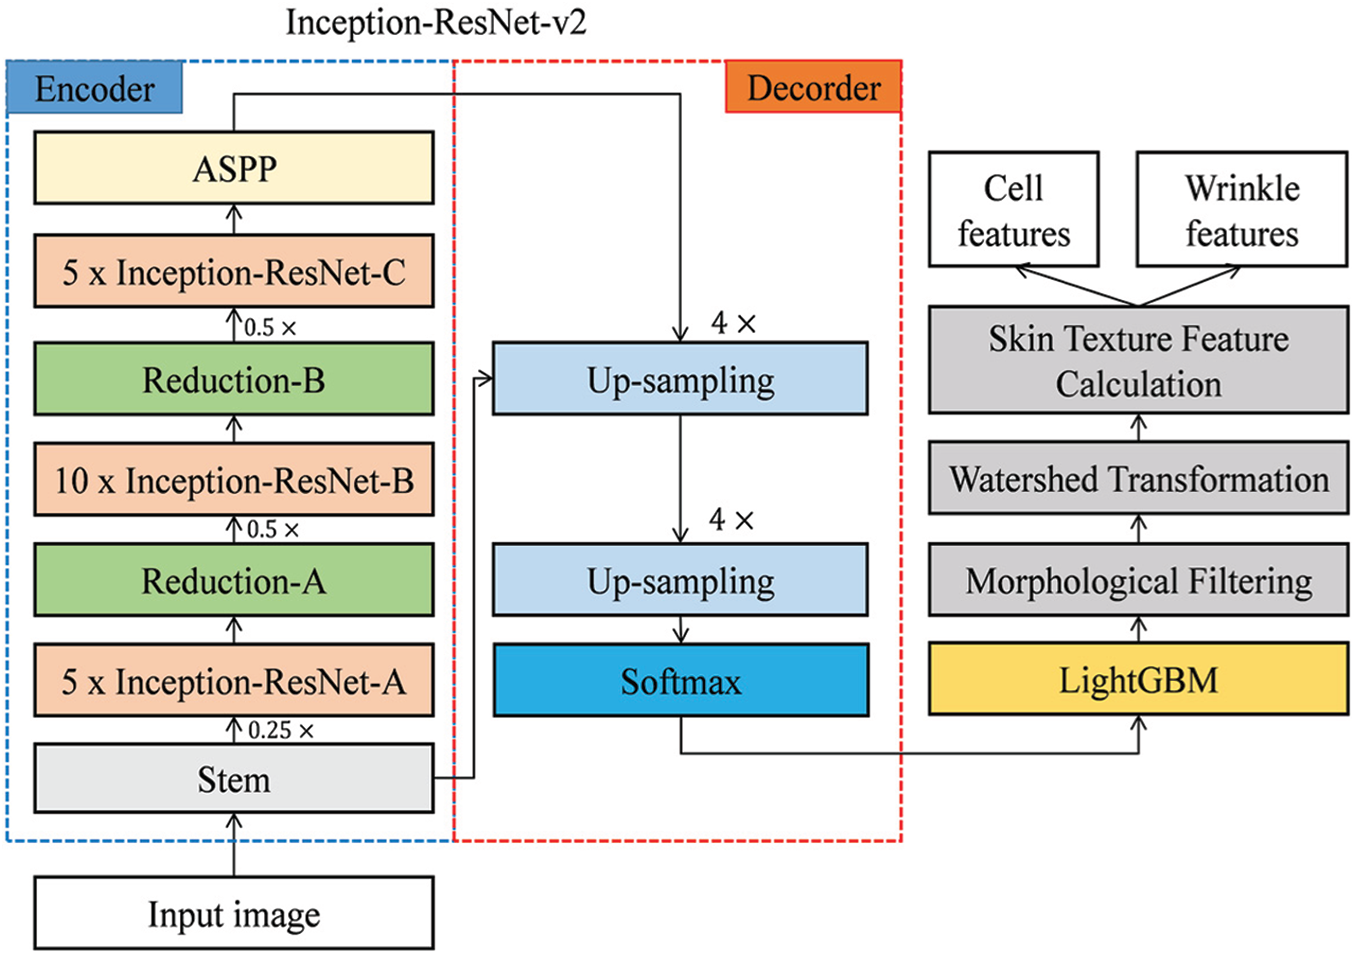
Figure 4: Overall flow of our proposed scheme
Inception-ResNet-v2 is a combination of residual connections and an inception module. The front module of Inception-ResNet-v2 is a stem layer, which generates a
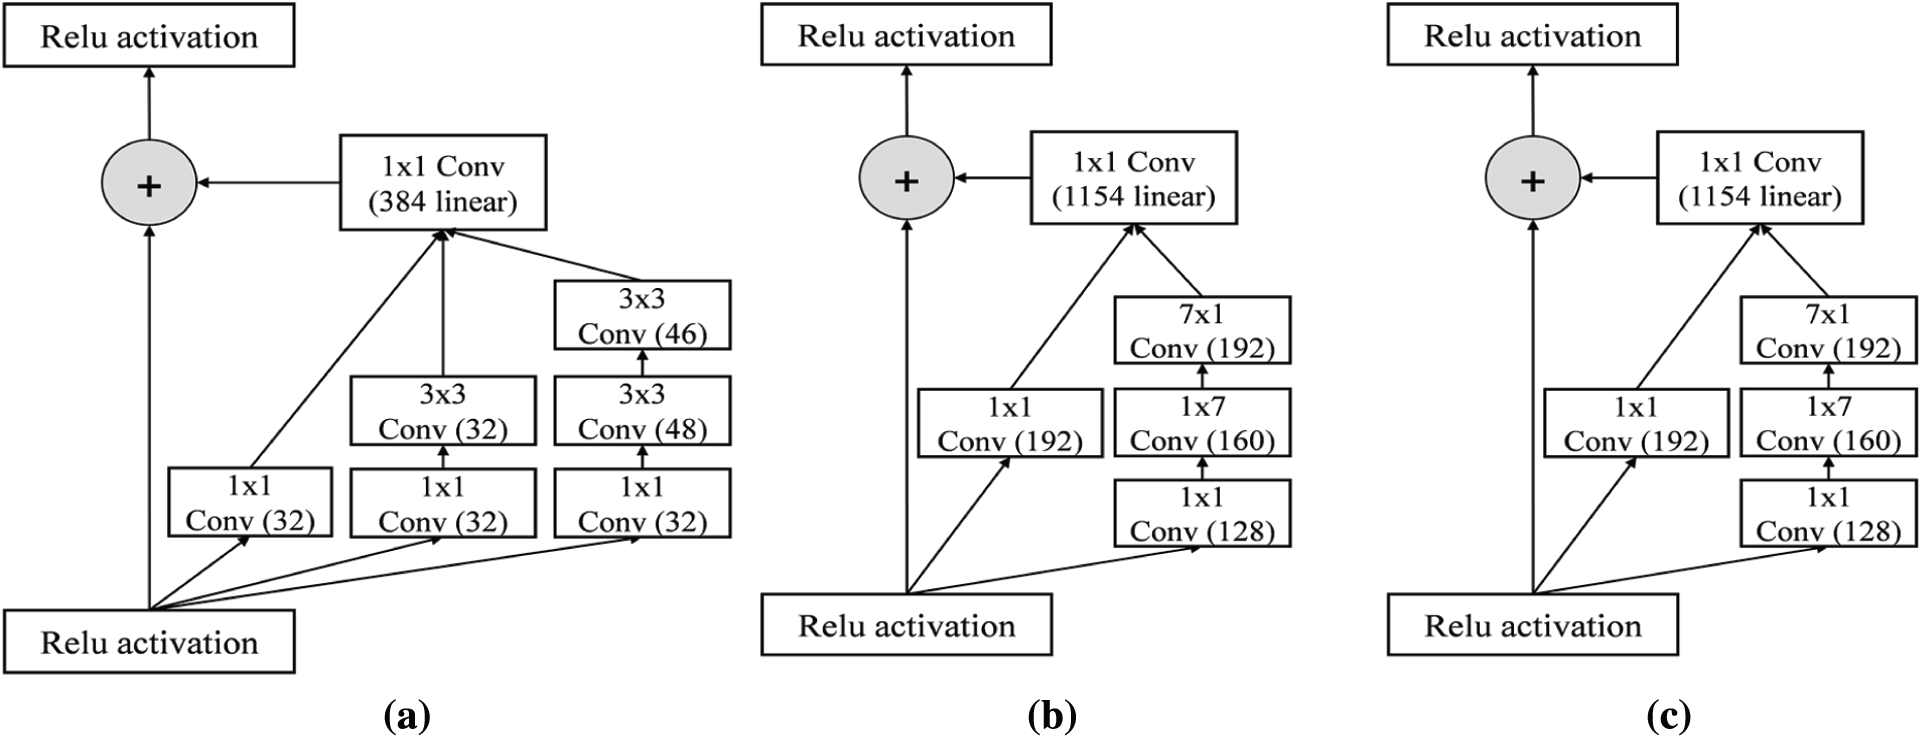
Figure 5: Detail schema of Inception-ResNet-v2 network (a) Inception-RestNet-A module (b) Inception-ResNet-B module (c) Inception-ResNet-C module
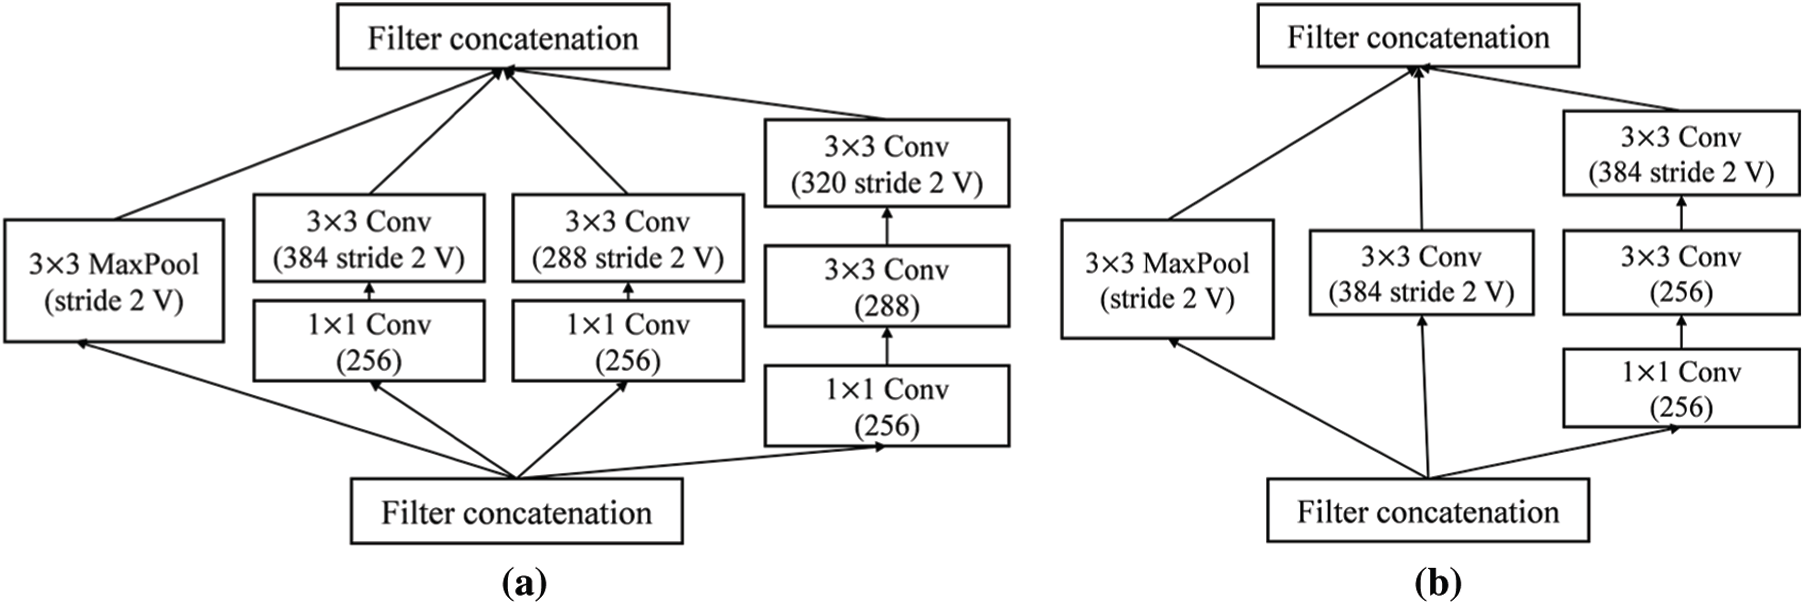
Figure 6: Detailed schema of Inception-ResNet-v2 network (a) Reduction-A module (b) Reduction-B module
To verify the segmentation performance of Inception-ResNet-v2, the soft-max activation layer was visualized, as presented in Fig. 7c. The white pixels belong to the cell class and black pixels belong to the wrinkle class. In the figure, the red boxes indicate false segmentation candidates.
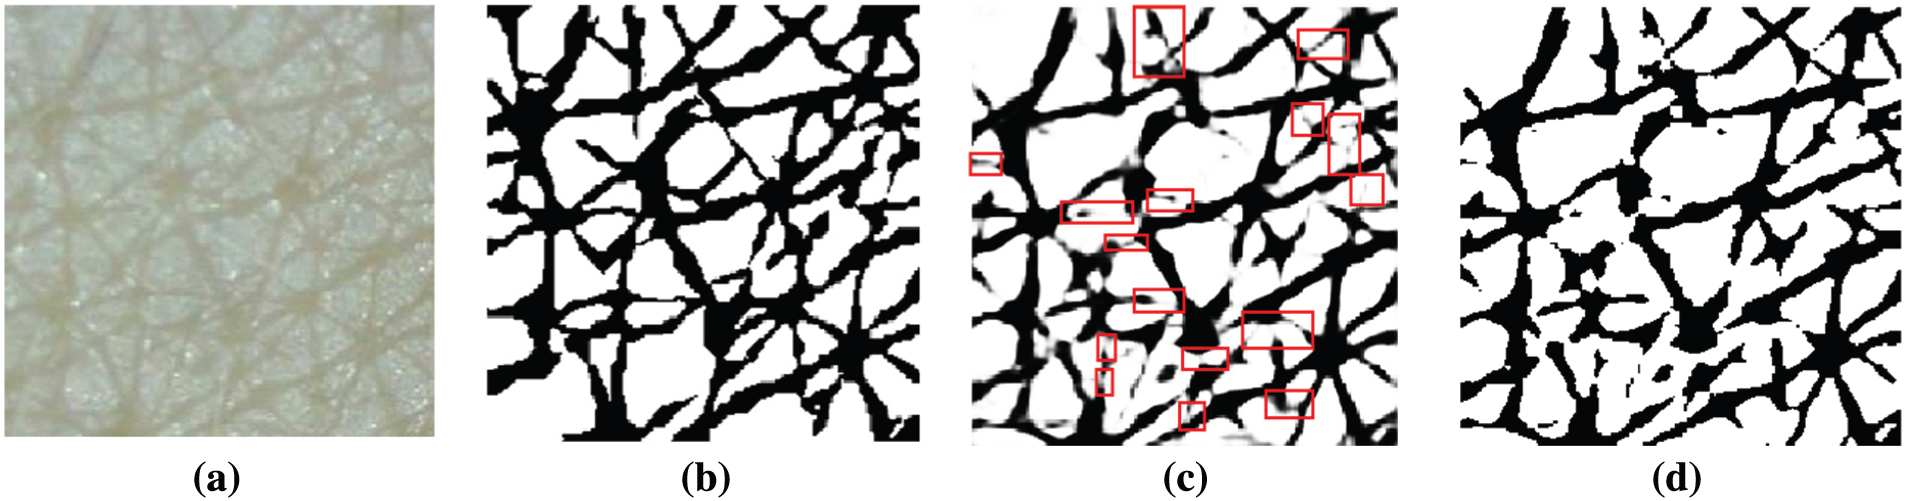
Figure 7: Example of soft-max activation and prediction result (a) Input image (b) Ground truth (c) soft-max activation (d) Prediction result from the Deeplab v3+ with Inception-ResNet-v2 backbone
To alleviate the false segmentation problem, a tree-based ensemble framework, namely, LightGBM, was used. LightGBM has obvious advantages, such as high training speed, low memory usage, and high prediction accuracy, when processing large-scale data. In this case, LightGBM was used to improve the segmentation quality by considering the output probabilities of the soft-max layer as input. For this, we sequentially calculated the probabilities of the soft-max layer extracted from the training images. The overall probability values were then accumulated and reshaped to a flattened form. If one image has 299 (width)
Although CNN and LightGBM show good performance in wrinkle and cell segmentation, their results are not always satisfactory. For instance, the segmentation includes areas wherein it is unclear whether they contain wrinkles or cells, which degrades the reliability of the segmentation results [36–39]. Another problem is false segmentation pixels, which appear as noise. Most skin-related 2DIA studies attempted to eliminate noise using median and linear filters, such as Gaussian and Wiener [40]. These filtering methods often lead to structural changes. To avoid this, an MP method was used. Morphological processing has the advantage of removing a single-pixel line, dot, or tiny pixel structures while maintaining the structural shape. MP performs shrinking and growing processes. The shrinking process rounds large structures and the growing process removes small structures. To achieve this, the dilation and erosion processes were used together. For instance, for the segmentation result illustrated in Fig. 8a obtained by means of CNN and LightGBM methods, Fig. 8b shows the result of MP, in which false segmented areas were removed or merged.
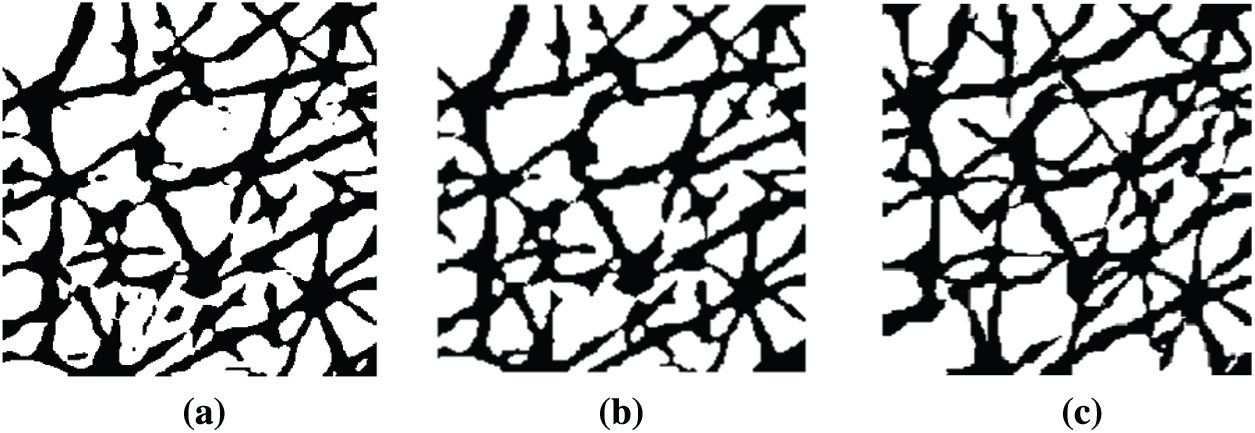
Figure 8: Examples of result (a) Original segmentation (b) Improvement using MP (c) Ground truth
3.4 Skin Texture Feature Extraction
After segmentation, various skin features are extracted from the segmentation results. In this study, four skin features that are essential for evaluating skin condition and aging were considered. They are the length of wrinkle lines, wrinkle width, number of cells, and area of detected cells. The length of wrinkle lines is easily identified using the skeleton pixels classified as wrinkle class. To calculate the wrinkle width, we used Algorithm 1. The number of cells and their area were calculated using the polygon mesh detection algorithm (PMDA), which is presented in Algorithm 2 [12]. Fig. 9 depicts the steps for skin texture feature extraction.
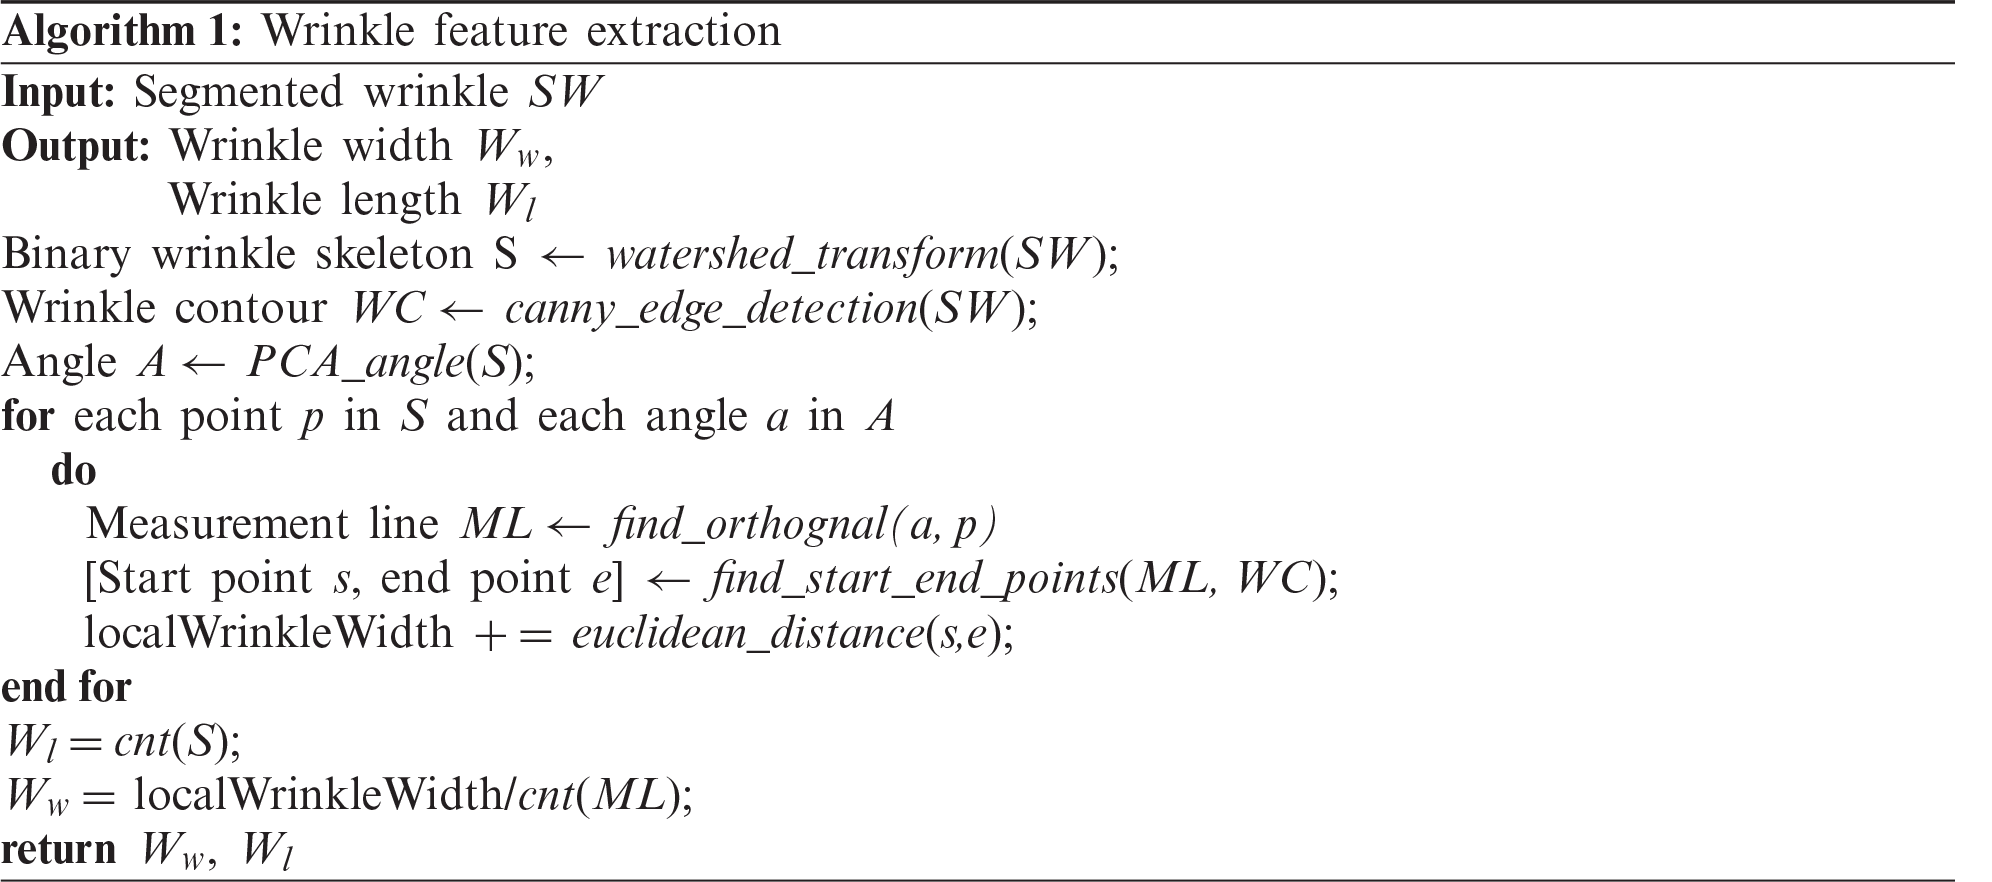
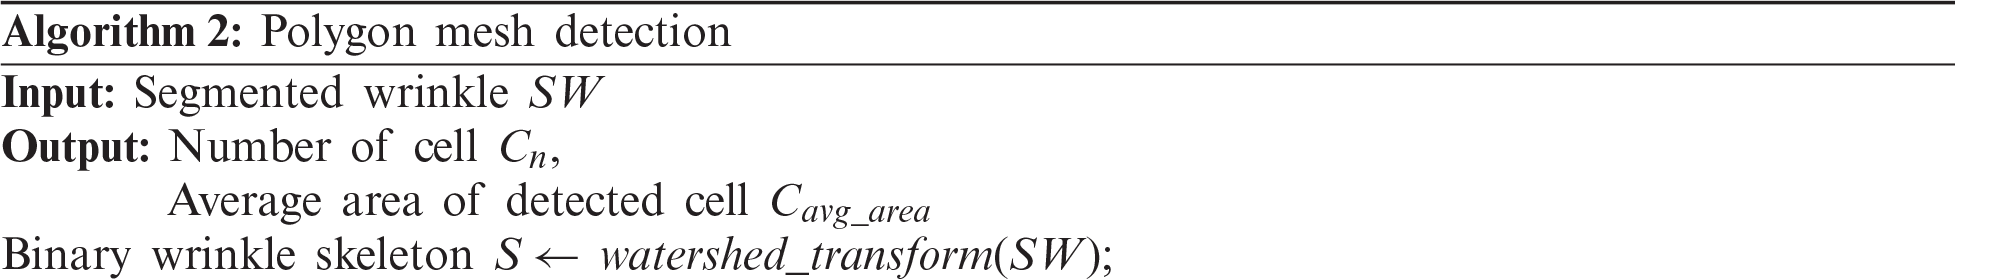
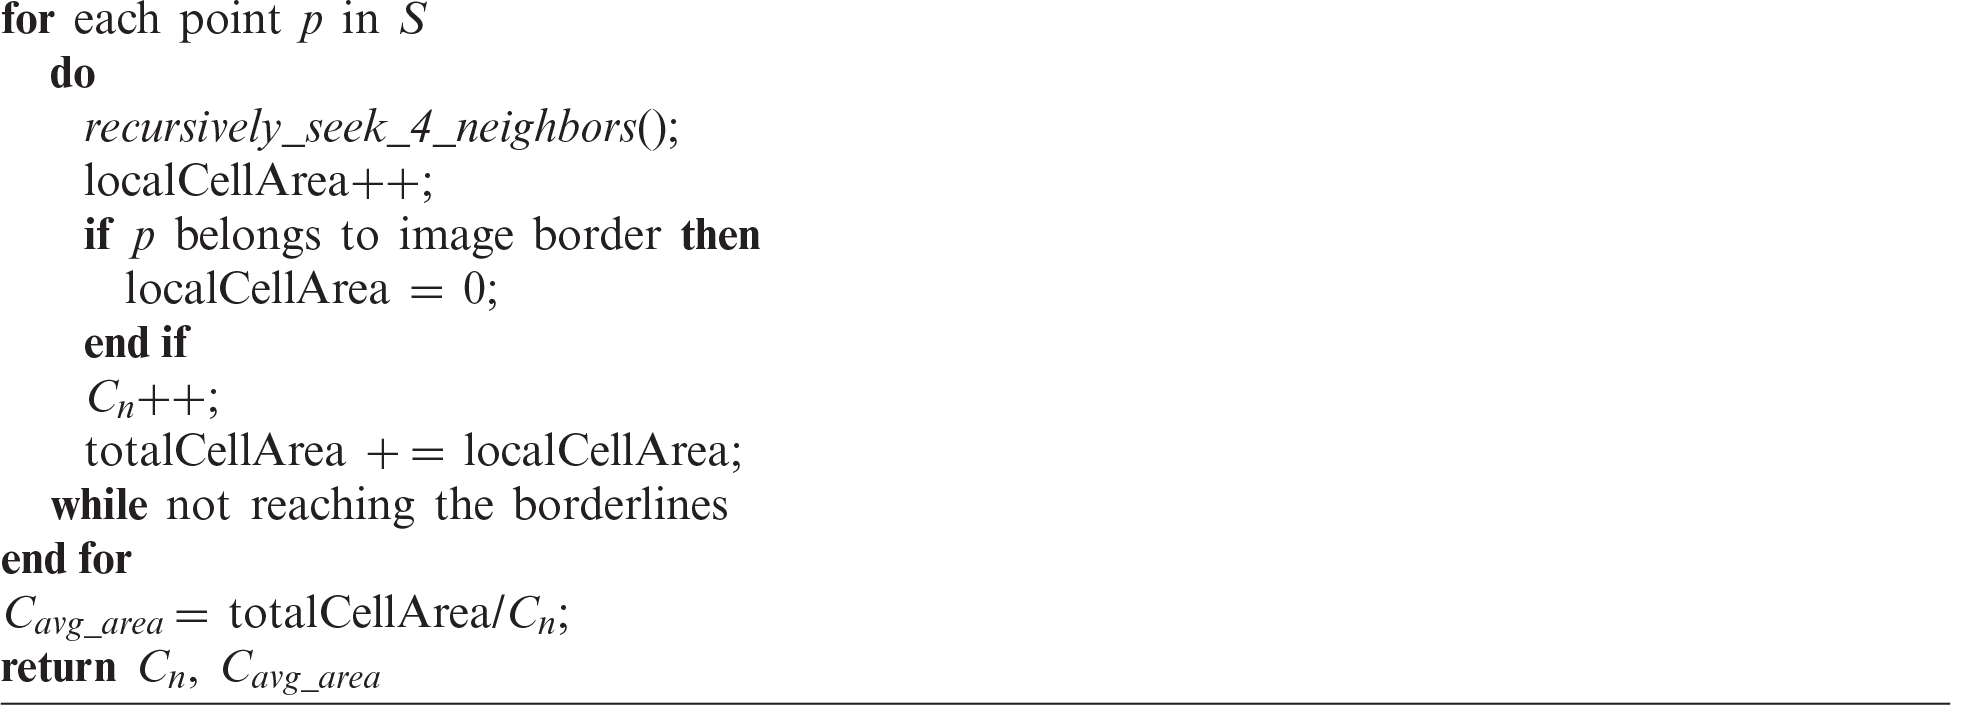
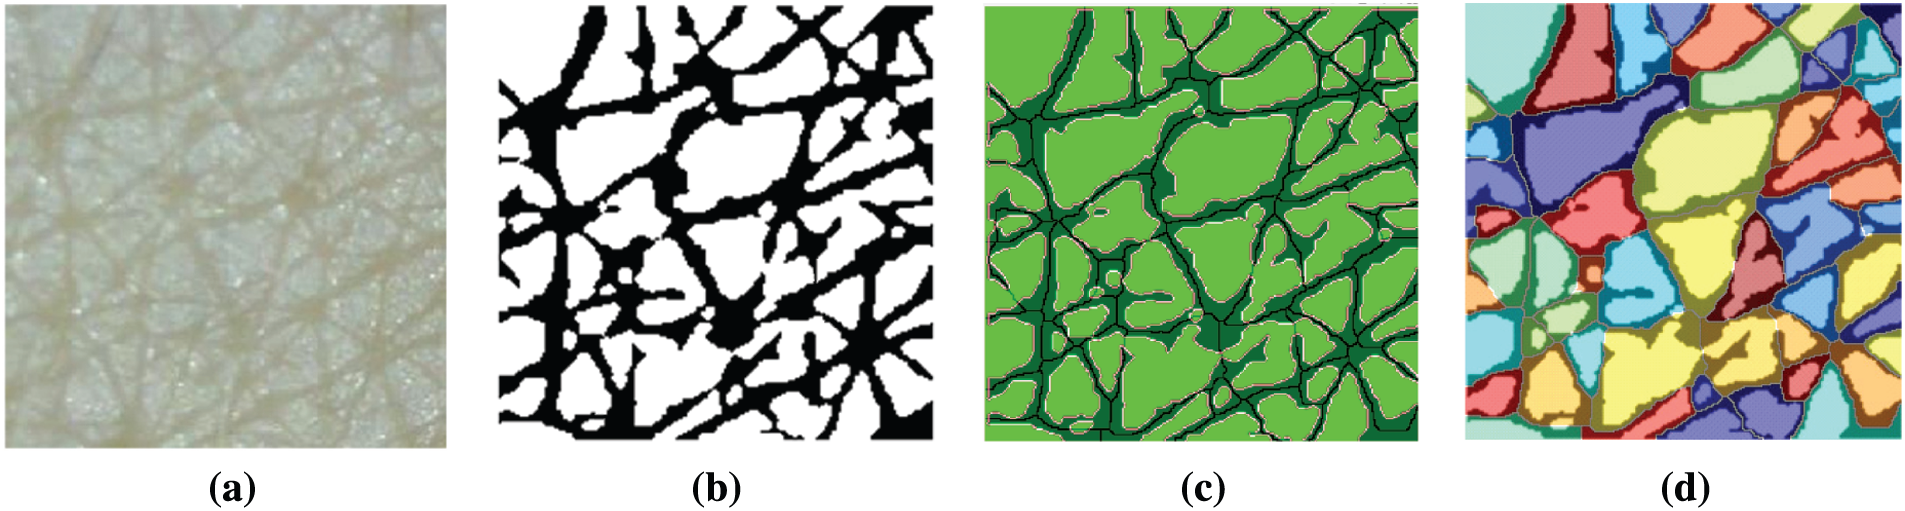
Figure 9: Steps for skin texture feature extraction (a) Input image (b) Segmentation result (c) Wrinkle-related feature extraction (d) Cell-related feature extraction using PMDA
4.1 Dataset and Model Configuration
To construct a skin image dataset, 50
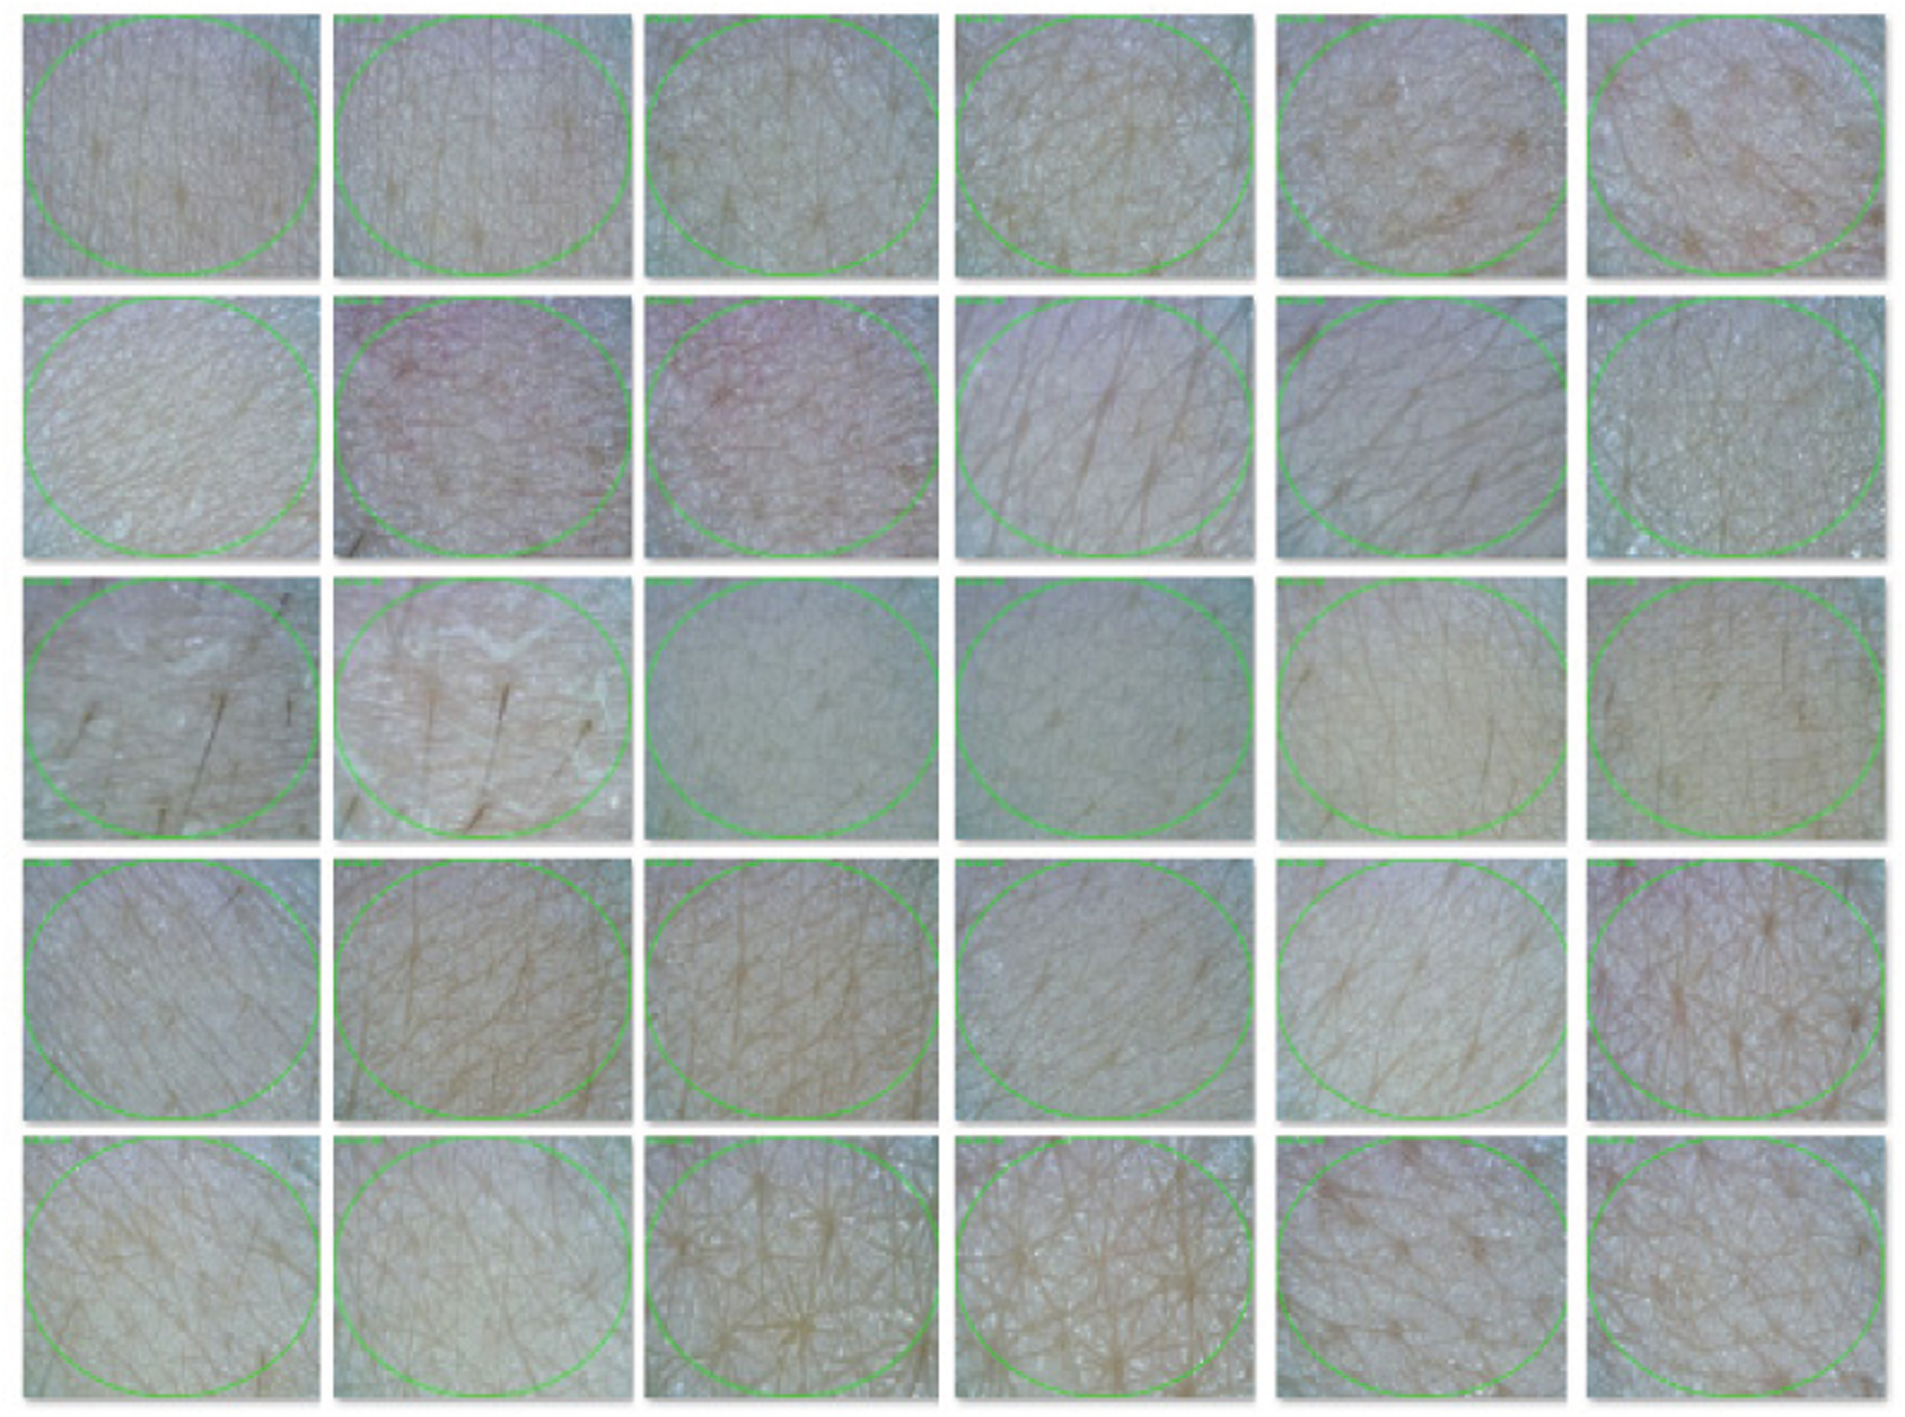
Figure 10: Sample images from the dataset
To train the Inception-ResNet-v2 model, the resolution of the input images was first set to
4.2 Performance Evaluation of Segmentation
In the evaluation of segmentation performance, three metrics were used: mean accuracy (MA), mean of intersection over union (MIOU), and mean of boundary F1 score (MBF) [41]. MA, which can be defined by Eq. (1), indicates the percentage of correctly identified pixels as wrinkle class or cell class. For each class, accuracy is the ratio of precisely matched pixels to the total number of pixels in that class, according to the ground truth. In Eq. (2), TP, FN, and FP represent the number of true positives, the number of false negatives, and the number of false positives, respectively. In addition, i is the total number of images.
MIOU is another popular metric for measuring the performance of image segmentation and can be expressed as Eq. (2). IOU indicates the overlap percentage between the prediction pixels and the ground truth pixels.
The last metric is the MBF score between the segmentation result and the ground truth. MBF, which is usually used to evaluate the contour matching, indicates how close the boundary of the segmentation matches the boundary of the ground truth. Eq. (3) shows how to calculate the MBF. In Eq. (3), Pc and Rc indicate the precision and recall of class c, respectively, and Bcps and Bcgt indicate the boundary binary map of the predicted segmentation and the ground truth in class c, respectively. In Eq. (3), “[[]]” is the Iverson bracket notation, where [[z]] = 1 if z = true and 0 otherwise. In addition, d() represents the Euclidean distance measured in pixels. In Eq. (4), BF is defined as the harmonic mean of the precision and recall values with a distance error tolerance. Finally, we obtained the MBF by averaging the per-image BF scores.
In the experiment, we considered diverse segmentation methods including Choi’s method, U-Net, SegNet, Deeplab v3+ with ResNet backbone families, and Panoptic-Deeplab with ResNet-101 backbone for comparison. Tab. 1 compares their wrinkle and cell class segmentation performances. As is clear from the table, the higher the score, the better the segmentation result. Our proposed scheme showed the best segmentation performance compared with other methods. It means that our proposed scheme significantly improved the segmentation quality in terms of finding the borderlines and regions of wrinkle and cell. Choi’s method presented the worst performance because it is basically a handcraft-based method. In contrast, the Deeplab v3+ models with ResNet backbone families showed better performance than U-Net and SegNet. Panoptic-Deeplab scored higher than Deeplab v3+ models in MA evaluation, but it showed relatively lower accuracy in wrinkle and cell boundary matching than did Deeplab v3+ models. Fig. 11 presents the example of segmentation results. The first and second columns show the input skin texture image and the ground truth of the segmentation task, respectively. From the third to the last column, the segmentation results of different CNN models are presented. When the boundaries of the wrinkles and cells are difficult to distinguish in the image, SegNet and two Deeplab v3+ models showed relatively low segmentation performance compared with the proposed model.
Table 1: Comparisons of wrinkle and cell segmentation results
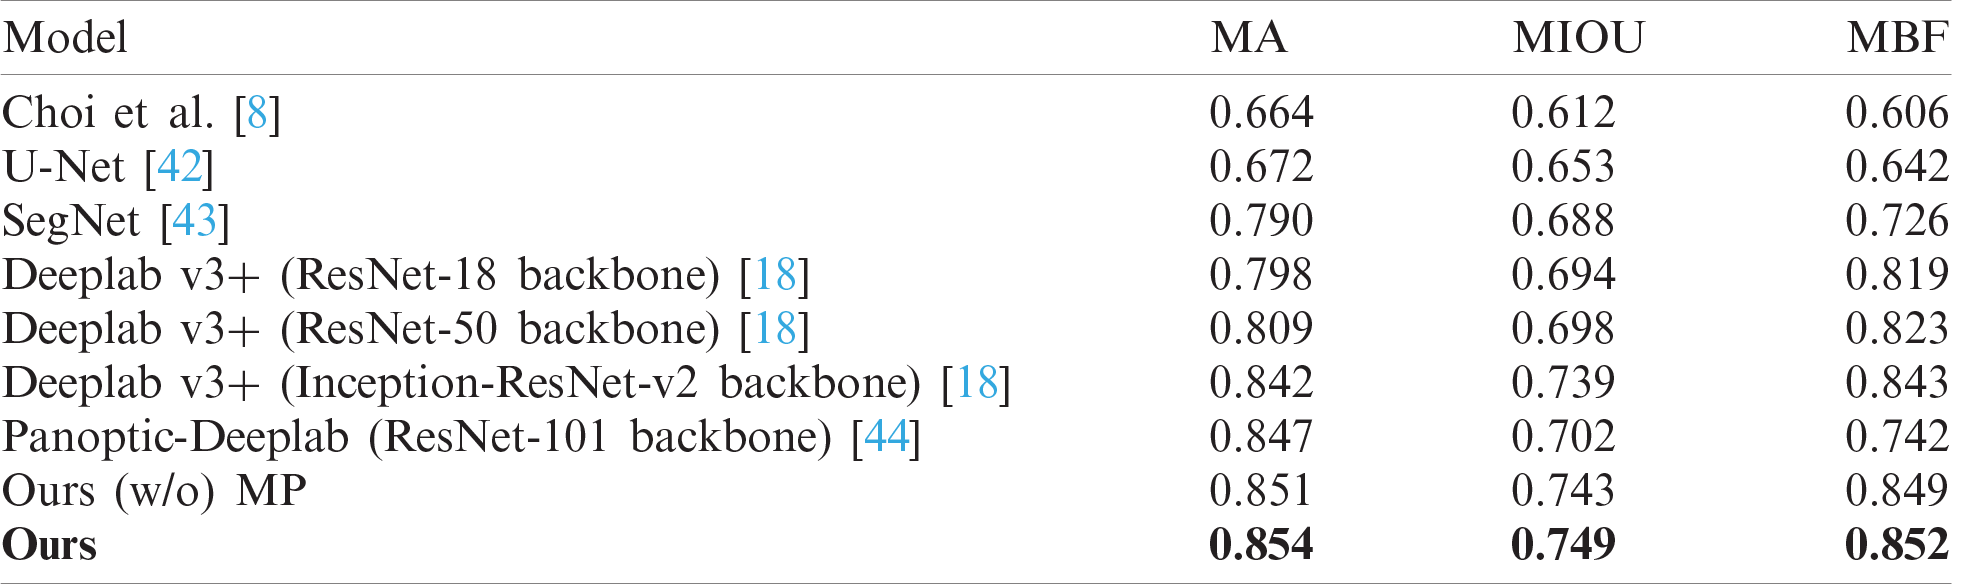
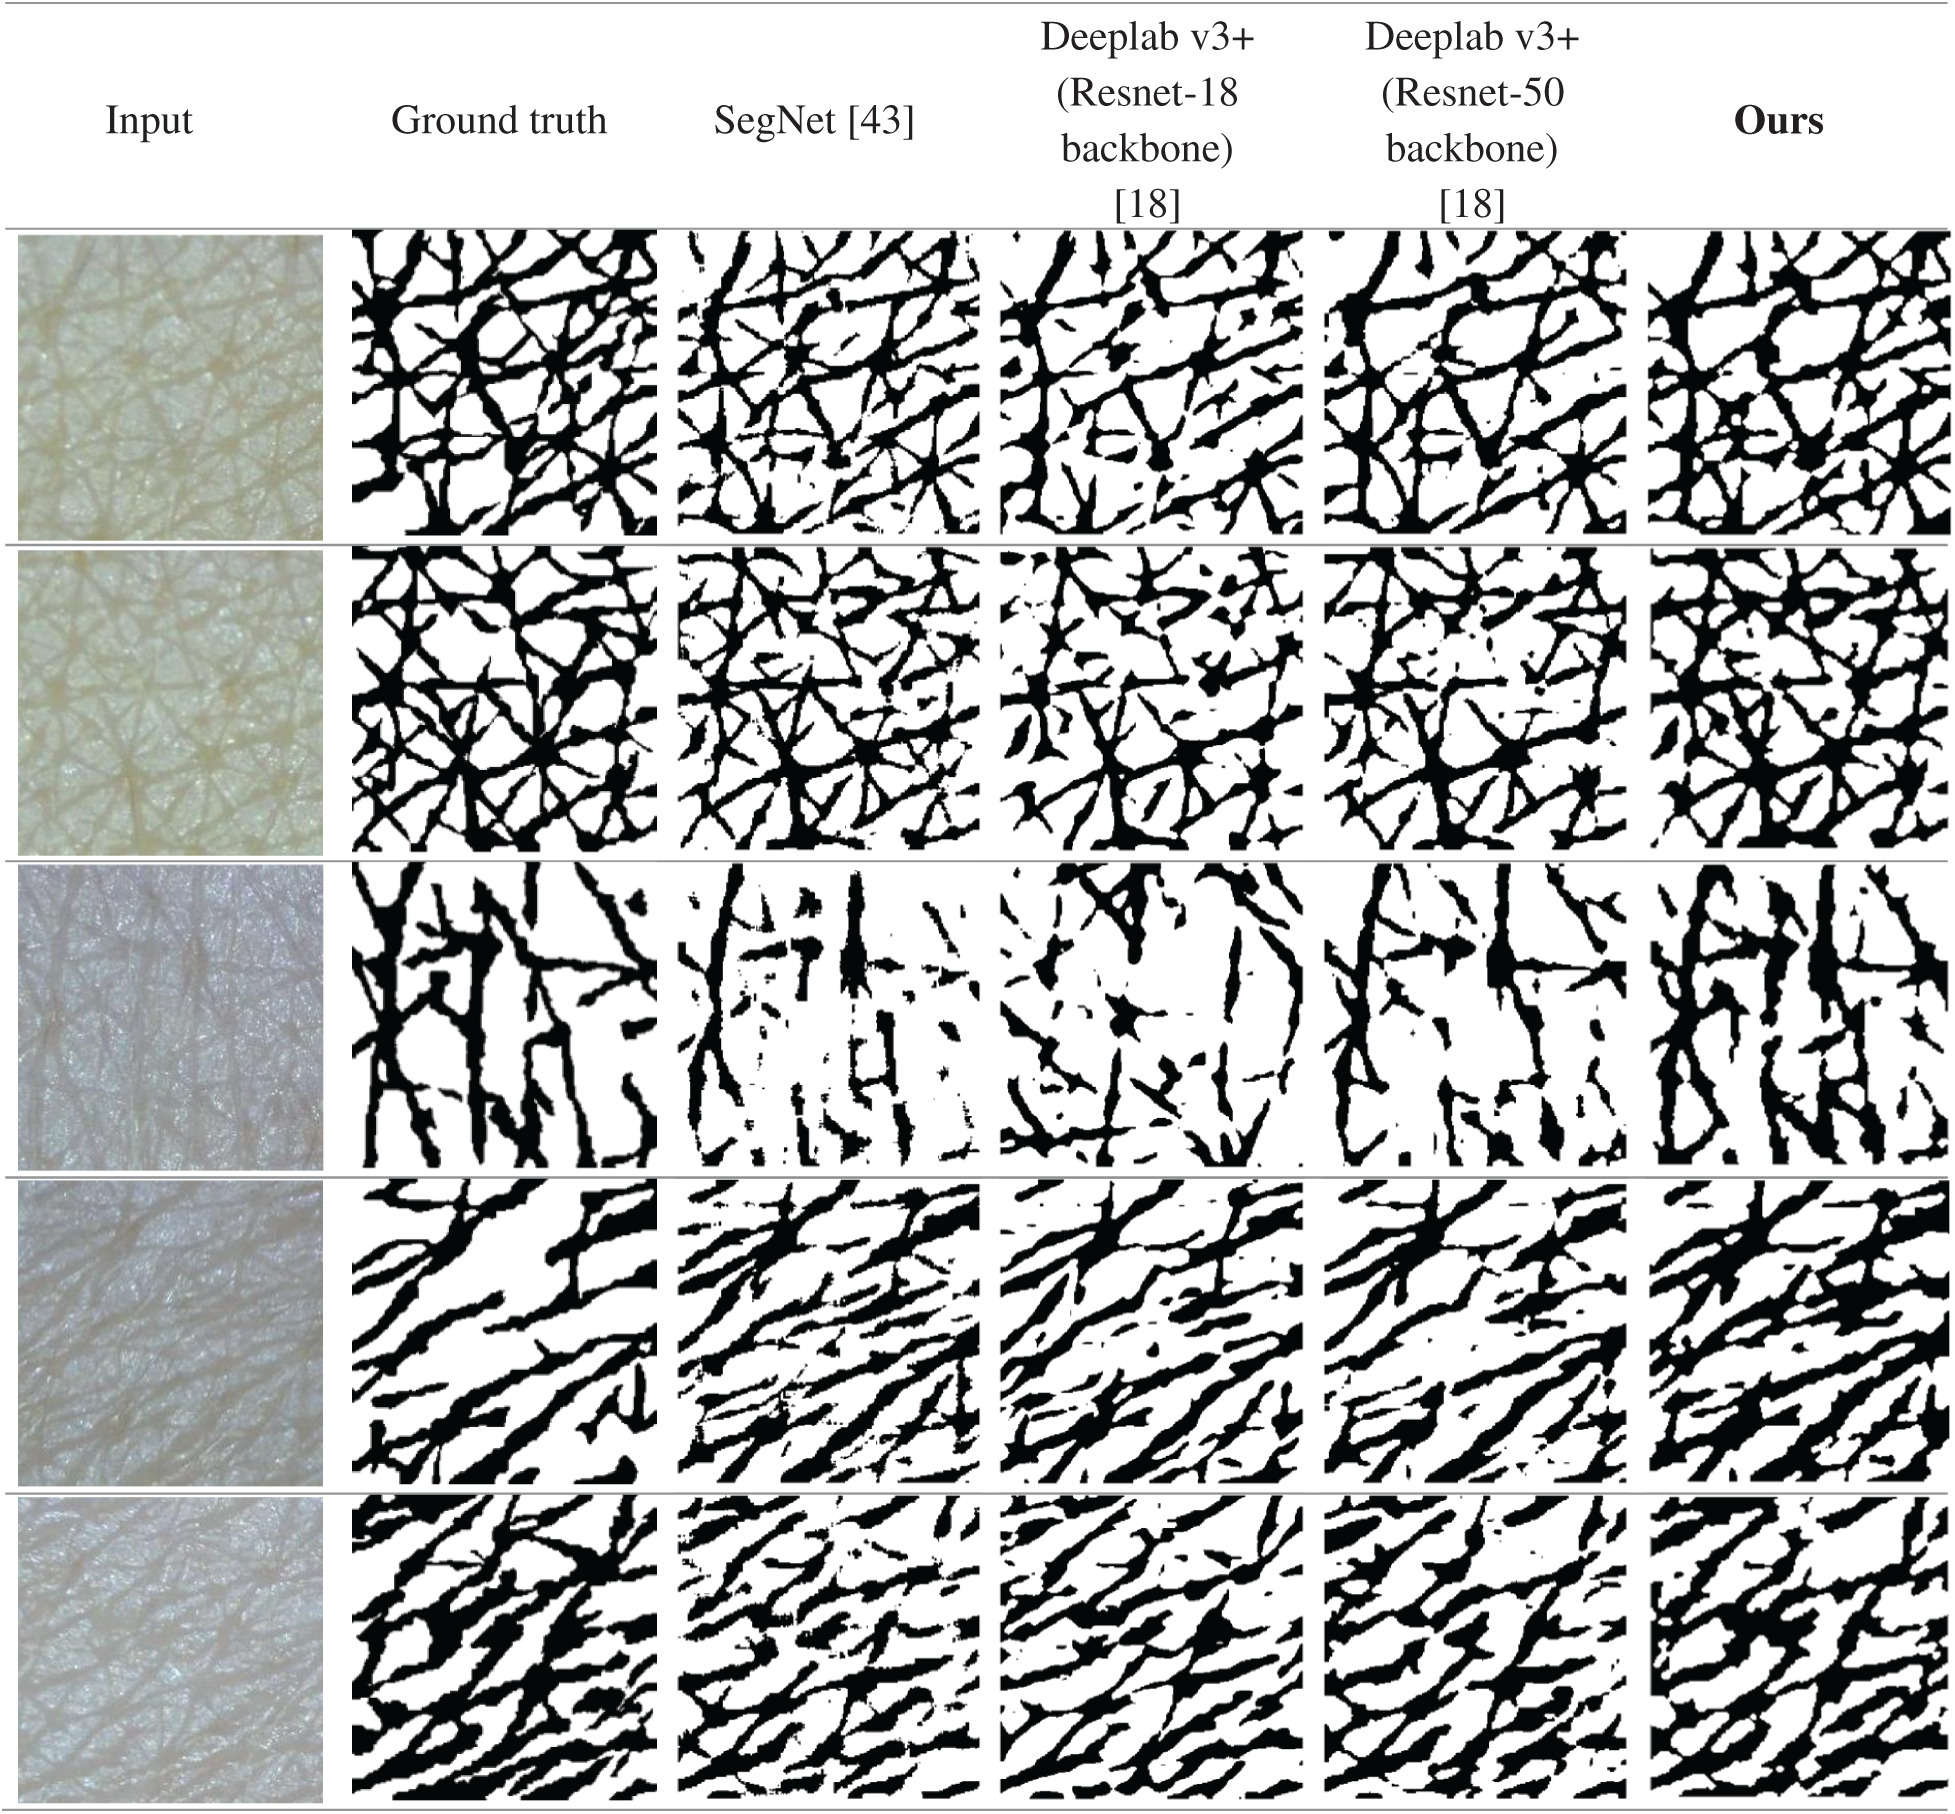
Figure 11: Segmentation results of SegNet [43], Deeplab v3+ (Resnet-18 backbone), Deeplab v3+ (Resnet-50 backbone) [18], and the proposed scheme
4.3 Performance Evaluation for Skin Texture Feature Extraction
In this experiment, we evaluated the accuracy of skin feature extraction using four popular metrics. First, the accuracy of wrinkle line extraction is defined using Eq. (5). In this equation, DWP and WSEG represent the detected wrinkle pixels and ground truth pixels of the wrinkle, respectively. To calculate the accuracy, the equation first counts the correctly overlapped pixels between the DWP and WSEG, and then, it divides them by the total number of detected wrinkle pixels.
To evaluate the accuracy of wrinkle width extraction, the mean absolute percentage error (MAPE) was used, which can be calculated using Eq. (6). In this equation, ML indicates the number of measurement lines, and AWWi and EWWi indicate the actual length and estimated length of the ith measurement line on the wrinkle width, respectively.
Eqs. (7) and (8) show how to count valid cells and calculate their accuracy. To count valid cells, the weighted distance was calculated between the detected cells DC and ground truth cells GC. Then, the IOU was calculated between the DC and GC. If the IOU between the ith matched DC and GC is greater than 0.6, it is counted as a valid cell.
Finally, the MAPE of the valid cell area was measured using Eq. (9). Here, VC is the number of valid cells, and AGCi and AVCi are the areas of the ith ground truth cell and valid cell, respectively.
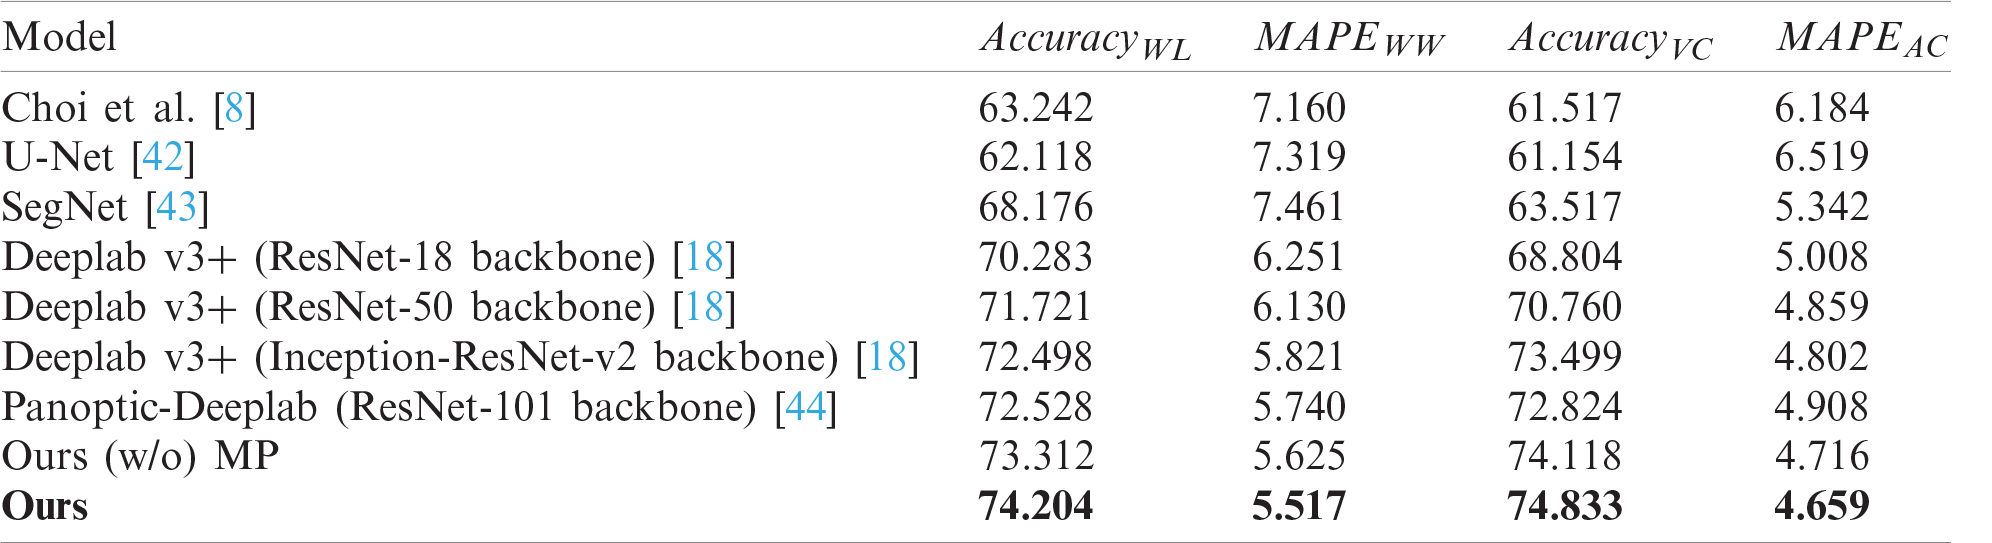
Tab. 2 shows the performance comparison of skin feature extraction. The same skin feature extraction methods were used for each segmentation model. CNN-based models such as SegNet, U-Net, Deeplab v3+, and Panoptic-Deeplab showed better performance than did Choi’s model, which is based on the handcrafted features. The proposed scheme showed the best performance in extracting skin features, and U-Net presented the worst performance. Despite the fact that Choi’s model used a handcrafted method, it performed better than the U-Net model because it was mainly designed to extract wrinkles and cells from dermoscopy images.
Table 2: Performance comparisons of skin texture feature extraction
In this study, a hybrid segmentation scheme for skin feature extraction using Deeplab v3+ with an Inception-ResNet-v2 backbone, LightGBM, and MP was proposed. As traditional 2DIA approaches for skin analysis use handcraft-based methods, it is difficult to obtain satisfactory results using them. To alleviate this problem, based on deep neural networks, which can perform efficient feature extraction from deep and complex networks, the hybrid approach was used to improve segmentation quality and skin feature extraction accuracy. To validate the effectiveness of the proposed scheme, extensive comparisons with other popular models were performed using diverse evaluation metrics. From the experimental results, the proposed scheme was confirmed to outperform the handcraft-based method and other popular CNN models under every evaluation metric. It is our belief that the proposed scheme can be used in diverse skin-related applications, such as skin damage estimation, skin condition assessment, and skin aging estimation.
Funding Statement: This work was supported by the National Research Foundation of Korea (NRF) grant funded by the Korea government (MSIT) (No. 2020R1F1A1074885) and was supported by the Brain Korea 21 Project in 2021 (No. 4199990114242).
Conflicts of Interest: The authors declare that they have no conflicts of interest to report regarding the present study.
1. E. Kohl, J. Steinbauer, M. Landthaler and R. M. Szeimies, “Skin ageing,” Journal of the European Academy of Dermatology and Venereology, vol. 25, no. 8, pp. 873–884, 2011. [Google Scholar]
2. M. A. Farage, K. W. Miller, P. Elsner and H. I. Maibach, “Intrinsic and extrinsic factors in skin ageing: A review,” International Journal of Cosmetic Science, vol. 30, no. 2, pp. 87–95, 2008. [Google Scholar]
3. D. J. Tobin, “Introduction to skin aging,” Journal of Tissue Viability, vol. 26, no. 1, pp. 37–46, 2017. [Google Scholar]
4. C. Piérard-Franchimont and G. E. Piérard, “Beyond a glimpse at seasonal dry skin: A review,” Exogenous Dermatology, vol. 1, no. 1, pp. 3–6, 2002. [Google Scholar]
5. R. Warren, V. Gartstein, A. M. Kligman, W. Montagna, R. A. Allendorf et al., “Age, sunlight, and facial skin: A histologic and quantitative study,” Journal of the American Academy of Dermatology, vol. 25, no. 5, pp. 751–760, 1991. [Google Scholar]
6. J. M. Lagarde, C. Rouvrais, D. Black, S. Diridollou and Y. Gall, “Skin topography measurement by interference fringe projection: A technical validation,” Skin Research and Technology, vol. 7, no. 2, pp. 112–121, 2001. [Google Scholar]
7. S. Akazaki, H. Nakagawa, H. Kazama, O. Osanai, M. Kawai et al., “Age-related changes in skin wrinkles assessed by a novel three-dimensional morphometric analysis,” British Journal of Dermatology, vol. 147, no. 4, pp. 689–695, 2002. [Google Scholar]
8. C. Edwards, R. Heggie and R. Marks, “A study of differences in surface roughness between sun-exposed and unexposed skin with age,” Photodermatology, Photoimmunology & Photomedicine, vol. 19, no. 4, pp. 169–174, 2003. [Google Scholar]
9. J. M. Lagarde, C. Rouvrais and D. Black, “Topography and anisotropy of the skin surface with ageing,” Skin Research and Technology, vol. 11, no. 2, pp. 110–119, 2005. [Google Scholar]
10. O. G. Cula, K. J. Dana, F. P. Murphy and B. K. Rao, “Skin texture modeling,” International Journal of Computer Vision, vol. 62, no. 1, pp. 97–119, 2005. [Google Scholar]
11. D. Kaur and P. Sandhu, “Human skin texture analysis using image processing techniques,” International Journal of Science and Research (IJSR), vol. 2, no. 5, pp. 17–20, 2013. [Google Scholar]
12. Y. H. Choi, D. Kim, E. Hwang and B. J. Kim, “Skin texture aging trend analysis using dermoscopy images,” Skin Research and Technology, vol. 20, no. 4, pp. 486–497, 2014. [Google Scholar]
13. C. I. Moon and O. Lee, “Age-dependent skin texture analysis and evaluation using mobile camera image,” Skin Research and Technology, vol. 24, no. 3, pp. 490–498, 2018. [Google Scholar]
14. J. Rew, Y. H. Choi, H. Kim and E. Hwang, “Skin aging estimation scheme based on lifestyle and dermoscopy image analysis,” Applied Sciences, vol. 9, no. 6, pp. 1228, 2019. [Google Scholar]
15. T. Fujimura, K. Haketa, M. Hotta and T. Kitahara, “Global and systematic demonstration for the practical usage of a direct in vivo measurement system to evaluate wrinkles,” International Journal of Cosmetic Science, vol. 29, no. 6, pp. 423–436, 2007. [Google Scholar]
16. M. A. Calin, S. V. Parasca, M. R. Calin and E. Petrescu, “An analysis of human dorsal hand skin texture using hyperspectral imaging technique for assessing the skin aging process,” Applied Spectroscopy, vol. 71, no. 3, pp. 391–400, 2017. [Google Scholar]
17. Y. Zou, E. Song and R. Jin, “Age-dependent changes in skin surface assessed by a novel two-dimensional image analysis,” Skin Research and Technology, vol. 15, no. 4, pp. 399–406, 2009. [Google Scholar]
18. L. C. Chen, Y. Zhu, G. Papandreou, F. Schroff and H. Adam, “Encoder-decoder with atrous separable convolution for semantic image segmentation,” in Proc. ECCV 2018, Munich, Germany, pp. 801–818, 2018. [Google Scholar]
19. C. Szegedy, S. Ioffe, V. Vanhoucke and A. A. Alemi, “Inception-v4, inception-ResNet and the impact of residual connections on learning,” in Proc. AAAI 2017, San Francisco, California, USA, pp. 4278–4284, 2017. [Google Scholar]
20. G. Ke, Q. Meng, T. Finley, T. Wang, W. Chen et al., “Lightgbm: A highly efficient gradient boosting decision tree,” in Proc. NIPS 2017, Long Beach, CA, USA, pp. 3146–3154, 2017. [Google Scholar]
21. Y. Masuda, M. Oguri, T. Morinaga and T. Hirao, “Three-dimensional morphological characterization of the skin surface micro-topography using a skin replica and changes with age,” Skin Research and Technology, vol. 20, no. 3, pp. 299–306, 2014. [Google Scholar]
22. P. M. Friedman, G. R. Skover, G. Payonk, A. N. Kauvar and R. G. Geronemus, “3D in-vivo optical skin imaging for topographical quantitative assessment of non-ablative laser technology,” Dermatologic Surgery, vol. 28, no. 3, pp. 199–204, 2002. [Google Scholar]
23. R. H. Goodall, L. P. Darras and M. A. Purnell, “Accuracy and precision of silicon based impression media for quantitative areal texture analysis,” Scientific Reports, vol. 5, no. 1, pp. 10800, 2015. [Google Scholar]
24. G. O. Cula, P. R. Bargo, A. Nkengne and N. Kollias, “Assessing facial wrinkles: Automatic detection and quantification,” Skin Research and Technology, vol. 19, no. 1, pp. e243–e251, 2013. [Google Scholar]
25. H. Tanaka, G. Nakagami, H. Sanada, Y. Sari, H. Kobayashi et al., “Quantitative evaluation of elderly skin based on digital image analysis,” Skin Research and Technology, vol. 14, no. 2, pp. 192–200, 2008. [Google Scholar]
26. H. Razalli, R. W. O. Rahmat, F. Khalid and P. S. Sulaiman, “Age range estimation based on facial wrinkle analysis using hessian based filter,” in Proc. Advanced Computer and Communication Engineering Technology, Phuket, Thailand, Cham: Springer, pp. 759–769, 2016. [Google Scholar]
27. Y. H. Choi, Y. S. Tak, S. Rho and E. Hwang, “Skin feature extraction and processing model for statistical skin age estimation,” Multimedia Tools and Applications, vol. 64, no. 2, pp. 227–247, 2013. [Google Scholar]
28. J. Rew, E. Hwang, Y. H. Choi and S. Rho, “Monitoring skin condition using life activities on the SNS user documents,” Multimedia Tools and Applications, vol. 77, no. 8, pp. 9827–9847, 2018. [Google Scholar]
29. F. Afza, M. A. Khan, M. Sharif, T. Saba, A. Rehman et al., “Skin lesion classification: An optimized framework of optimal color features selection,” in Proc. ICCIS 2020, Aljouf, KSA, pp. 1–6, 2020. [Google Scholar]
30. F. Afza, M. Sharif, M. Mittal, M. A. Khan and D. J. Hemanth, “A hierarchical three-step superpixels and deep learning framework for skin lesion classification,” Methods, in press. [Google Scholar]
31. M. A. Khan, Y.-D. Zhang, M. Sharif and T. Akram, “Pixels to classes: Intelligent learning framework for multiclass skin lesion localization and classification,” Computers & Electrical Engineering, vol. 90, pp. 106956, 2021. [Google Scholar]
32. M. A. Khan, T. Akram, Y.-D. Zhang and M. Sharif, “Attributes based skin lesion detection and recognition: A mask RCNN and transfer learning-based deep learning framework,” Pattern Recognition Letters, vol. 143, pp. 58–66, 2021. [Google Scholar]
33. T. Akram, M. Attique, S. Gul, A. Shahzad, M. Altaf et al., “A novel framework for rapid diagnosis of COVID-19 on computed tomography scans,” Pattern Analysis and Applications, pp. 1–14, 2021. [Google Scholar]
34. L. Nanni, S. Ghidoni and S. Brahnam, “Handcrafted vs. non-handcrafted features for computer vision classification,” Pattern Recognition, vol. 71, no. 10, pp. 158–172, 2017. [Google Scholar]
35. J. B. Roerdink and A. Meijster, “The watershed transform: Definitions, algorithms and parallelization strategies,” Fundamenta Informaticae, vol. 41, no. 1–2, pp. 187–228, 2000. [Google Scholar]
36. S. Li, H. Yin and L. Fang, “Group-sparse representation with dictionary learning for medical image denoising and fusion,” IEEE Transactions on Biomedical Engineering, vol. 59, no. 12, pp. 3450–3459, 2012. [Google Scholar]
37. S. J. Lim, Y. Y. Jeong and Y. S. Ho, “Automatic liver segmentation for volume measurement in CT Images,” Journal of Visual Communication and Image Representation, vol. 17, no. 4, pp. 860–875, 2006. [Google Scholar]
38. X. Yi, E. Walia and P. Babyn, “Generative adversarial network in medical imaging: A review,” Medical Image Analysis, vol. 58, no. 2, pp. 101552, 2019. [Google Scholar]
39. K. Kim, Y. H. Choi and E. Hwang, “Wrinkle feature-based skin age estimation scheme,” in Proc. ICME 2009, New York, NY, USA, pp. 1222–1225, 2009. [Google Scholar]
40. S. Kumar, P. Kumar, M. Gupta and A. K. Nagawat, “Performance comparison of median and wiener filter in image de-noising,” International Journal of Computer Applications, vol. 12, no. 4, pp. 27–31, 2010. [Google Scholar]
41. G. Csurka, D. Larlus and F. Perronnin, “What is a good evaluation measure for semantic segmentation?,” in Proc. BMVC 2013, Bristol, UK, pp. 1–11, 2013. [Google Scholar]
42. O. Ronneberger, P. Fischer and T. Brox, “U-net: Convolutional networks for biomedical image segmentation,” in Proc. MICCAI 2015, Munich, Germany, pp. 234–241, 2015. [Google Scholar]
43. V. Badrinarayanan, A. Kendall and R. Cipolla, “SegNet: A deep convolutional encoder-decoder architecture for image segmentation,” IEEE Transactions on Pattern Analysis and Machine Intelligence, vol. 39, no. 12, pp. 2481–2495, 2017. [Google Scholar]
44. A. Kirillov, R. Girshick, K. He and P. Dollár, “Panoptic feature pyramid networks,” in Proc. CVPR 2019, Long Beach, California, USA, pp. 6399–6408, 2019. [Google Scholar]
 | This work is licensed under a Creative Commons Attribution 4.0 International License, which permits unrestricted use, distribution, and reproduction in any medium, provided the original work is properly cited. |