DOI:10.32604/cmc.2021.018098
| Computers, Materials & Continua DOI:10.32604/cmc.2021.018098 | |
| Article |
Early COVID-19 Symptoms Identification Using Hybrid Unsupervised Machine Learning Techniques
1School of Electrical and Electronic Engineering, Universiti Sains Malaysia (USM), Nibong Tebal, 14300, Malaysia
2Department of Electrical Engineering, NFC Institute of Engineering and Technology (NFC IET), Multan, 60000, Pakistan
*Corresponding Author: Mohamad Khairi Ishak. Email: khairiishak@usm.my
Received: 24 February 2021; Accepted: 05 April 2021
Abstract: The COVID-19 virus exhibits pneumonia-like symptoms, including fever, cough, and shortness of breath, and may be fatal. Many COVID-19 contraction experiments require comprehensive clinical procedures at medical facilities. Clinical studies help to make a correct diagnosis of COVID-19, where the disease has already spread to the organs in most cases. Prompt and early diagnosis is indispensable for providing patients with the possibility of early clinical diagnosis and slowing down the disease spread. Therefore, clinical investigations in patients with COVID-19 have revealed distinct patterns of breathing relative to other diseases such as flu and cold, which are worth investigating. Current supervised Machine Learning (ML) based techniques mostly investigate clinical reports such as X-Rays and Computerized Tomography (CT) for disease detection. This strategy relies on a larger clinical dataset and does not focus on early symptom identification. Towards this end, an innovative hybrid unsupervised ML technique is introduced to uncover the probability of COVID-19 occurrence based on the breathing patterns and commonly reported symptoms, fever, and cough. Specifically, various metrics, including body temperature, breathing and cough patterns, and physical activity, were considered in this study. Finally, a lightweight ML algorithm based on the K-Means and Isolation Forest technique was implemented on relatively small data including 40 individuals. The proposed technique shows an outlier detection with an accuracy of 89%, on average.
Keywords: COVID-19; symptoms identification; machine learning; isolation forest; k-means
The global outbreak of COVID-19 witnessed an overall spread across 190 countries causing a death toll of over 2 million people worldwide [1]. Initial clinical observations reported fever and dry cough as the most common early symptoms in all the reported cases [2–4]. It is believed that early symptoms identification can be a vital point of consideration for early COVID-19 detection, which can help to prioritize patients for management to reduce the risk of mortality [5,6]. Although a comprehensive medical examination is required for an accurate diagnosis of the disease, it is important to consider the role of early detection [7]. This can be achieved by identifying the most common symptoms to detect patients who may be consistent with developing COVID-19.
Breathing is a vital physiological process for all living beings. The cyclical process involves inhalation and exhalation, which correlates to a person’s health, mood, and stress levels [8 –10]. The study of breathing patterns can identify normal, fatigued states and underlying acute respiratory disorders. However, specialized diagnostic tests, including respiratory rhythm, depth, blood oxygen saturation, and heart-rate are typically required to identify various breathing patterns [11,12]. This relies on not only access to specialized healthcare facilities but also the presence of trained medical professionals for an accurate diagnosis. In a normal breathing activity, clinically referred to as Eupnea, a healthy adult shows 12 to 20 respiratory cycles per minute [12–14]. In this study, comparisons to Eupnea cycles were used to detect anomalies in all the test cases.
Several research studies included contact-based human activity recognition for respiratory rate measurements. In most studies, machine learning (ML), Convolutional Neural Networks (CNNs), and Deep Neural Networks (DNN) techniques have been utilized to perform feature extraction and pattern recognition. However, these branches of supervised ML techniques require very large, labeled datasets to achieve high accuracy [15–17]. Besides, the required experimental setup is complex, costly, and does not support self-diagnostic capability. In comparison to these systems, this research focused on developing a wearable prototype device with commercial off-the-shelf (COTF) components to reduce the price and provide flexibility to apply symptoms recognition algorithms to existing platforms. The current smart wearable market has exceeded 440 million active consumers, thus chosen as a natural preference and motivation for prototype design [18,19].
In this study, we concentrate on contact-based physiological features identification, where contactless infrared thermometers are used for body temperature measurements and motion detection accelerometers for breathing and various physical activity. The wearable device records observations, processes signals, which are then analyzed in IBM Watson Studio for anomaly detection using the K-Means and Isolation Forest techniques [20,21].
Some of the major contributions of this research are:
• Design of a wearable prototype device for physiological feature measurement (such as body temperature, and activity recognition).
• Design of breathing pattern recognition algorithm, that identifies normal breathing, and cough patterns.
• The design of hybrid anomaly detection technique using K-means and Isolation Forest algorithms, for anomaly detection and symptom identification.
The rest of this article is organized as follows. In Section 2, a detailed literature review is presented that investigates the current research trends on anomaly detection. Section 3 explains the research methodology by describing the research environment, feature extraction, and the application of the proposed algorithms. In Section 4, a comprehensive analysis of experimental observations is presented. Finally, Section 5 concludes this research and provides directions to enhance the proposed technique and integrate it with currently available wearable platforms.
William et al. [22] presented a comprehensive review on non-contact-based state-of-the-art sensing for COVID-19. Several sensing techniques such as X-ray, CT scan, Radar, and high-frequency THz techniques were investigated. The research concludes that although the non-contact-based sensing techniques were more accurate. In addition, the cost and complexity of implementation were very high and required administration by highly skilled technicians. Similarly, Carlo et al. [23] presented a comprehensive analysis on contact-based sensing techniques for respiratory pattern measurement. The study compared various contact-based sensing techniques including chest movement, air-flow movement, breathing sounds as well as cardiac activity to detect respiratory patterns. A pronounced common trend was reported where an increase in accuracy often required sensing techniques that were obtrusive and could only be implemented in clinical settings.
Hyun et al. [24] investigated an unsupervised machine learning technique based on the K-Means algorithm to cluster the patient data from intensive care units (ICU). Nine laboratory tests on ICU patients were carried out and the clustering was independently tested. The technique featured three clusters grouping nine characteristics based on the similarities of clinical results. The data set was examined for the development of treatment strategies for the individual patient groups in the unit. However, the clusters were based on the provided features in the proposed model and may not scale. Furthermore, unsupervised ML techniques are also extensively used for anomaly detection. In this regard, Naidoo et al. [25] implemented an unsupervised Generative Adversarial Network (GAN) model to detect fraud in the health care industry. Health care records from two health care providers were investigated to detect fraudulent activities.
Furthermore, Kaczmarek et al. [26] deployed a K-means based Isolation Forest technique to detect anomalies. Unlike other isolation schemes, their technique provided a greater number of decision trees arbitrations that helped to identify many sparse anomalies. Similarly, Farzad et al. [27] suggested a hybrid approach for log message detection where isolation forest algorithm predicted the positive samples from the dataset. In addition, autoencoder networks were implemented for feature extraction, model training, and anomaly detection. The developed scheme is a classic case of unsupervised learning where the accuracy of the model can be improved through training of positive samples using a Isolation forest. However, in real-world health-care environment, labeling multi-feature and highly correlated physiological data is a laborious and expensive task.
On the other hand, anomaly detection using supervised ML techniques are also prevalent. Hauskrecht et al. [28] presented an outlier detection model that generated activity alerts based on patient’s health. The proposed technique utilized supervised support vector machine (SVM) learning model for high accuracy outlier detection. However, due to its limitation for univariate nature as well as offline processing, it may not be applicable for scalable complex real-time anomaly detection. Along the same veins, several techniques implemented CNN and DNN strategies for human activity recognition (HAR) and respiratory pattern recognition by implementing advanced sensors such as ultra-wideband radars and depth sensors [29–31].
In health-care environments, the data is heavily correlated with its underlying physiological properties. Each set of observations can belong to a multi-variate subset, that requires sophisticated methods to extract its characteristics. This unbalanced nature of datasets affects the overall accuracy of the ML models. It is both costly and time consuming to construct a balanced dataset by labelling all features. In addition, another factor to consider is the response time for anomaly detection. The sensors constantly push the data to the cloud for analysis, which further inhibits real-time feature labeling. Therefore, unsupervised machine learning models are preferred to detect anomalies, especially when diagnosis or predictions are not needed.
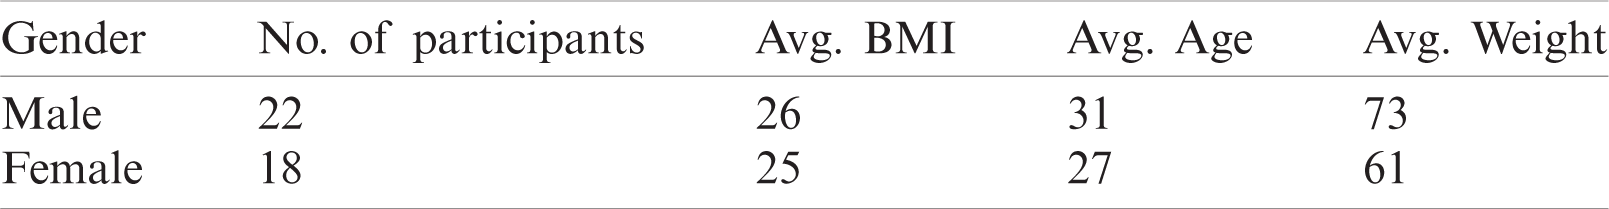
This study follows three stages including physiological features measurement, processing, and anomaly detection. To this end, first, the physiological data was recorded using the chest-worn prototype device. Next, the physiological features were analyzed to categorize various activity types and breathing patterns. Finally, a comprehensive exploratory analysis was performed using the K-means algorithm for optimal clustering that further implemented the Isolation Forest technique for anomaly detection. 40 healthy adults volunteered to participate in the data collection. Individuals with chronic illnesses or health conditions (such as diabetes, heart disease, tuberculosis), smokers, expecting mothers, and adults over the age of 50 were excluded. Tab. 1 provides the subject demographics involved in this research.
Table 1: Volunteer information including, gender, age, weight, and body mass index (BMI)
The complete process flow from data acquisition to processing and validation is described in Fig. 1.
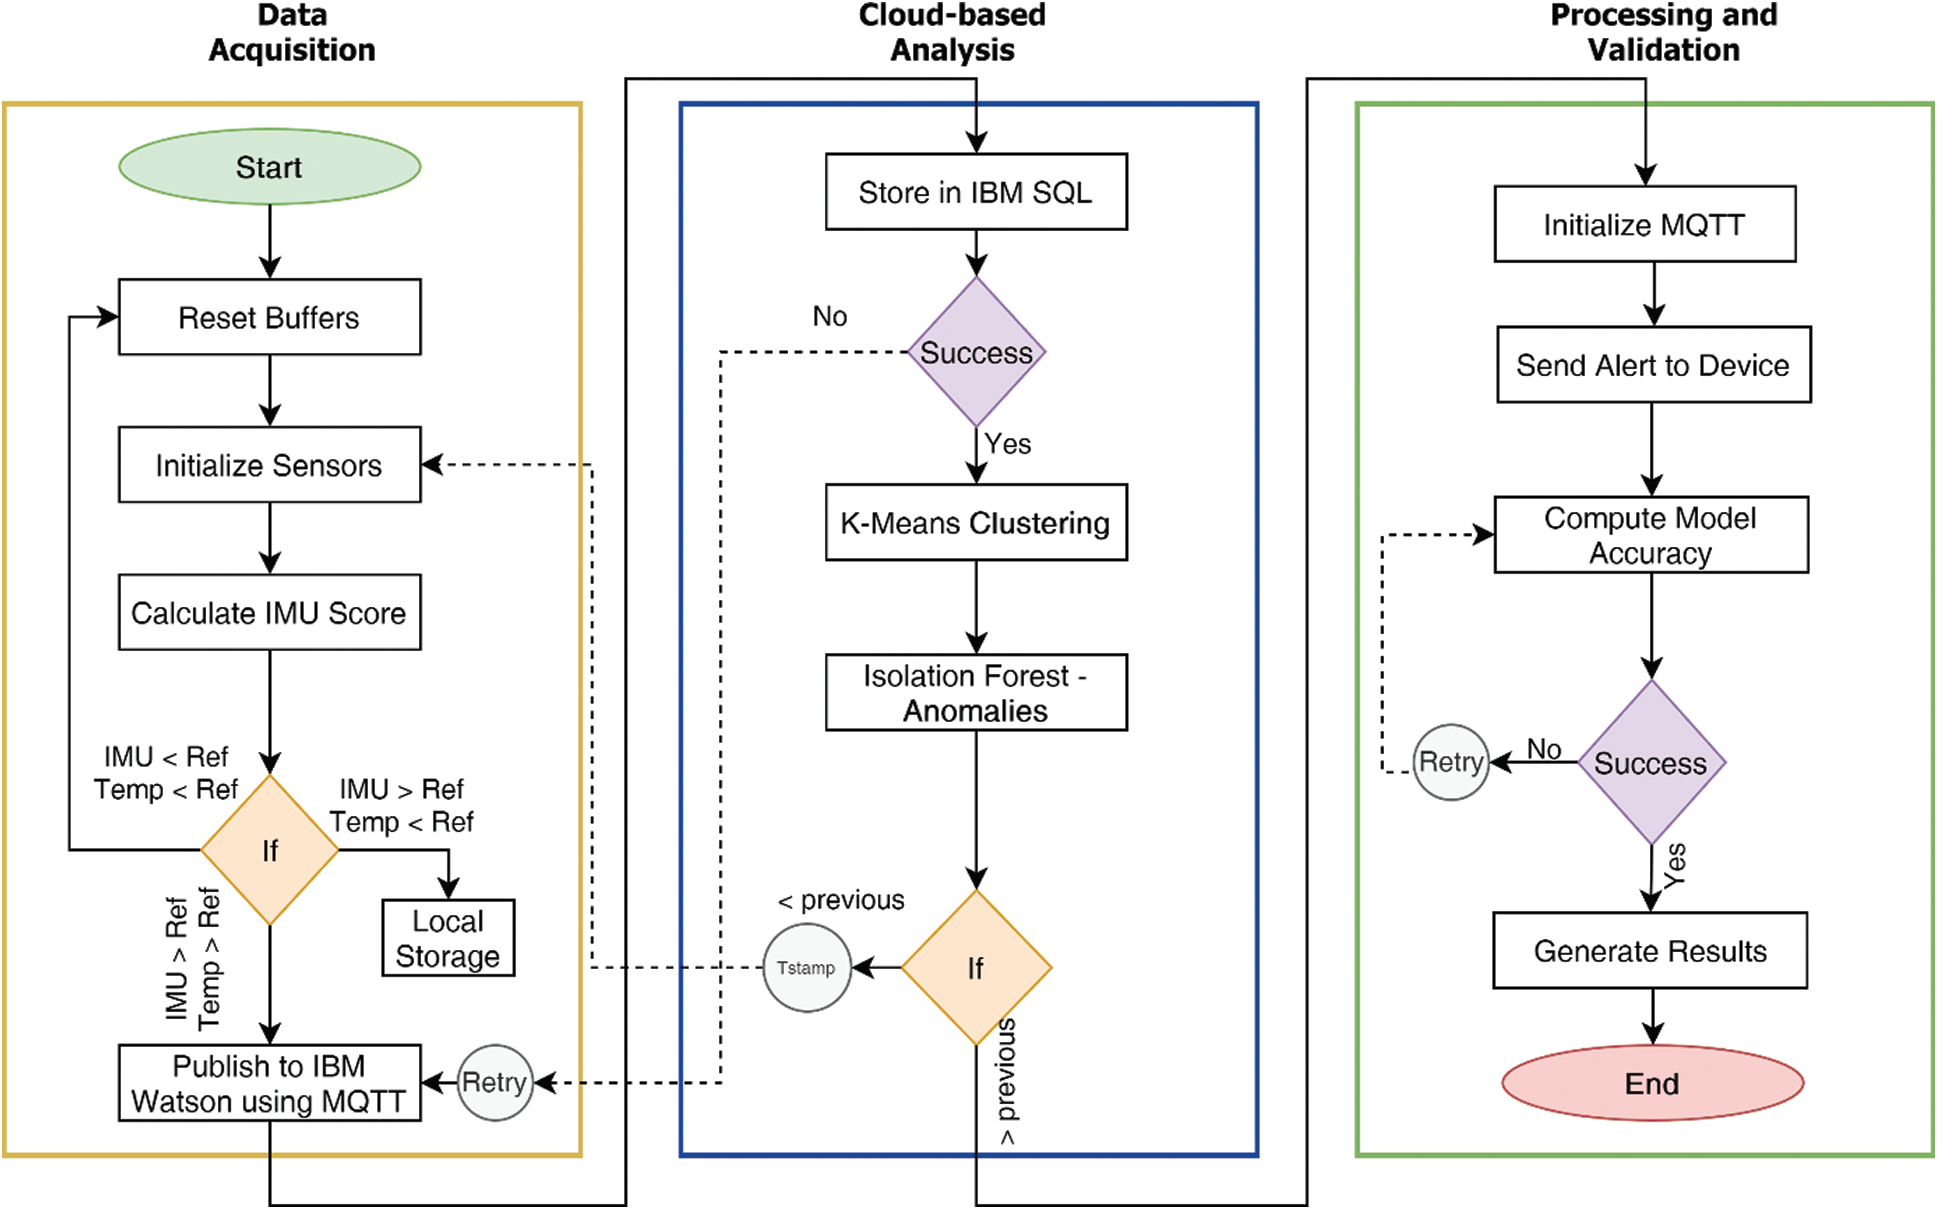
Figure 1: Complete system flow diagram of the proposed technique
Some of the key design goals mandated reduced equipment expense, complexity, size, and obtrusiveness. Therefore, a low-cost, small-sized development platform ESP8266 [32] was chosen for the prototype design as given in Fig. 2.
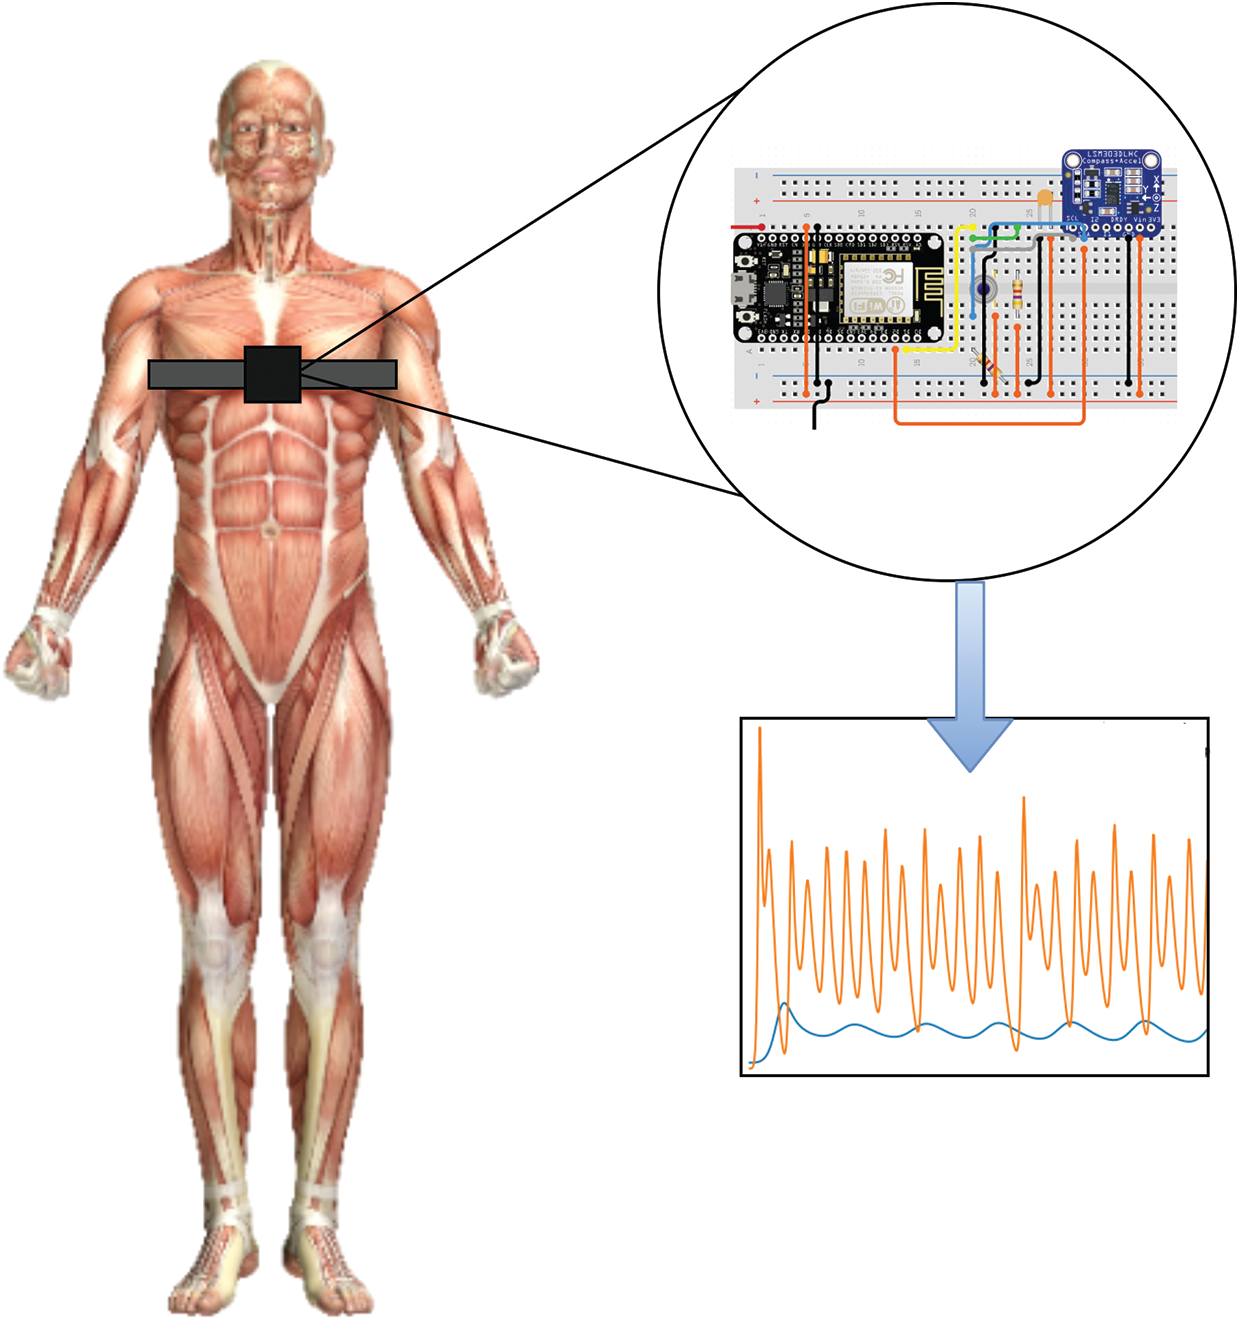
Figure 2: An illustration of the designed chest-worn prototype device
A contactless infra-red thermometer MLX90614 [33] was used to measure the body temperature, whereas LSM303DLHC [34] module to detect the changes in 3-axis. The programmable interrupts for free-fall and motion detection were used to model the cough patterns. The position of the accelerometer is extremely important for accurate reading, where its position and orientation could influence the outcome. Hung et al. [35] estimated the accuracy of accelerometer data in various orientations. The study exhibited the selection of sagittal plane for improved accuracy, therefore, adopted in this research. The volunteers were instructed by research staff to perform the following initial activities to identify baseline characteristics:
a) Two minutes of normal breathing while communicating with the research staff.
b) Two minutes of normal breathing without any activity.
c) Ten simulated deep breathing.
d) Ten simulated coughs.
During this interval, the chest-worn device automatically logged the temperature readings at a one-minute interval. The initial tests were conducted to identify the normal breathing patterns that were used to later detect anomalies. Finally, the devices were handed over to the volunteers that automatically recorded the physiological features over a period of eight hours each.
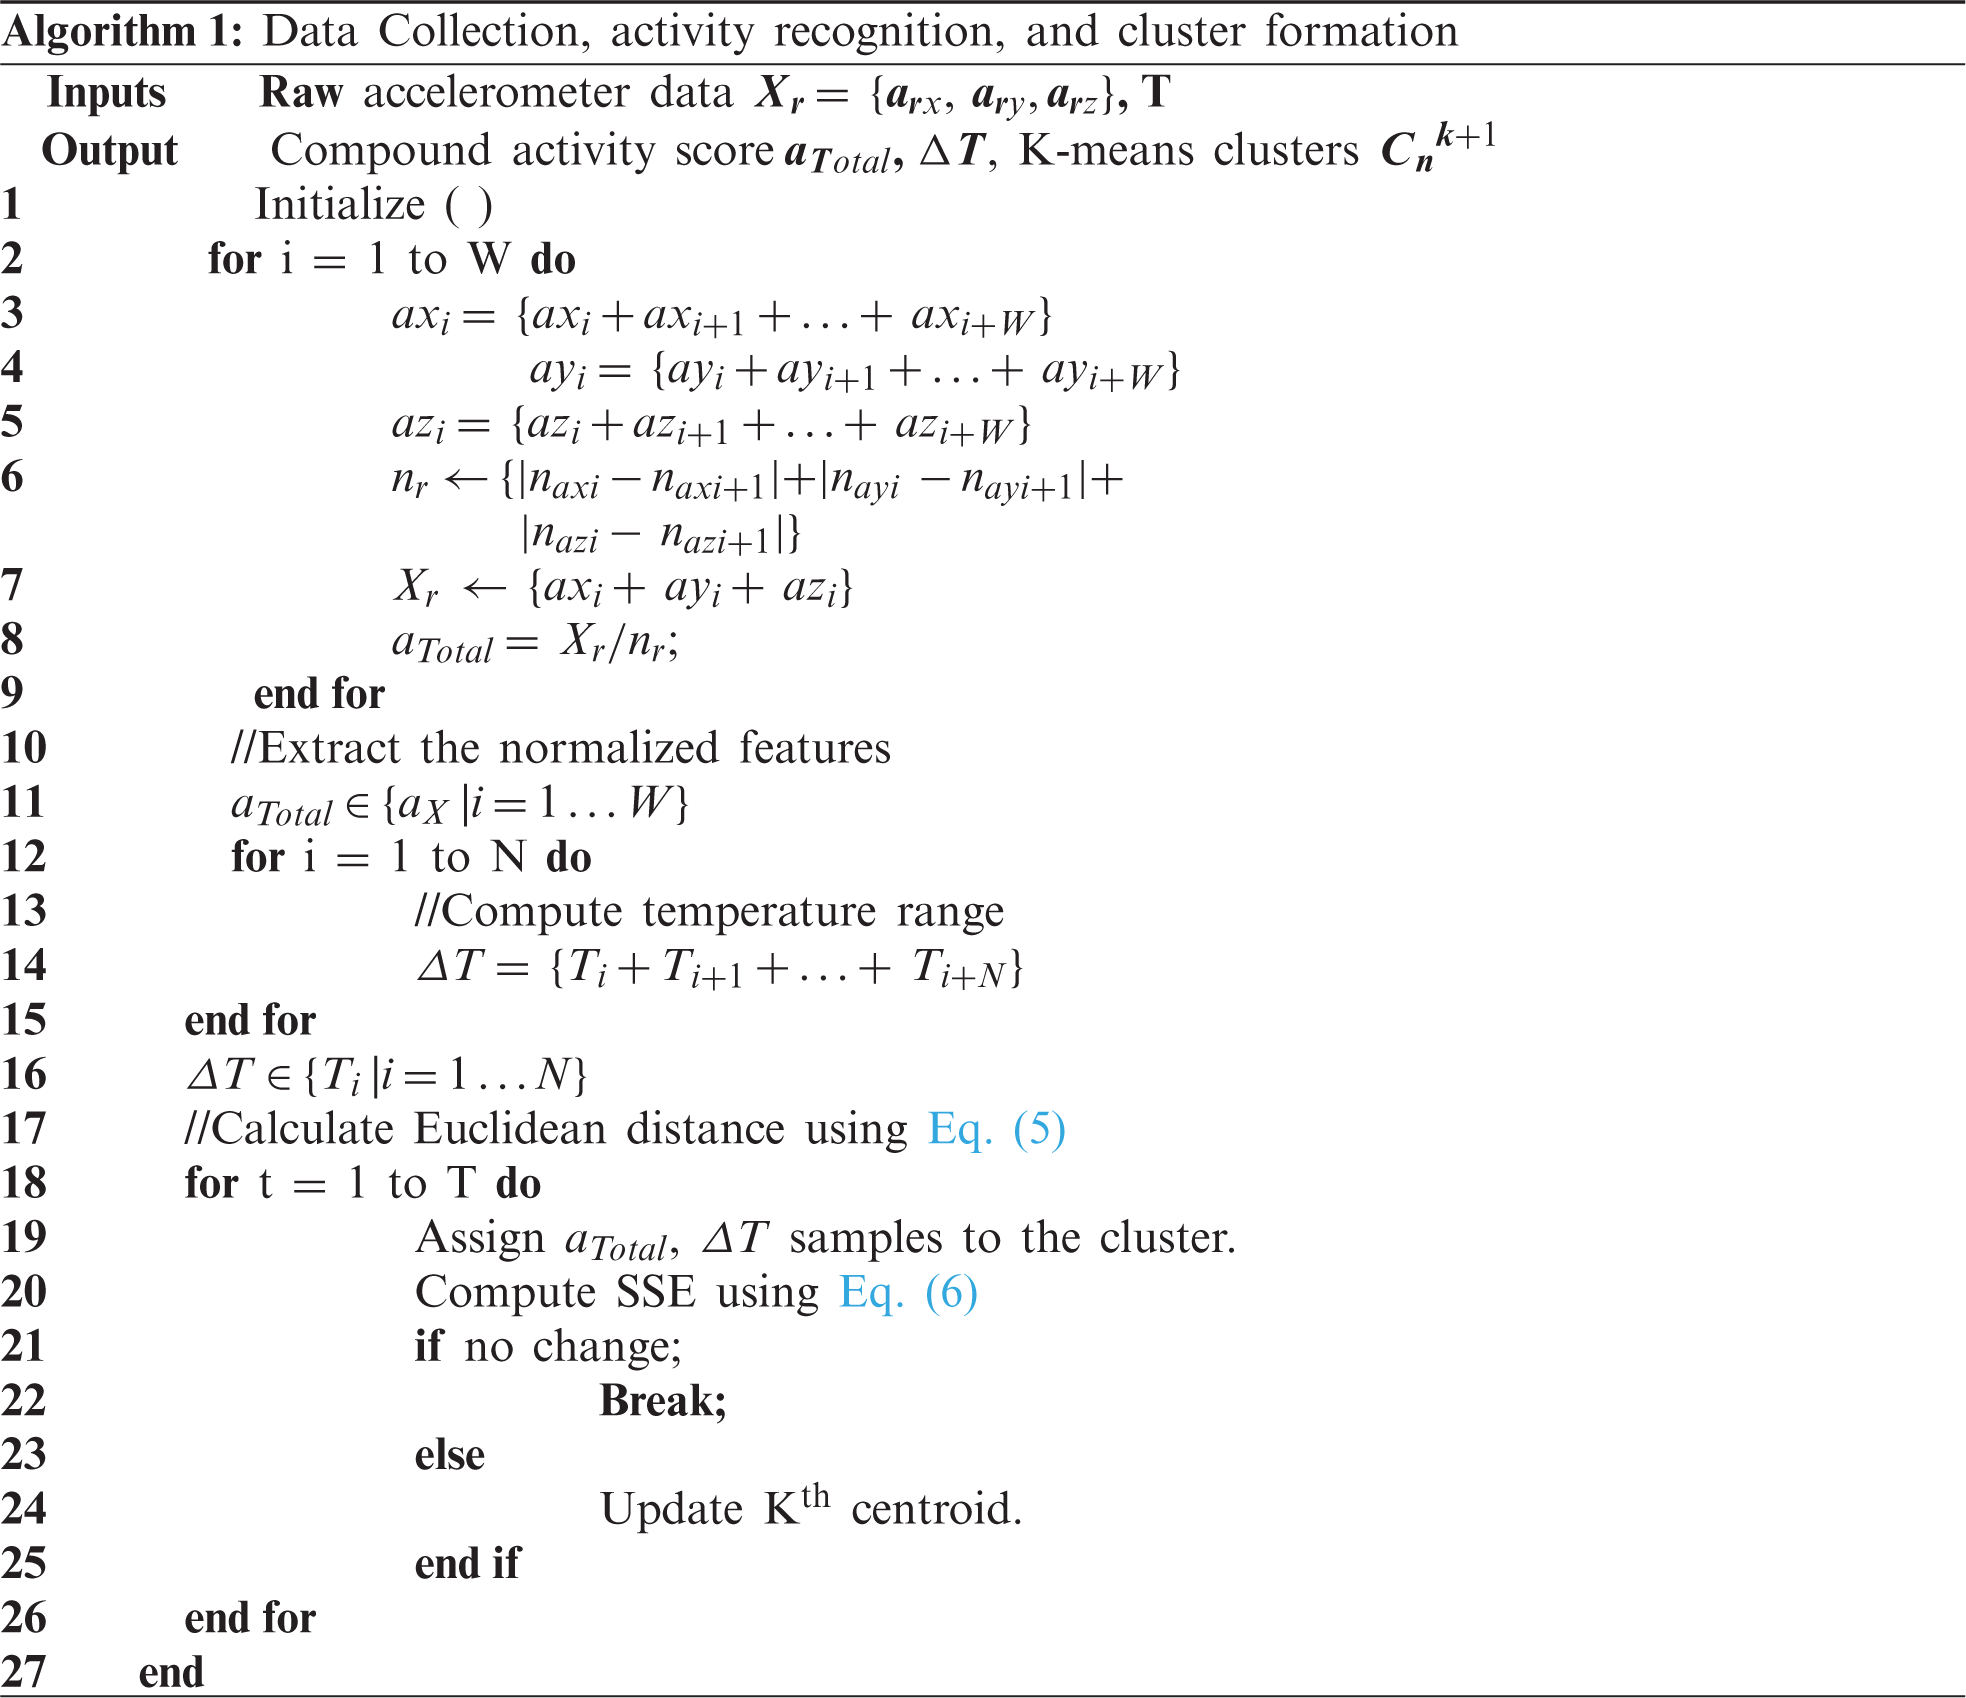
In a typical accelerometer score, the individual changes at the x, y, and z-axis are normally observed as static acceleration. Therefore, dynamic accelerometer measurements were performed to estimate the cough patterns. In addition, the angular velocity components helped to identify workout modes that were used to set various thresholds to accommodate the rise in body temperature and breathing patterns. The frequency (f) of the accelerometer was set to 25 Hz, whereas the data windows size (W) was set to be 10 s. The observation windows size is a critical factor that can change the signal resolution. Smaller window size can lack essential features, whereas no additional information can be returned to larger window sizes. Therefore, a total of (N = 6) accelerometer observations (following the window size W) were collected every minute.
Therefore, the nth data samples for a window’s size (W) can be given as
where
The total number of observations was averaged to produce a score of (Navg) per minute. The overall length of experiments was sliced into (T = 8 h), yielding a total average accelerometer observation to
Therefore, each accelerometer sampling data point can be represented as
where,
On the other hand, the human body temperature does not fluctuate abruptly, therefore a temperature reading at every 10th minute was recorded, yielding a total of 48 observations per set of experiments. The experimental observations involved data collection, threshold detection, cluster formation, followed by anomaly detection in independent clusters, as given by Algorithm 1.
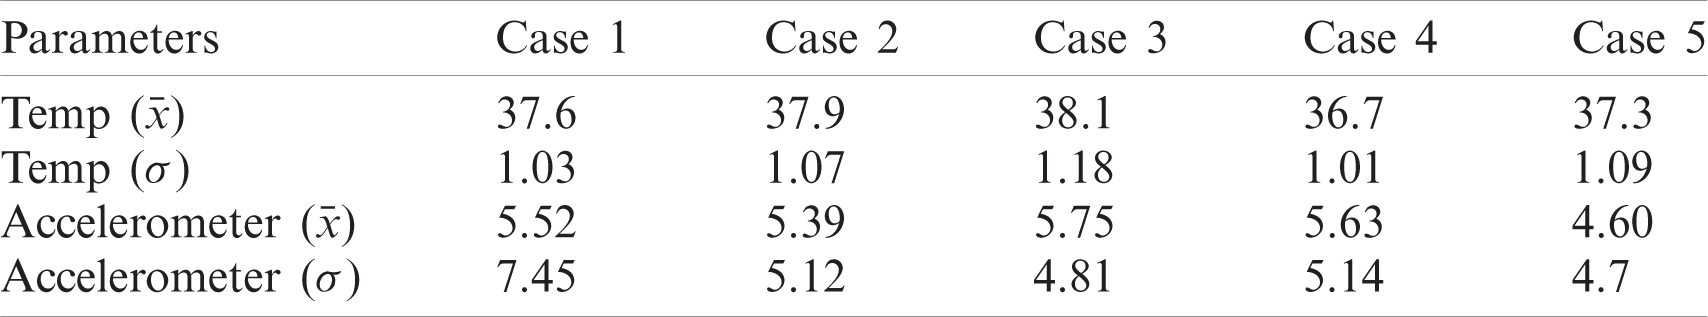
The observations revealed that five volunteers (referred to as Case 1, Case 2
Table 2: Recorded dataset with mean and standard deviation scores
3.3 K-Means Clustering Algorithm
The K-means clustering algorithm is a common unsupervised ML technique in which input data similarities are considered to form clusters. In a classic K-means operation, the Mean values of data points are calculated that initially forms a centroid in a cluster. By computing the Euclidean distance between the data points, clusters can be formed in an m-dimensional space, as given by Eq. (5).
where, i and j correspond to sample and cluster indices, respectively. Once the target number of clusters are identified, an integer number k is selected. Every iteration further reduces the number of sum of squares, and assigns the data points with a minimum distance to the respective centroids. This iterative process helps to identify the nearest neighbor. The stable values of centroid determination is an optimization problem, which calculates the sum of squared errors (SSE) or inertia in each iteration to calculate the deviance by which sample sets are assigned to each cluster centroid. SSE can be computed by Eq. (6).
where,
The K-Means algorithm is an effective technique for cluster formation of larger datasets. However, it is very sensitive to dataset variations near cluster boundaries which can produce additional clusters. As a result, it is important to determine the cluster size that matches the sample data and is equidistant from the centroids. A smaller cluster size selection may group the entire dataset into a single cluster, while larger cluster numbers may have overlapping features. The inertia score was calculated with the Elbow curve approach in order to identify optimum computations of clusters as seen in Fig. 3. Roughly, the equilibrium between SSE and the number of clusters was determined around value three.

Figure 3: An elbow curve that gives the optimum number of clusters for the dataset
The patient data from all five test cases were grouped into three clusters according to spatial dispersion. The multivariate feature distribution for temperature and accelerometer data is presented in Fig. 4.
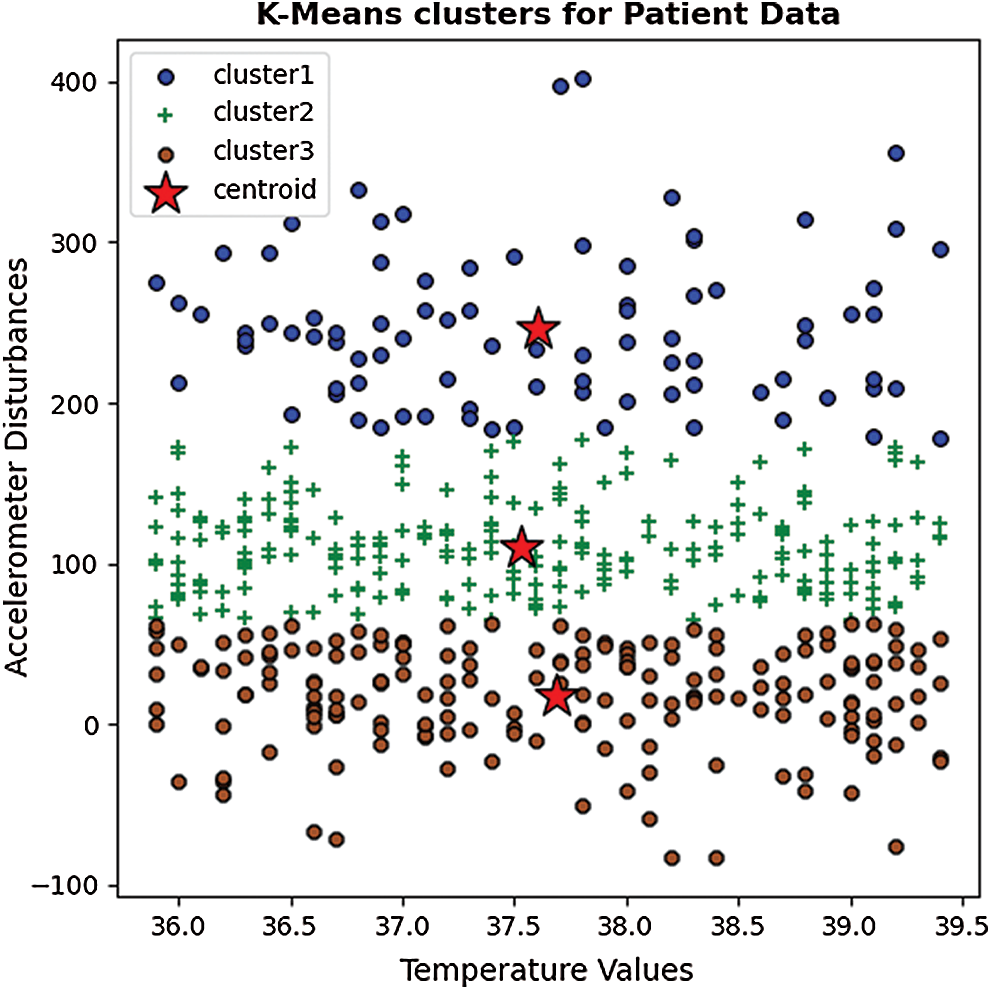
Figure 4: A clustered scatter plot of sample data based on the K-Means algorithm
Isolation Forest performs on a similar approach by dividing the dataset into several decision trees that logically separates anomalies by random attribute selection. The iterative process generates multiple decision trees with various depths. The decision trees start at the parent or internal nodes and split the data based on a defined anomaly score towards external or leaf nodes. The decision process is normally less complex at the higher nodes, whereas the complexity of the tree increases as its depth increases, as given by Fig. 5.
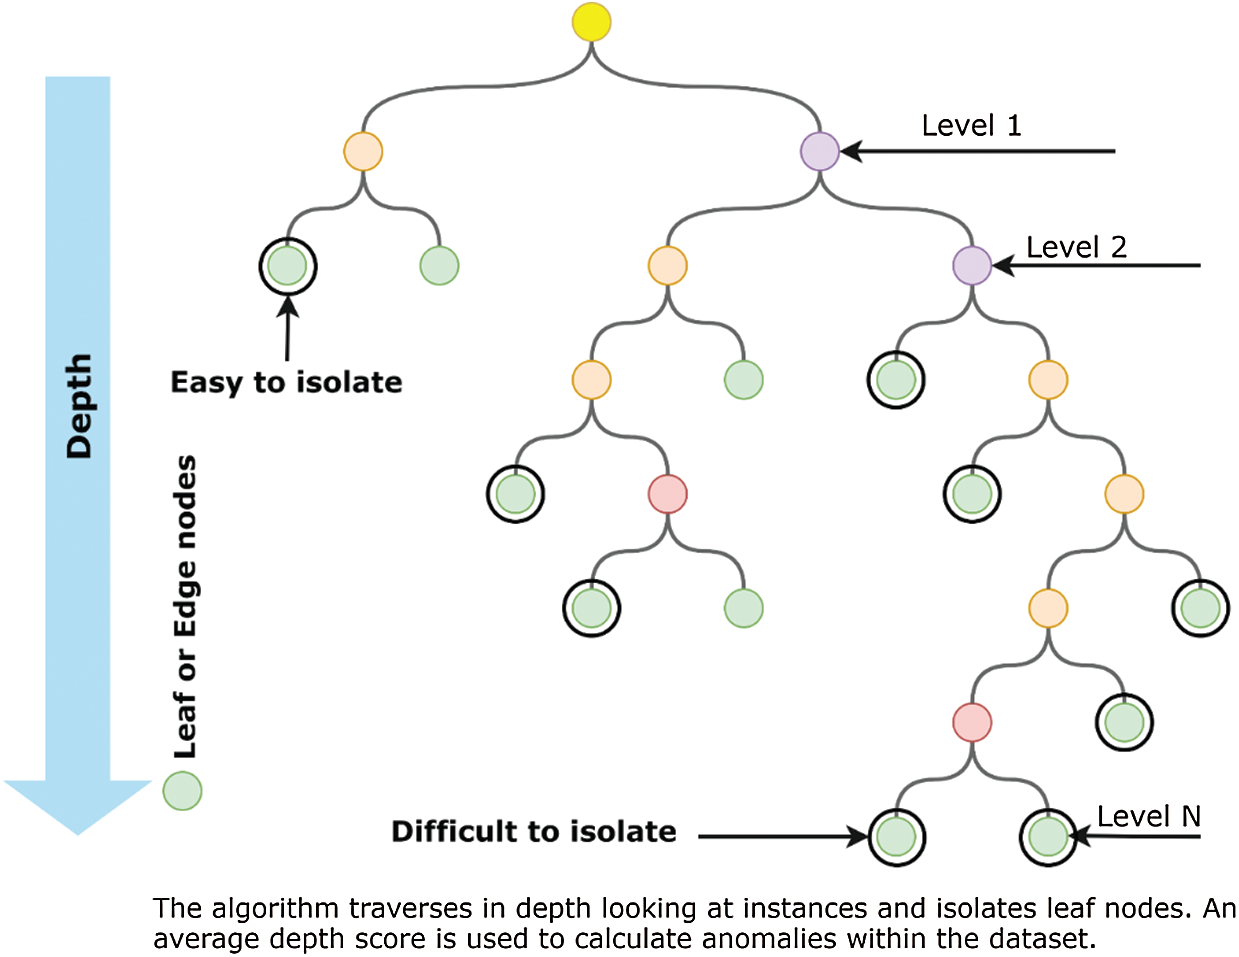
Figure 5: An Illustration of a decision tree-based isolation forest
Ideally, the accuracy and computational efficiency of isolation forests increase with the sub-sampled datasets that form multiple dense internal nodes. The decision process at higher node levels is mostly binary, which improves the computational efficiency of the algorithm. In our proposed approach, first, the K-Means algorithm forms highly correlated dense clusters of features that serve as the sub-sampled dataset input for isolation forest. Therefore, the logical division facilitates the faster isolation of anomalies. As the sub-set contains dense clusters of observations, the anomalies likely reside closer to the roots of the decision tree. Therefore, an iterative process is performed to calculate the threshold over which the split is performed.
Assume a training dataset X with (n) number of data points having (y)-dimensional features as given by Eq. (7).
where each data point represents (y = 3) the number of features resulting from K-means clustering and sub-sampling the dataset. The formation of an isolation forest initially begins with the calculation of several isolation trees used to split the sub-sampled dataset by choosing random split scores at each instance. The isolation tree generation process is given in Algorithm 2.
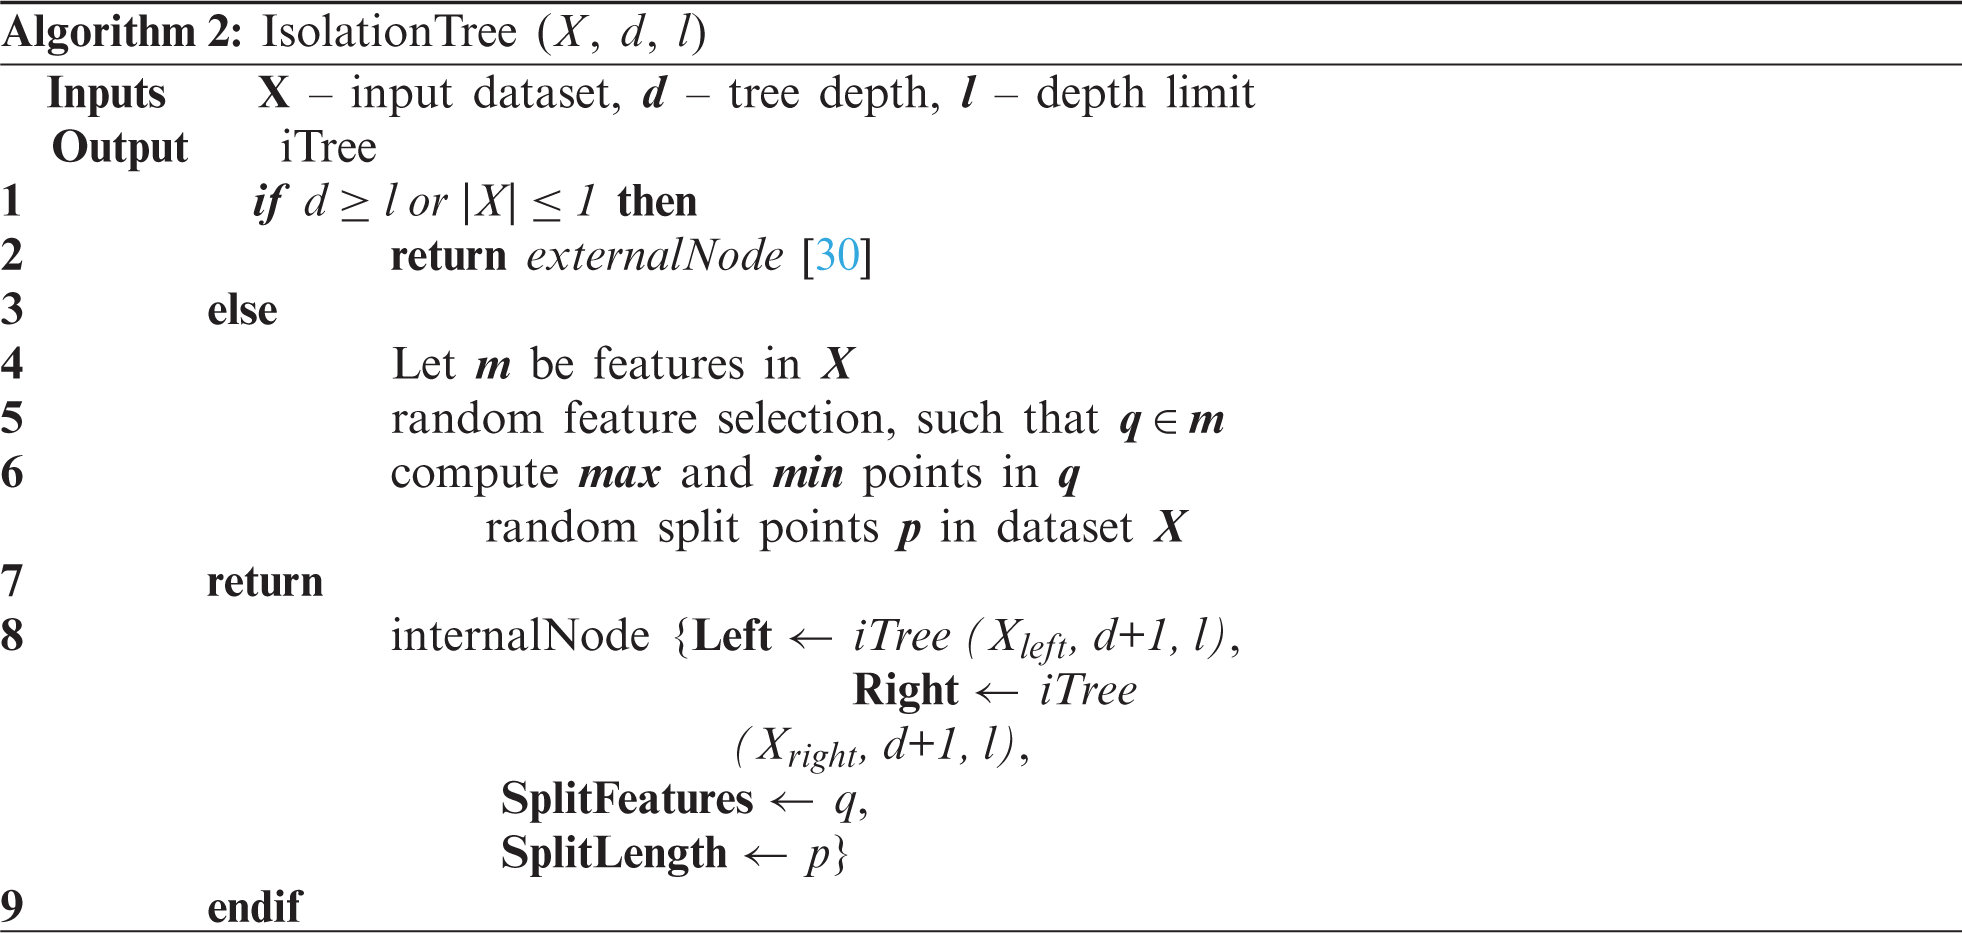
The dataset X is split into several decision trees by splitting the data points based on randomly chosen feature points. The iterative process follows a depth (d) to create decision trees until no further leaf nodes are left. By combining the range of individual decision trees, an isolated forest is formed, as given in Algorithm 3.
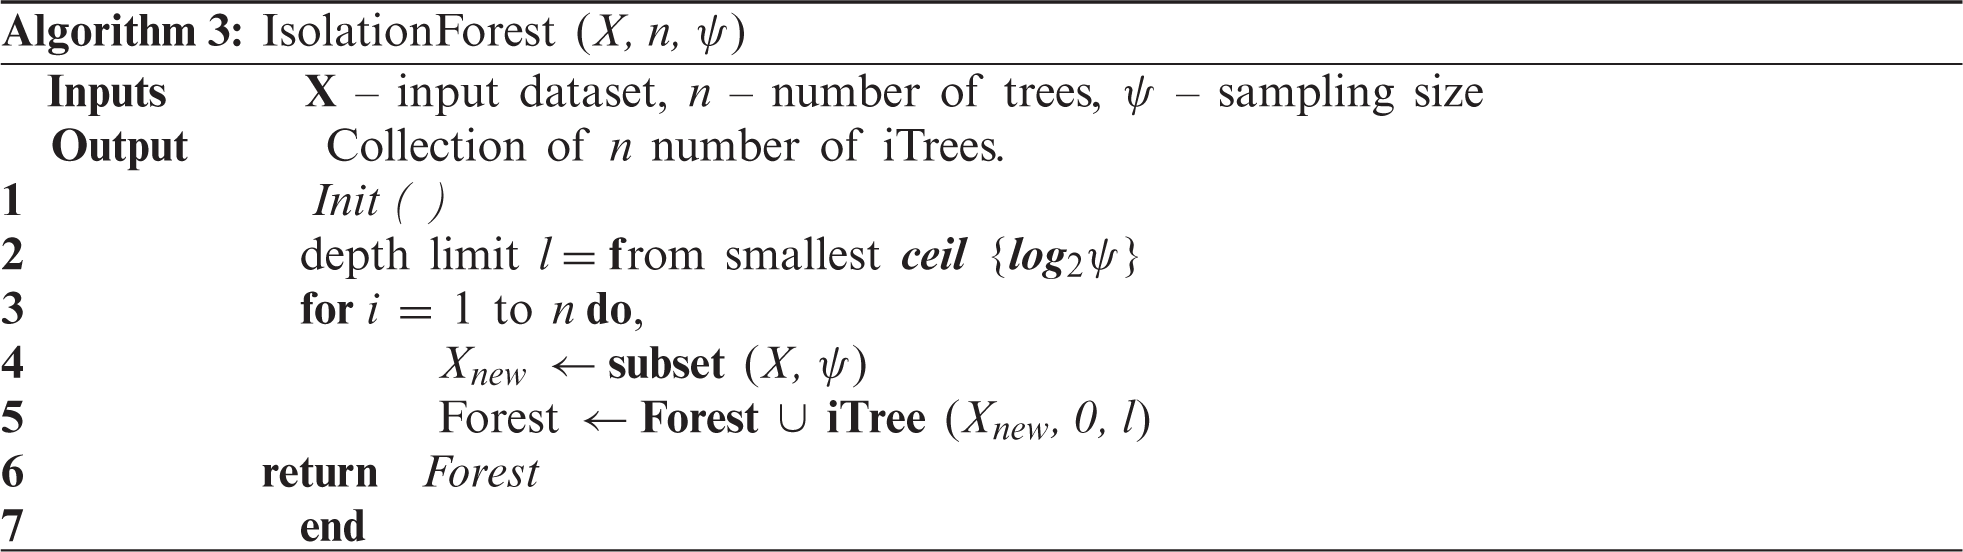
Several factors affect the performance of isolation forest both during training as well as the testing phase. Some critical factors such as tree depth, depth limit, and sampling size directly affect the logical partitioning accuracy and the number of generated trees. On the other hand, factors such as threshold values and contamination ratios (
where n is the testing data size, m is the size of the sample set, H is the harmonic number.
The value of H can be computed by Eq. (8),
where,
Furthermore, the average of all instances of H(x) is computed to generate a normalized anomaly score which is directly used as a probability of anomaly detection. The anomaly score can thus be computed as given in Eq. (9),
where,
The results show that the changes in temperature values follow a linear pattern, where a sudden spike in human body temperature is more unlikely. The temperature of the human body gradually changes over time, resulting in a less skewed distribution. This linear change helps to quickly spot anomalies. However, the change in accelerometer values was rapid and resulted in multiple skewed data bins. The overall distribution of accelerometer values is given in Fig. 6.
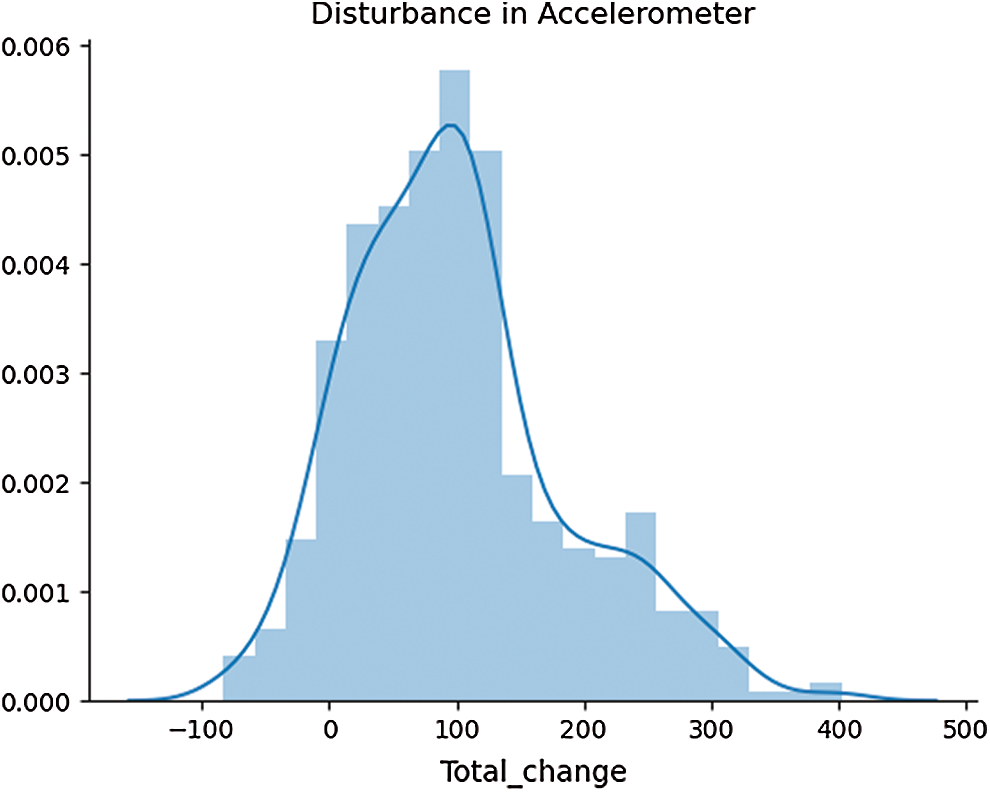
Figure 6: A histogram of accelerometer data distribution
The distribution is skewed which results in a larger number of isolation trees to account for all the feature values. The differences in dataset spread for both features are an important consideration to model the total contamination density that is required to fit the number of outliers in the training data. Tab. 3 described some of these statistical parameters to investigate the nature of our selected features.
Table 3: Skew and Kurtosis of temperature and accelerometer sensor data
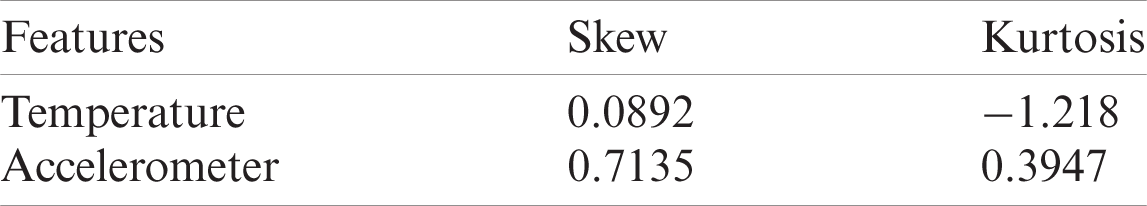
The skewness gives a measure of asymmetries of the probability distribution of data around its mean value. The accelerometer probability distribution as given in Fig. 6 also explains that the distribution is not unimodal, meaning the distribution has multiple bins skewed towards the right. The negative kurtosis value for temperature readings indicates that its central peak is flatter with flatter tails. Negative kurtosis also indicates that more data values are located near its peak, thus making it less prone to outliers. However, in accelerometer readings, the values are also spread across its tails, which is evident from multimodal distribution. The anomaly regions calculated from this distribution are presented in Fig. 7.
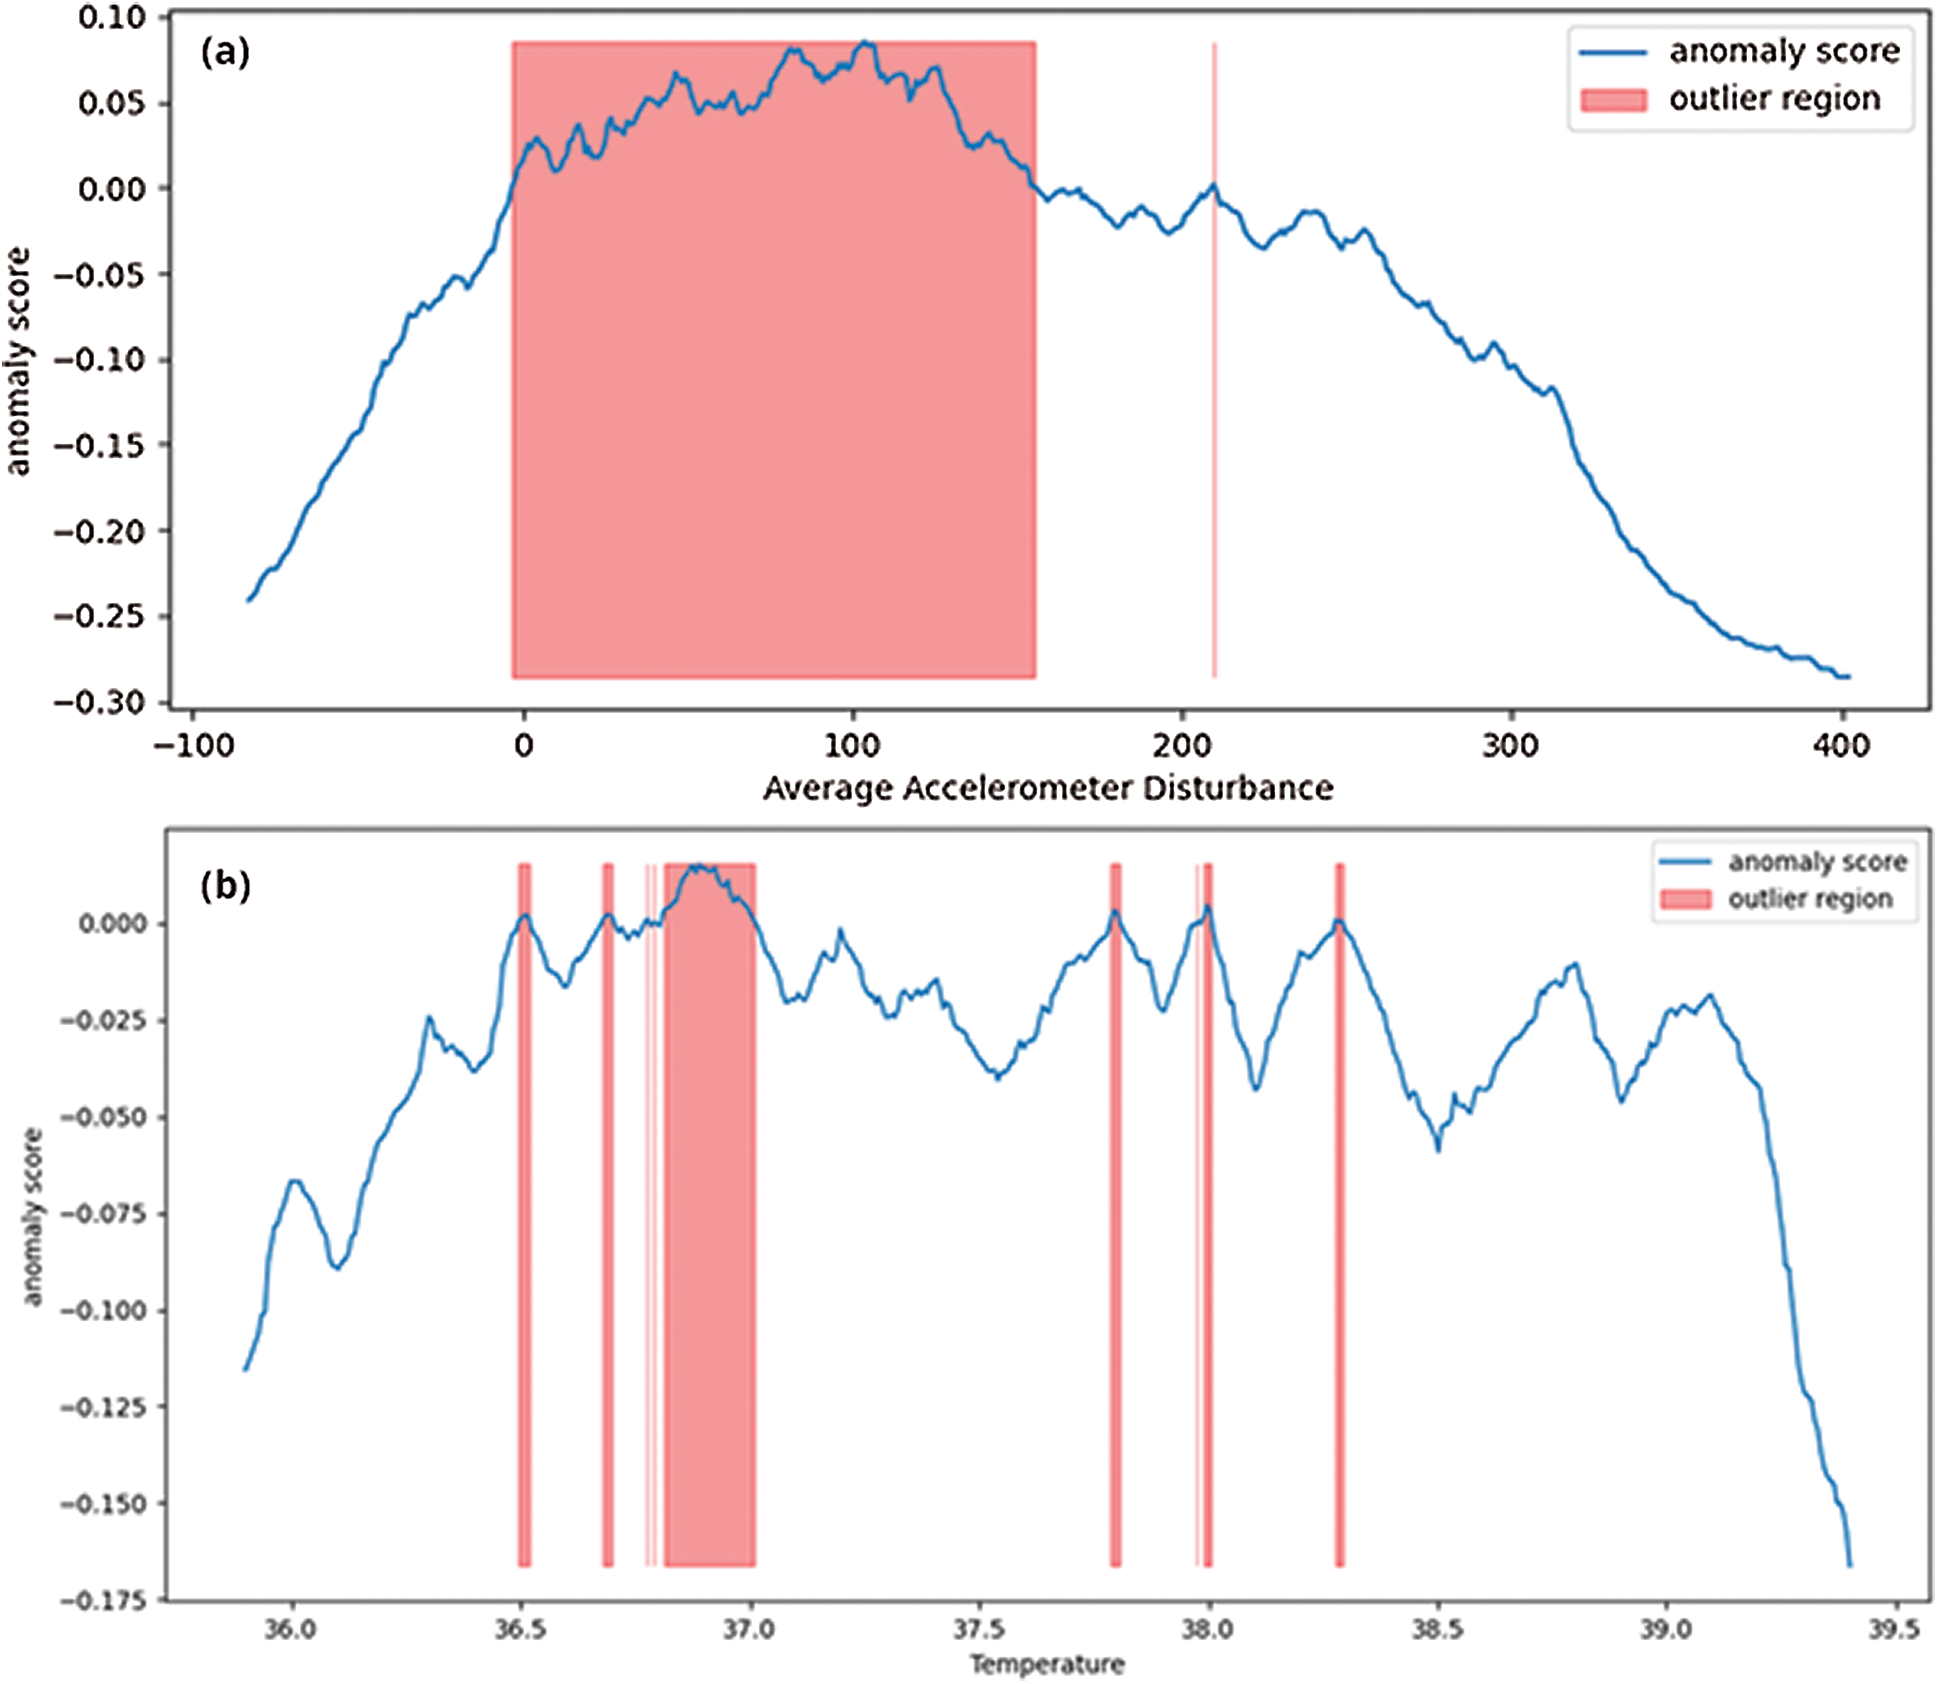
Figure 7: Computed anomaly scores for features data, highlighting outlier regions
The anomaly score is used to predict the outlier regions in the dataset where there are maximum occurrences of anomalies. As shown in Fig. 7a, the accelerometer outlier region indicates a probability of outliers mostly in the positive trend of accelerometer data (a positive change in all 3-axes). On the other hand, in Fig. 7b, the outlier regions for temperature sensor data follow a sudden change in value distributions. Fig. 8 depicts the average time-series based temperature anomaly scores for the test cases. In addition, the isolation forest has a varied impact on the accelerometer data due to its skewed nature. One of the most sensitive parameters in an isolation forest is the contamination factor (
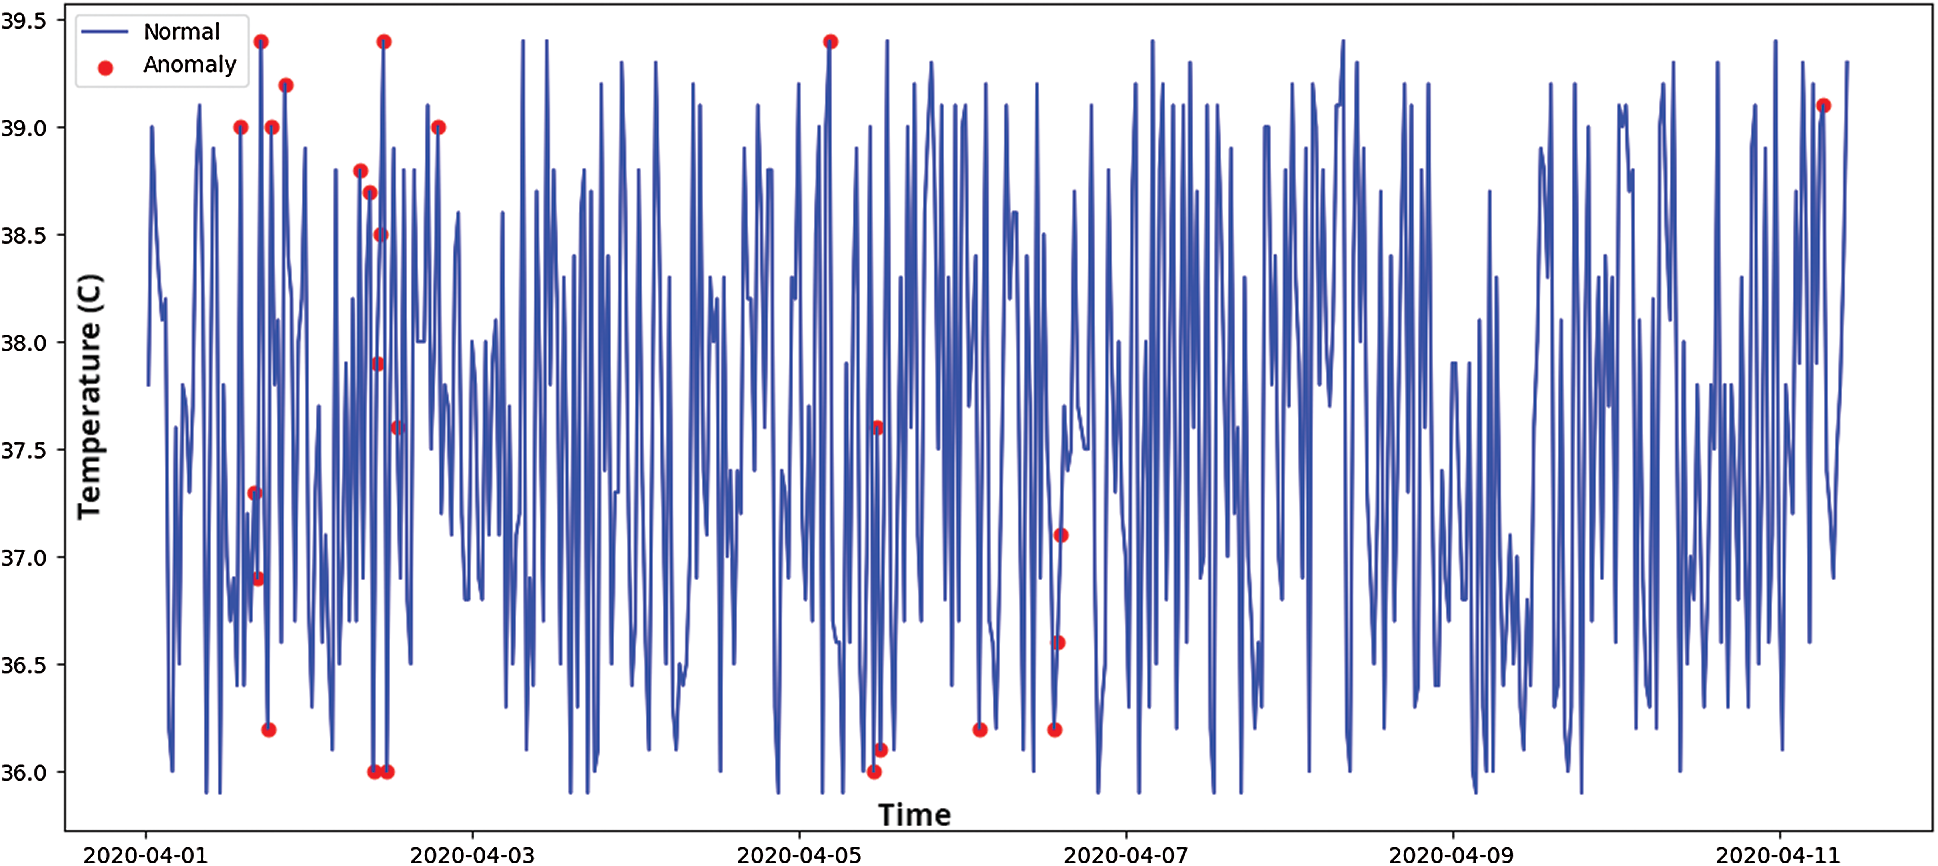
Figure 8: Time series-based anomaly detection for temperature sensor data
A very low contamination factor may neglect true positives making the model less prone to anomalies detection. Whereas a very high contamination factor (
Table 4: Contamination factor and its effect on isolation forest outlier detection
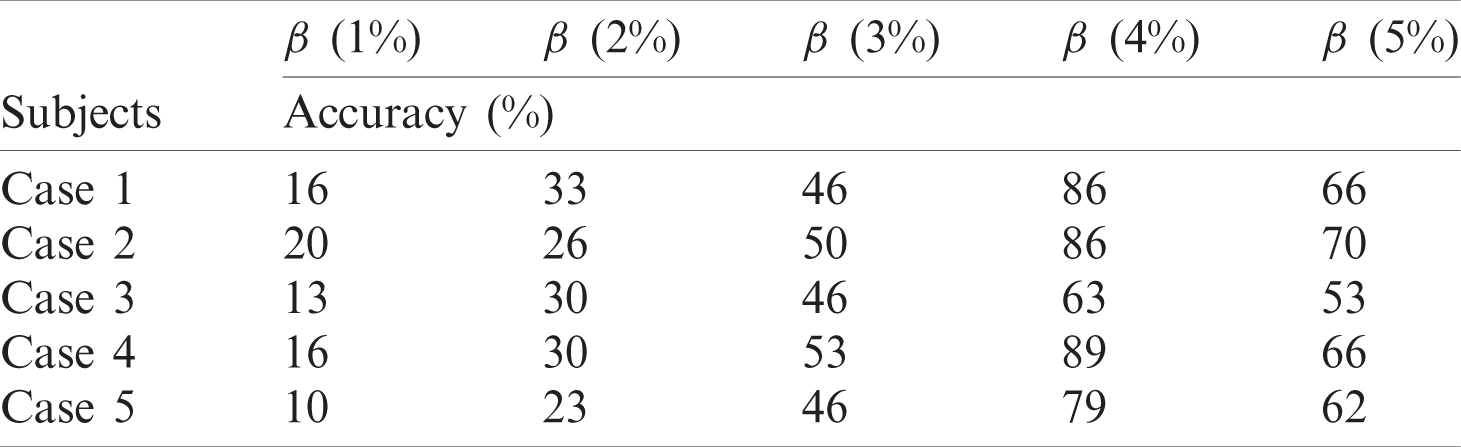
The accuracy score gives a generic viewpoint of the model performance based on selective threshold levels. An accuracy score was computed for the test cases at various contamination thresholds using Eq. (10).
Table 5: Definition of classification outcome terms
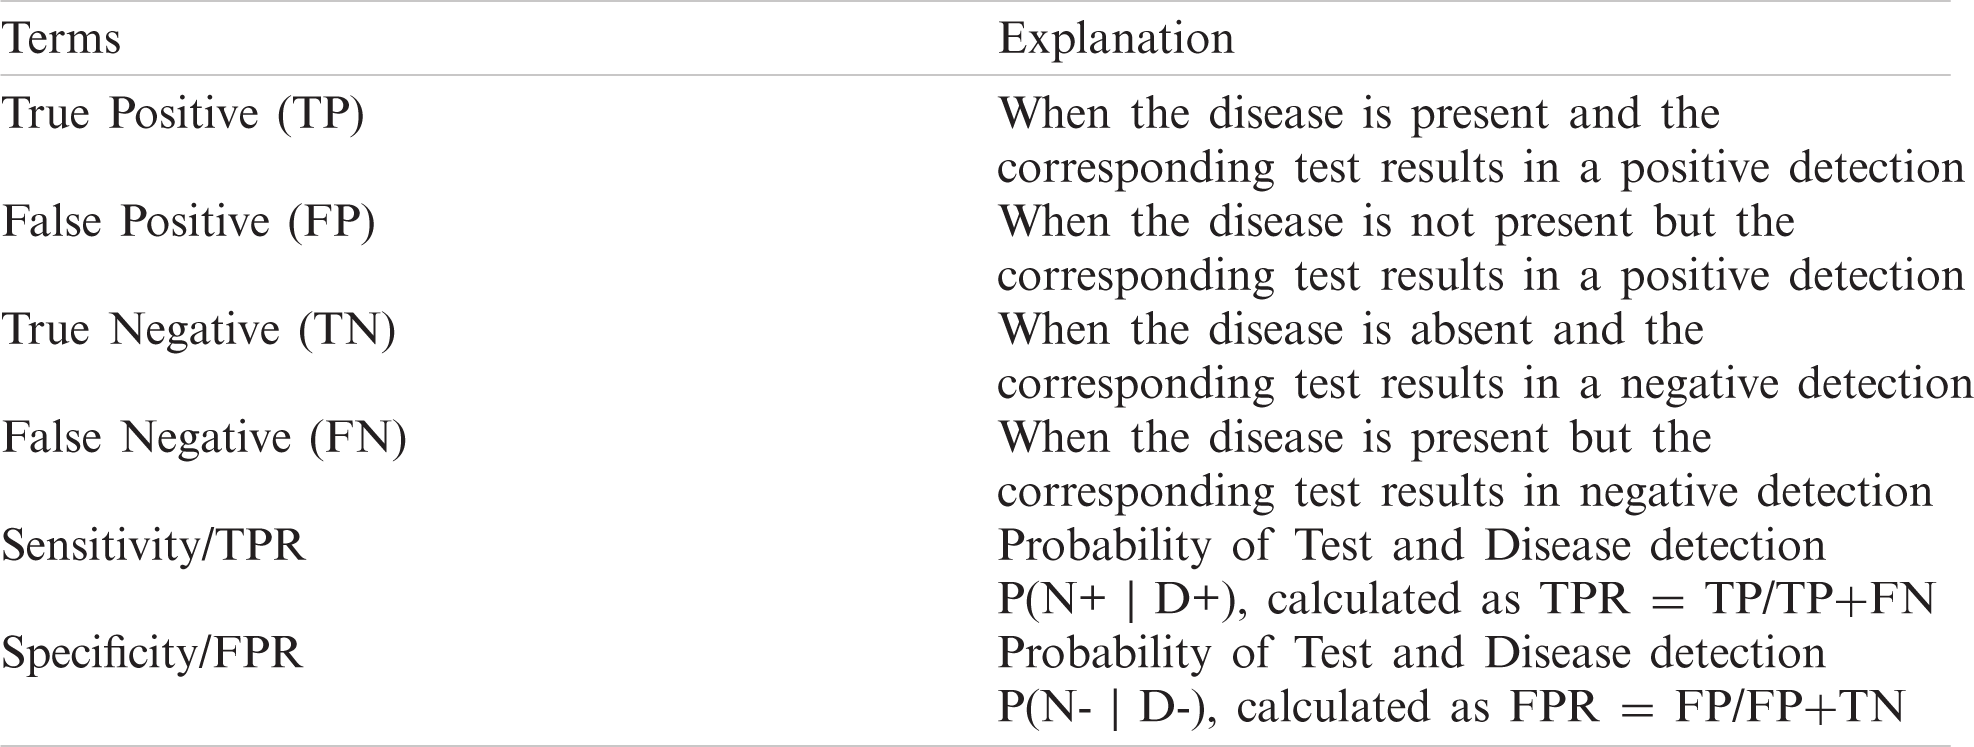
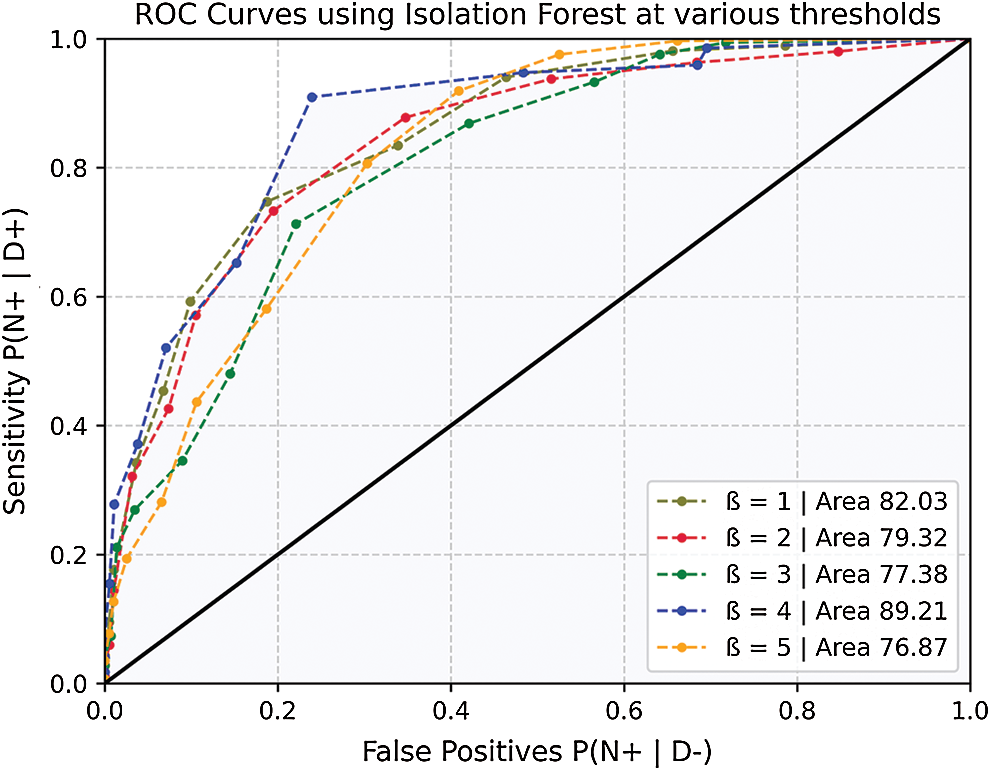
Figure 9: ROC curves for model accuracy at various thresholds
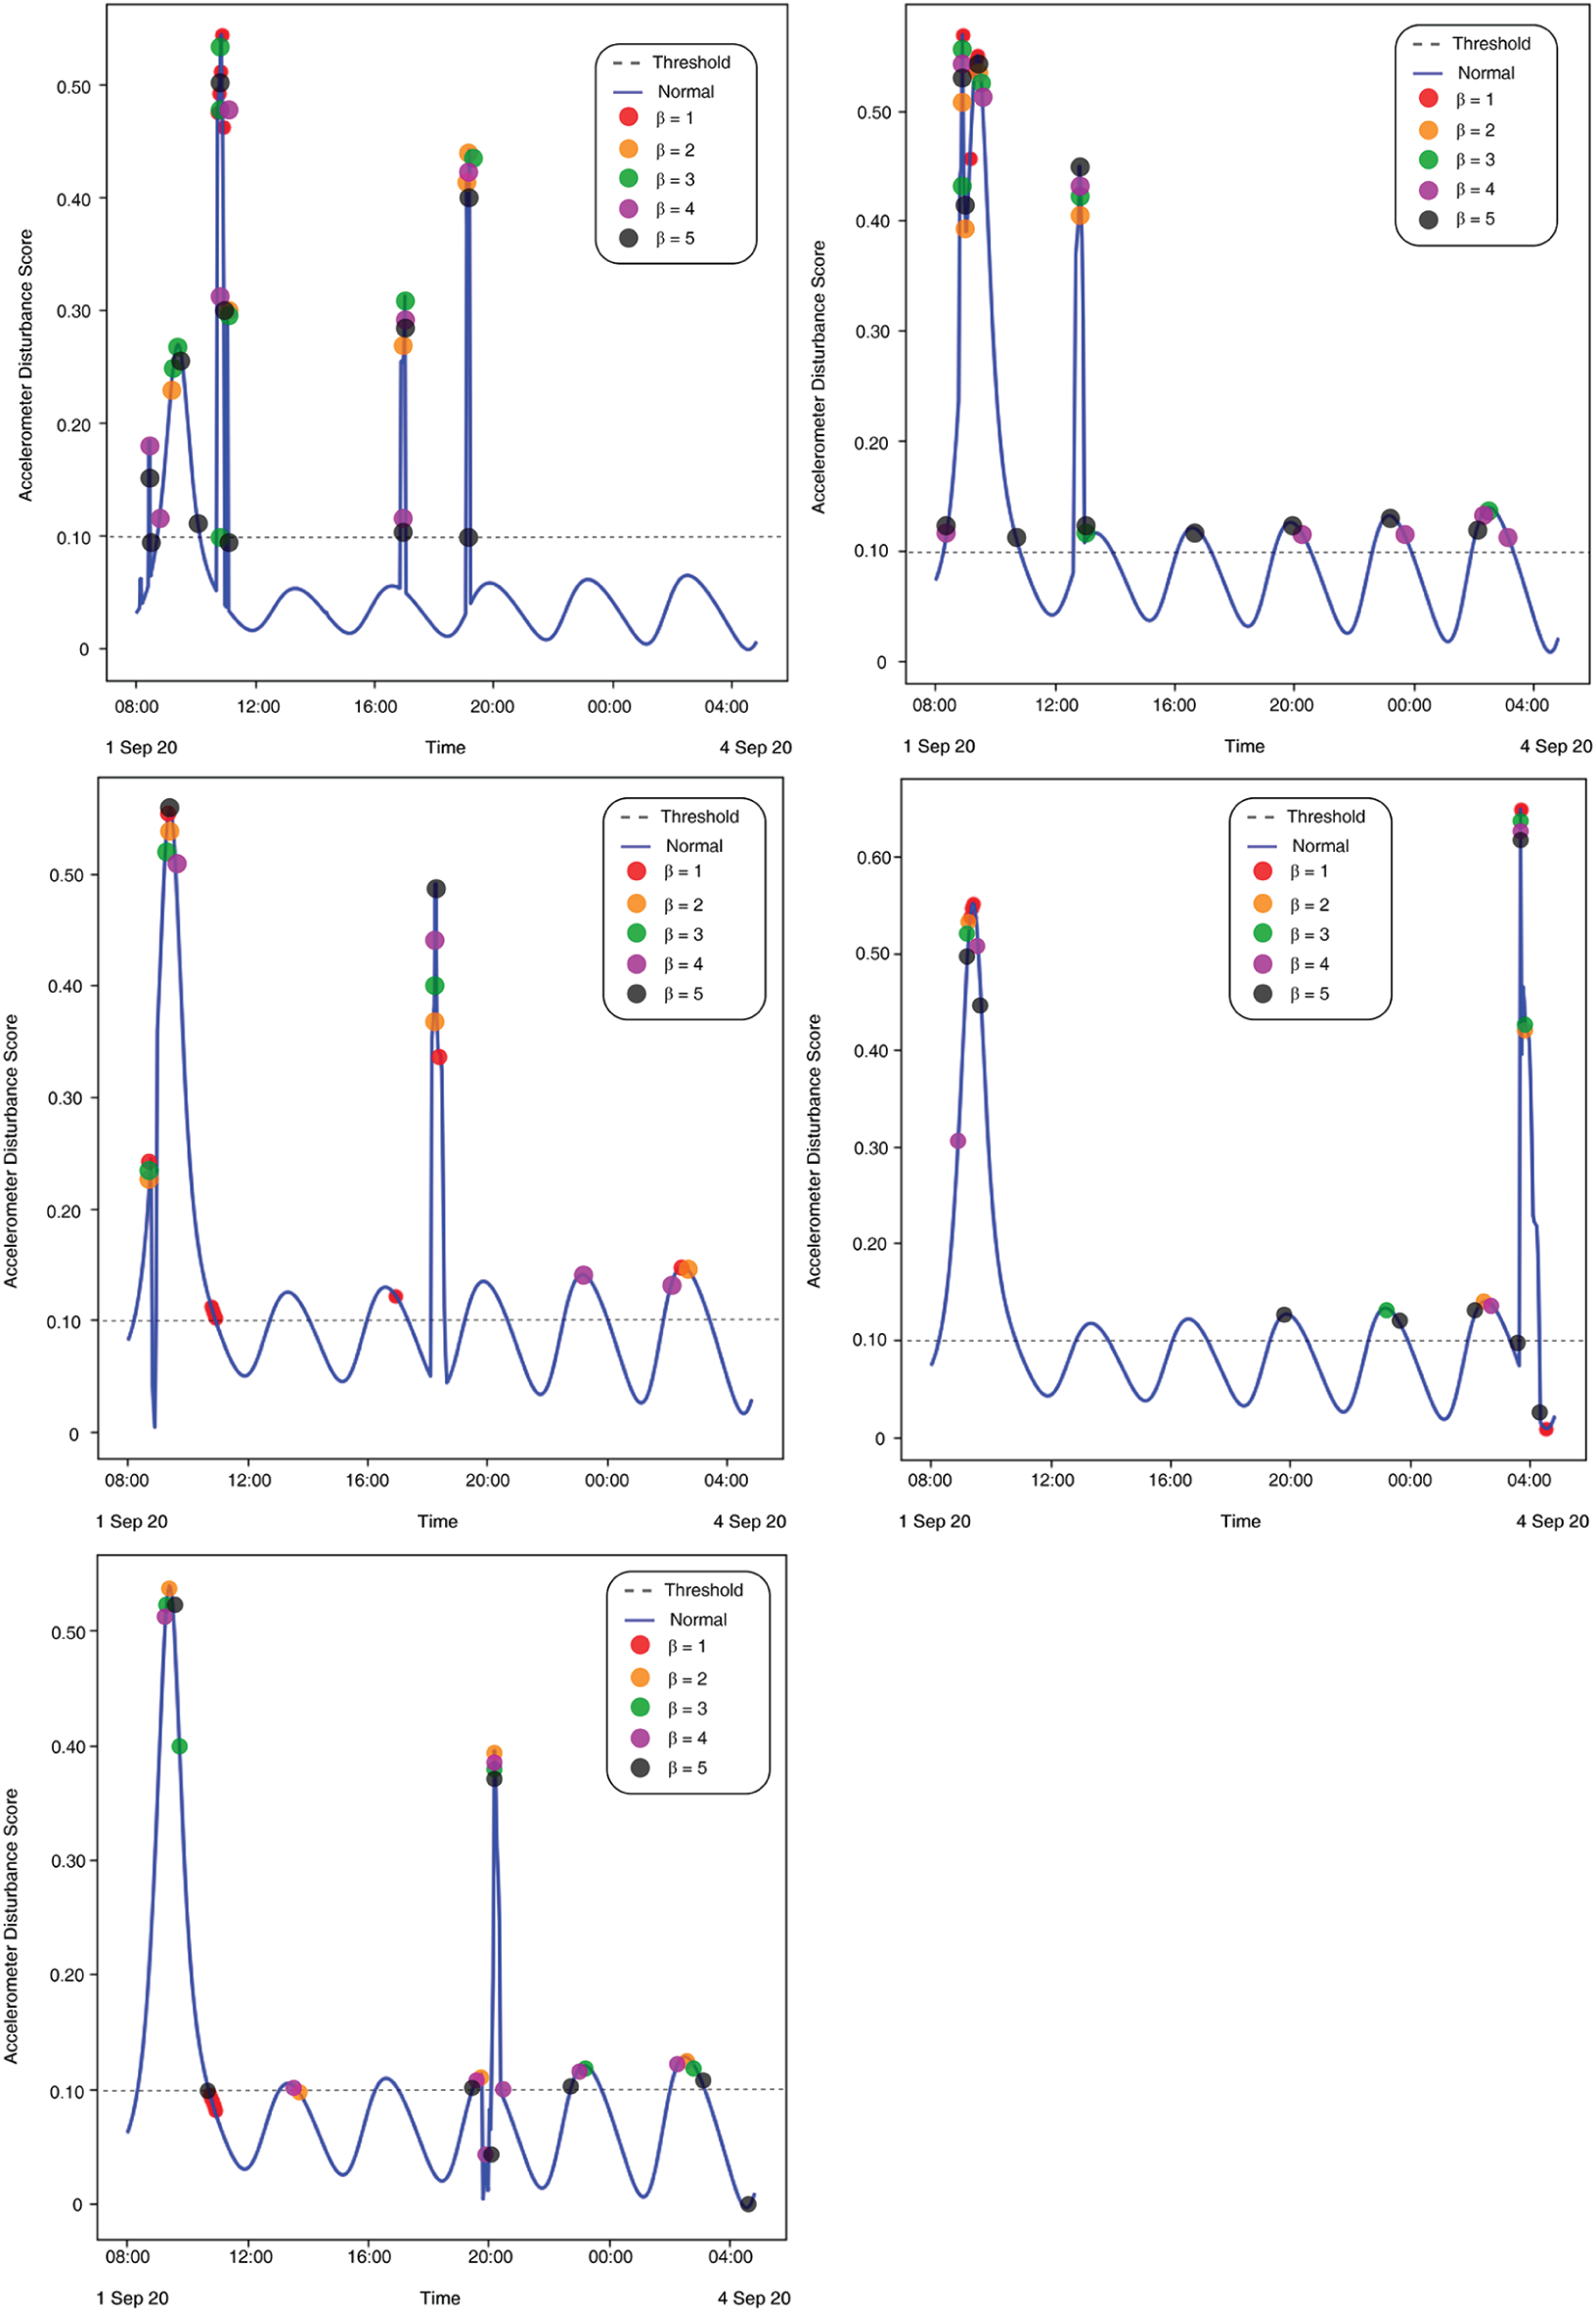
Figure 10: (Left to right – Case 1 to Case 5) Plotted anomalies with various contamination factors on Time series-based accelerometer variations score
The results show a clear pattern that by increasing the contamination factor the isolation forest was able to detect over 80% anomalies in most of the cases, as given by Fig. 10. The accuracy score helped to identify the best threshold values for the isolation forest. However, model selectivity and sensitivity are often used to accurately evaluate model performance. In this regard, the receiver operating characteristics (ROC) curves allowed to study the balance between sensitivity and specificity for all possible thresholds. Classification modeling may exhibit different requirements, including independent threshold selection, thus making ROC curves a suitable measure for independent performance analysis. Therefore, multiple ROC curves were plotted by increasing the threshold, resulting in deterministic analysis illustrating the precision of the model and its ability to detect the anomalies. ROC curves were contrasted with True Positive Rate (TPR) and False Positive Rate (FPR), implying sensitivity and selectivity of a model, respectively. ML and classification problems rely heavily on binary classification, where the accuracy of a detection or prediction outcome is defined by the value of (0, 1). The outcomes are typically identified as False Positive (FP), False Negative (FN), True Positive (TP), and True Negative (TN). Tab. 5 describes these parameters in detail.
where, P, N, and D represent Probability, Normal values, and Deviations, respectively. The error matrix applies the cumulative event distribution to one point in the ROC space. A trapezoidal method was used for the calculation of area under the curve (AUC). The AUC between the FPR and adjacent TPR values was calculated using Eq. (11).
As shown in Fig. 9, the ROC curves indicate the variation in model performance. The likelihood of false positives is also increased with the increase in sensitivity. A model must also be calibrated to maintain a balance between its precision and false events.
The average change in accelerometer data (i.e., cumulative change in all 3-axis) was used to train and predict the isolation forest outcome. With a lower (
In this research, two of the most common early symptoms of COVID-19, temperature, and cough were studied. The human body is a complex architecture where a network of systems performs in harmony to conduct its daily tasks. Disease detection normally requires detailed investigation of several underlying physiological factors that are correlated and demand a clinical investigation. These correlated physiological features generate very large and highly complex datasets that are normally used for early detection and in some cases medicine or treatment prediction. This research focused on an unsupervised machine learning-based technique to loosely uncouple these correlated factors to identify outliers that are critical for early detection. A hardware-based wearable prototype was designed to test 40 subjects for temperature and dry cough, out of which five test cases exhibited clear signs of underlying respiratory problems. The above-mentioned multivariate features were clustered using the K-means algorithm that groups the datapoint similarities in 3 clusters ranging from (normal to high deviation). An isolation forest algorithm was implemented on the real-time time-series data to detect outliers. Together, with temperature and accelerometer variations, the anomaly detection provides a very promising insight into a patient’s physiological behavior and can be used as a viable metric to raise critical alarms for early detection. The data exploratory model can also be implemented on other datasets representing physiological features that help diagnose other diseases. COVID-19 must be taken seriously, and detailed clinical investigations must be performed for diagnosis. At the same time, a predictor, in the form of an early detection can raise critical alarms that can help for early screening and may prevent the disease spread.
Acknowledgement: The authors would like to thank Dr. Hayat Dino Bedru and Shirley S. T. Yeung for their extensive support during the critical review of this article.
Funding Statement: This work is sponsored by Universiti Sains Malaysia Research Grant: (RUI: 1001/PELECT/8014049).
Conflict of Interest: The authors declare that they have no conflicts of interest to report regarding the present study.
1. W. H. Organization, “Coronavirus Disease (COVID-19) Situation Report - 209”, World Health Organization, 2020. [Online]. Available: ailable: https://www.who.int/docs/default-source/coronaviruse/situation-reports/20200816-covid-19-sitrep-209.pdf?sfvrsn=5dde1ca2˙2]20200816-covid-19-sitrep-209.pdf?sfvrsn=5dde1ca2_2. [Google Scholar]
2. W. J. Guan, Z. Ni, Y. Hu, W. H. Liang, C. Q. Ou et al. “Clinical characteristics of Coronavirus disease 2019 in China,” New England Journal of Medicine, vol. 382, no. 18, pp. 1708–1720, 2020. [Google Scholar]
3. T. Singhal, “A review of Coronavirus disease-2019 (COVID-19),” Indian Journal of Pediatrics, vol. 87, no. 4, pp. 281–286, 2020. [Google Scholar]
4. D. Gennaro, F. Pizzol, D. Marotta, C. Antunes, M. Racalbuto et al., “Coronavirus diseases (COVID-19) current status and future perspectives: A narrative review,” International Journal of Environmental Research and Public Health, vol. 17, no. 8, pp. 2690–2701, 2020. [Google Scholar]
5. Z. Luo, M. J. Y. Ang, S. Y. Chan, Z. Yi, Y. Y. Goh et al., “Combating the Coronavirus pandemic: Early detection, medical treatment, and a concerted effort by the global community,” Research, vol. 2020, pp. 35, 2020. [Google Scholar]
6. H. A. S. Hashmi and H. M. Asif, “Early detection and assessment of Covid-19,” Frontiers in Medicine, vol. 7, pp. 311, 2020. [Google Scholar]
7. R. C. Deo, “Machine learning in medicine,” Circulation, vol. 132, no. 20, pp. 1920–1930, 2015. [Google Scholar]
8. J. F. Fieselmann, M. S. Hendryx, C. M. Helms and D. S. Wakefield, “Respiratory rate predicts cardiopulmonary arrest for internal medicine inpatients,” Journal of Genereal Internal Medicine, vol. 8, no. 7, pp. 354–360, 1993. [Google Scholar]
9. M. Cretikos, J. Chen, K. Hillman, R. Bellomo, S. Finfer et al., “The objective medical emergency team activation criteria: A case–control study,” Resuscitation, vol. 73, no. 1, pp. 62–72, 2007. [Google Scholar]
10. M. J. D. Griffiths, D. F. McAuley, G. D. Perkins, N. Barrett, B. Blackwood et al., “Guidelines on the management of acute respiratory distress syndrome,” BMJ Open Respiratory Research, vol. 6, no. 1, pp. 27, 2019. [Google Scholar]
11. G. Yuan, N. A. Drost and R. A. McIvor, “Respiratory rate and breathing pattern,” McMaster University Medical Journal, vol. 10, no. 1, pp. 23–28, 2013. [Google Scholar]
12. M. J. Tobin, T. S. Chadha, G. Jenouri, S. J. Birch, H. B. Gazeroglu et al., “Breathing patterns: 1. Normal subjects,” Chest, vol. 84, no. 2, pp. 202–205, 1983. [Google Scholar]
13. W. M. S. John and J. F. R. Paton, “Defining eupnea,” Respiratory Physiology & Neurobiology, vol. 139, no. 1, pp. 97–103, 2003. [Google Scholar]
14. D. W. Richter, “Commentary on eupneic breathing patterns and gasping,” Respiratory Physiology & Neurobiology, vol. 139, no. 1, pp. 121–130, 2003. [Google Scholar]
15. Y. Lei, B. Yang, X. Jiang, F. Jia, N. Li et al., “Applications of machine learning to machine fault diagnosis: A review and roadmap,” Mechanical Systems and Signal Processing, vol. 138, pp. 106587, 2020. [Google Scholar]
16. R. B. D. Santis and M. A. Costa, “Extended isolation forests for fault detection in small hydroelectric plants,” Sustainability, vol. 12, no. 16, pp. 16, 2020. [Google Scholar]
17. B. Rajoub, “Supervised and unsupervised learning,” in Biomedical Signal Processing and Artificial Intelligence in Healthcare, Chapter 3, 1st ed., Academic Press, 2020, pp. 51–89. [Google Scholar]
18. D. Dias and J. P. S. Cunha, “Wearable health devices–-vital sign monitoring, systems and technologies,” Sensors, vol. 18, no. 8, pp. 2414, 2018. [Google Scholar]
19. Statista, “Fitness wearables market outlook,” in Statista Research, 2020. [Online]. Available: https://www.statista.com/outlook/dmo/eservices/fitness/wearables/worldwide. [Google Scholar]
20. F. T. Liu, K. M. Ting and Z. H. Zhou, “Isolation forest,” in 2008 Eighth IEEE Int. Conf. on Data Mining, Pisa, Italy, pp. 413–422, 2008. [Google Scholar]
21. F. T. Liu, K. M. Ting and Z. H. Zhou, “Isolation-based anomaly detection,” ACM Transactions on Knowledge Discovery from Data, vol. 6, no. 1, pp. 1–39, 2012. [Google Scholar]
22. W. Taylor, Q. H. Abbasi, K. Dashtipour, S. Ansari, S. A. Sha et al., “A review of the state of the art in non-contact sensing for COVID-19,” Sensors, vol. 20, no. 19, pp. 5665, 2020. [Google Scholar]
23. C. Massaroni, A. Nicolo, D. L. Presti, M. Sacchetti, S. Silvestri et al., “Contact-based methods for measuring respiratory rate,” Sensors, vol. 19, no. 4, pp. 908, 2019. [Google Scholar]
24. S. Hyun, P. Kaewprag, C. Cooper, B. Hixon, and S. Moffatt-Bruce, “Exploration of critical care data by using unsupervised machine learning,” Computer Methods and Programs in Biomedicine, vol. 194, pp. 105507, 2020. [Google Scholar]
25. N. Krishnan and V. Marivate, “Unsupervised anomaly detection of healthcare providers using generative adversarial networks,” in Responsible Design, Implementation and Use of Information and Communication Technology: Lecture Notes in Computer Science, vol. 12066, pp. 419–430, 2020. [Google Scholar]
26. P. Karczmarek, A. Kiersztyn, W. Pedrycz and E. Ali, “K-Means-based isolation forest,” Knowledge-Based Systems, vol. 195, pp. 105659, 2020. [Google Scholar]
27. A. Farzad and T. A. Gulliver, “Unsupervised log message anomaly detection,” ICT Express, vol. 6, no. 3, pp. 229–237, 2020. [Google Scholar]
28. M. Hauskrecht, I. Batal, M. Valko, S. Visweswaran, G. F. Cooper et al., “Outlier detection for patient monitoring and alerting,” Journal of Biomedical Informatics, vol. 46, no. 1, pp. 47–55, 2013. [Google Scholar]
29. S. H. Kim, Z. W. Geem and G. T. Han, “A novel human respiration pattern recognition using signals of ultra-wideband radar sensor,” Sensors, vol. 19, no. 15, pp. 3340, 2019. [Google Scholar]
30. Y. Wang, M. Hu, Y. Zhou, Q. Li, N. Yao et al., “Unobtrusive and automatic classification of multiple people’s abnormal respiratory patterns in real time using deep neural network and depth camera,” IEEE Internet of Things Journal, vol. 7, no. 9, pp. 8559–8571, 2020. [Google Scholar]
31. K. McClure, B. Erdreich, J. H. Bates, R. S. McGinnis, A. Masquelin et al., “Classification and detection of breathing patterns with wearable sensors and deep learning,” Sensors, vol. 20, no. 22, pp. 6481, 2020. [Google Scholar]
32. Espressif Systems, “ESP-WROOM-02D/02U”, 2018. [Online]. Available: https://www.espressif.com/sites/default/files/documentation/esp-wroom-02u_esp-wroom-02d_datasheet_en.pdf. [Google Scholar]
33. Melexis Systems, “MLX90614-A digital contactless infrared thermometer”, 2018. [Online]. Available: https://www.melexis.com/-/media/files/documents/datasheets/mlx90614-datasheet-melexis.pdf. [Google Scholar]
34. S. T. Microelectronics, “LSM303DLHC-3D digital linear acceleration sensor”, 2018. [Online]. Available: https://www.st.com/resource/en/datasheet/DM00027543.pdf. [Google Scholar]
35. P. D. Hung, S. Bonnet, R. Guillemaud, E. Castelli and P. T. N. Yen, “Estimation of respiratory waveform using an accelerometer,” in 2008 5th IEEE Int. Symp. on Biomedical Imaging: From Nano to Macro, pp. 1493–1496, 2008. [Google Scholar]
36. T. P. Dence and J. B. Dence, “A Survey of Euler’s Constant,” Mathematics Magazine, vol. 82, no. 4, pp. 255–265, 2009. [Google Scholar]
 | This work is licensed under a Creative Commons Attribution 4.0 International License, which permits unrestricted use, distribution, and reproduction in any medium, provided the original work is properly cited. |