DOI:10.32604/cmc.2021.018427
| Computers, Materials & Continua DOI:10.32604/cmc.2021.018427 | |
| Article |
Resource Assessment of Wind Energy Potential of Mokha in Yemen with Weibull Speed
1Department of Electronic Engineering, Faculty of Engineering, University of Science and Technology UST-Sana’a, Yemen
2Department of Computer Science, King Khalid University, Muhayel Aseer, Kingdom of Saudi Arabia
3Faculty of Computer and IT, Sana’a University, Sana’a, Yemen
4Department of Electronic, Faculty of Engineering, UST, Sana’a, Yemen
5Department of Information Systems, King Khalid University, Mayahel Aseer, KSA
6Department of Computer Science, King Khaled University, KSA & Faculty of Computers and Information, Menoufia University, Egypt
7Department of Computer Science, King Khaled University, KSA & Faculty of Science, Department of Mathematics and Computer Science, Menoufia University, Egypt
*Corresponding Author: Fahd N. Al-Wesabi. Email: falwesabi@kku.edu.sa
Received: 07 March 2021; Accepted: 08 April 2021
Abstract: The increasing use of fossil fuels has a significant impact on the environment and ecosystem, which increases the rate of pollution. Given the high potential of renewable energy sources in Yemen and other Arabic countries, and the absence of similar studies in the region. This study aims to examine the potential of wind energy in Mokha region. This was done by analyzing and evaluating wind properties, determining available energy density, calculating wind energy extracted at different altitudes, and then computing the capacity factor for a few wind turbines and determining the best. Weibull speed was verified as the closest to the average actual wind speed using the cube root, as this was verified using 3 criteria for performance analysis methods (
Keywords: Wind energy system; probability density; wind speed; Weibull velocity; Rayleigh velocity; wind rose
The increase in population and rate of industrialization has led to a rise in energy demand. Fossil fuels cannot meet this demand because they negatively affect the environment and ecosystem, causing a significant increase in pollution. In other words, the energy industry and the environment are in significant crises today. Today in modern societies, energy is the most important indicator of economic growth and many countries worldwide are taking steps toward achieving a renewable energy model to solve this crisis [1,2]. Renewable energy sources such as solar, thermal, geothermal, bioenergy, hydropower, and ocean have gained popularity all over the world due to their distinct characteristics. Simultaneously, the increasing use of fossil fuels and the resulting environmental pollution has motivated researchers to find other sustainable, clean, efficient, and economical energy sources. Wind power systems are known to operate on a wind speed system. In 2800 BC, wind energy was used to pump water and generate power in rural areas. Wind energy is used today as an alternative source of energy [3,4].
As seen in literature [5–9] and in various places around the world, great emphasis has been placed on the Weibull function because it is suitable for wind speed data analysis. It is also useful for distributing large statistical data and is presented as a continuous distribution for further analysis. Some literature [10–18] are related to renewable energy in the Republic of Yemen, despite the scarcity of that literature due to a similar study for this region. Geographically, Yemen is located between latitude 13 north and 16 norths and longitude 43.2–53.2 in southwestern Asia. The Red Sea surrounds it from the west and the Indian Ocean (Arabian Sea) from the south. The total area of Yemen is 527.970 km2, and as of 2016, the population was about 26,687,000 people. Yemen has a high potential for renewable energy sources such as solar, wind, and geothermal energy [19–21].
In 2009, the Yemeni government approved the National Renewable Energy and Efficiency Strategy, which aims to increase 15% of energy efficiency (EE) in the energy sector by 2025, and target renewable energy (RE) capacity (Geothermal energy 160 megawatts, concentrated solar power 100 megawatts, solid biomass 6 megawatts, solar photovoltaic system 8.25, and wind power 400 megawatts) of total electricity by 2025. The Yemeni energy sector consists of oil, natural gas, and biofuel production. Energy production in 2012 was “15.109 kilotons of oil equivalent (ktoe), while consumption was 6,923 kilotons” [22–24].
The objective of this study is divided into three parts are: to find a probability distribution function that gives the best estimate of annual wind energy and is close to the actual value of this energy. Using the wind rose chart, the prevailing wind direction during the seasons of the year is determined at the study site. Study the characteristics of the three classes of wind turbines, calculate the capacitance factor for each of them, and determine the most appropriate class for the study site.
The rest of the paper has four more sections. Section 2 provides the methodology. Section 3 provides the basic calculations of the proposed system model. Section 4 presents the results and discussion, and Section 5 offers conclusions.
The research consists of two main parts, and each section consists of its own parts. In the first section, the statistical analysis of the measured wind speed data from the OYMK monitoring station was performed at a height of 3 m in the MOKHA area for five years (2011 to 2015), and these speeds will be converted to be suitable for wind turbine heights of 30 and 100 m.
Since the statistical values of wind speed measurements do not express the power that can be derived from these measured speeds, so the probability distribution functions that help us in evaluating wind energy from the statistical values of wind speed will be used only (without knowing the measured values).
To demonstrate the accuracy of the work of these functions, the cubic statistical values of wind speeds will be calculated and the actual power values compared to the power evaluated by the probability distribution functions, where the most used functions for the probability distribution of the wind speed measured at a given location are the Weibull and Rayleigh distributions.
In the second section, power factors for the three popular classes of rated wind turbines according to the International Electrotechnical Commission (IEC) were calculated, and the wind rose analysis was made in order to determine the most appropriate direction for steering the turbine. Also, in this section, the amount of energy that can be harvested during the year with one turbine with a rated capacity of 3450 kilowatts will be calculated, and the amount of energy required to meet the needs of Mokha region will be determined.
3 Basic Calculations of the Proposed System Model
The Mokha region is located at longitude 43°16′60′ east and latitude 13°19′0′ north. It overlooks the Red Sea in southwestern Yemen and is 75 km north of Bab al-Mandab, 100 km west. The city of Taiz, and 170 km south of Hodeidah. The OYMK monitoring station is located 8 km south of Mokha, at a longitude 43°16′60″ east and 13°15′00″ north latitude, at a height of 3 m from the ground. The location of the OYMK monitoring station and the distance between it and Mocha. Tab. 1 shows the most recent observation of this city, while Tab. 2 shows the administrative division of this city, where we note in order to provide a wind power generation system for 1447 houses, comprising 1452 households with 10428 residents. Tab. 1 show the most recent observation for Mokha.
Table 1: The most recent observation for Mokha region
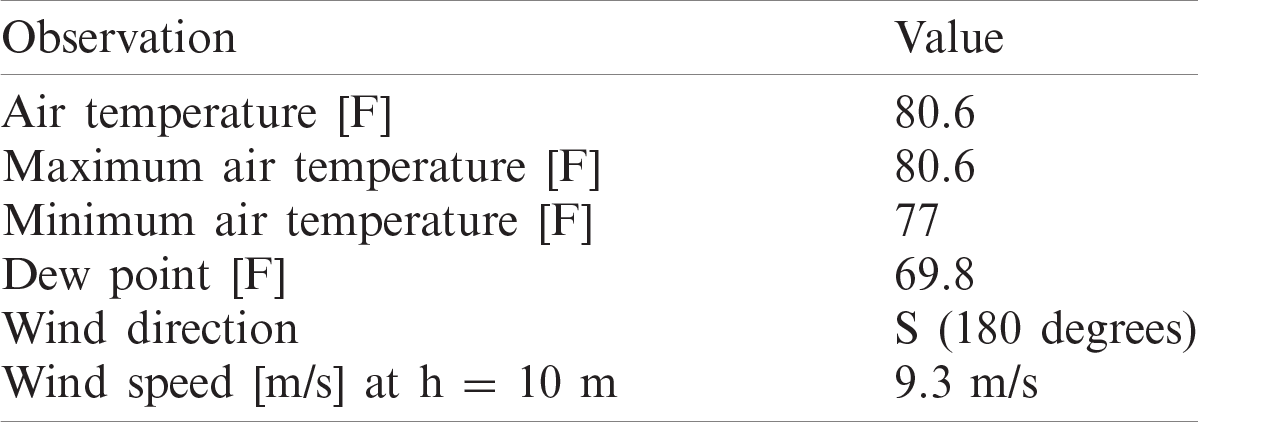
Table 2: The statistical values of wind speed measured by OYMK station at h=3m
3.2 Data Collection and Validation
In this study, environmental data available on the Iowa Environmental Mesonet (IEM) was analyzed. IEM collects environmental data from cooperating members with observing networks. The data are stored and made available on the website [24].
The data analyzed are wind data extracted from the integrated surface database (ISD) of the OYMK monitoring station, and the data block consisted of 16315 wind speed measurements on an hourly head (between August 23, 2011 and March 18, 2015), and the largest measured value was wind speed It is 92 m/s while the lowest value is 0.52 m/s, and the temperature ranged between 0○ and 380. We note also that the data for the years 2011 and 2015 are incomplete.
In order to simplify the analysis, these data were summarized by calculating the average value for each day and we reduced the data block to 1,221 average daily wind speed.
3.3 Estimation of Weibull/Rayleigh Parameters
The probability density function of a Weibull distribution can be expressed as given in Eq. (1).
The cumulative distribution function of a Weibull distribution is expressed by the integration of the probability density function as given in Eq. (2).
As the two parameters of the Weibull distribution are shape factor
The Rayleigh distribution is a special case of a Weibull distribution with the shape parameter value of the constant
The mean value of wind speed
Sometimes two wind amplitudes should be taken seriously to assess the wind energy potential of a site, namely the most probable wind speed
The arithmetic statistics express the mean value and the standard deviation of the wind speed measured as given by Eq. (14).
However, because the energy extracted from the wind is proportional to the cube of the wind speed and not with the speed itself, it is better to use cubic statistics. Cubic statistics express the mean value and standard deviation of a cube of wind speed measured as given by Eq. (15).
where
In order to determine the performance of the Weibull and Rayleigh models a quantitative evaluation of the performance of these models must be made. There are different methods of evaluation are Coefficient of determination, Root mean square error (RMSE), and Coefficient of efficiency (COE).
3.5.1 Coefficient of Determination (
3.5.2 Root Mean Square Error (RMSE)
RMSE verifies the accuracy of the model by checking the value obtained by the probability distribution function and the raw data measured. The lower the RMSE, the better the probability distribution function. RMSE ranges from
3.5.3 Coefficient of Efficiency (COE)
Another way to check the efficiency of a probability distribution function is to use the Coefficient of efficiency COE. The closer the value of COE to the value of the integer one, the better the accuracy of the efficiency of the probability distribution function, COE is calculated using Eq. (18).
where
Power density assessment is of primary importance in assessing wind energy in a given region. The density of wind power depends on the density of the air
The power density can also be evaluated using the probability distribution functions as given by Eqs. (20) and (21), which help us to do so by knowing the mathematical statistics of wind speed without referring to the measured wind speeds, as we will notice in the results section.
Where
3.7 Extrapolation of Wind Speed at Different Axis Height
The observed data used in this study were measured at a height of 3 m. whereas most trade wind turbines have different hub heights ranging from 30 m to more than 100 m. Hence, Hillman’s exponential law was used to extrapolate the wind speed data to the appropriate height for our study (100 m) as shown in Eq. (22).
where
The monthly energy index values for all sites are generally in the Mokha region less than
Estimation of Capacity Factor (CF)
The capacity factor is an important parameter for selecting a suitable wind turbine for the studied site, and is defined as the ratio of the average power output
The capacitance factor can also be calculated by Eq. (24).
where
Given the value of the capacity factor, the estimated value that a turbine with rated power
4.1 Monthly and Annual Mean Wind Speed
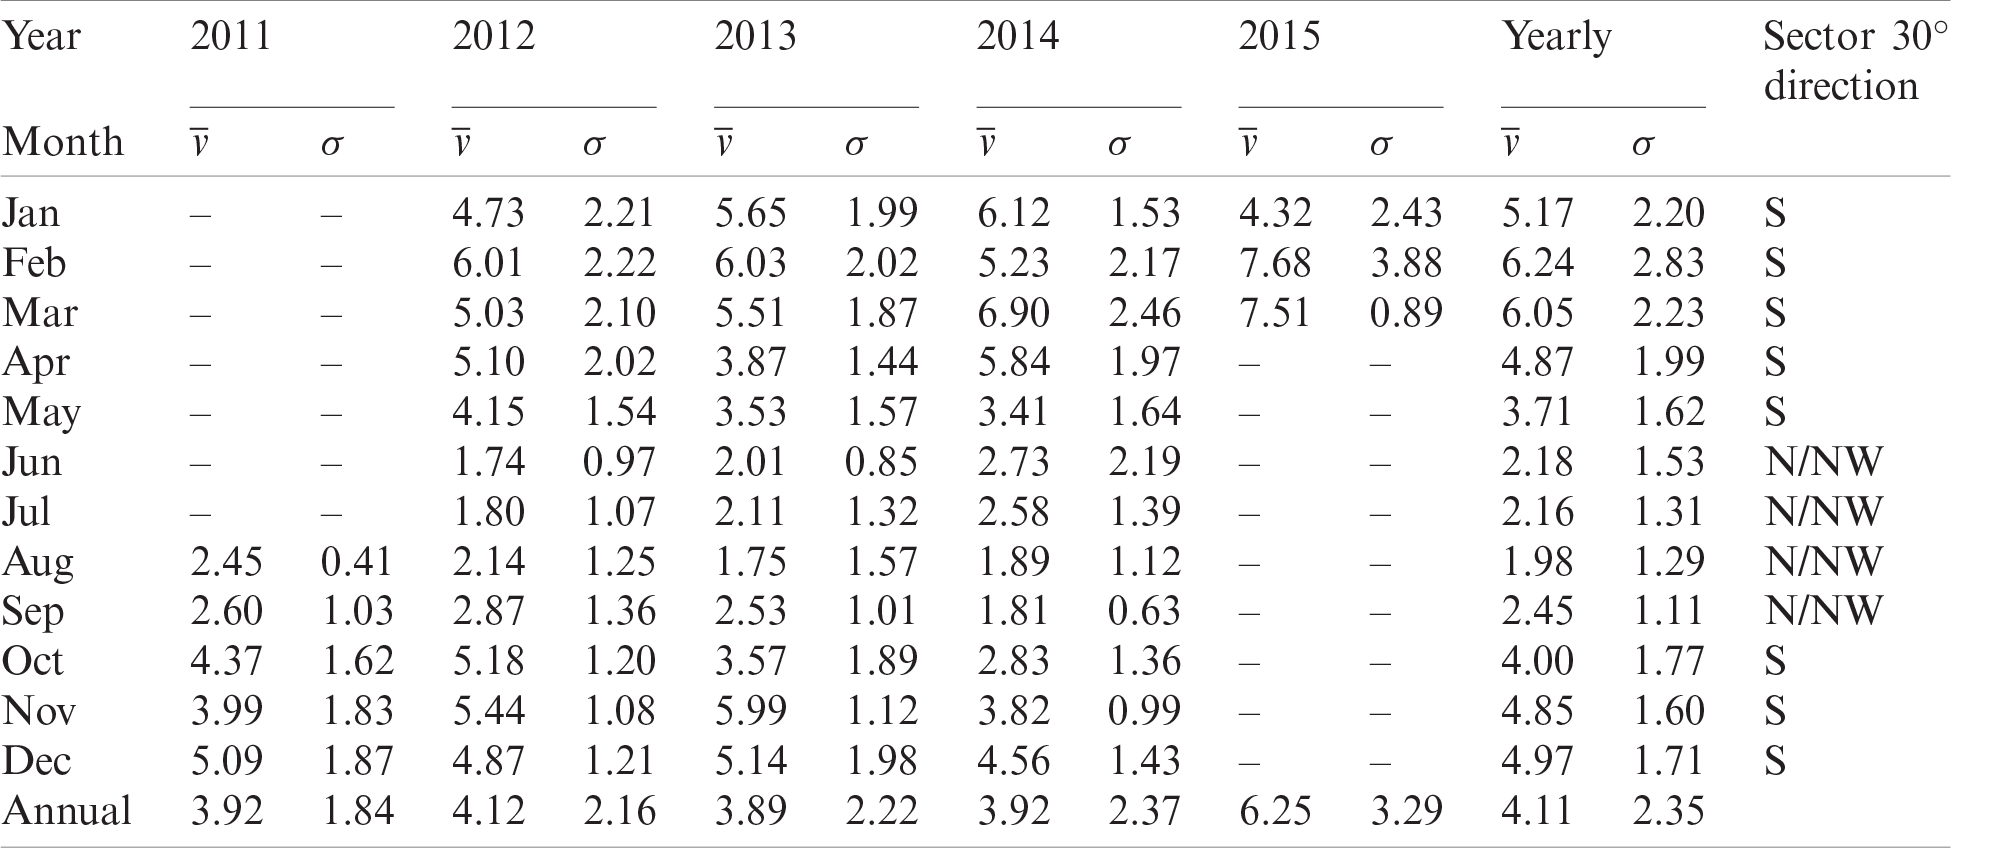
The arithmetic Statistics of the speeds measured at a height of 3 m are shown in Tab. 3, and we note that the data for the years 2011 and 2015 are incomplete. Therefore, the monthly statistical values were calculated from the available measurements in each year, while the annual statistics were calculated from the total sum of the data block values of 1221 values, and the last three columns in the table will be focused. Fig. 1 shows the average wind speed in the study area for five years (2011 to 2015) at a height of 3 m for a period of twelve months.
It is evident from Fig. 1 and the last three columns of Tab. 2 that the average wind speed values are large and southerly over a period of 8 continuous months starting in October and ending in May of the following year, which are the months of autumn, winter and spring. In the summer months of June, July and August, the values of average wind speed are low and northwesterly. This facilitates a mechanism for selecting the type and destination of the wind turbine.
In this study, the cubic statistics of the measured wind speed were also calculated using Eq. (15) in order to calculate the wind power density that is directly proportional to the cube of the wind speed and not with the speed itself. Tab. 3 shows the monthly and yearly arithmetic and cubic statistics, where the
Table 3: The monthly and yearly arithmetic and cubic statistics at h = 3m
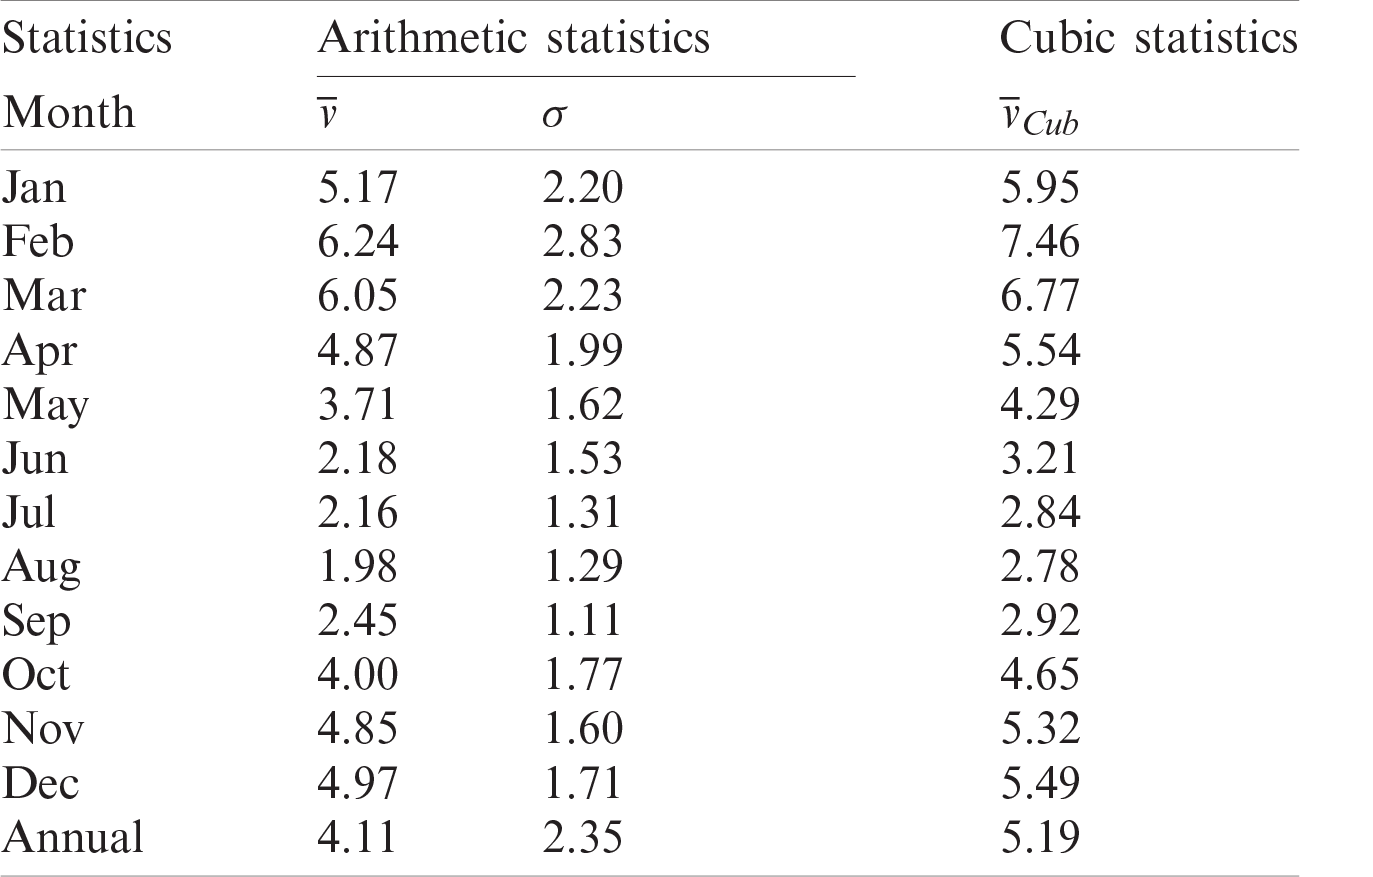
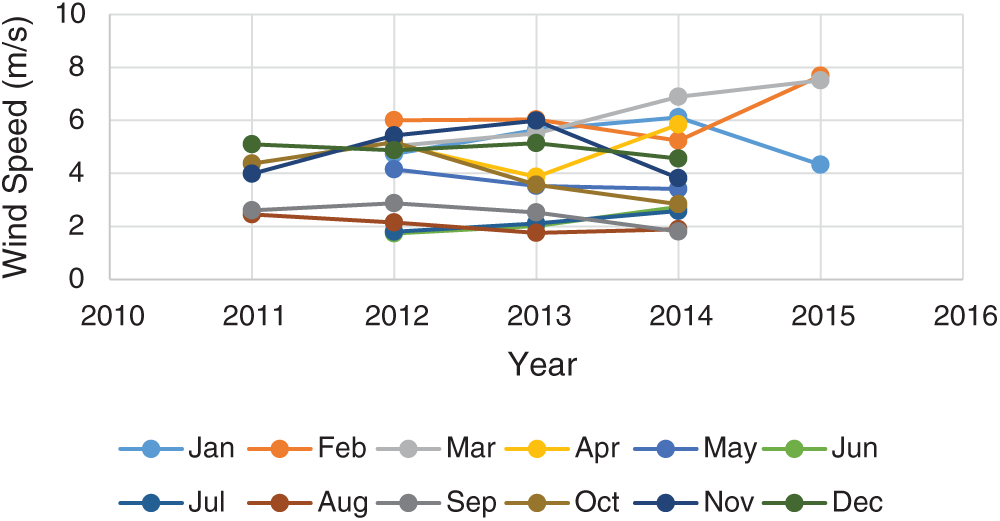
Figure 1: Average wind speed in OYMK for five years (2011 to 2015) at h = 3 m
Weibull and Rayleigh's parameters are computed for monthly and yearly arithmetic statistics using Eqs. (3), (4), and (7) above. Tab. 4 shows the values of these parameters. Figs. 2 and 3 show the probability and cumulative distribution of the actual wind speed, and the probability and cumulative distribution of Weibull and Rayleigh's functions based on their parameters calculated based on arithmetic statistics. it is noted from these figures that these probability and cumulative distributions of the Weibull function are more closely related to the probability and cumulative distribution of the actual values.
Table 4: The monthly and yearly arithmetic and cubic statistics at h = 3 m
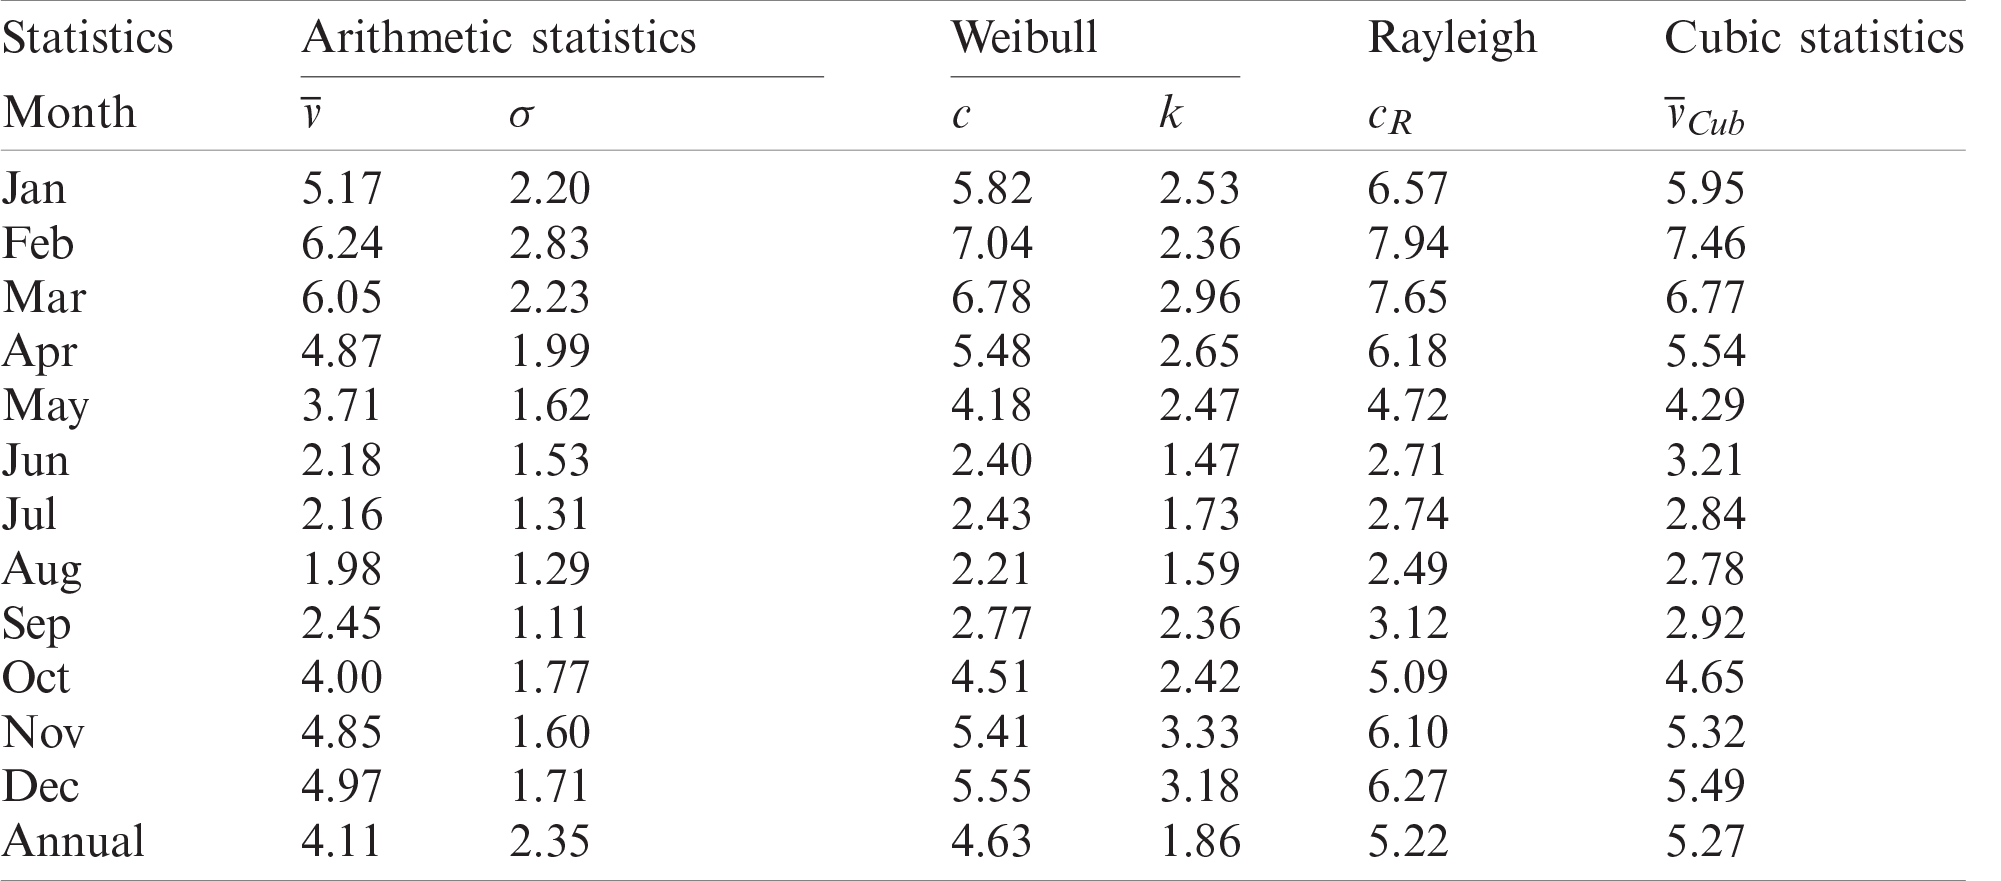
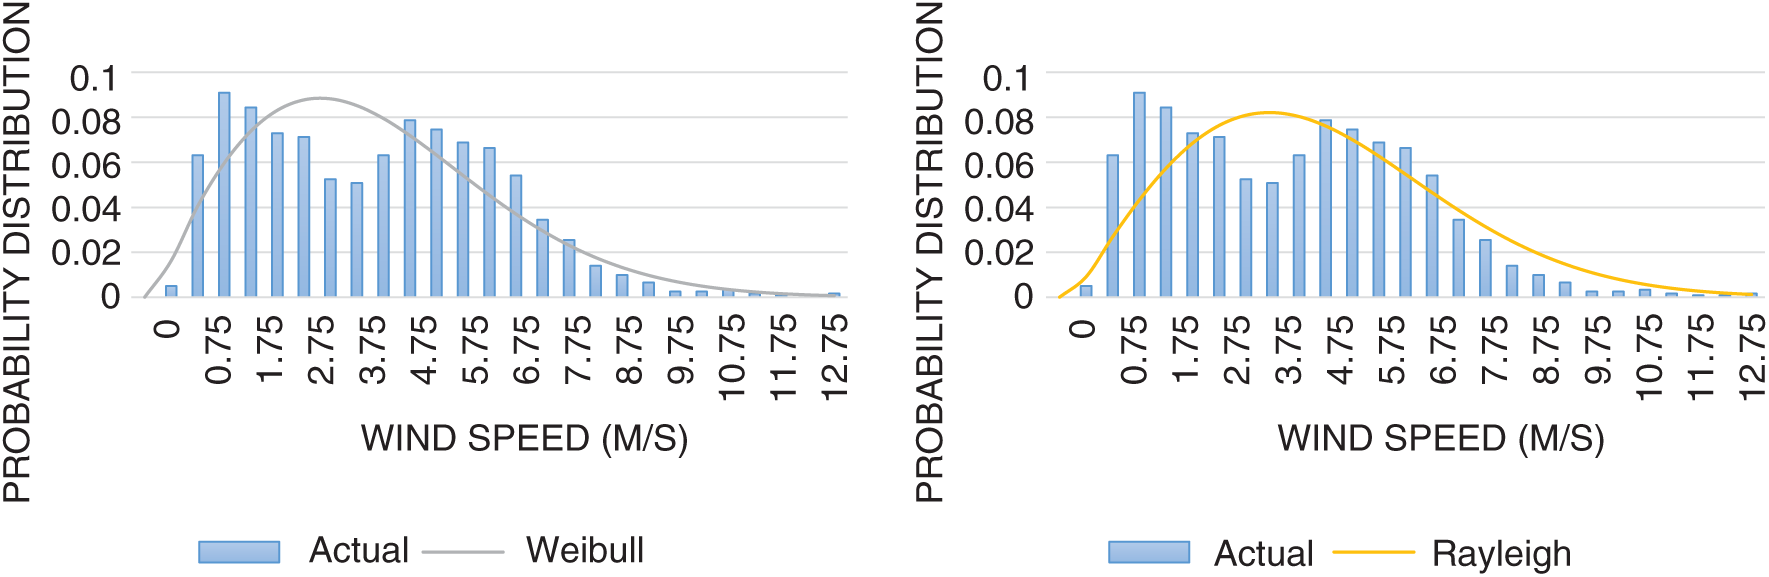
Figure 2: Probability distribution of the actual with (a) Weibull function (b) Rayleigh function
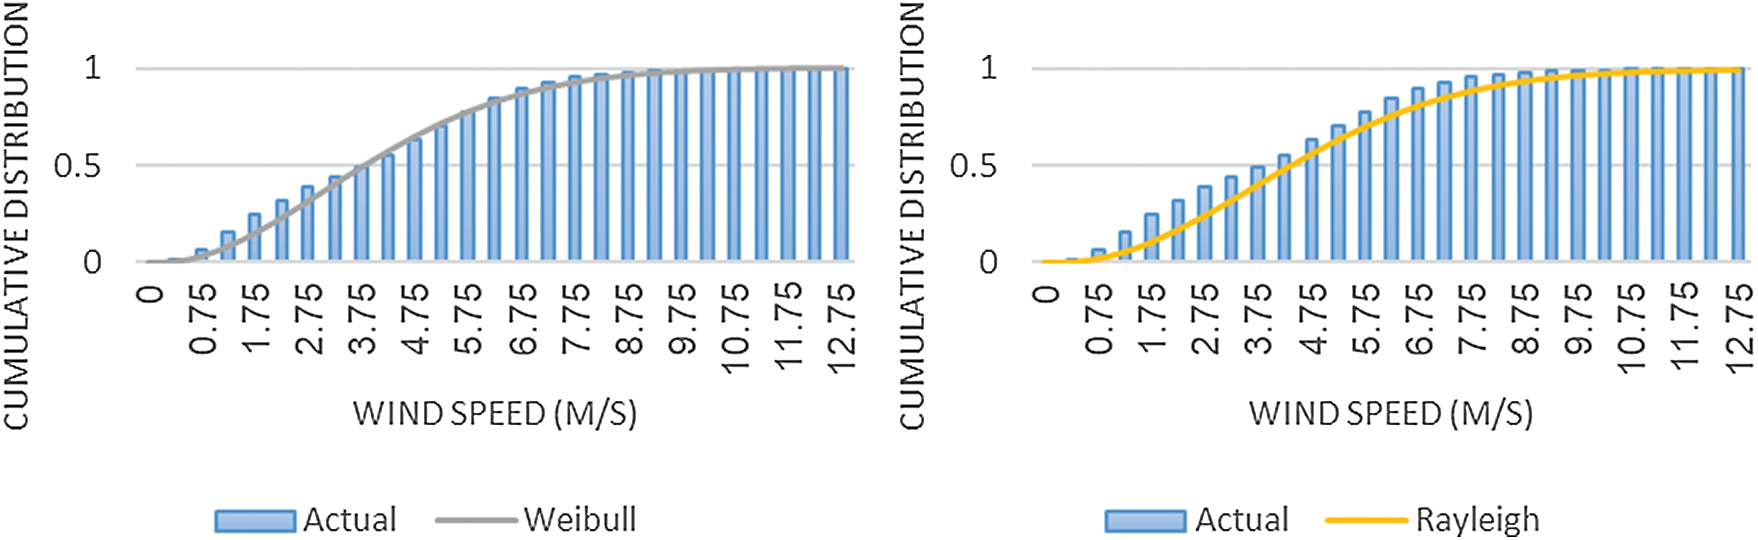
Figure 3: Cumulative distribution of the actual with (a) Weibull function (b) Rayleigh function
The evaluation of wind resources includes the calculation of the power density generated by the wind at the study site by Eq. (19) above, after calculating the statistics at different heights with Eq. (22) above, and includes the evaluation of the power density using the Weibull and Rayleigh probability distribution functions according to Eqs. (20) and (21) above. In evaluating wind resources also, the wind rose analysis is very important to calculate wind power density.
4.3.1 Evaluation of Power Density
The wind power density is directly proportional to the cube of the wind speed according to the relation 19, so the process of calculating the power density from arithmetic statistics for measurements of the wind speed
If
Table 5: Calculation and evaluation of power density at h=3m
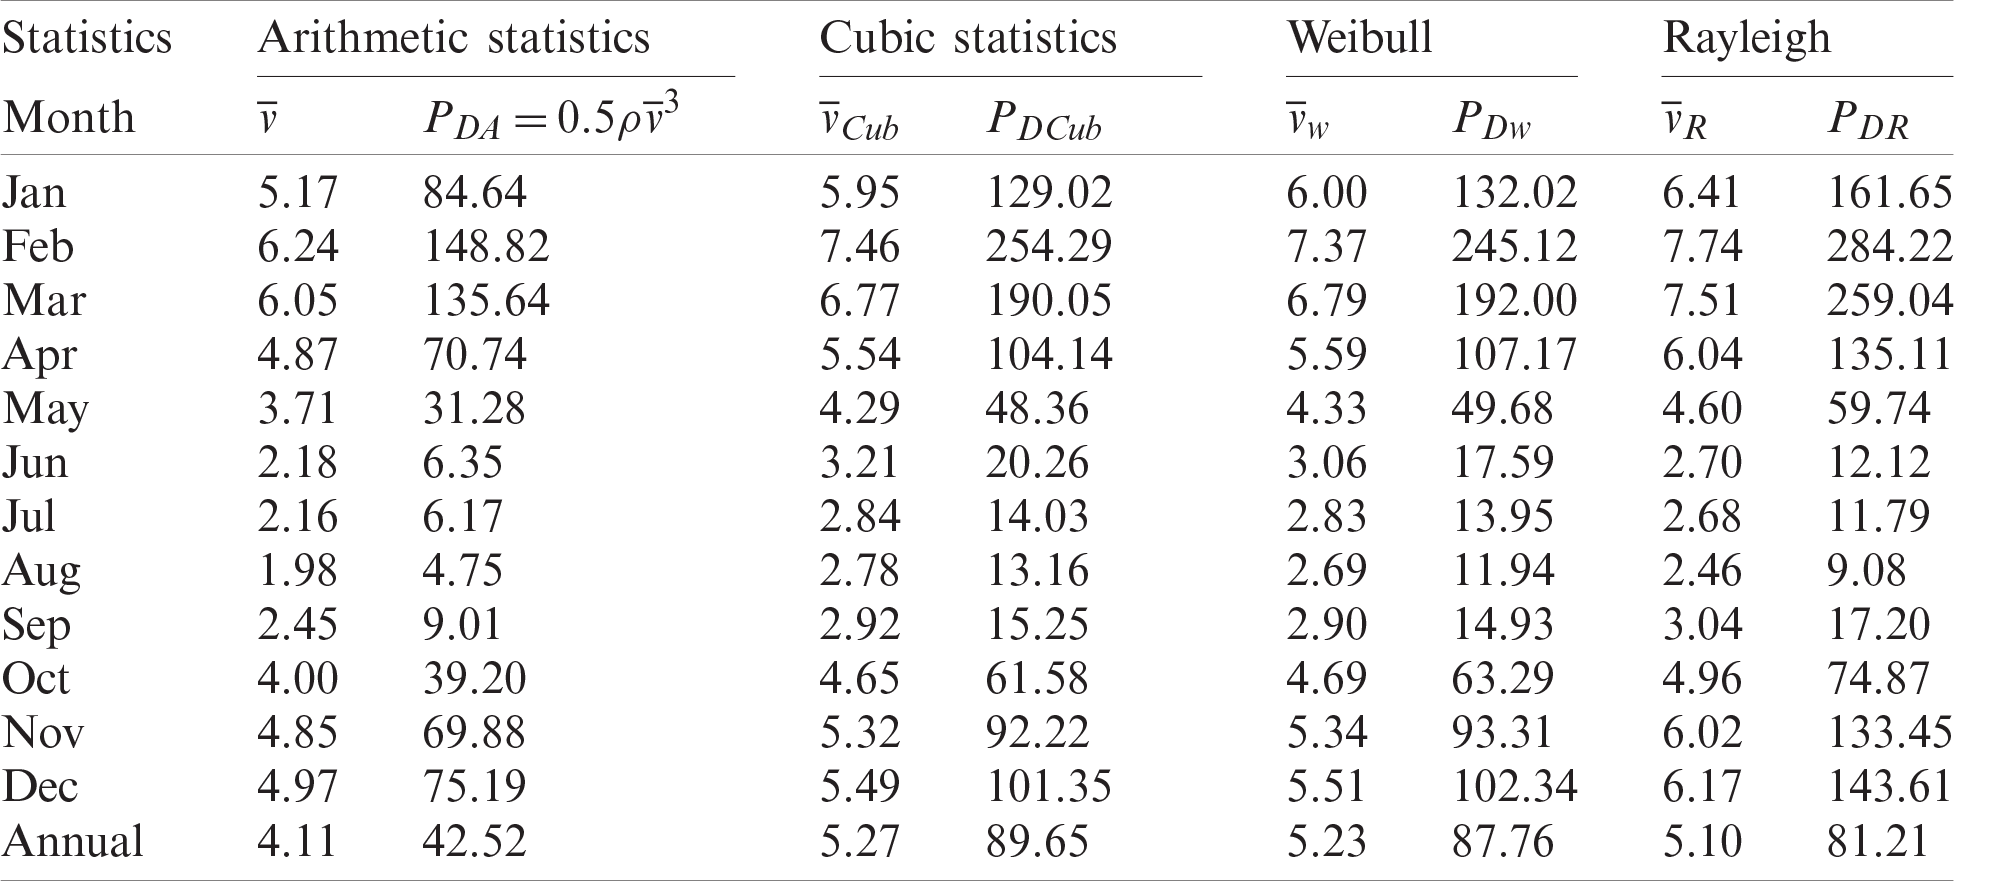
Fig. 4 shows a monthly, annually, clear comparative of Weibull speed
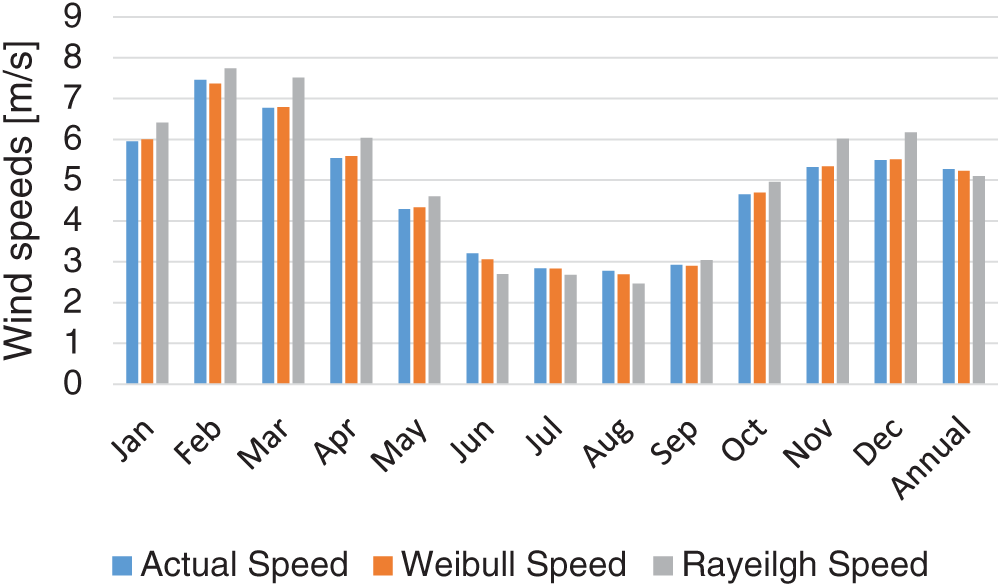
Figure 4: Weibull, Rayleigh, and Cube root of mean wind speeds at h = 3 m
Fig. 5 also shows the other comparative of the actual power density
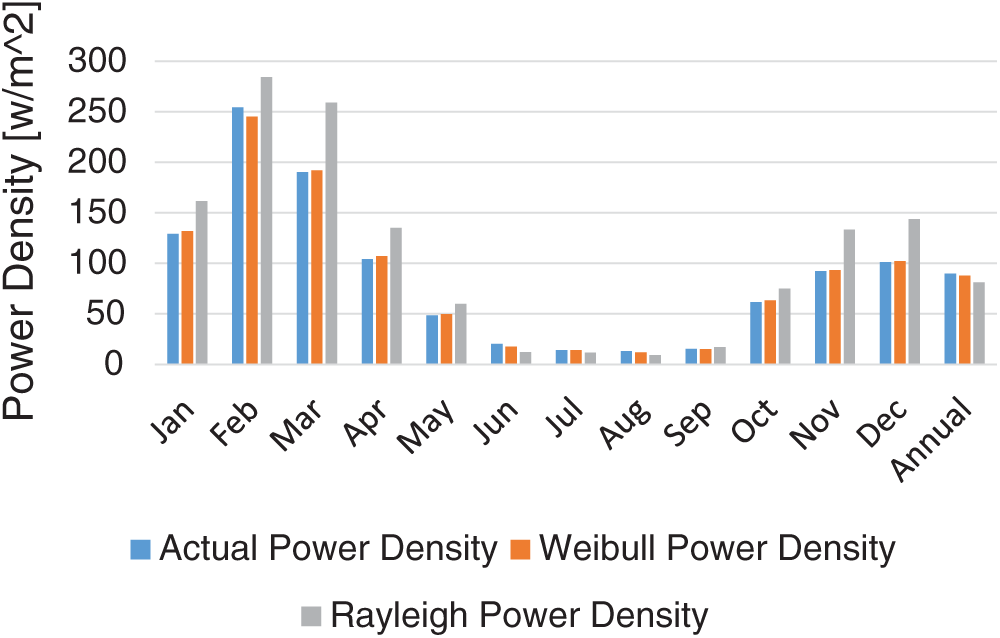
Figure 5: Weibull, Rayleigh, and actual power density at h = 3 m
For further verification, the performance analysis methods are computed according to Eqs. (16)–(18) above as shown in Tab. 6.
Table 6: Results of performance analysis methods
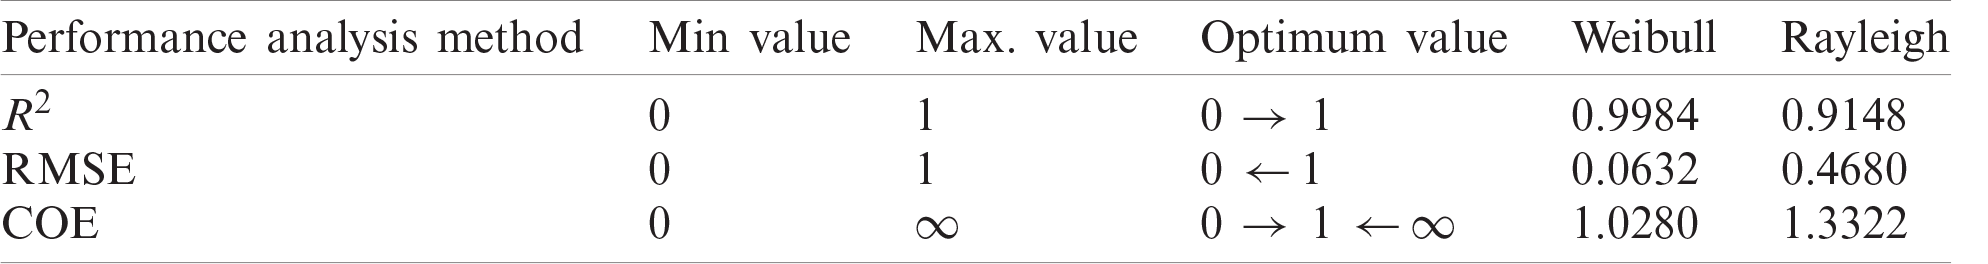
Tab. 6 shows the result of using three performance analysis methods to compare the performance of the Weibull and Rayleigh probability distribution functions in calculating wind power density based on the arithmetic statistics of wind speed
Since the height of the tower in the wind turbine ranges between 30 and 100 m, we should use Hellman’s exponential law (Eq. (22) above) to calculate the annual power density at these heights as shown in Tab. 7. Fig. 6 illustrate the conversion results as follows considering α = 0.19.
Table 7: Power density at 3, 30, 50 and 100 m
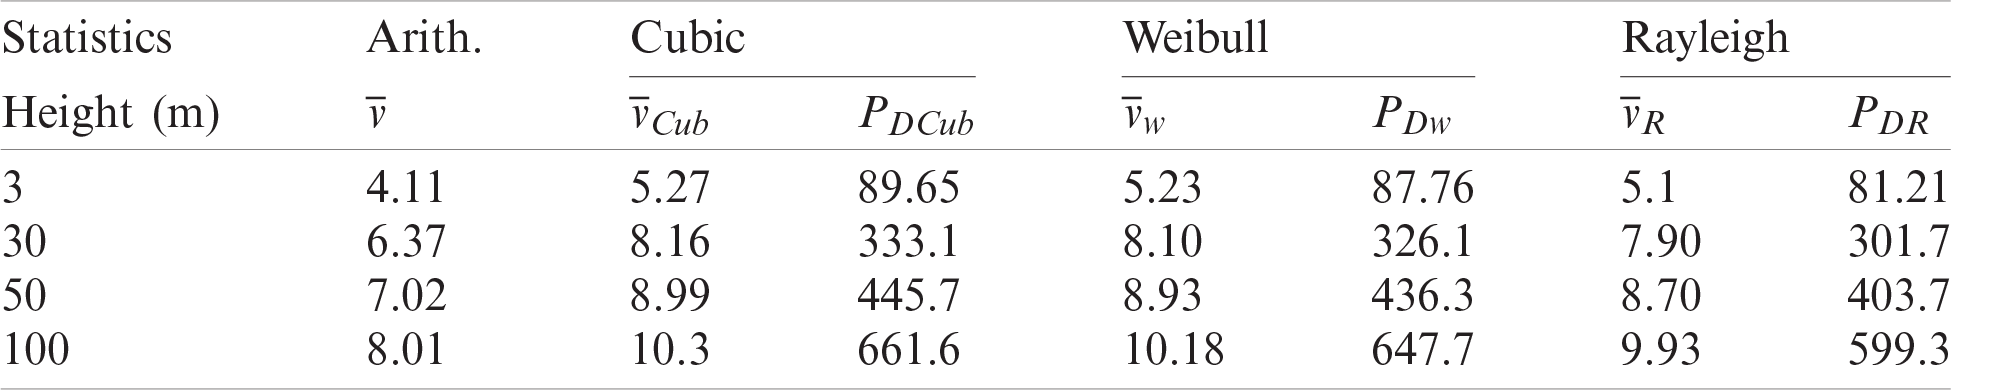
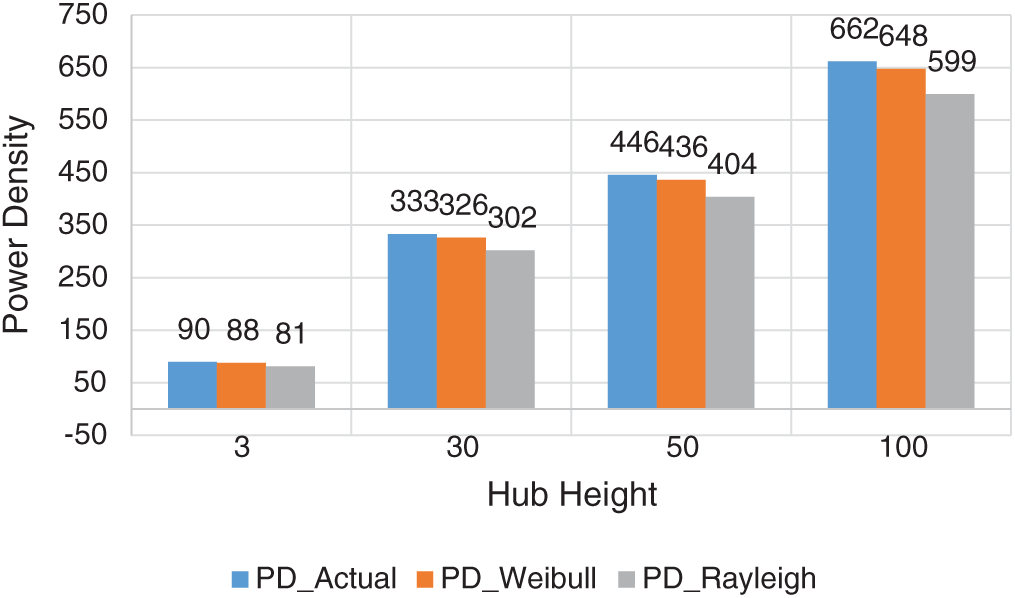
Figure 6: Power density at 3, 30, 50 and 100 m
Wind direction analysis is very important to calculate wind power density. In previous studies, the wind rose diagram was very popular to know the direction of the wind, and from this analysis, it is possible to know the direction in which the maximum wind energy can be generated. Returning to Tab. 2, we notice that the prevailing direction of the wind is the south direction. Fig. 7 shows the wind rose diagram. For the study site at a height of 3 m. Tab. 8 shows the exact values for this scheme. The chart and table were extracted from a university site where the wind rose diagram was divided into sections of 30 degrees. The wind direction did not change with altitude.
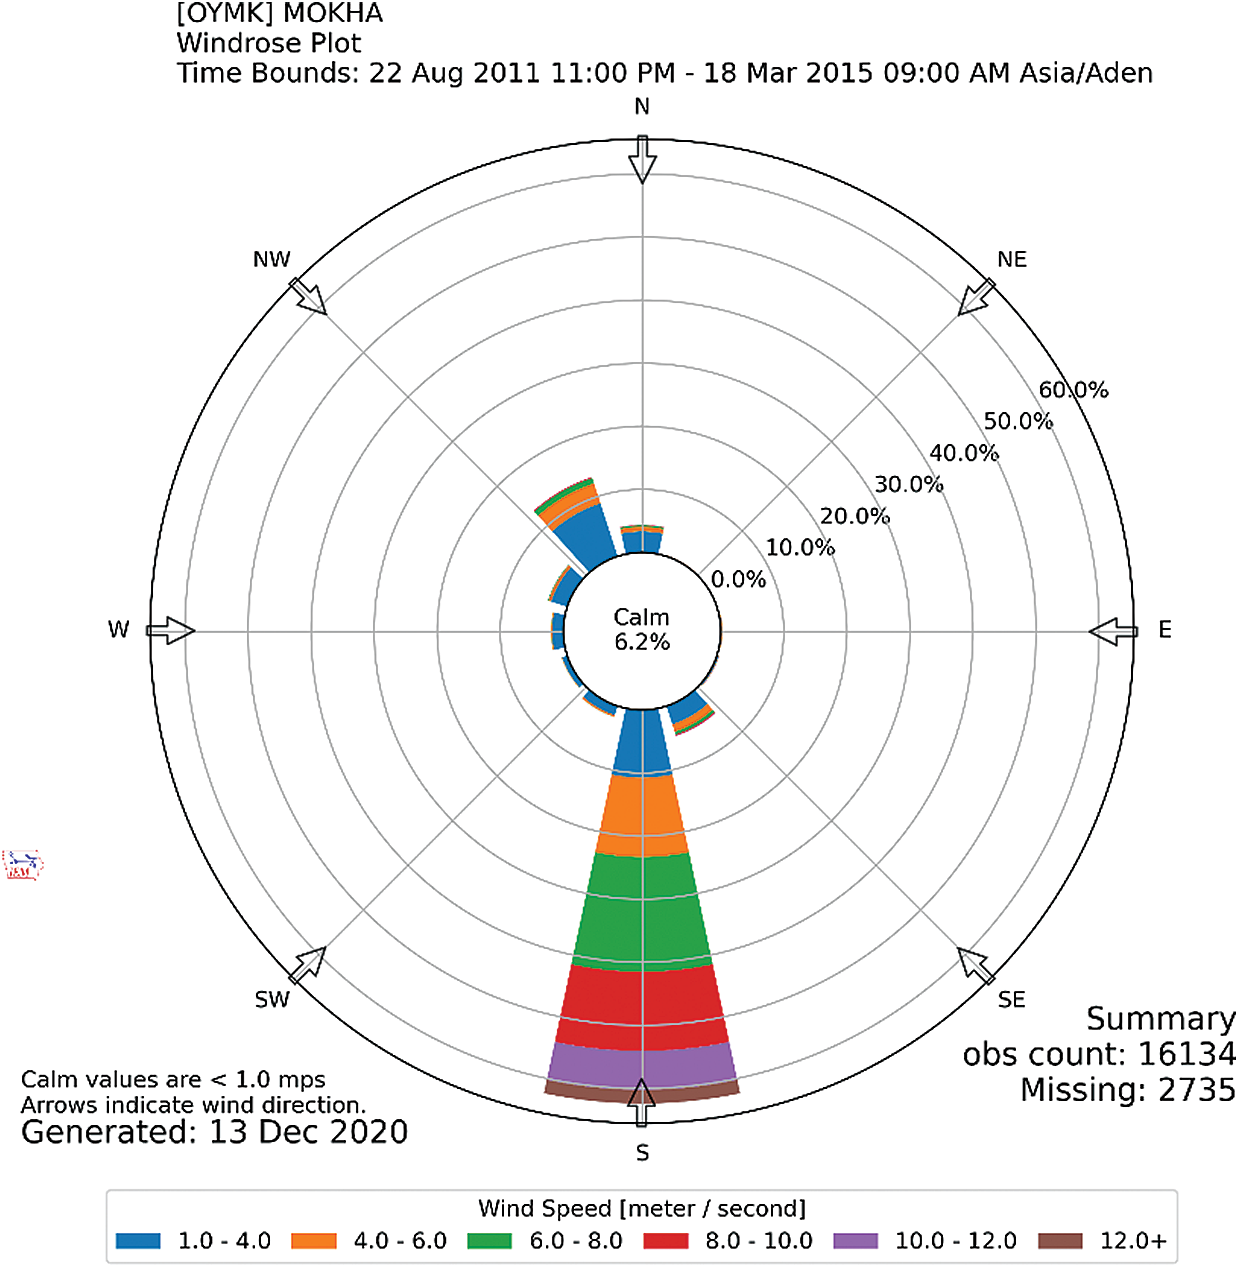
Figure 7: The wind rose diagram
Table 8: The exact values for wind rose at h = 3 m
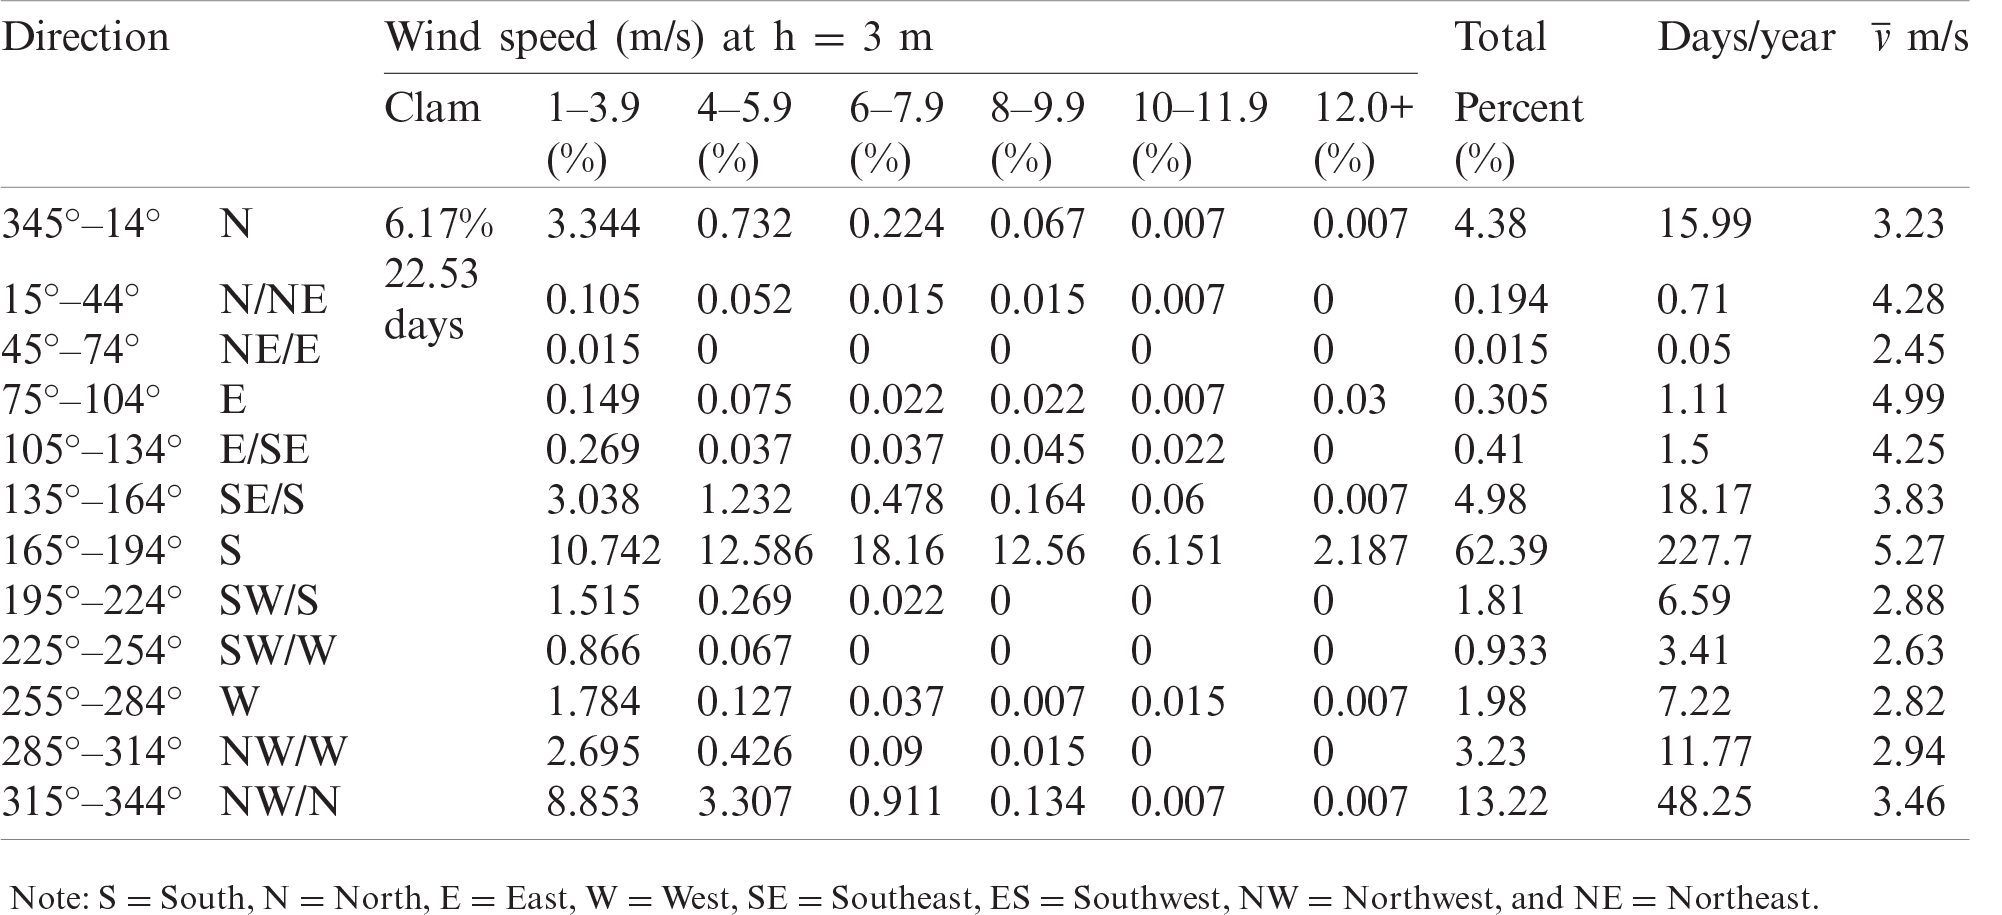
It is evident from Fig. 7 and Tab. 8 that the winds blow most days of the year as the rate of calm in wind speed reached 6.17%, which equates to only 23 days per year, and it is noted that the direction of the south is the best direction that the turbine can be directed to. The speed of the southern winds reached 62.39% of the annual average of wind speeds, as these winds blow on 227 days out of 365 days a year, which are mostly in eight months of the year (from October to May next year).
The average value of the speed of the south wind during this period is equal to 5.27 m/s at a height of 3 m, so the direction of the south is the direction chosen in this study.
4.4 Choosing the Appropriate Turbine for the Study Site
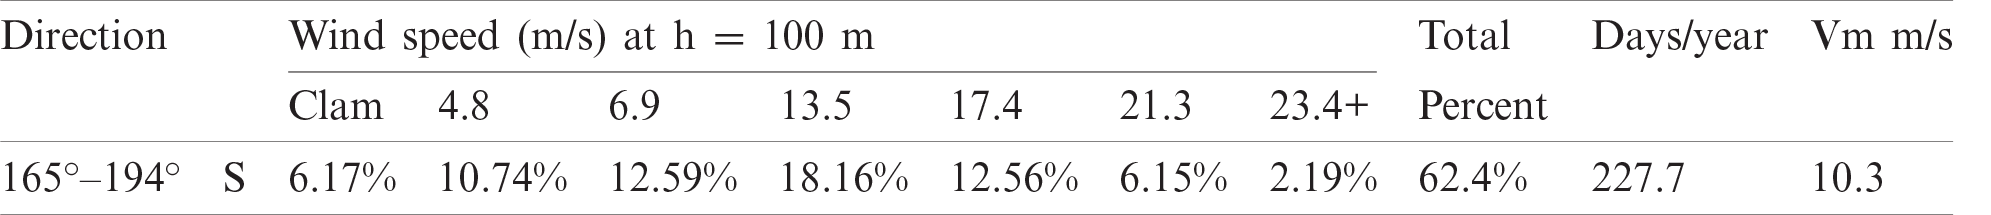
The proposed turbine capacity is a turbine with a capacity of 3.45 Mw, as one turbine is sufficient to meet the basic needs of 1452 homes in Mokha region, and since the height of the tower is 100 m, we should use Hellman’s exponential law (Eq. (22) above) to calculate the average wind speed at this height as shown in Tab. 9.
Table 9: The exact values for wind rose in south direction and h = 100 m
Wind energy is harvested in the turbine between the cut-in speeds and the cut-off, which means that the efficient wind speeds that could be used to generate power fall between these two values. The analysis is based on the cut-in and cut-off speeds of the wind turbine.
The IEC has classified wind turbines into three classes. Tab. 10 shows the characteristics of each class.
In this study, the capacity factor was calculated using Eq. (25). Tab. 10 and Fig. 8 show the values of the capacity factor for each class of turbine at the study site.
It is noticeable that Class 3 turbines have the largest capacity parameter, which makes them the best choice, but there are other criteria that must be met to choose the turbine besides the capacity factor standard.
Table 10: The IEC classified of wind turbines
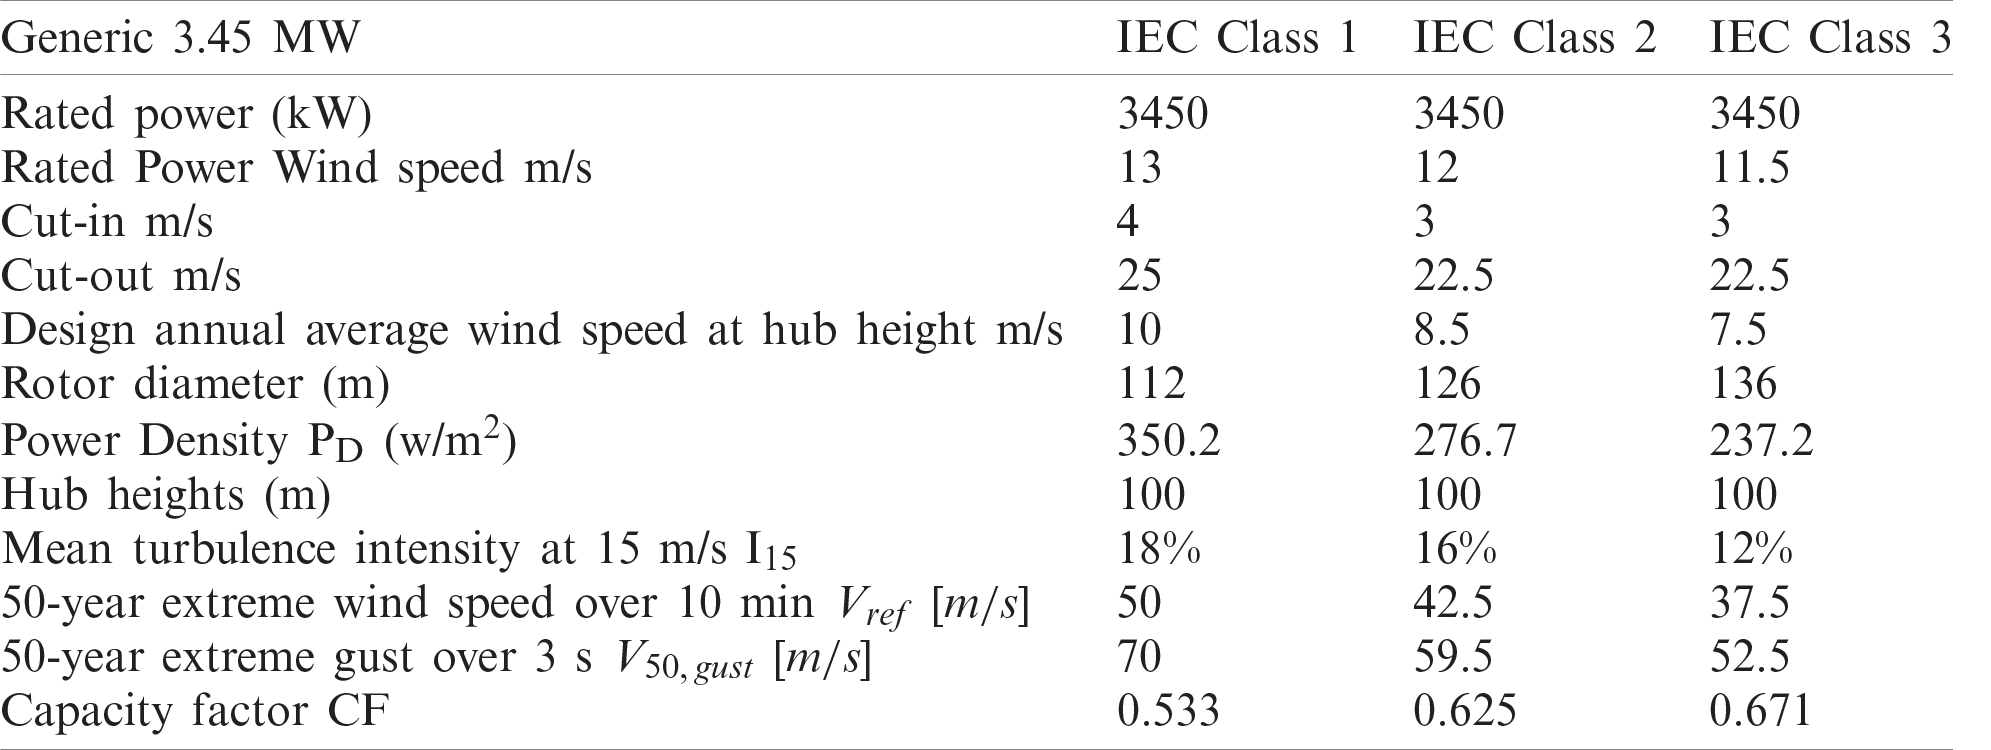
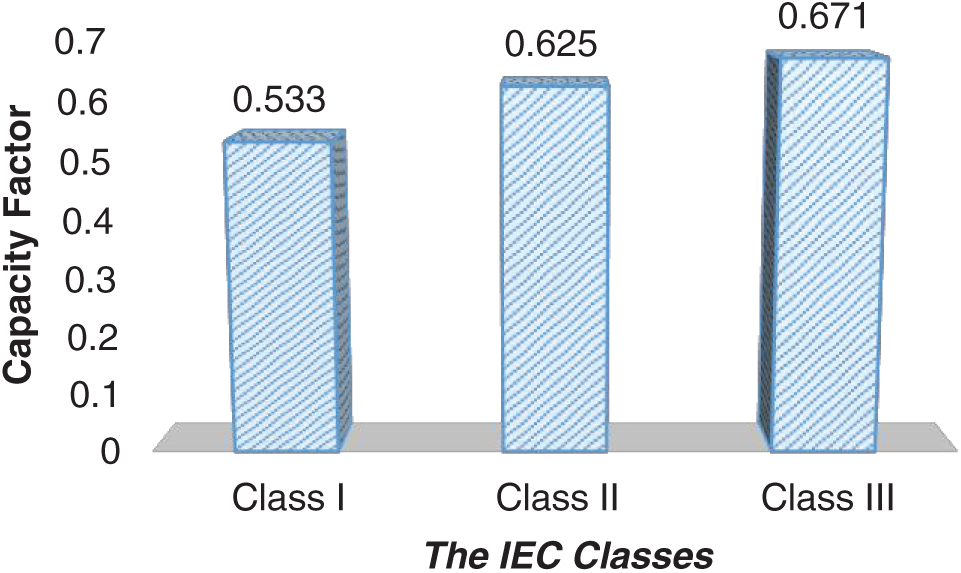
Figure 8: The capacity factor of the IEC classes of wind turbines
The other criteria was the mean turbulence intensity
It is noted the class I turbine have the top values for those three criteria, and because the study site is a site exposed to storms, so the Generic 3.45 MW-IEC Class 1 turbine is preferred for this site.
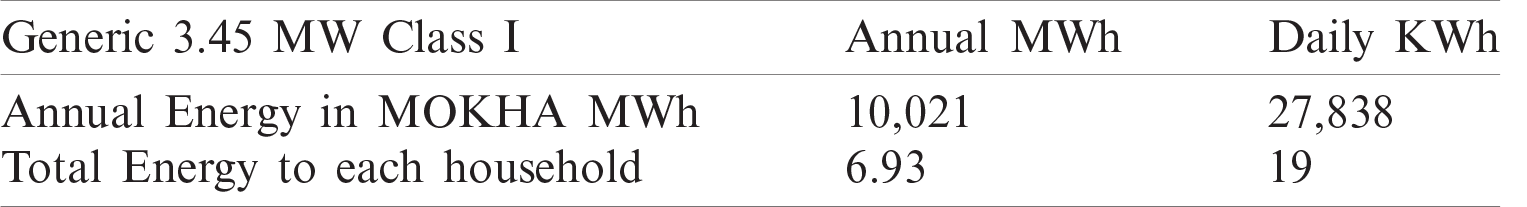
To calculate the amount of energy a class 1 turbine generates during the year if it is directed to the south, Eq. (26) shown above can be used and thus Tab. 11 shows the amount of energy in megawatt hours.
In order to calculate the amount of energy a Class 1 turbine generates during the year, if it is directed to the south during 227 days, Eq. (26) can be used thus Tab. 11 shows the amount of energy in MWh of Mokha (1447 dwellings). The daily share of each home of this estimated energy equals 19 KWh, which is enough to cover the basic home loads.
Table 11: The estimated energy by class I turbine
The study site is exposed to high-speed winds, especially the southern winds, which have an average speed of 10 m/s at a height of 100 m, which blow from 227 days from the day of the autumn solstice at the end of December until the summer solstice in June of the following year. It has been proved that the estimated power density by the Weibull probability distribution function
Funding Statement: The author extends his appreciation to the Deanship of Scientific Research at King Khalid University for funding this work under Grant Number (RGP.1/147/42), Received by Fahd N. Al-Wesabi. www.kku.edu.sa.
Conflicts of Interest: The author declares that they have no conflicts of interest to report regarding the present study.
1. S. Kutty, M. Khan and M. Ahmed, “Wind energy resource assessment for Suva, Fiji, with accurate Weibull parameters,” Energy Exploration & Exploitation, vol. 37, pp. 1009–1038, 2019. [Google Scholar]
2. L. Paraschiv, S. Paraschiv and I. Ion, “Investigation of wind power density distribution using Rayleigh probability density function,” Energy Procedia, vol. 157, pp. 1546–1552, 2019. [Google Scholar]
3. A. Liu, Y. Ma, J. Gunawardena, P. Egodawatta, G. Ayoko et al., “Heavy metals transport pathways: The importance of atmospheric pollution contributing to stormwater pollution,” Ecotoxicology and Environmental Safety, vol. 164, pp. 696–703, 2018. [Google Scholar]
4. A. Alkholidi, “Renewable energy solution for electrical power sector in Yemen,” International Journal of Renewable Energy Research, vol. 3, pp. 803–811, 2013. [Google Scholar]
5. Y. Li, W. Xiao-Peng, L. Qiu-Sheng and K. Fah, “Assessment of onshore wind energy potential under different geographical climate conditions in China,” Energy, vol. 152, pp. 498–511, 2018. [Google Scholar]
6. M. Salah, I. Supérieur and S. Ben, “Assessment of wind energy potential and optimal electricity generation in Borj-Cedria,” Renewable and Sustainable Energy Reviews, vol. 15, pp. 815–820, 2017. [Google Scholar]
7. I. Fyrippis, P. Axaopoulos and G. Panayiotou, “Wind energy potential assessment in Naxos Island, Greece,” Applied Energy, vol. 87, pp. 577–586, 2017. [Google Scholar]
8. S. Haralambos, G. Mihalakakou and L. Al-Hadhrami, “Wind power potential assessment for seven buoys data collection stations in Aegean Sea using Weibull distribution function,” Journal of Renewable and Sustainable Energy, vol. 4, pp. 1–17, 2012. [Google Scholar]
9. M. Baseer, J. Meyer, S. Rehman and M. Alam, “Wind power characteristics of seven data collection sites in Jubail, Saudi Arabia using Weibull parameters,” Renewable Energy, vol. 102, pp. 35–49, 2017. [Google Scholar]
10. M. Almekhlafi, “Justification of the advisability of using solar energy for the example of the Yemen Republic,” Scientific and Technical Journal, vol. 4, pp. 51–50, 2018. [Google Scholar]
11. A. Rawea and S. Urooj, “Strategies, current status, problems of energy and perspectives of Yemen’s renewable energy solutions,” Renewable and Sustainable Energy Reviews, vol. 82, pp. 1655–1663, 2018. [Google Scholar]
12. M. Al-Buhairi and A. Al-Haydari, “Monthly and seasonal investigation of wind characteristics and assessment of wind energy potential in Al-Mokha, Yemen,” Energy and Power Engineering, vol. 4, pp. 125–131, 2012. [Google Scholar]
13. M. Al-Buhairi, “Analysis of monthly, seasonal and annual air temperature variability and trends in Taiz city-Republic of Yemen,” Journal of Environmental Protection, vol. 1, pp. 401–409, 2010. [Google Scholar]
14. M. Al-Buhairi, “A statistical analysis of wind speed data and an assessment of wind energy potential in Taiz-Yemen,” Assiut University Bulletin for Environmental Researches, vol. 9, pp. 21–33, 2006. [Google Scholar]
15. A. AL-Ashwal, “All renewable energy applications in Yemen are best practice,” ISECO Science and Technology Vision, vol. 1, pp. 45–50, 2005. [Google Scholar]
16. L. Gabriela, C. Balaceanu and S. Stefan, “Annual air pollution level of major primary pollutants in Greater Area of Zucharest,” Atmospheric Pollution Research, vol. 6, pp. 824–834, 2015. [Google Scholar]
17. T. Arslan, Y. Murat Bulut and A. Yavuz, “Comparative study of numerical methods for determining Weibull parameters for wind energy potential,” Renewable and Sustainable Energy Reviews, vol. 40, pp. 820–825, 2014. [Google Scholar]
18. A. Al Shamma’a, K. Addoweesh and A. Eltamaly, “Optimum wind turbine site matching for three locations in Saudi Arabia,” Advanced Materials Research, vol. 347, pp. 2130–2139, 2011. [Google Scholar]
19. T. Chang, “Estimation of wind energy potential using different probability density functions,” Applied Energy, vol. 88, pp. 1848–1856, 2011. [Google Scholar]
20. UNDP, Policy Note, Prospects of Solar Energy in Yemen. Sana’a, Yemen: UNDP, 2014. [Google Scholar]
21. M. Hadwan and A. Alkholidi, “Solar power energy solutions for Yemeni rural villages and desert communities,” Renewable and Sustainable Energy Reviews, vol. 57, pp. 838–849, 2016. [Google Scholar]
22. M. Almekhlafi, “Justification of the advisability of using solar energy for the example of the Yemen Republic,” Scientific and Technical Journal—Technogenic and Ecological Safety, vol. 42, no. 2, pp. 41–50, 2018. [Google Scholar]
23. Guide to renewable energy and energy efficiency in the Arab states, league of Arab states, 2013. [Google Scholar]
24. N. Arreyndip, E. Joseph and A. David, “Wind energy potential assessment of Cameroon’s coastal regions for the installation of an onshore wind farm,” Heliyon, vol. 2, no. 11, pp. 1–19, 2016. [Google Scholar]
 | This work is licensed under a Creative Commons Attribution 4.0 International License, which permits unrestricted use, distribution, and reproduction in any medium, provided the original work is properly cited. |