DOI:10.32604/cmc.2021.016885
| Computers, Materials & Continua DOI:10.32604/cmc.2021.016885 | |
| Article |
Video Recognition for Analyzing the Characteristics of Vehicle–Bicycle Conflict
1College of Logistics and Traffic, Central South University of Forestry and Technology, Changsha, 410004, Hunan, China
2Department of Mathematics and Computer Science, Northeastern State University, Tahlequah, 74464, OK, United States
*Corresponding Author: Xingjian Xue. Email: 7413442@qq.com
Received: 14 January 2021; Accepted: 11 March 2021
Abstract: Vehicle–bicycle conflict incurs a higher risk of traffic accidents, particularly as it frequently takes place at intersections. Mastering the traffic characteristics of vehicle–bicycle conflict and optimizing the design of intersections can effectively reduce such conflict. In this paper, the conflict between right-turning motor vehicles and straight-riding bicycles was taken as the research object, and T-Analyst video recognition technology was used to obtain data on riding (driving) behavior and vehicle–bicycle conflict at seven intersections in Changsha, China. Herein, eight typical traffic characteristics of vehicle–bicycle conflict are summarized, the causes of vehicle–bicycle conflict are analyzed using 18 factors in three dimensions, the internal relationship between intersection design factors and traffic conflicts is explored, and the guiding of design optimization based on the width of bicycle lanes and the soft separation between vehicles and bicycles is discussed. The results showed that colored paved bicycle lanes were better, performing better at a width of 2.5 m compared to 1.5 m. However, the colored pavement was not suitable for the entire road and had to be set at the position, at which the trajectories of a bicycle and motor vehicle overlapped. Thus, a 2.5-m-wide bicycle lane provides good safety. However, there are still defects in the existing safety indicators, so it is necessary to develop new indicators to reflect real vehicle–bicycle conflict situations more comprehensively.
Keywords: Vehicle–bicycle conflict; video recognition technology; bicycle lane width; vehicle–bicycle separation method
With the promotion of shared bicycles, the number of bicycles in China has reached nearly 700 million [1] and is still growing at a high rate, but the average annual growth rate of bicycle accidents is also high, at 9.5%. An important reason is that the behavior associated with vehicle–bicycle conflict is complicated; it has many influencing factors, with the interference from right-turning motor vehicles on bicycle riders at intersections being the most common conflict [2]. Office buildings, bus stations, and residential areas are high-risk areas for vehicle–bicycle conflicts, and the frequency is not affected by the time period [3]. The force exerted by motor vehicles, the environmental force, and the force between bicycles have a greater impact on riding behavior [4]. Vehicles crossing road lines to overtake bicycles is the most conflict-prone behavior [5]. Moreover, the longer the overtaking process, the more cautious bicycle riders will become, and the worse riding stability will become [6]. Speed divergence is also an important cause of overtaking behavior [7], and the proportion of electric bicycles is an important factor [8,9]. Thus, limiting the speed of bicycles can be more effective than widening the bicycle lane to reduce overtaking interference [10].
The design of intersections, especially the design of bicycle lanes, has a great impact on vehicle–bicycle conflict. A good design will have a positive impact on the willingness to ride [11,12]. Most design problems stem from discontinuous bicycle riding space for bicyclists and insufficient bicycle-lane width [13]; 2.5 m is an ideal bicycle-lane width [14]. The way motor vehicles and bicycles are separated is also an important factor, although physical separation usually makes the rider feel safer [15], and it is difficult to implement separation at intersections. Colored pavement is a better alternative [16], as is advancing the stop line by 3–5 m, which can also reduce the interference of bicycles by motor vehicles [17].
As the data on traffic accident are limited, it is a research trend in related fields to use traffic conflict indicators that have a stable quantitative relationship with traffic accidents as surrogate indicators. Traffic indicators are mainly divided into two categories [18]: (1) the time indicator, used to measure the proximity of the conflicting parties, such as time-to-collision (TTC) and post-encroachment time (PET) [19–22] and (2) evasive-action indicators, including deceleration, sudden braking, and steering degree [23,24]. However, the key difficulty in analyzing traffic conflict lies in data acquisition. At present, data mainly comes from sources including GPS, mobile phone signaling, and cloud data, but do not reflect the details of the conflict. In recent years, the gradual application of video recognition technology has solved this problem [25], owing to several key image recognition technology difficulties being overcome, such as the multi-object recognition problem [26], target tracking problem [27], multi-feature adaptive problem [28], image classification problem [29], and mobile crowdsensing question [30]. T-Analyst video recognition software, developed by Lund University, can be used to analyze cycling behavior and the traffic conflicts it causes [31].
The present study was designed to investigate the conflict between right-turning motor vehicles and straight-riding bicycles by using T-Analyst video recognition technology and TTC, PET, and other indicators to analyze the cycling (driving) behaviors and vehicle–bicycle conflict at seven signal intersections in Changsha, China. The observed conflicts between vehicles and bicycles were caused by factors like the driver skill, vehicle type and condition, and road design. However, the design factors of the road affect the judgment of the driver or the driving trajectory of the vehicle, and thus have an indirect connection with an accident. Therefore, the research object of this paper focused on road design. Eight typical vehicle–bicycle conflicts and their traffic characteristics are summarized in this paper; the causes of conflicts were sorted into 18 factors in three dimensions to explore the internal connection between intersection design factors and traffic conflicts and guide design optimization based on the width of bicycle lanes and the soft separation between vehicles and bicycles.
2 Data Collection Based on Video Recognition Technology
In the work described in this paper, T-Analyst video recognition software was used to extract the trajectory of road users. In addition, continuous time and coordinate data were used to express and predict behavioral states, and, on this basis, a secondary calculation was used to obtain various values of traffic behavior and conflict index. The entire process was divided into the following three steps.
Step 1–-Coordinate calibration and conversion: T-Calibration was used to calibrate the video coordinates, the corresponding feature points in video and satellite images were used to establish coordinate axes, and the trajectory of a detected object in a video was converted into a three-dimensional-space trajectory after gridding the video image, as shown in Fig. 1.
Step 2–-Background generation and trajectory tracking: The regression method was used to construct the background image, and the 3D frame was set to track the target trajectory and distinguish it from image interference, such as the background, as shown in Fig. 2.
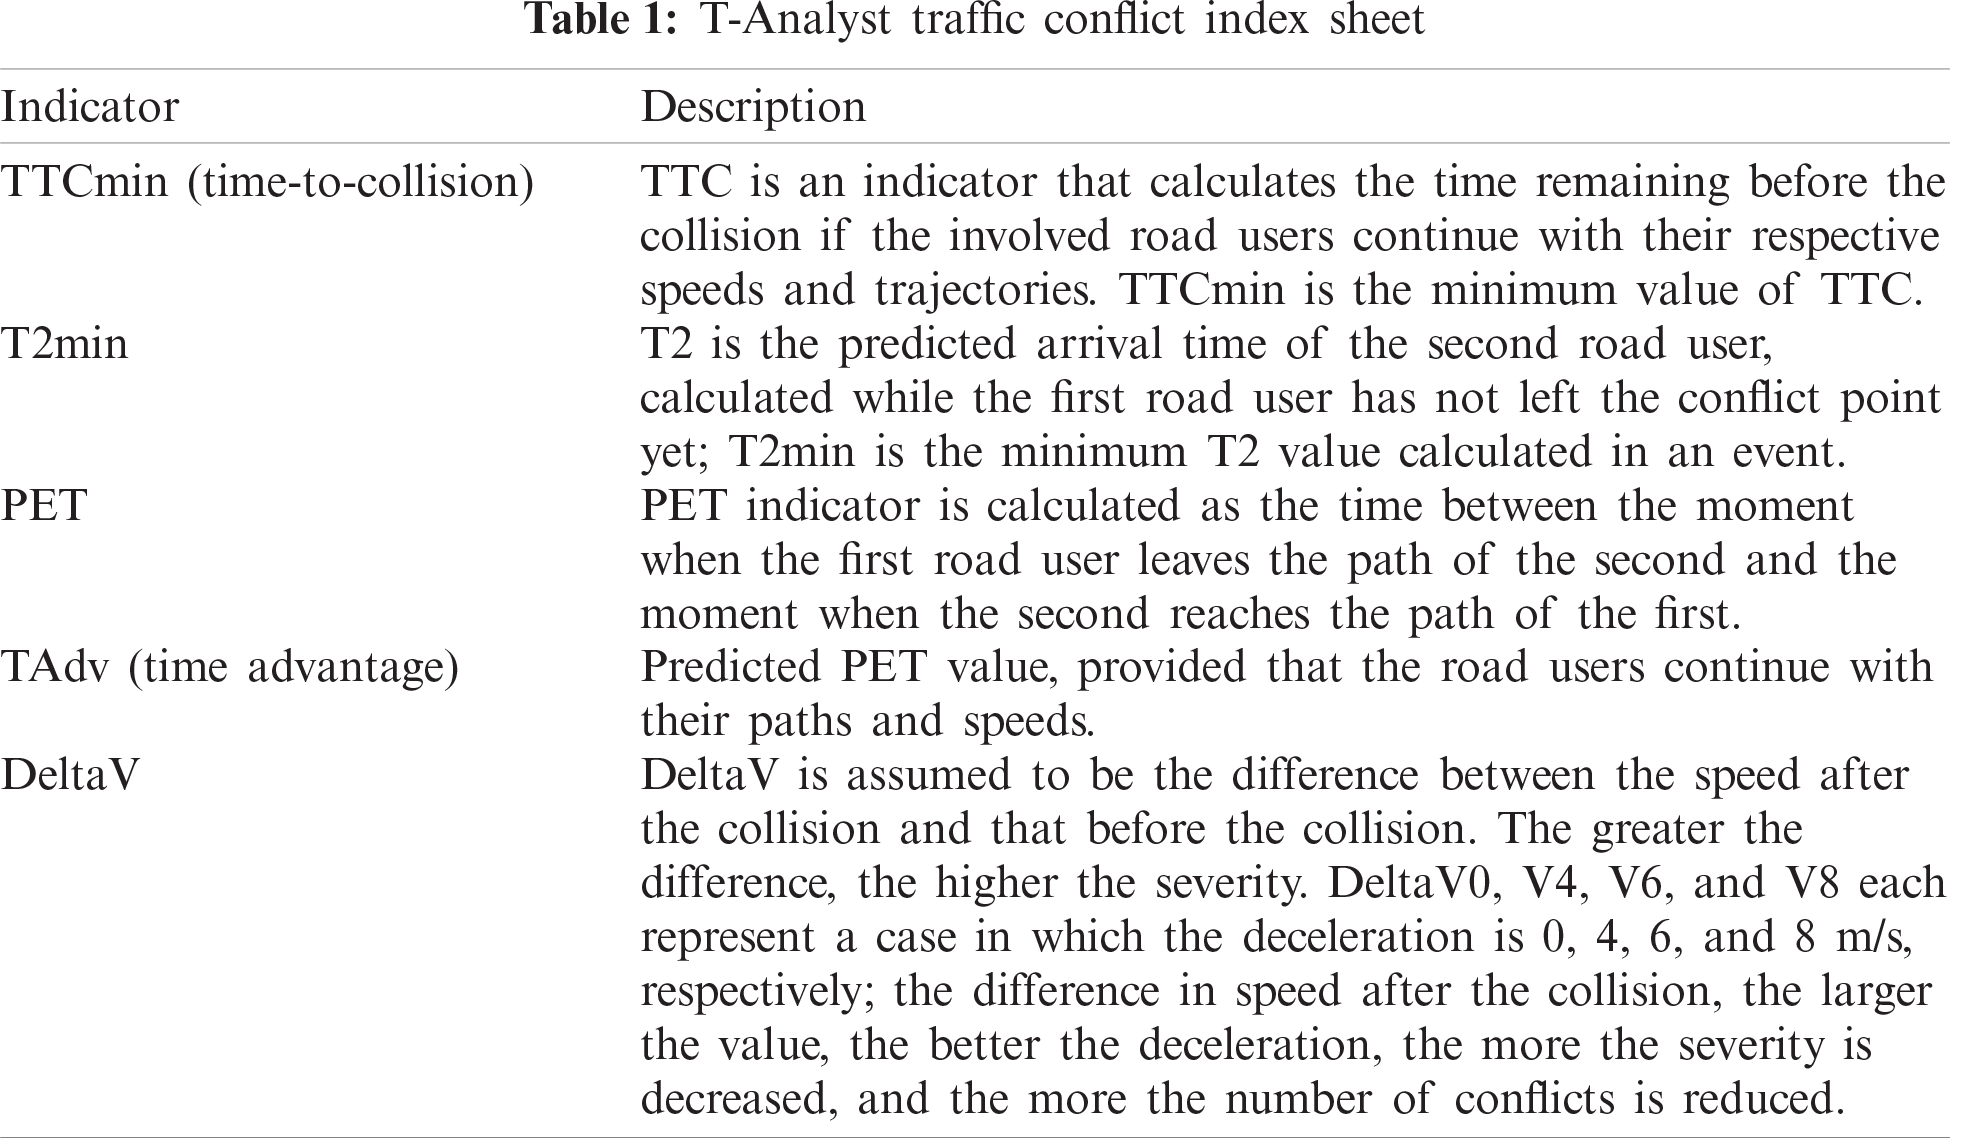
Step 3–-Trajectory prediction and conflict recognition: Through learning, comparing, and iterating the trajectory data of moving objects, whether the expected trajectories of two vehicles would lead to a collision and what the severity of the conflict would be based on multiple observation indicators were judged. In addition to data on normal speed, coordinates, and acceleration, there were some special indicators that described traffic conflicts, as shown in Tab. 1.
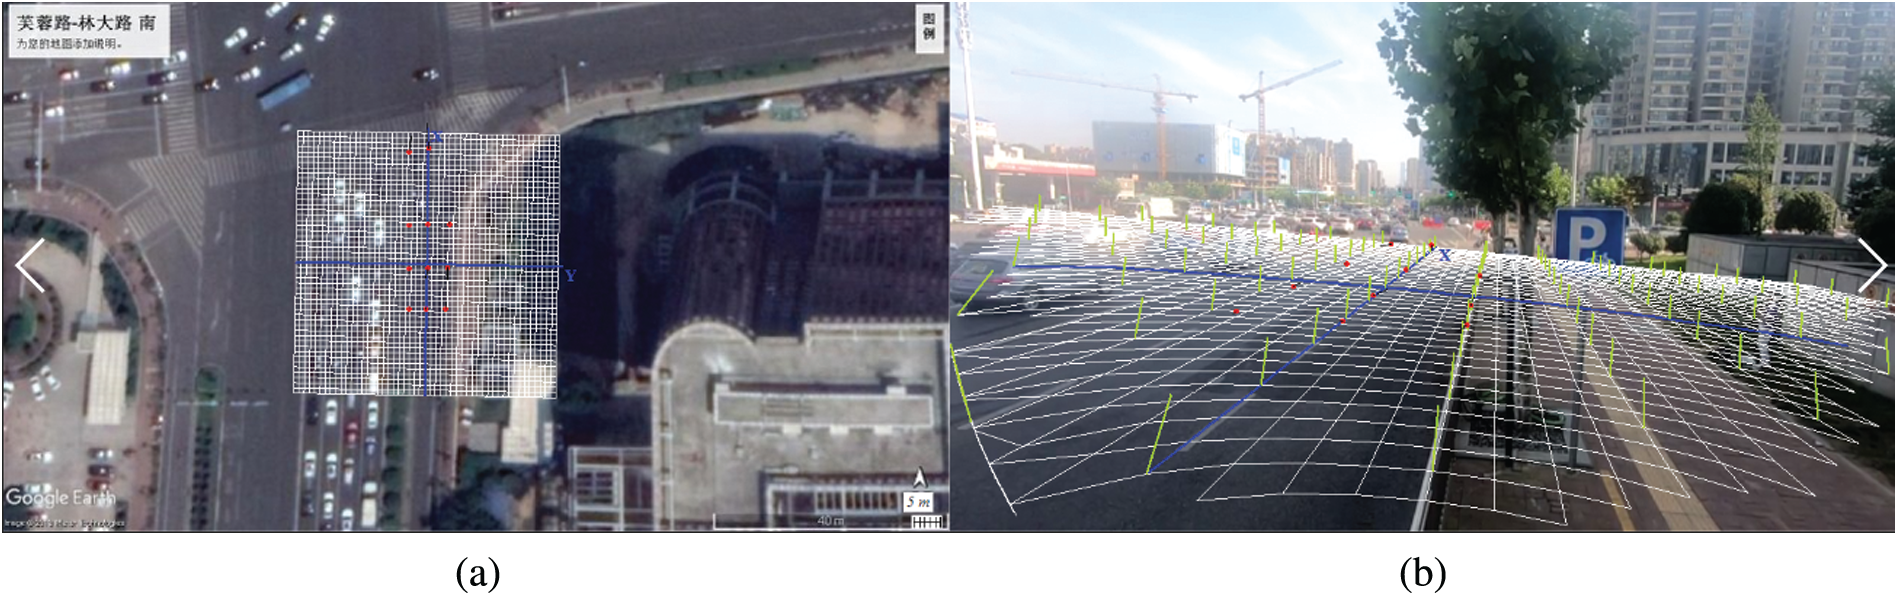
Figure 1: Satellite image (a) and video screenshot (b) after coordinate calibration
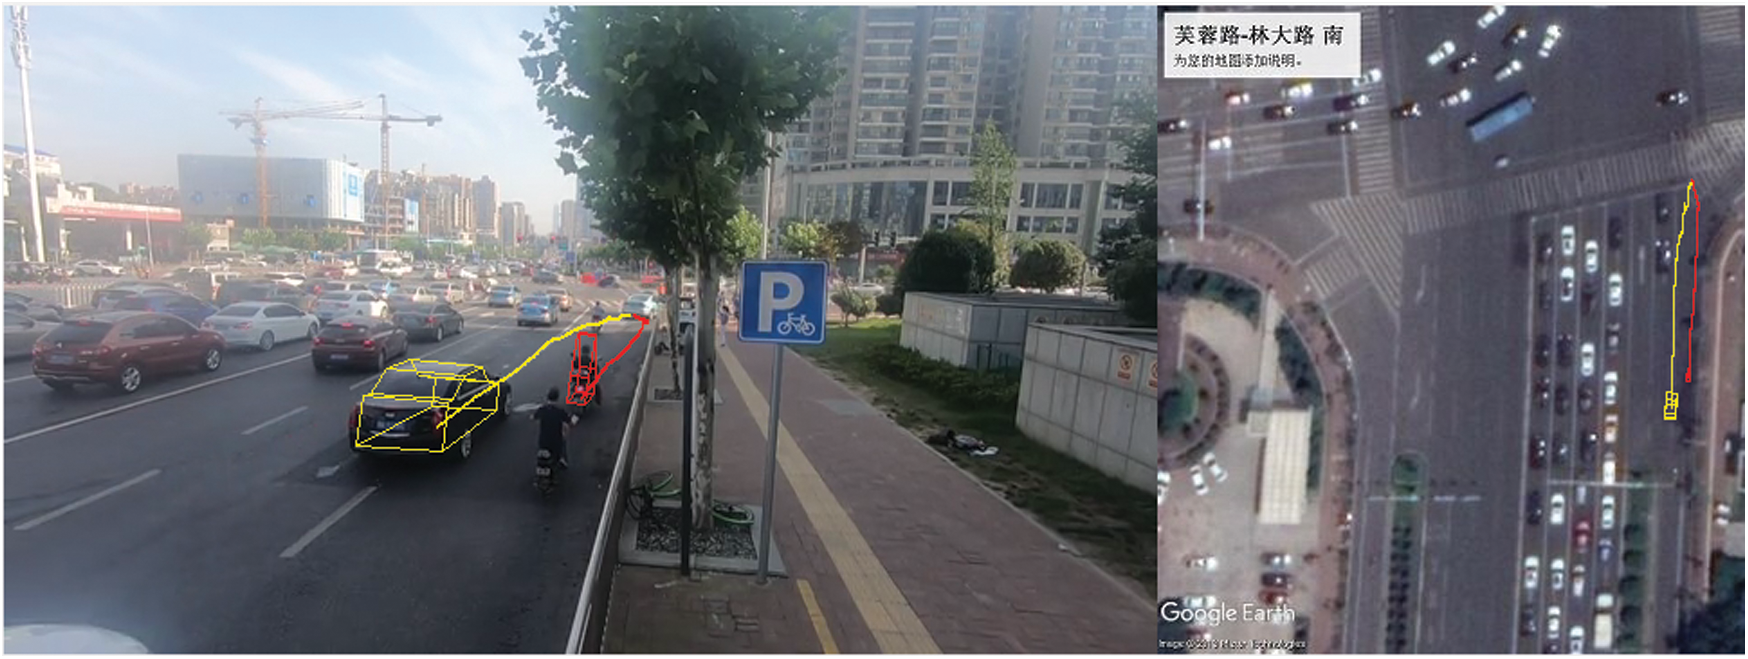
Figure 2: Vehicle–bicycle conflict trajectory tracking
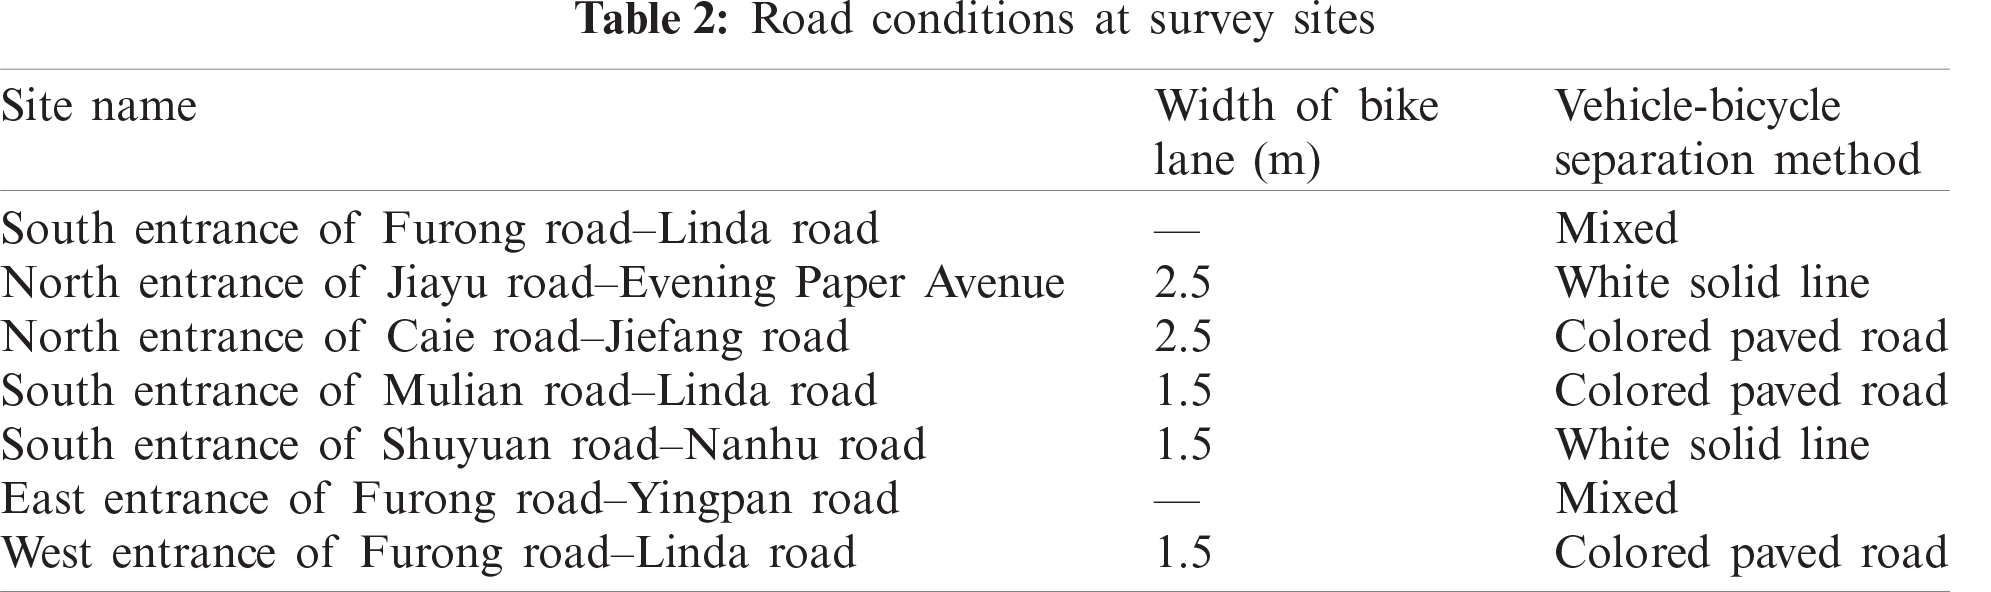
The entrance roads of seven signal intersections were selected as survey sites and are shown in Tab. 2. Two GoPro HERO6 cameras (GoPro, Inc., San Mateo, CA, USA) equipped with 3-m tripods were placed at each survey site. The first camera was located at the exit of the bicycle lane; the second on the sidewalk 45 m from the parking line of the entrance road. The data were collected on five working days from June 24 to 28, 2019.
3 Analysis of Cycling Behavior and Features of Vehicle–Bicycle Conflicts
3.1 Analysis of Typical Behavioral Characteristics of Vehicle–Bicycle Conflicts
Conflicts with TTCmin or T2min values of less than 4 s were studied [32]. Through a large amount of video analysis, vehicle–bicycle conflicts were summarized as eight typical vehicle–bicycle conflicts according to the three elements of conflict direction, conflict active party, and conflict reason, as shown in Tab. 3 and Fig. 3.
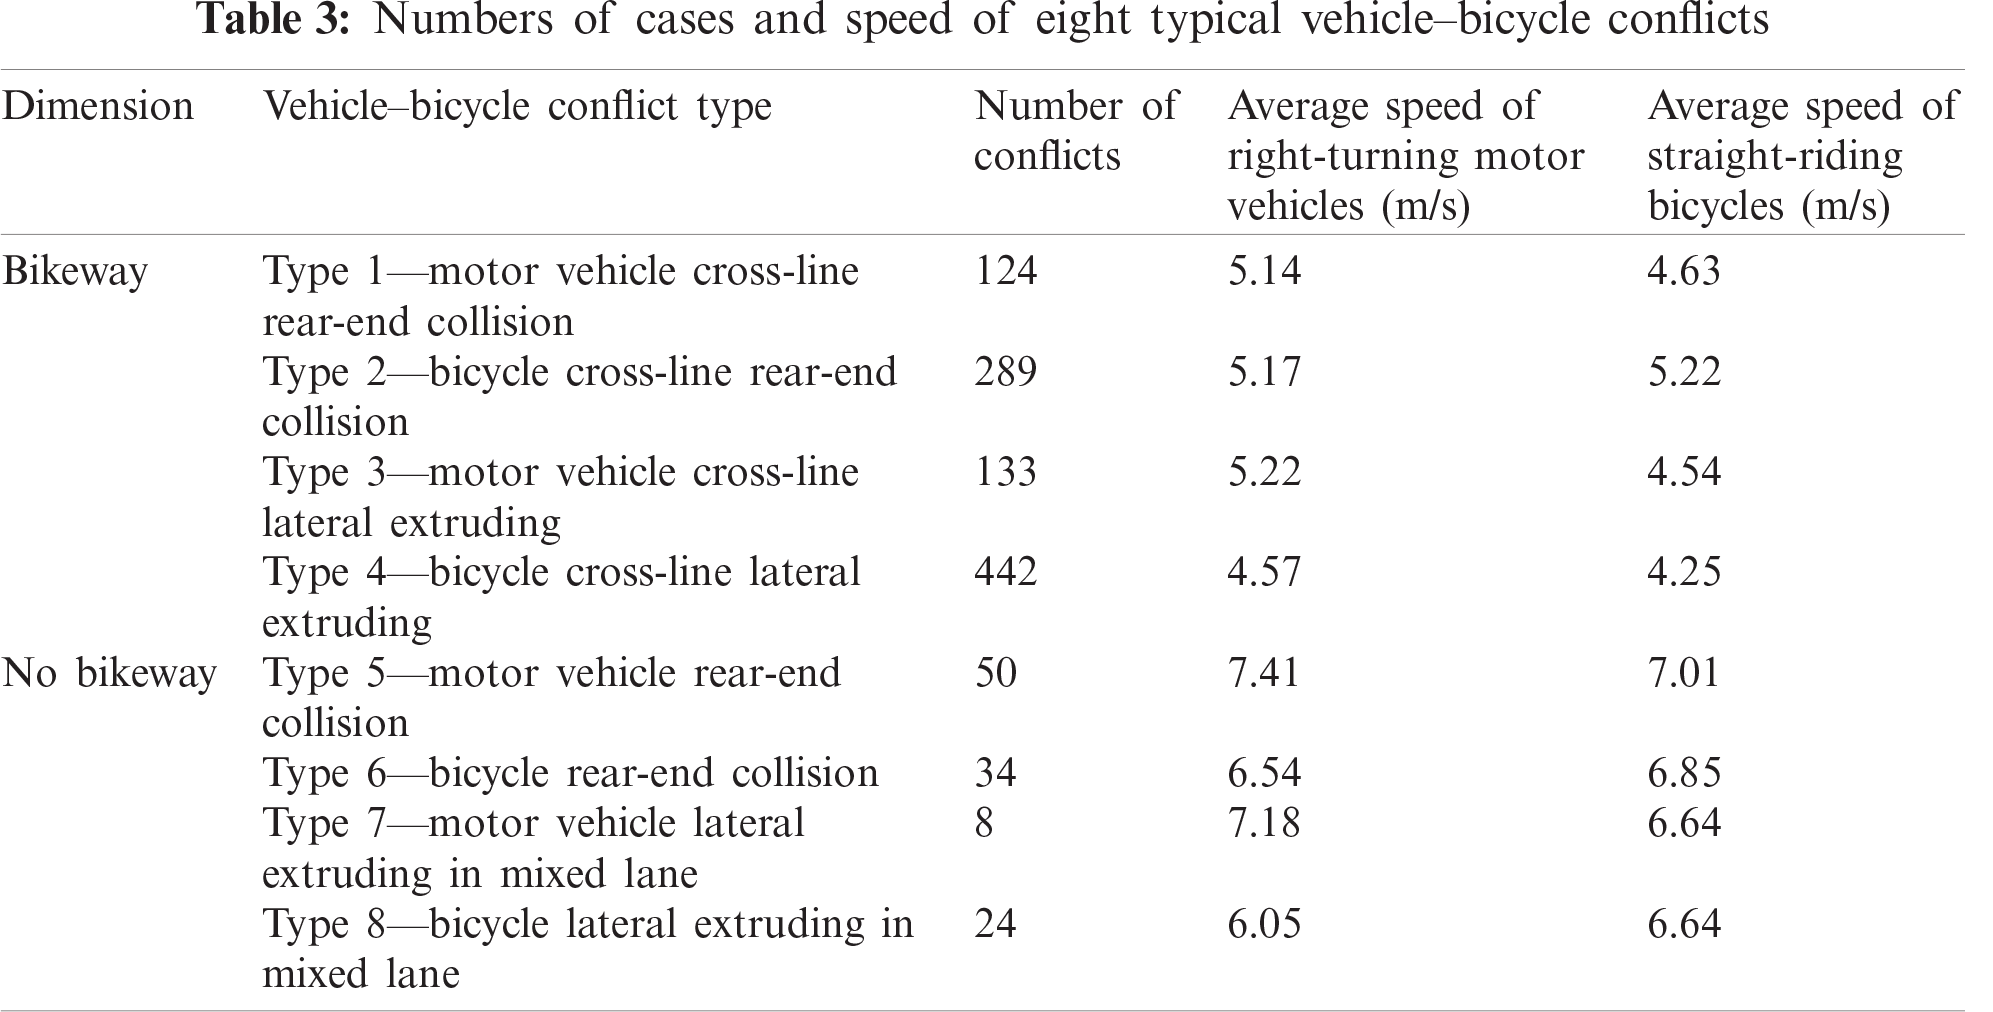
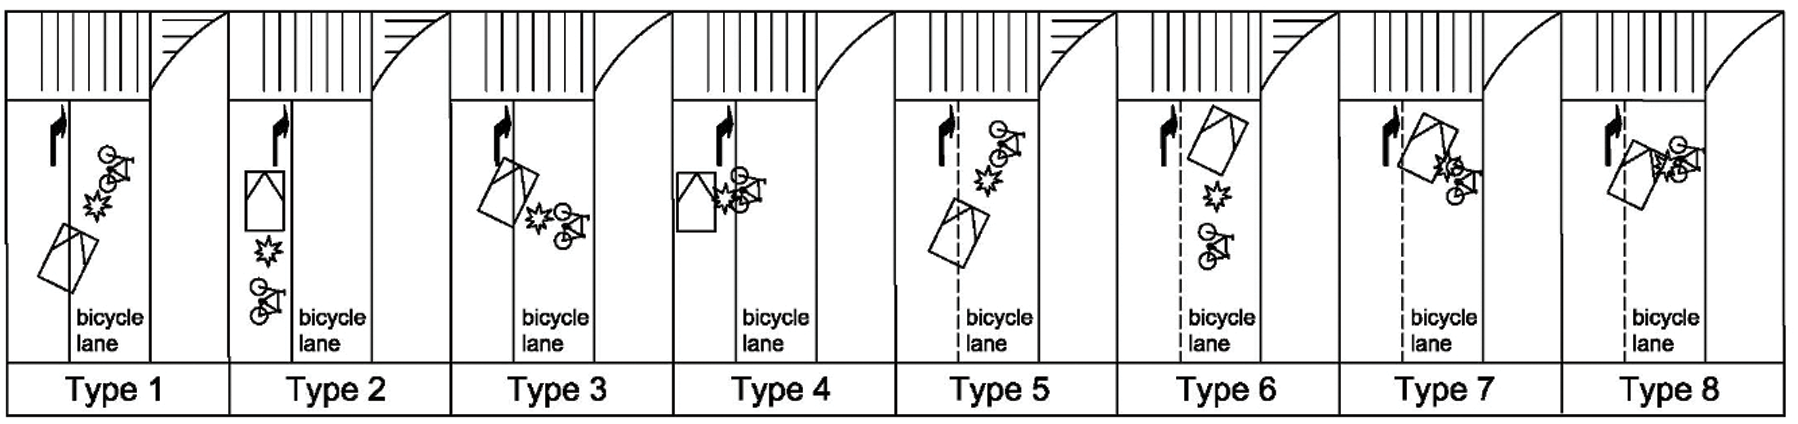
Figure 3: Illustration of eight typical vehicle–bicycle conflicts
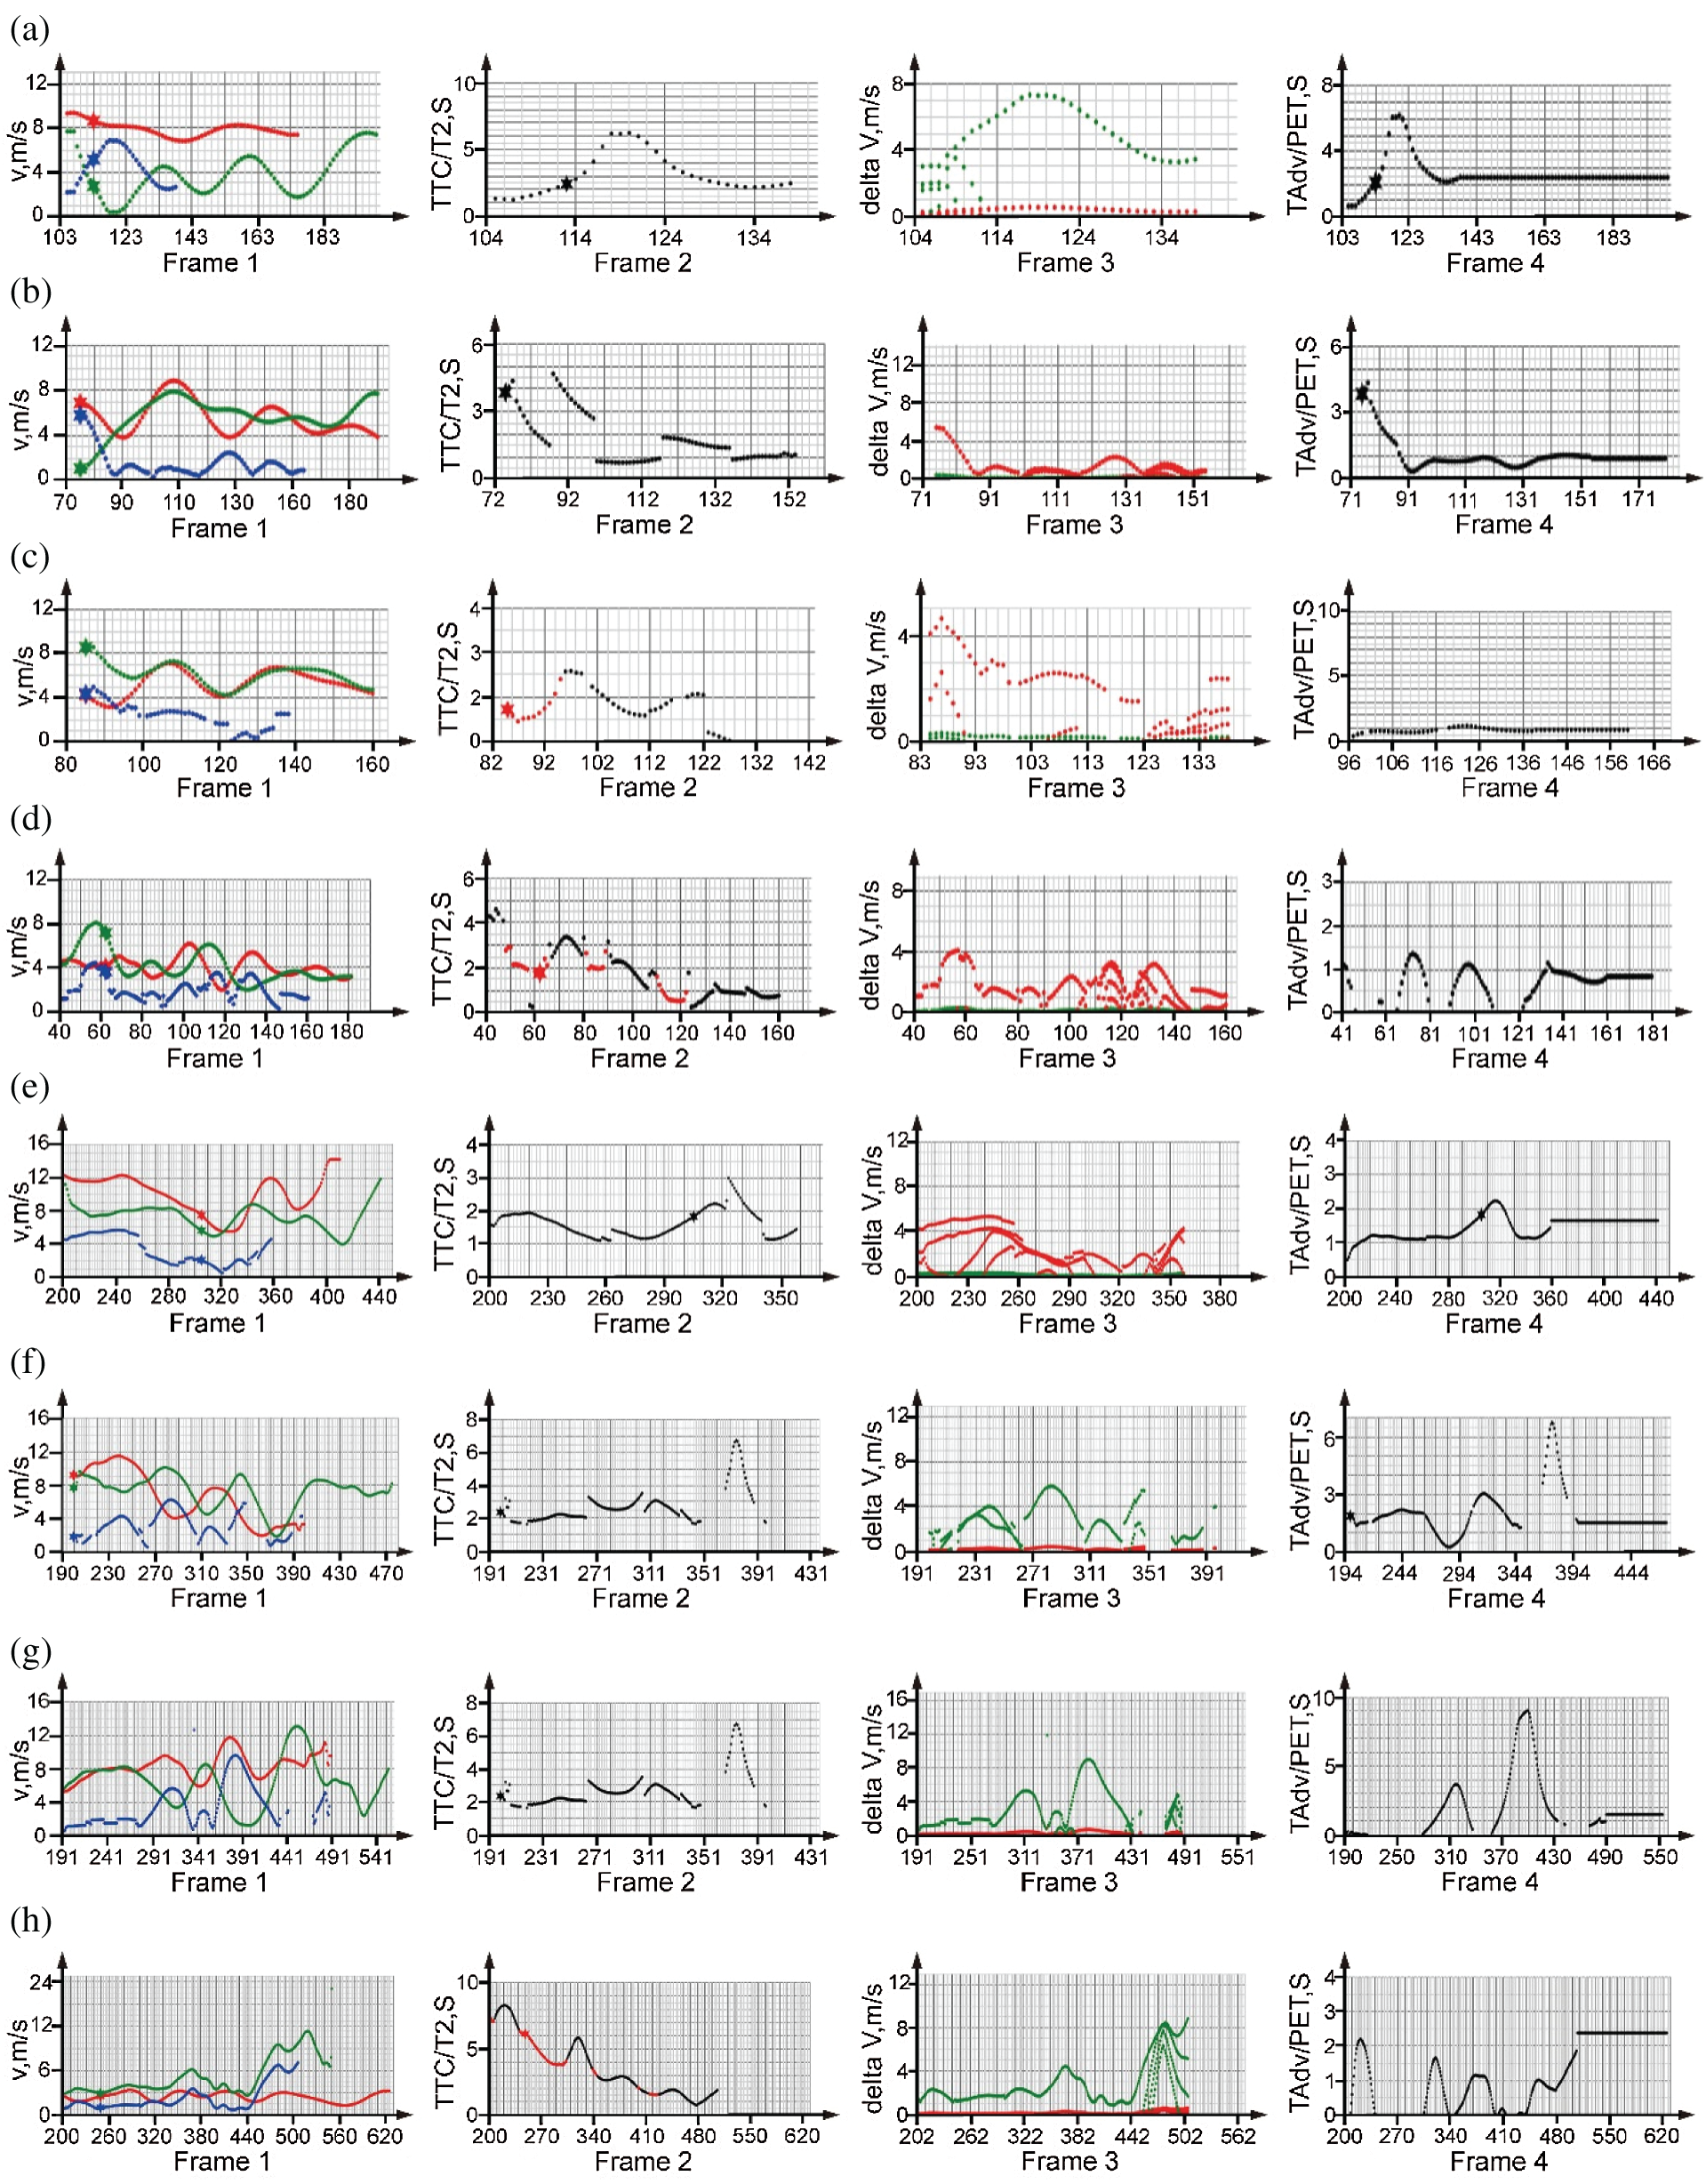
Figure 4: Time-varying graphs of vehicle–bicycle conflict. (a) Type 1 Motor vehicle cross-line rear-end collision (b) Type 2 Bicycle cross-line rear-end collision (c) Type 3 Motor vehicle cross-line lateral extruding (d) Type 4 Bicycle cross-line lateral extruding (e) Type 5 Motor vehicle rear-end collision (f) Type 6 Bicycle rear-end collision (g) Type 7 Motor vehicle lateral extruding in mixed lane (h) Type 8 Bicycle lateral extruding in mixed lane
Fig. 4 shows time-varying graphs of various indicators in the eight typical vehicle–bicycle conflicts that correspond to the order of conflict types presented in Fig. 3. In Fig. 4, the red curve expresses the first road user, the green curve is the second road user, and blue curve is the relative speed of the motor vehicle and bicycle during the conflict. The following can be seen from these figures. Type 1: The speed of motor vehicles is stable, and the bicycle frequently changes gears to avoid conflicts. TTC/T2/TAdv and other indicator curves show humps, in which a common situation occurs, namely, straight-going motor vehicles lining up too long and right-turning motor vehicles being forced to occupy the bicycle lane and conflict with bicycles. Type 2: Motor vehicle speed is limited by bicycles, and the speeds alternate with each other, but the braking force of motor vehicles is small, and PET has been maintained at a low level after speed decreases. This causes a common situation, namely that bicycles, in order to overtake or avoid conflict, are ridden onto an adjacent motorway. Type 3: Motor vehicles follow bicycles closely, the speeds of each are close to each other, and the TA is only 0.77 s, but the cyclist brakes several times to avoid the motor vehicle, as determined from the small changes in PET and T2.
Through the small change in PET and T2, the small distance between the two being maintained for a long time is demonstrated. The common situation is that the right-turning motor vehicle occupies the non-motor vehicle lane when turning. Type 4: This situation is common in cross-line lateral extruding conflicts caused by bicycles being ridden to the straight waiting area. The index characteristics are similar to that of Type 2, but the constant changes of TTC/T2 and PET values indicate that the distance between the motor vehicle and bicycle is constantly adjusted. Type 5: The speed of the motor vehicle is limited by the bicycle ahead of it and the speed alternate. Indicators such as TTC and PET are maintained in a low and stable following state. Type 6: When the motor vehicle turns at a fast speed, a slight braking is used to gradually decelerate the vehicle. The speed and braking of a bicycle are cyclical. After the motor vehicle enters the right-turn lane, the conflict eases, and the corresponding T2 and PET indicators present a peak. Type 7: The conflict causes great disturbance to both motor vehicles and bicycles. Both the speed and speed difference change more frequently. The motor vehicle must brake many times. TTC/T2 and PET have both undergone significant changes, illustrating that the distance between the two is unstable and that the disturbance has continued for a period of time. Type 8: This situation usually occurs when the speed of the motor vehicle is slow and the overtaking behavior of the bicycle forces the motor vehicle to slow down. The conflict index shows that although the collision point is still far away, the distance between the two is very close throughout the conflict process.
3.2 Analysis of Causes of Vehicle–bicycle Conflict
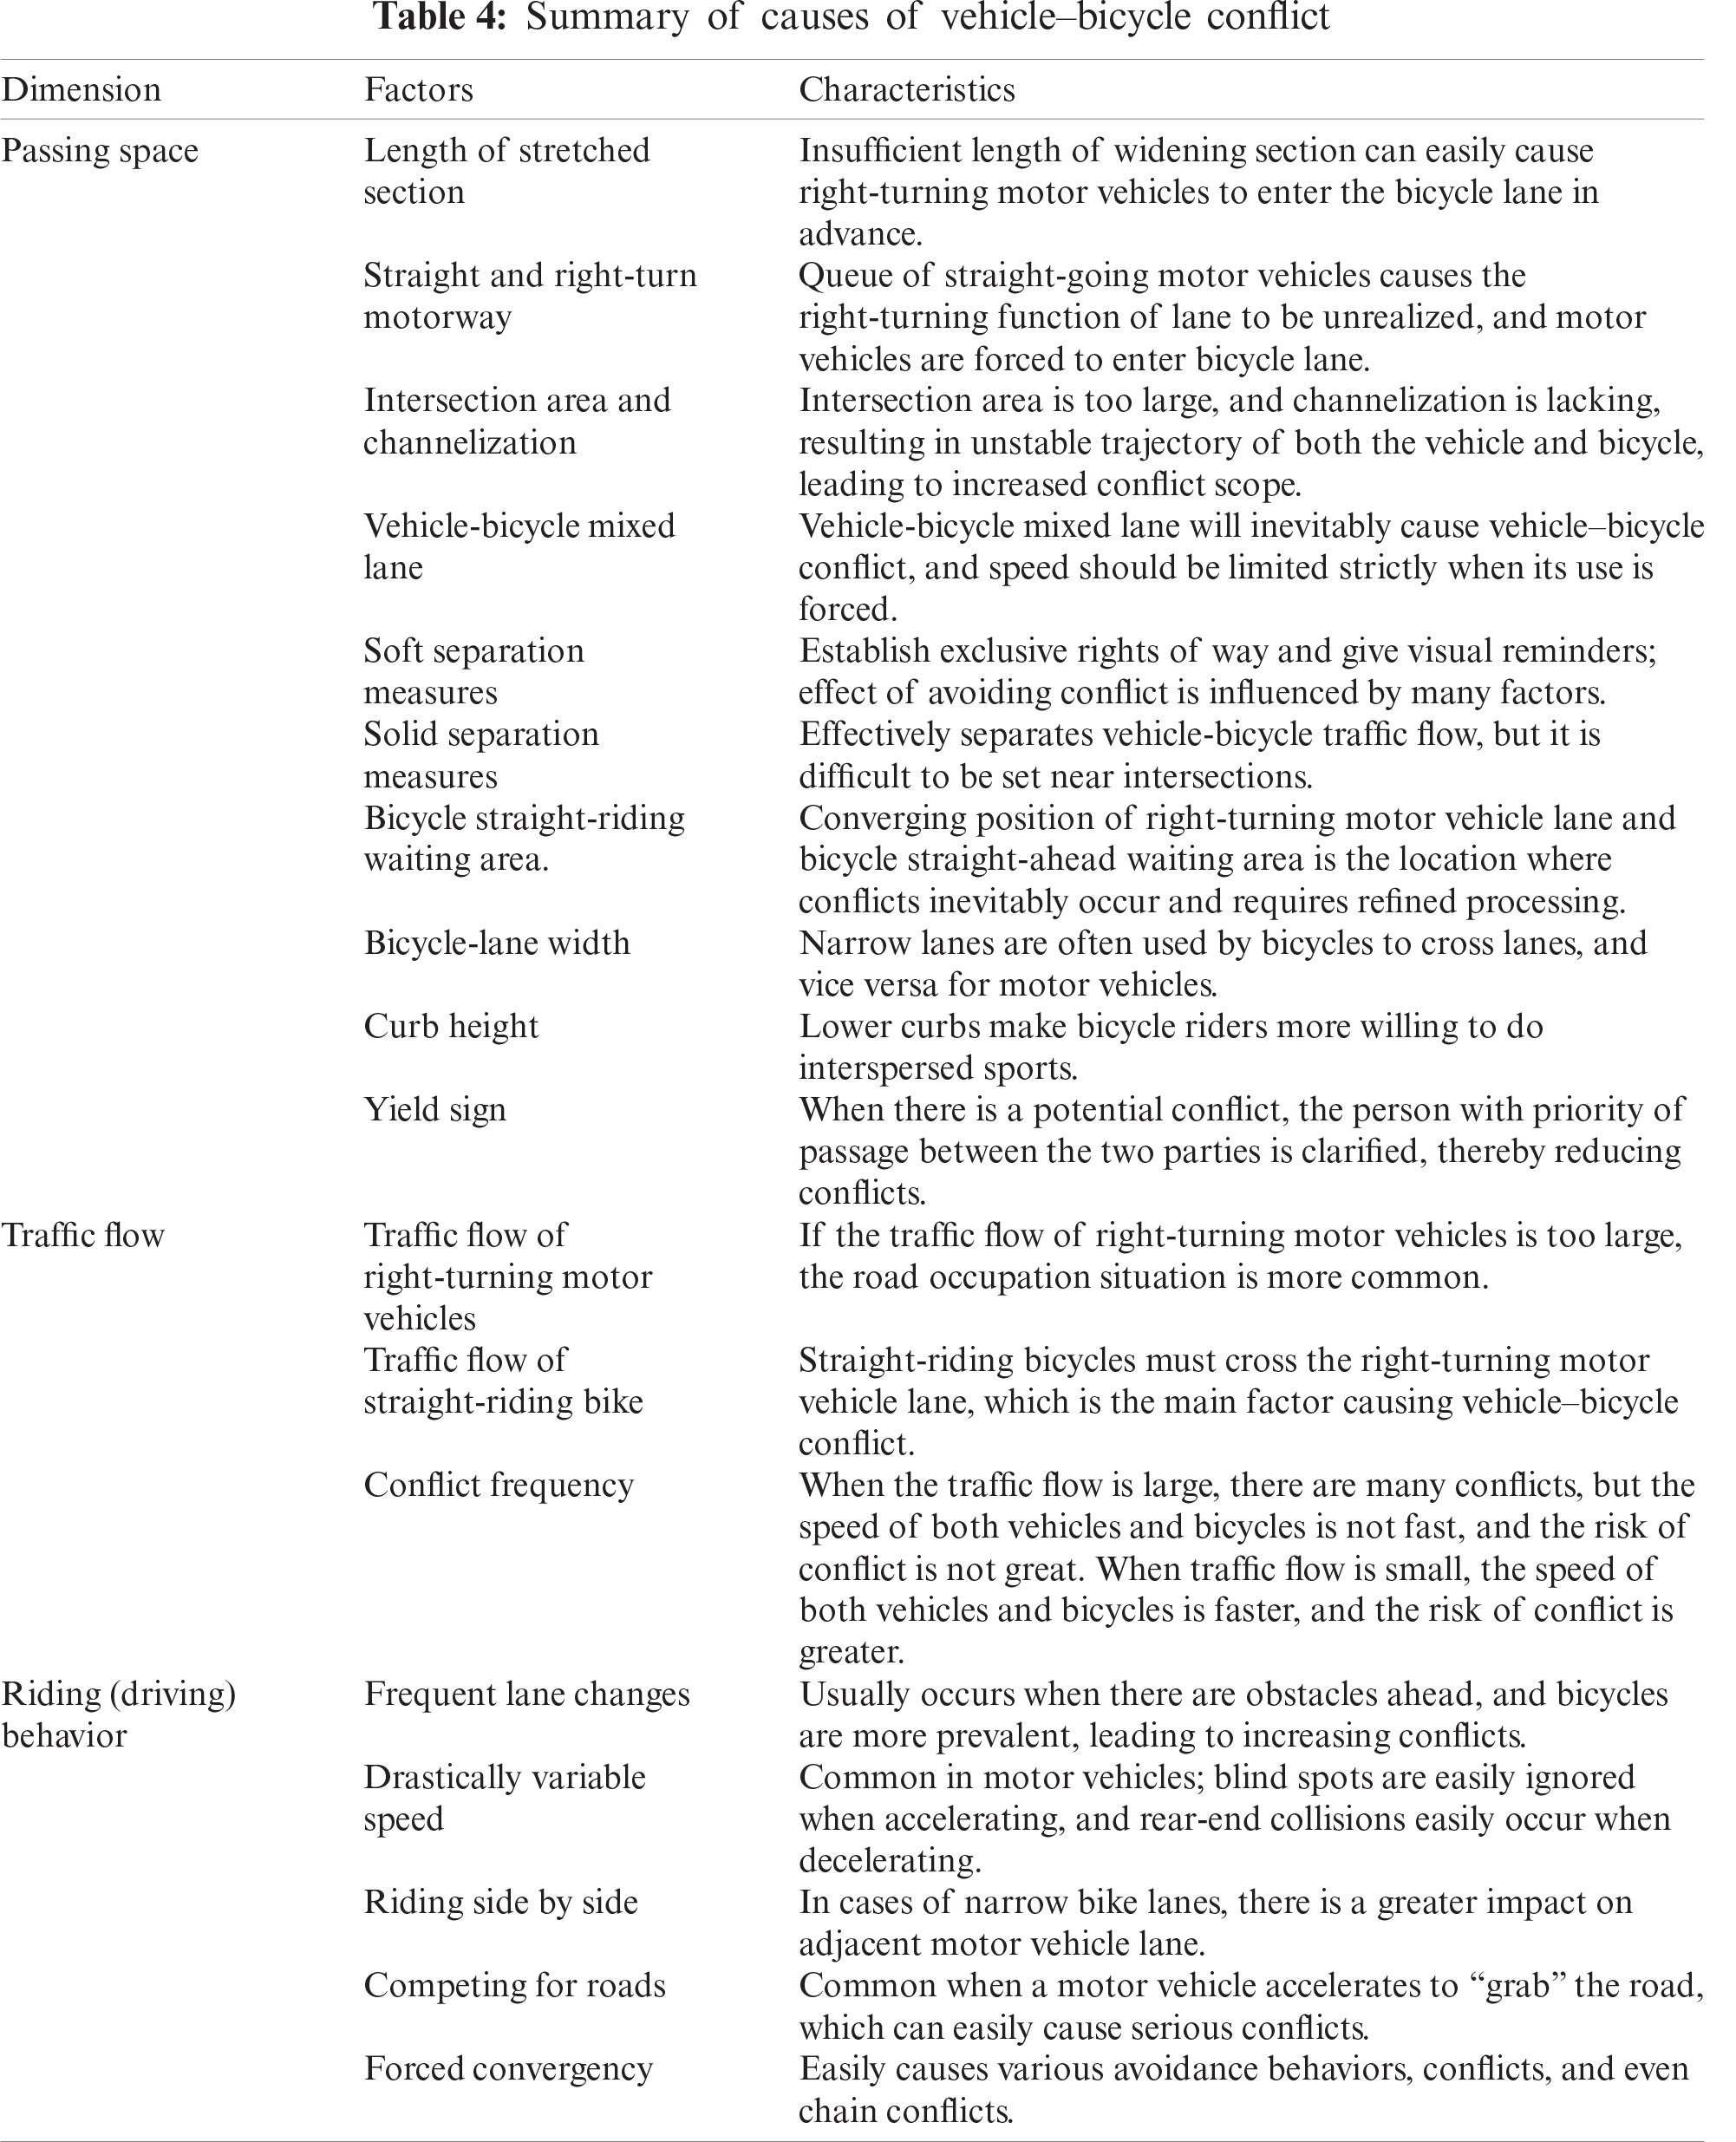
According to the analysis of the aforementioned eight typical vehicle–bicycle conflicts, the conflicts between vehicles and bicycles are summarized into three dimensions and 18 factors, as shown in Tab. 4.
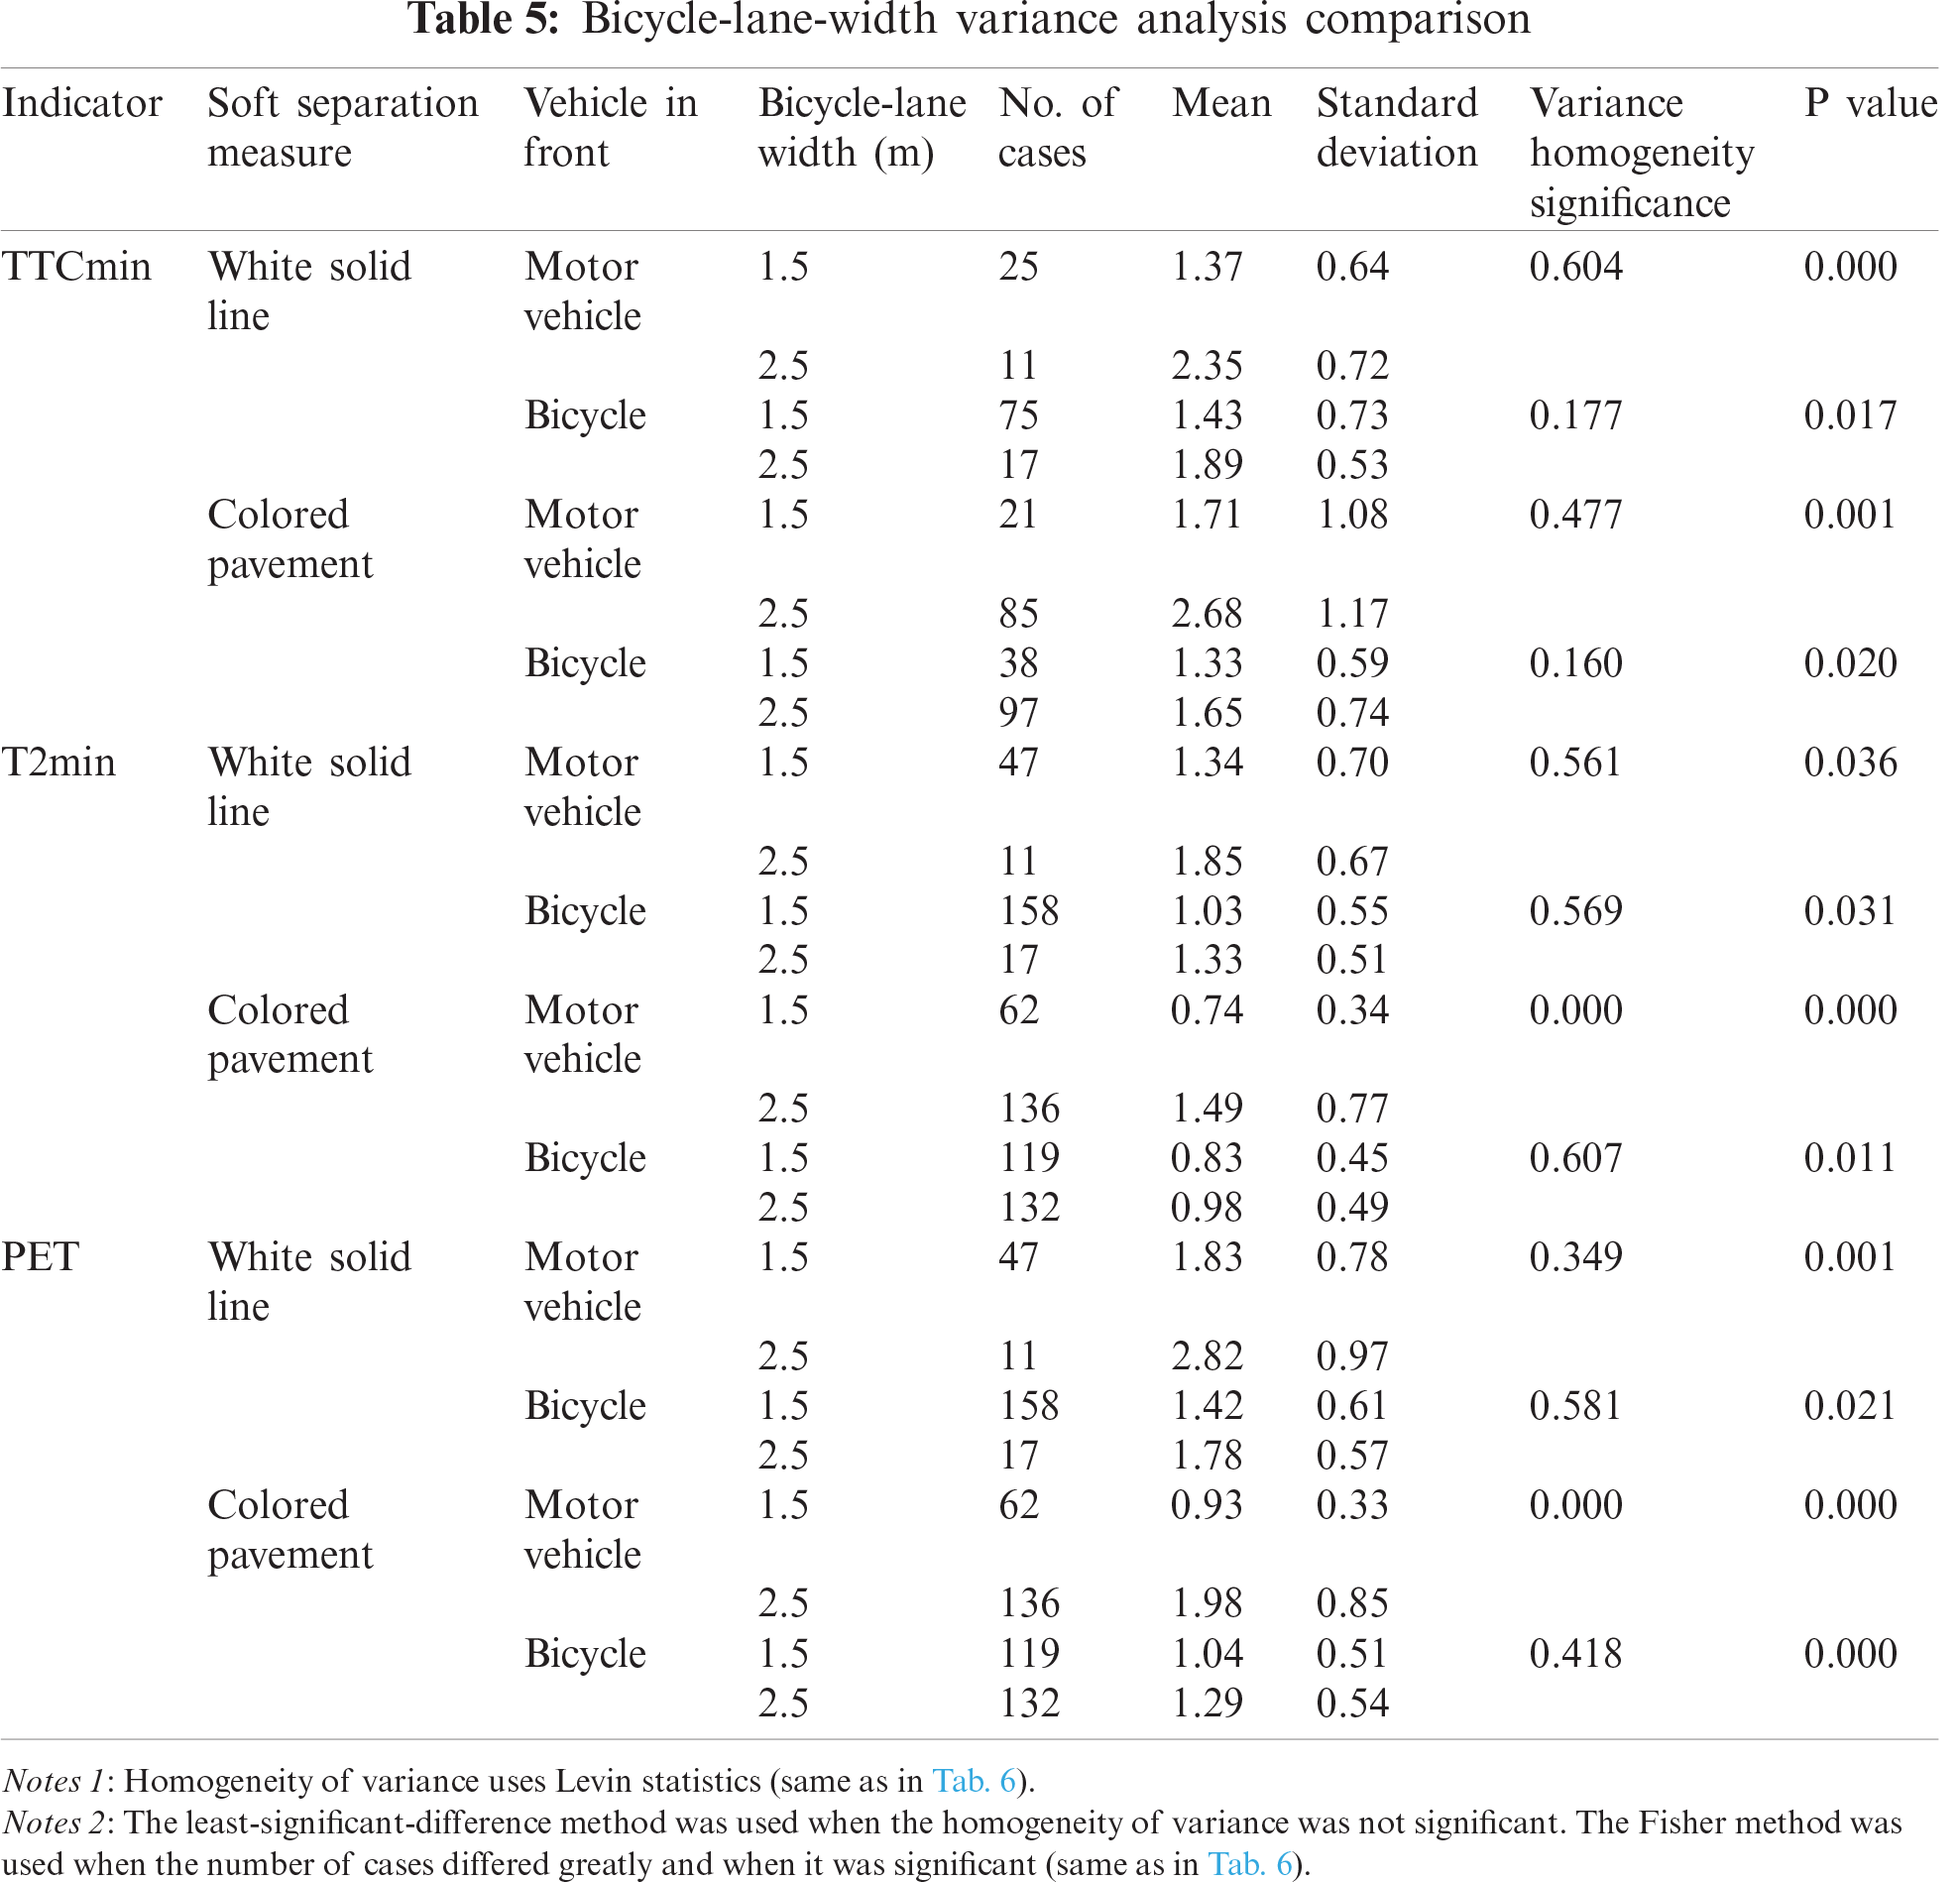
4.1 Bicycle-Lane Width Affecting Vehicle–Bicycle Conflicts
Bicycle-lane width is an important design factor. The most common lane widths, 1.5 and 2.5 m, were compared and analyzed in the context of soft separation measures and the preceding vehicle factors listed in Tab. 5. The increase in bicycle-lane width had a strong positive correlation with various safety indicators, and the analysis of variance was of great significance for three reasons. First, increasing the bicycle-lane width would increase the lateral distance between the motor vehicle and bicycle, so that both had more room for reaction. Second, a wider lane could increase the speeds of both the motor vehicle and bicycle, which could end potential collisions faster or quickly increase the time interval.
4.2 Soft Separation Measures Affecting Vehicle–Bicycle Conflicts
Bicycle lanes near intersections often cannot be physically separated. Mixed traffic between motor vehicles and bicycles, or the use of solid lines and colored pavement and other soft separation measures, are commonly adopted in road design. In this work, the differences in the role of soft separation types in vehicle–bicycle conflicts under different factors, including safety indicators, road width, and front-vehicle factors, were explored and are shown in Tab. 6.
(1) 1.5 m: When the vehicle in front was a motor vehicle, the value of the solid line was not obvious. It was common for motor vehicles to invade the bicycle lane and for cyclists to enter the motor vehicle lane because of the need for overtaking. Red pavement has greater visibility, so its effect was more obvious. However, it was observed that the value of a safety index was in the following order,
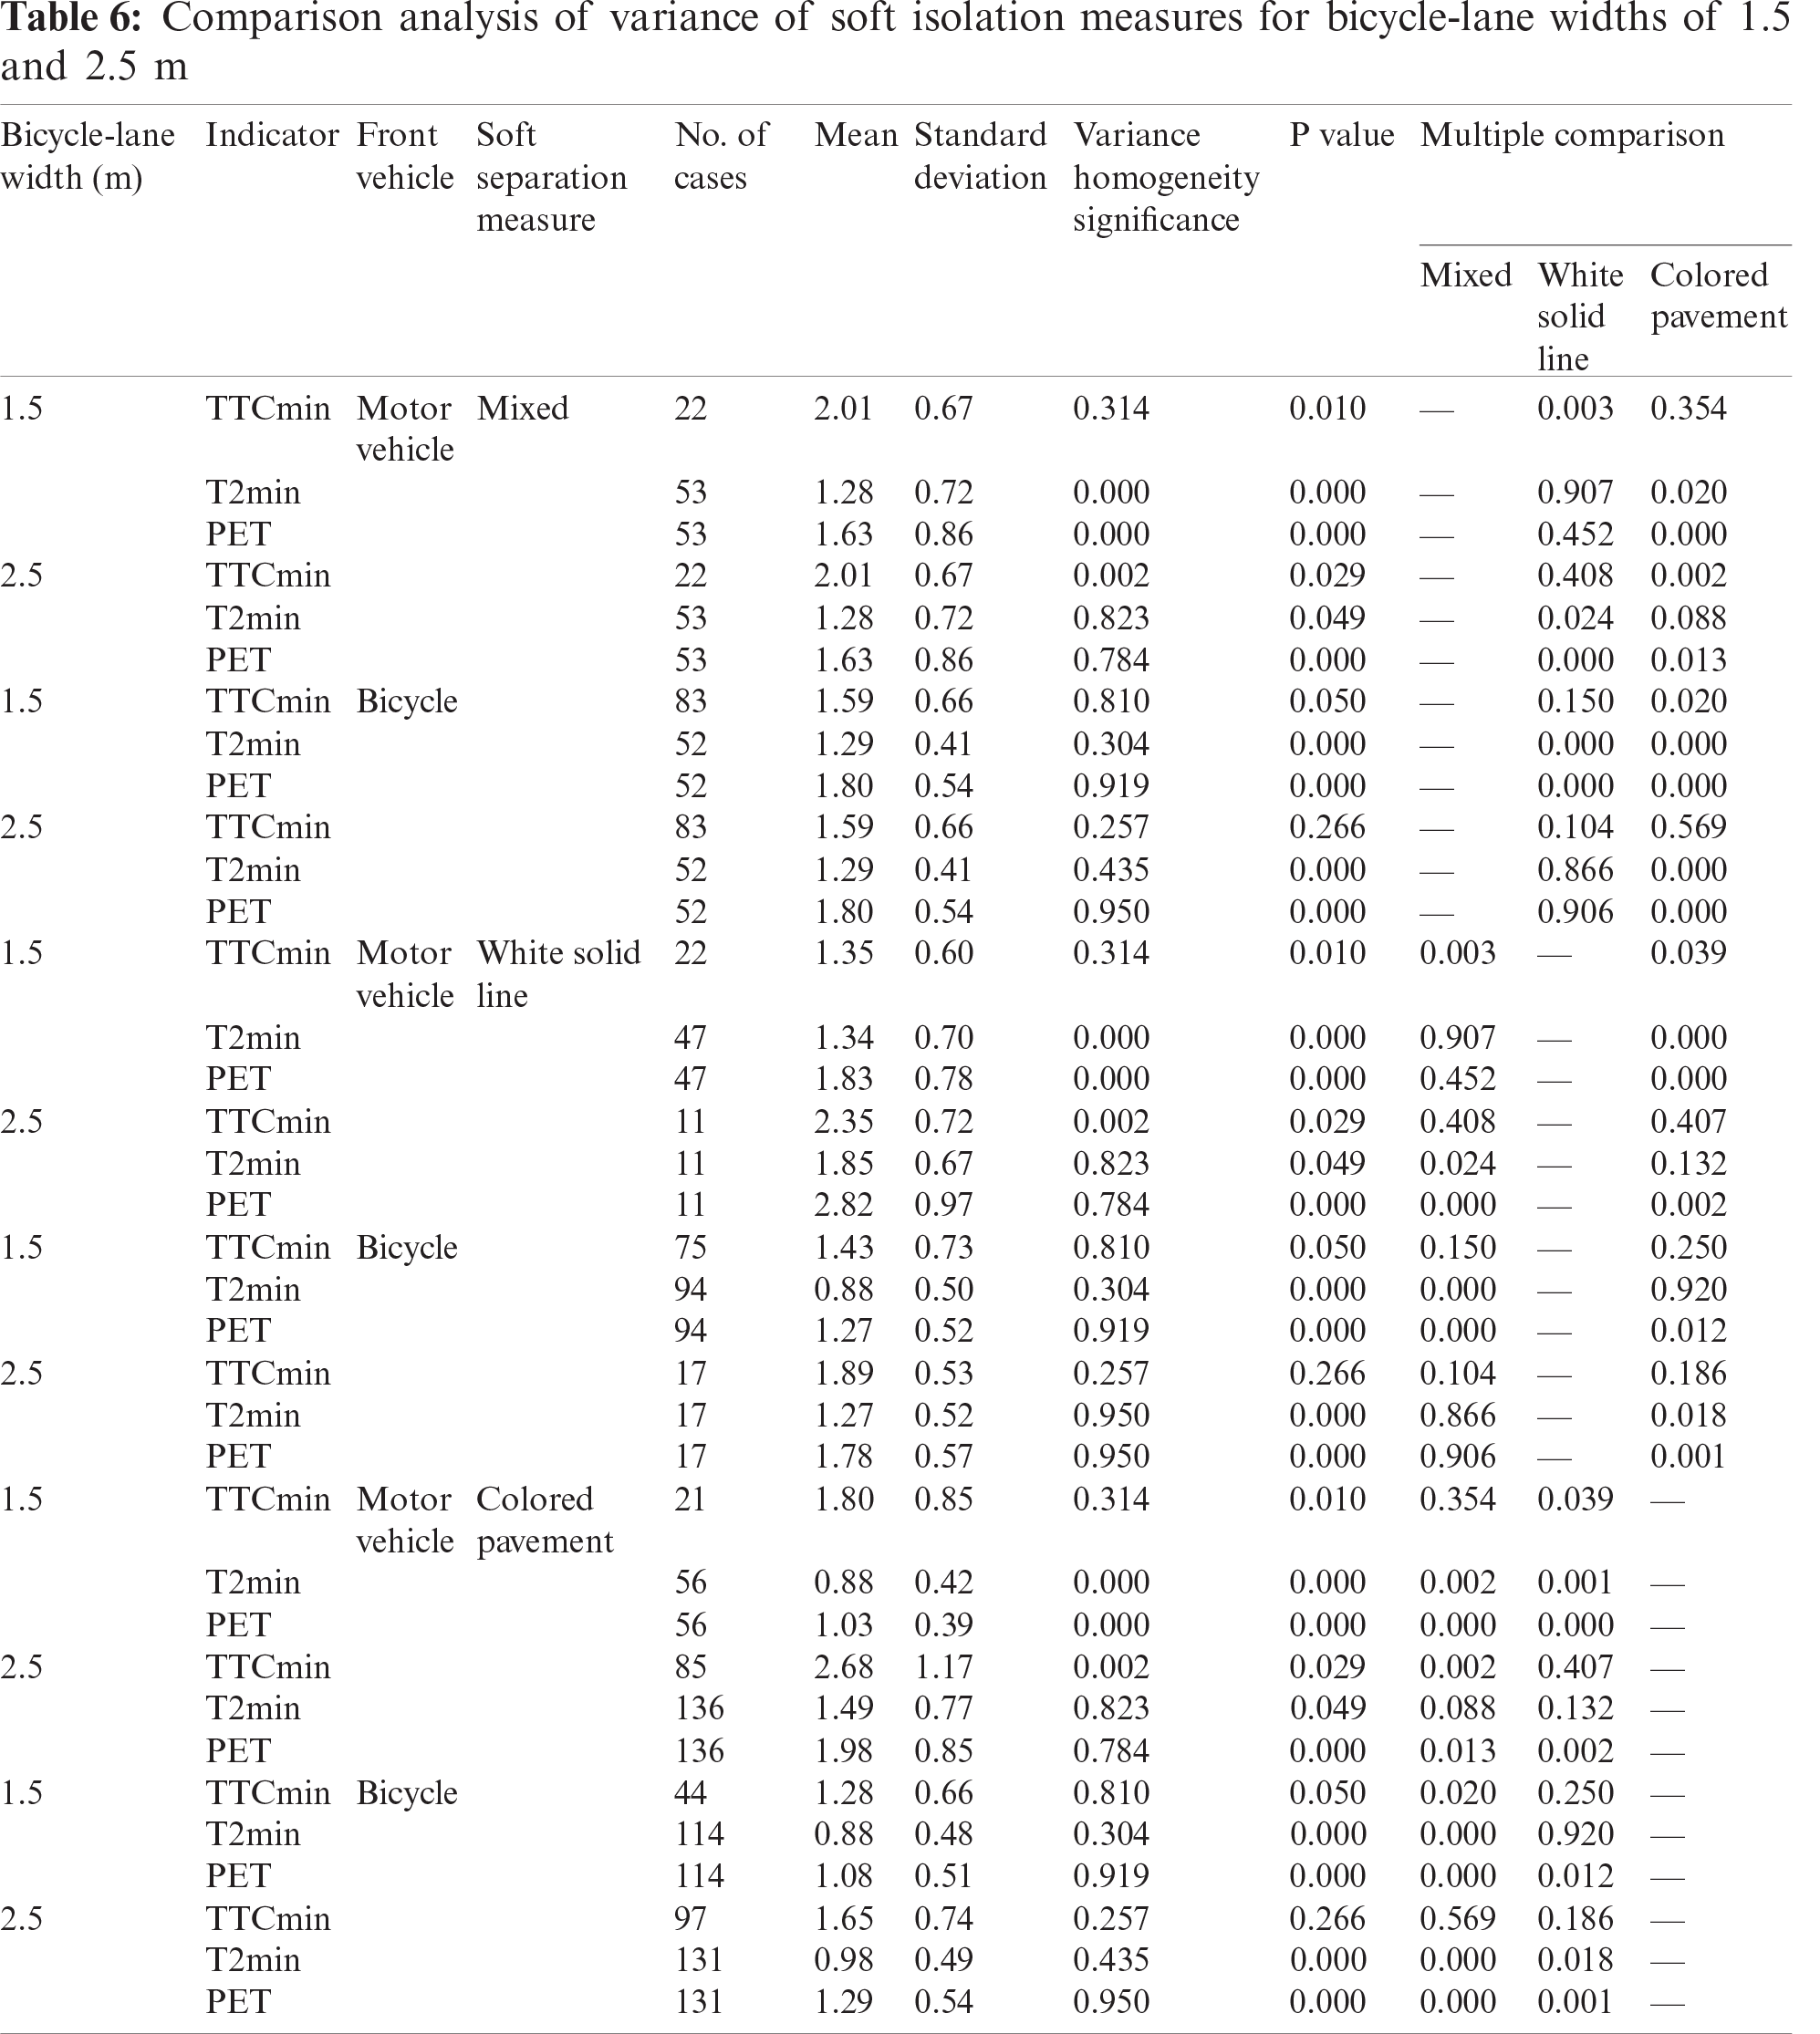
(2) 2.5 m: In the case of motor vehicles in the front, the safety index of setting up special lanes for non-motor vehicles was significantly better than that of mixed traffic, and especially a colored paved road had obvious advantages. Moreover, the increase in the horizontal distance between the motor vehicle and bicycle reduced the angle of the vehicle-bicycle track, which resulted in increased driving distance. When the bicycle was in the front, there was no significant difference because the bicycle lane was wider, so the motor vehicle could go its own way, and the bicycle had a smaller speed limit compared to the motor vehicle. Although it was not reflected in the indicator, this was actually better safety performance. It was also found that wider bicycle lanes did lead to higher vehicle-bicycle speeds with decreased vigilance, which could create potential safety hazards.
In this work, the traffic characteristics of eight typical vehicle–bicycle conflicts were analyzed and summarized, dividing the causes of vehicle–bicycle conflict into 18 factors in three dimensions. The internal connection between vehicle–bicycle conflict forming and two design factors, bicycle-lane width and the vehicle–bicycle separation method, was discussed. The following conclusions were drawn.
(1) The effect of colored pavement on bicycle lanes is better in improving safety, and 1.5-m-wide colored pavement performs better than a 2.5-m-wide bicycle lane alone. However, colored pavement was not suitable for the entire road, so its use should be focused on the sections near intersections, especially when the trajectories of bicycles and motor vehicles overlap.
(2) A 2.5-m-wide bicycle lane provides good safety.
(3) Shortcomings in existing surrogate safety indicators still exist. For example, many indicators measured under mixed traffic conditions were higher than when there were bicycle lanes. This was not a manifestation of safety, but is a cautious measure taken by traffic participants when they felt uncomfortable, which led to reducing the traffic capacity of the intersection.
(4) It is sometimes necessary to balance traffic capacity and safety. If traffic rules can be well implemented, vehicle-bicycle mixed traffic is also a solution that can be considered when intersection space is extremely tight.
Acknowledgement: The author thanks the Central South University of Forestry & Technology, Changsha, Hunan, China, and the Provincial Social Science Fund of Hunan for support. We thank Accdon (https://www.accdon.com) for its linguistic assistance during the preparation of this manuscript.
Funding Statement: This work was supported in part by the Ministry of Education of the People’s Republic of China Project of Humanities and Social Sciences under Grant No. 19YJCZH208, author X. X, http://www.moe.gov.cn/; in part by the Philosophy and Social Science Foundation Project of Hunan Province under Grant No. 15YBA406, author X. X, http://www.hnsk.gov.cn/; in part by the Social Science Evaluation Committee Project of Hunan Province under Grant No. XSP18YBZ125, author X. X, http://www.hnsk.gov.cn/; in part by the Social Sciences Federation Think Tank Project of Hunan Province under Grant No. ZK2019025, author X. X, http://www.hnsk.gov.cn/; in part by the Education Bureau Research Foundation Project of Hunan Province under Grant No. 20A531, author X. X, http://jyt.hunan.gov.cn/; and in part by the Science and Technology Project of Changsha City, under Grant No. kq2004092, author X. X, http://kjj.changsha.gov.cn/.
Conflicts of Interest: We declare that the authors have no conflicts of interest to report regarding the present study.
1. P. Qi, Our Country’s Bicycle Society has Nearly 400 Million Bicycles and Ranking First in the World. Beijing, China: Xinhua News Agency, 2019. [Online]. Available: http://www.gov.cn/xinwen/2019-11/22/content5454-675.htm. [Google Scholar]
2. T. S. Buch and S. U. Jensen, “Incidents between straight-ahead cyclists and right-turning motor vehicles at signalised junctions,” Accident Analysis & Prevention, vol. 105, no. 8, pp. 44–51, 2017. [Google Scholar]
3. S. Luan, M. Li, X. Li and X. Ma, “Effects of built environment on bicycle wrong way riding behavior: A data-driven approach,” Accident Analysis & Prevention, vol. 144, no. 9, pp. 105613, 2020. [Google Scholar]
4. S. Li, “Research on the miscroscopic behavior models of vehicle, bicycle, pedestrian, and their interactive interferences at the signalized plane intersection,” Ph.D. dissertation, University of Beijing, Jiaotong, Beijing, 2013. [Google Scholar]
5. Q. Liu, J. Sun, Y. Tian and Y. Ni, “Modeling and simulation of cross-line overtaking behavior of non-motorized vehicles at mixed flow road section,” Journal of Tongji University (Natural Science), vol. 47, no. 11, pp. 1585–1592, 99, 2019. [Google Scholar]
6. K. H. Chuang, C. C. Hsu, C. H. Lai, J. H. Doong and M. C. Jeng, “The use of a quasi-naturalistic riding method to investigate bicyclists’ behaviors when motorists pass,” Accident Analysis & Prevention, vol. 56, no. 7, pp. 32–41, 2013. [Google Scholar]
7. Z. Li, W. Wang, P. Liu and J. Bigham, “Modeling bicycle passing maneuvers on multilane separated bicycle paths,” Journal of Transportation Engineering, vol. 139, no. 1, pp. 57–64, 2013. [Google Scholar]
8. X. Chen, H. Han and B. Lin, “Developing bicycle equivalents for mopeds in Shanghai, China,” Transportation Research Board, vol. 2317, no. 1, pp. 60–67, 2012. [Google Scholar]
9. C. Xu, Q. Li, Z. Qu and P. Tao, “Modeling of speed distribution for mixed bicycle traffic flow,” Advances in Mechanical Engineering, vol. 7, no. 11, pp. 1–9, 2015. [Google Scholar]
10. X. Chen, L. Yue and H. Han, “Overtaking disturbance on a moped-bicycle-shared bicycle path and corresponding new bicycle path design principles,” Journal of Transportation Engineering Part A: Systems, vol. 144, no. 9, pp. 1–11, 2018. [Google Scholar]
11. C. A. Mulvaney, S. Smith, M. C. Watson, J. Parkin, C. Coupland et al., “Cycling infrastructure for reducing cycling injuries in cyclists,” Cochrane Database of Systematic Reviews, vol. 12, no. 12, pp. 1–12, 2015. [Google Scholar]
12. J. Digioia, K. E. Watkins, Y. Xu, M. Rodgers and R. Guensler, “Safety impacts of bicycle infrastructure: A critical review,” Journal of Safety Research, vol. 61, no. 6, pp. 105–119, 2017. [Google Scholar]
13. Q. Zhou, M. Sheng, X. Wang and J. Chen, “A survey on electric bicycles in pudong district of Shanghai,” Auto and Safety, vol. 12, no. 6, pp. 88–99, 2019. [Google Scholar]
14. X. Yan, T. Wang, X. Ye and J. Chen, “Recommended widths for separated bicycle lanes considering abreast riding and overtaking,” Sustainability, vol. 10, no. 9, pp. 1–16, 2018. [Google Scholar]
15. T. Rossettia, C. A. Guevara, P. Galilea and R. Hurtubia, “Modeling safety as a perceptual latent variable to assess cycling infrastructure,” Transportation Research Part A: Policy and Practice, vol. 111, no. 5, pp. 252–265, 2018. [Google Scholar]
16. P. Vera-Villarroel, D. Contreras, S. Lillo, C. Beyle, A. Segovia et al., “Perception of safety and liking associated to the colour intervention of bike lanes: Contribution from the behavioural sciences to urban design and wellbeing,” Plos One, vol. 11, no. 8, pp. 1–15, 2016. [Google Scholar]
17. D. Yang, X. Zhou, D. Wu and S. Liu, “Study on the invasion behavior of e-bikes with motor vehicle traffic at a signalized intersection,” Transportation Research Record, vol. 2672, no. 31, pp. 33–40, 2018. [Google Scholar]
18. C. Johnsson, A. Laureshyn and T. D. Ceunynck, “In search of surrogate safety indicators for vulnerable road users: A review of surrogate safety indicators,” Transport Reviews, vol. 38, no. 6, pp. 765–785, 2018. [Google Scholar]
19. W. V. Haperen, S. Daniels, T. D. Ceunynck, N. Saunier and T. Brijs, “Yielding behavior and traffic conflicts at cyclist crossing facilities on channelized right-turn lanes,” Transportation Research Part F: Traffic Psychology and Behaviour, vol. 55, no. 5, pp. 272–281, 2018. [Google Scholar]
20. Y. Guo, T. Sayed and M. H. Zaki, “Evaluating the safety impacts of powered two wheelers on a shared roadway in China using automated video analysis,” Journal of Transportation Safety & Security, vol. 11, no. 4, pp. 414–429, 2018. [Google Scholar]
21. M. Essa and T. Sayed, “Traffic conflict models to evaluate the safety of signalized intersections at the cycle-level,” Transportation Research Part C: Emerging Technologies, vol. 89, no. 4, pp. 289–302, 2018. [Google Scholar]
22. Y. Ma, S. Qi and H. Wu, “Traffic conflict identification model based on post encroachment time algorithm in ramp merging area,” Journal of Transportation Systems Engineering and Information Technology, vol. 18, no. 2, pp. 142–148, 2018. [Google Scholar]
23. A. Laureshyn, T. D. Ceunynck, C. Karlsson, A. Svensson and S. Daniels, “In search of the severity dimension of traffic events extended delta-v as a traffic conflict indicator,” Accident Analysis & Prevention, vol. 98, no. 6, pp. 46–56, 2017. [Google Scholar]
24. R. O. Phillips, T. Bjørnskau, R. Hagman and F. Sagberg, “Reduction in car-bicycle conflict at a road-cycle path intersection: Evidence of road user adaptation?,” Transportation Research Part F: Traffic Psychology and Behaviour, vol. 14, no. 2, pp. 87–95, 2011. [Google Scholar]
25. W. Song, J. Yu, X. Zhao and A. Wang, “Research on action recognition and content analysis in videos based on dnn and mln,” Computers, Materials & Continua, vol. 61, no. 3, pp. 1189–1204, 2019. [Google Scholar]
26. Y. Luo, J. Qin, X. Xiang and Y. Tan, “Coverless image steganography based on multi-object recognition,” IEEE Transactions on Circuits and Systems for Video Technology, no. 99, pp. 1, 2021. [Google Scholar]
27. B. Hu, H. Zhao, Y. Yang, B. Zhou and A. Noel, “Multiple faces tracking using feature fusion and neural network in video,” Intelligent Automation & Soft Computing, vol. 26, no. 6, pp. 1549–1560, 2020. [Google Scholar]
28. J. Liu, B. Zhang, X. Cheng, Y. Chen and L. Zhao, “An adaptive superpixel tracker using multiple features,” Computers, Materials & Continua, vol. 60, no. 3, pp. 1097–1108, 2019. [Google Scholar]
29. M. B. Nejad and M. E. Shir, “A new enhanced learning approach to automatic image classification based on salp swarm algorithm,” Computer Systems Science and Engineering, vol. 34, no. 2, pp. 91–100, 2019. [Google Scholar]
30. T. Zhou, B. Xiao, Z. Cai and M. Xu, “A utility model for photo selection in mobile crowdsensing,” IEEE Transactions on Mobile Computingy, vol. 20, no. 1, pp. 1536–1233, 2020. [Google Scholar]
31. C. Johnsson, H. Norén and A. Laureshyn, T-Analyst V_8.01. Scanner, Sweden: Lund University, 2018. [Online]. Available: https://bitbucket.org/TrafficAndRoads/tanalyst/src. [Google Scholar]
32. Y. Guo, T. Sayed, P. Eng and M. H. Zaki, “Exploring evasive action-based indicators for PTW conflicts in shared traffic facility environments,” Journal of Transportation Engineering, Part A: Systems, vol. 144, no. 11, pp. 1–10, 2018. [Google Scholar]
 | This work is licensed under a Creative Commons Attribution 4.0 International License, which permits unrestricted use, distribution, and reproduction in any medium, provided the original work is properly cited. |